Embed Size (px)
Citation preview

Emkay Research is also available on www.emkayglobal.com and Bloomberg EMKAY<GO>. Please refer to the last page of the report on Restrictions on Distribution. In Singapore, this research report or research analyses may only be distributed to Institutional Investors, Expert Investors or Accredited Investors as defined in the Securities and Futures Act, Chapter 289 of Singapore.
©
Your success is our success
Emkay
India Equity Research | Real Estate
November 29, 2021
Company Update
Macrotech Developers Refer to important disclosures at the end of this report
Operating scale resetting higher
We believe Macrotech’s scale of operations is geared for a reset following the sooner-
than-anticipated Rs40bn capital raise. Over the next 12-18 months, the developer plans
to deploy a majority of the capital in joint development agreements (JDAs) amounting to
Rs400bn in gross development value (GDV). This implies a quarterly GDV run rate of
Rs60-65bn of new JDAs vs. the previously envisaged run rate of Rs20-30bn per quarter.
Going deep into new micro markets remains the core strategy. Macrotech enjoys a
leadership position in its existing micro-markets with a ~15-30% market share. It aims to
replicate a similar market share performance in new markets. In our view, a faster
turnaround in terms of both launches and absorption of recently signed JDAs supports the
company’s market share ambitions. Notably, the sales-to-launch ratio in Pune/Kandivali
has been in the range of 15-60% in 3-4 months after a soft launch.
We raise our Dec’22 TP to Rs1,600 (vs. Rs1,250 previously), valuing the development
NAV at ~Rs1,000 per share and a development NAV premium of Rs600 per share. Key
factors driving our TP change include: 1) annual JDA assumption of ~Rs160bn through
FY23 to FY27 vs. Rs110bn earlier; adding Rs74 per share to NAV; and 2) development
NAV premium of 60% (vs. 35%) arrived by using our proprietary NAV premium framework.
Relative price chart
Source: Bloomberg This report is solely produced by Emkay Global. The following person(s) are responsible for the production of the recommendation:
Rahul Jain
+91 22 6624 2413
Ayush Bansal
+91 22 6612 1344
-10
22
54
86
118
150
450
650
850
1050
1250
1450
Apr-21 May-21 Jun-21 Aug-21Sep-21 Oct-21 Nov-21
%Rs
Macrotech Developers (LHS) Rel to Nifty (RHS)
Operating scale geared for a reset: Since listing in Apr’21, Macrotech has already signed
~4msf of JDAs amounting to Rs46bn as of H1FY22. The listing was followed by a Rs40bn
capital raise, which in our view is largely growth capital as we believe Macrotech’s large
fast-churning ready inventory and receivables amounting to >Rs200bn are sufficient to
address the company’s deleveraging exercise and growth opportunities in the existing
portfolio. The developer plans on deploying the capital over the next 12-18 months in JDAs
amounting to Rs400bn in GDV, implying a quarterly GDV run rate of Rs60-65bn of new
JDAs vs. previously envisaged at Rs20-30bn per quarter. As of H1FY22, we note that the
company already has proposals worth Rs70-100bn lined up for H2FY22. We forecast
Macrotech achieving sales targets of Rs140bn/Rs200bn well ahead of its guidance for
FY24/FY26.
The TP increase factors in the higher scale in existing markets and the expansion
into new cities. We raise our annual JDA assumption to ~Rs160bn through FY23 to FY27
from Rs110bn, adding Rs74 per share to NAV. We now also build Bangalore in our JDA
assumption with a cumulative market share of ~2% through FY23-FY27. Overall, the
blended market share (basis market size in msf) for Macrotech in the three markets (MMR,
Pune, Bangalore) is estimated to be ~6.5% for FY23-FY27. For our NAV premium
framework (forecast starting FY28), we also include Noida in our assumption with a
blended market share of 10% across four markets vs. 8.8% previously for MMR+Pune.
CMP Target Price
Rs 1,359 Rs 1,600 (▲) as of (November 29, 2021) 12 months
Rating Upside
BUY (■) 17.7 %
Change in Estimates
EPS Chg FY22E/FY23E (%) (8.7)/1.1
Target Price change (%) 28
Target Period (Months) 12
Previous Reco BUY
Emkay vs Consensus
EPS Estimates
FY22E FY23E
Emkay 19.0 27.3
Consensus 24.2 33.4
Mean Consensus TP (12M) Rs 1,241
Stock Details
Bloomberg Code LODHA IN
Face Value (Rs) 10
Shares outstanding (mn) 447
52 Week H/L 1,482 / 421
M Cap (Rs bn/USD bn) 608 / 8.12
Daily Avg Volume (nos.) 521,222
Daily Avg Turnover (US$ mn) 7.9
Shareholding Pattern Sep '21
Promoters 88.5%
FIIs 8.7%
DIIs 1.1%
Public and Others 1.7%
Price Performance
(%) 1M 3M 6M 12M
Absolute 28 57 117 -
Rel. to Nifty 38 53 95 -
Financial Snapshot (Consolidated)
(Rs bn) FY20 FY21 FY22E FY23E FY24E
Sales (including JDAs) 65.7 59.7 114.9 156.4 209.7
Revenues (recognized) 124.4 54.5 80.9 88.2 94.2
EPS (Rs) 18.4 12.7 19.0 27.3 35.7
ROE (%) 17.3 11.0 11.0 10.4 12.1
Net Debt/Equity (x) 4.00 3.89 0.68 0.48 0.18
P/BV (x) 11.8 11.7 5.5 4.9 4.4
FCFE yield (%) 1.1% 1.2% 4.7% 2.6% 5.4%
Source: Company, Emkay Research
This report is intended for [email protected] use and downloaded at 12/01/2021 03:44 PM
This report is intended for [email protected] use and downloaded at 12/01/2021 03:44 PM

Macrotech Developers (LODHA IN) India Equity Research | Company Update
Emkay Research is also available on www.emkayglobal.com and Bloomberg EMKAY<GO>. Please refer to the last page of the report on Restrictions on Distribution. In Singapore, this research report or research analyses may only be distributed to Institutional Investors, Expert Investors or Accredited Investors as defined in the Securities and Futures Act, Chapter 289 of Singapore.
November 29, 2021 | 2
Higher operating scale and new market entry driving TP change
We believe Macrotech’s scale of operations is geared for a reset following the sooner-than-
anticipated Rs40bn capital raise. The developer expects to deploy a majority of the capital over
the next 12-18 months in JDAs amounting to Rs400bn in GDV. This implies a quarterly GDV run
rate of Rs60-65bn (equating to 5.5-6msf @ blended average price of Rs11k /sf) of new JDAs vs.
previously envisaged at Rs20-30bn per quarter. We note that the developer already has a JDA
pipeline (in GDV) of Rs70-100bn in H2FY22 vs. Rs46bn signed in H1FY22.
We increase our annual JDA assumption to ~Rs160bn through FY23 to FY27 from Rs110bn
previously, adding Rs74 per share to NAV. Given that Macrotech is also exploring opportunities
in Bangalore, we are now including Bangalore in our JDA assumption with a cumulative market
share of ~2% through FY23-FY27. Overall, the blended market share (basis market size in msf)
for Macrotech in the three markets (MMR, Pune, Bangalore) is estimated to be ~6.5% for FY23-
FY27.
Exhibit 1: JDA assumptions (FY23 onward)
New Old change %
Annual area (in msf) 14.5 8.0 81%
Blended average starting price / sf (Rs) 11,000 14,000 -21%
Annual price inflation 4% 3%
Annual GDV (in Rs mn) 159,500 112,000 42%
Volume market mix
MMR 68% 65%
Pune 24% 35%
Bangalore 8% 0%
GAV (in Rs mn) 87,043 51,684 68%
Source: Emkay Research
Exhibit 2: JDAs signed by Macrotech in H1FY22
Micro-market Saleable Area
(msf)
Est. GDV (Rs
mn)
Lodha's Commercial
interest
Est.
Launch
MMR - Western Suburbs 1.2 15,000 Attributable PBT at 20%
of GDV H2FY22
Pune 1.5 10,000 67.5% of Revenue Q2FY22
MMR - Western Suburbs 0.4 6,000 Attributable PBT at 20%
of GDV H2FY22
MMR - Eastern Suburbs 0.3 4,500 Attributable PBT at 18%
of GDV H2FY22
MMR - Eastern Suburbs (signed
during Q2) 0.6 10,500 69% of Revenue Q2FY22
Total 4.0 46,000
Source: Company, Emkay Research
Development NAV premium increased to 60% from 35%
Our development NAV premium framework now builds in a blended market share of 12.5% in
MMR + Pune vs. 8.8% previously. We also factor in a 5% market share each in Bangalore and
Noida. This translates into annual sales/execution of 26msf and a blended market share across
all four markets of 10%.
We also raise our terminal growth assumption to 4% vs. 3%, capturing Macrotech’s ability to
increase penetration in markets of presence and in line with its strategy of capturing a 15-20%
market share. The 1pps increase factors market share in Pune, Bangalore and Noida increasing
by 2pps, 5pps and 5pps respectively between FY28 and FY34. Our forecasts assume each
market would see expansion (by sales value) at a 3.0% CAGR, driven by price alone. Thus, any
additional expansion driven by an increase in market volumes (msf) would imply upside risk to
our terminal growth assumption. This report is intended for [email protected] use and downloaded at 12/01/2021 03:44 PM

Macrotech Developers (LODHA IN) India Equity Research | Company Update
Emkay Research is also available on www.emkayglobal.com and Bloomberg EMKAY<GO>. Please refer to the last page of the report on Restrictions on Distribution. In Singapore, this research report or research analyses may only be distributed to Institutional Investors, Expert Investors or Accredited Investors as defined in the Securities and Futures Act, Chapter 289 of Singapore.
November 29, 2021 | 3
Key upside risks to our estimates include higher average pricing, existing market size
expansion and forays into new cities. We note that the developer has received proposals from
across geographies, including Hyderabad and Kolkata, where other regional players are also
looking to expand. We believe the expansion into new markets will be key to achieving
management’s vision of executing 50,000 homes annually by the end of this decade.
Exhibit 3: NAV Premium (old vs. new)
Rs mn, unless otherwise stated Old New
Market and project assumptions
Markets for continuing business MMR, Pune MMR, Pune, Bangalore, Noida
Starting Year (Yr-1) FY28 FY28
Recurring project size (msf) 90.0 156.0
Project cycle (years) 6 6
Annual sales or delivery (msf) 15.0 26.0
Estimated market size (msf) [a] 170 260
Implied market share (%) 8.8% 10.0%
Average value share in core market (%) 6.6% 6.6%
Continuing business valuation
Average price in Yr-1 (Rs/sf) 14,000 12,500
Revenue share paid (toward land) 32% 32%
Land cost
Construction & SG&A costs 50% 50%
OCF margin (after contruction, land and SG&A cost) 18% 18%
Levelized post-tax FCF 19,332 32,481
WACC % 11.0% 11.0%
Terminal growth of LFCF % 3.0% 4.0%
Value of continuing business [CB] [A] 139,716 268,276
CB value in Rs/share 312 558
Annual average sales / delivery implict in NAV (msf) [b] 13.0 15.0
Development NAV (Dec'22E) [B] 409,836 481,457
Implied premium to NAV [A] / [B] 34% 56%
Actual NAV premium in Dec'22 TP 35% 60%
Note: [a] Roughly amounting to last three-year average market size; [b] ex-inventory sales and average for FY23E-FY26E
Source: Emkay Research
Exhibit 4: Key senior management hiring to support expansion strategy
Segment Name Designation Background
‘For Sale' business Rajib Das CEO – Eastern Suburbs & Navi
Mumbai Ex-Godrej Properties
Offices & Retail (for
Rent)
Joanna
DeSouza Business Head – Leasing
Ex-Bennett Property
Holdings
Digital Infrastructure
Park Veeresh Rao Technical Head Ex-Allcargo
Source: Company, Emkay Research
Exhibit 5: Surplus cash flow (as of Q2FY22) to aid deleveraging exercise
Source: Company, Emkay Research
68
136
52
38 -60
235
-
100
200
300
RTMI Inventory Unsold OngoingInventory
PendingCollections
Surplus from'Offices & Retail
for Rent'
Pending Constr.Costs
Total surplus
This report is intended for [email protected] use and downloaded at 12/01/2021 03:44 PM
Macrotech Developers (LODHA IN) India Equity Research | Company Update
Emkay Research is also available on www.emkayglobal.com and Bloomberg EMKAY<GO>. Please refer to the last page of the report on Restrictions on Distribution. In Singapore, this research report or research analyses may only be distributed to Institutional Investors, Expert Investors or Accredited Investors as defined in the Securities and Futures Act, Chapter 289 of Singapore.
November 29, 2021 | 4
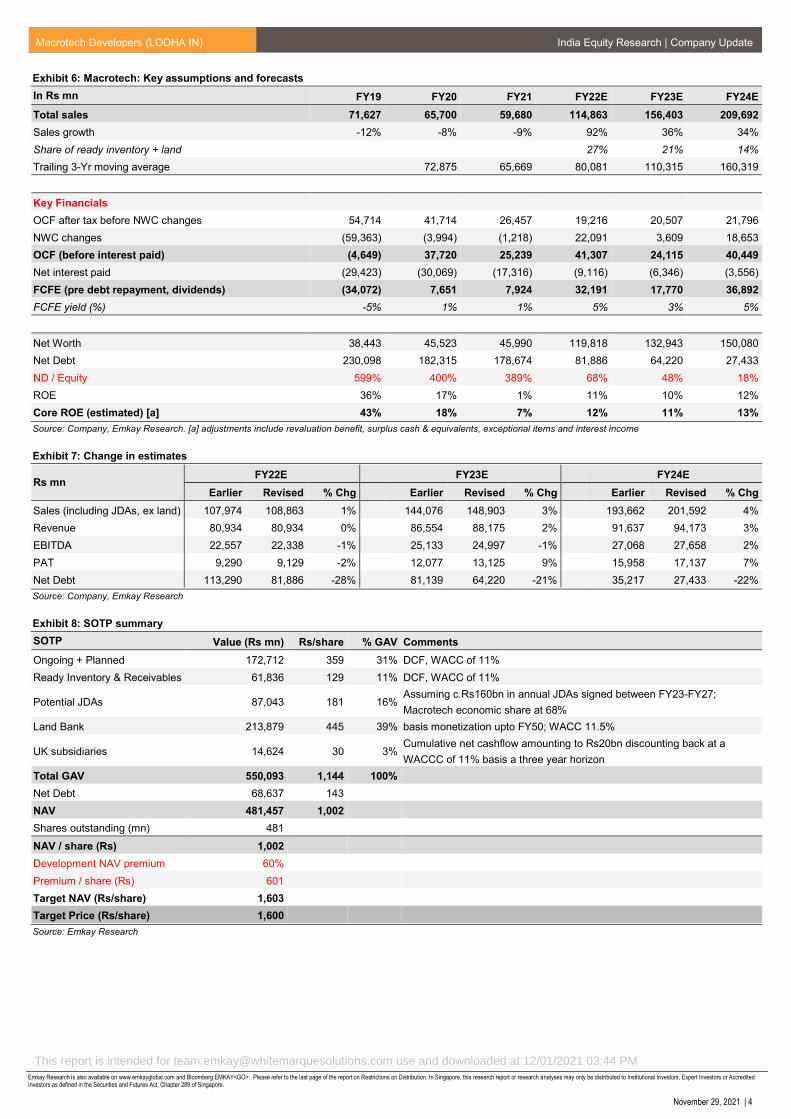
Exhibit 6: Macrotech: Key assumptions and forecasts
In Rs mn FY19 FY20 FY21 FY22E FY23E FY24E
Total sales 71,627 65,700 59,680 114,863 156,403 209,692
Sales growth -12% -8% -9% 92% 36% 34%
Share of ready inventory + land 27% 21% 14%
Trailing 3-Yr moving average 72,875 65,669 80,081 110,315 160,319
Key Financials
OCF after tax before NWC changes 54,714 41,714 26,457 19,216 20,507 21,796
NWC changes (59,363) (3,994) (1,218) 22,091 3,609 18,653
OCF (before interest paid) (4,649) 37,720 25,239 41,307 24,115 40,449
Net interest paid (29,423) (30,069) (17,316) (9,116) (6,346) (3,556)
FCFE (pre debt repayment, dividends) (34,072) 7,651 7,924 32,191 17,770 36,892
FCFE yield (%) -5% 1% 1% 5% 3% 5%
Net Worth 38,443 45,523 45,990 119,818 132,943 150,080
Net Debt 230,098 182,315 178,674 81,886 64,220 27,433
ND / Equity 599% 400% 389% 68% 48% 18%
ROE 36% 17% 1% 11% 10% 12%
Core ROE (estimated) [a] 43% 18% 7% 12% 11% 13%
Source: Company, Emkay Research. [a] adjustments include revaluation benefit, surplus cash & equivalents, exceptional items and interest income
Exhibit 7: Change in estimates
Rs mn FY22E FY23E FY24E
Earlier Revised % Chg Earlier Revised % Chg Earlier Revised % Chg
Sales (including JDAs, ex land) 107,974 108,863 1% 144,076 148,903 3% 193,662 201,592 4%
Revenue 80,934 80,934 0% 86,554 88,175 2% 91,637 94,173 3%
EBITDA 22,557 22,338 -1% 25,133 24,997 -1% 27,068 27,658 2%
PAT 9,290 9,129 -2% 12,077 13,125 9% 15,958 17,137 7%
Net Debt 113,290 81,886 -28% 81,139 64,220 -21% 35,217 27,433 -22%
Source: Company, Emkay Research
Exhibit 8: SOTP summary
SOTP Value (Rs mn) Rs/share % GAV Comments
Ongoing + Planned 172,712 359 31% DCF, WACC of 11%
Ready Inventory & Receivables 61,836 129 11% DCF, WACC of 11%
Potential JDAs 87,043 181 16% Assuming c.Rs160bn in annual JDAs signed between FY23-FY27;
Macrotech economic share at 68%
Land Bank 213,879 445 39% basis monetization upto FY50; WACC 11.5%
UK subsidiaries 14,624 30 3% Cumulative net cashflow amounting to Rs20bn discounting back at a
WACCC of 11% basis a three year horizon
Total GAV 550,093 1,144 100%
Net Debt 68,637 143
NAV 481,457 1,002
Shares outstanding (mn) 481
NAV / share (Rs) 1,002
Development NAV premium 60%
Premium / share (Rs) 601
Target NAV (Rs/share) 1,603
Target Price (Rs/share) 1,600
Source: Emkay Research
This report is intended for [email protected] use and downloaded at 12/01/2021 03:44 PM

Macrotech Developers (LODHA IN) India Equity Research | Company Update
Emkay Research is also available on www.emkayglobal.com and Bloomberg EMKAY<GO>. Please refer to the last page of the report on Restrictions on Distribution. In Singapore, this research report or research analyses may only be distributed to Institutional Investors, Expert Investors or Accredited Investors as defined in the Securities and Futures Act, Chapter 289 of Singapore.
November 29, 2021 | 5
Key Financials (Consolidated)
Income Statement
Y/E Mar (Rs mn) FY20 FY21 FY22E FY23E FY24E
Revenue 124,426 54,486 80,934 88,175 94,173
Expenditure 105,353 40,766 58,596 63,179 66,515
EBITDA 19,073 13,720 22,338 24,997 27,658
Depreciation 2,924 734 830 834 839
EBIT 16,149 12,985 21,508 24,162 26,819
Other Income 1,184 3,231 2,551 2,412 1,319
Interest expenses 7,304 11,257 11,667 8,758 4,875
PBT 10,029 4,959 12,392 17,816 23,263
Tax 2,615 (147) 3,123 4,490 5,862
Extraordinary Items 2 (4,628) 0 0 0
Minority Int./Income from Assoc. 139 77 140 202 263
Reported Net Income 7,276 402 9,129 13,125 17,137
Adjusted PAT 7,274 5,029 9,129 13,125 17,137
Balance Sheet
Y/E Mar (Rs mn) FY20 FY21 FY22E FY23E FY24E
Equity share capital 3,959 3,959 4,807 4,807 4,807
Reserves & surplus 41,564 42,031 115,011 128,136 145,273
Net worth 45,523 45,990 119,818 132,943 150,080
Minority Interest 5,192 5,269 5,409 5,611 5,875
Loan Funds 184,142 181,669 116,669 71,669 36,669
Net deferred tax liability 1 1 1 1 1
Total Liabilities 234,857 232,928 241,897 210,224 192,624
Net block 20,209 19,463 18,736 18,006 17,272
Investment 15,529 15,794 15,075 15,075 15,075
Current Assets 371,124 357,761 383,609 369,469 397,195
Cash & bank balance 1,185 2,276 34,782 7,448 9,236
Other Current Assets 0 0 0 0 0
Current liabilities & Provision 172,069 160,153 175,586 192,388 236,980
Net current assets 199,055 197,608 208,023 177,080 160,215
Misc. exp 0 0 0 0 0
Total Assets 234,857 232,928 241,897 210,224 192,624
Cash Flow
Y/E Mar (Rs mn) FY20 FY21 FY22E FY23E FY24E
PBT (Ex-Other income) (NI+Dep) 8,845 1,729 9,841 15,404 21,944
Other Non-Cash items 0 0 0 0 0
Chg in working cap 40,758 2,538 22,091 3,609 18,653
Operating Cashflow 37,720 25,239 41,307 24,115 40,449
Capital expenditure (1,984) 12 (104) (104) (105)
Free Cash Flow 35,736 25,251 41,203 24,011 40,344
Investments (1,480) (265) 719 0 0
Other Investing Cash Flow 4,397 1,221 0 0 0
Investing Cashflow 2,117 4,199 3,167 2,308 1,214
Equity Capital Raised 0 0 64,700 0 0
Loans Taken / (Repaid) (49,482) (2,473) (65,000) (45,000) (35,000)
Dividend paid (incl tax) 0 0 0 0 0
Other Financing Cash Flow 14,901 (14,621) 0 0 0
Financing Cashflow (41,884) (28,351) (11,967) (53,758) (39,875)
Net chg in cash (2,047) 1,087 32,507 (27,334) 1,788
Opening cash position 3,525 1,185 2,276 34,782 7,448
Closing cash position 1,185 2,276 34,782 7,448 9,236
Source: Company, Emkay Research
This report is intended for [email protected] use and downloaded at 12/01/2021 03:44 PM
Macrotech Developers (LODHA IN) India Equity Research | Company Update
Emkay Research is also available on www.emkayglobal.com and Bloomberg EMKAY<GO>. Please refer to the last page of the report on Restrictions on Distribution. In Singapore, this research report or research analyses may only be distributed to Institutional Investors, Expert Investors or Accredited Investors as defined in the Securities and Futures Act, Chapter 289 of Singapore.
November 29, 2021 | 6
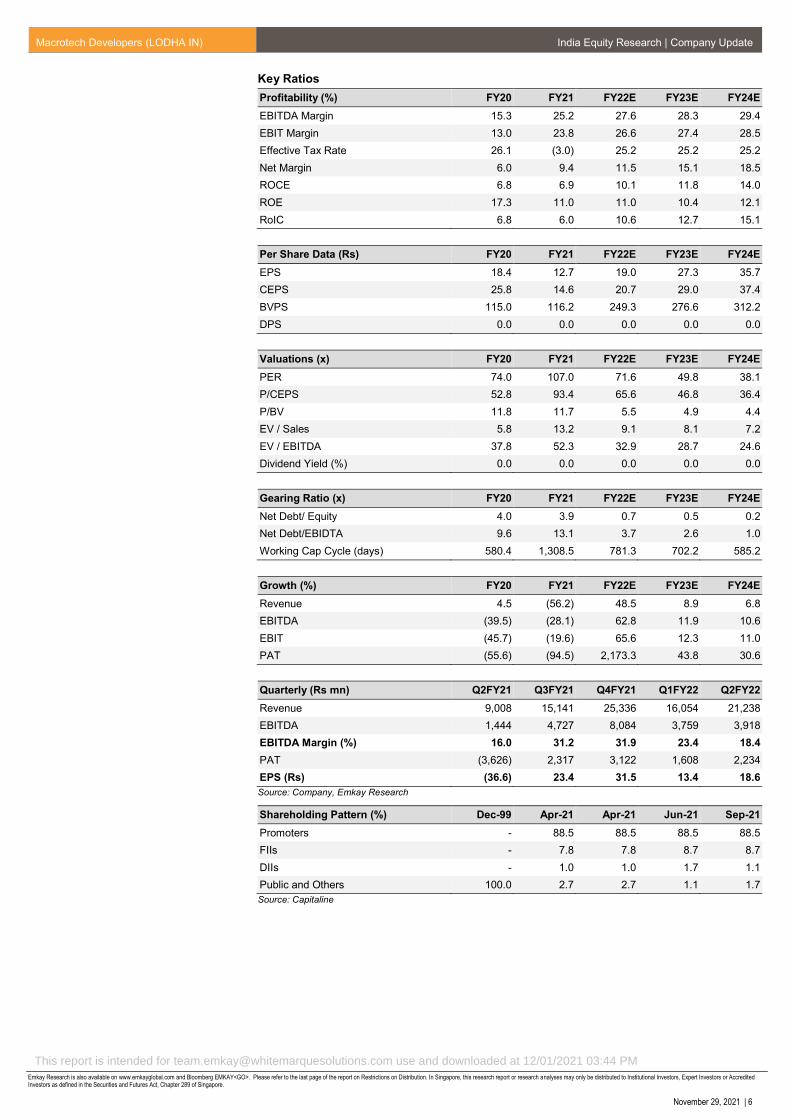
Key Ratios
Profitability (%) FY20 FY21 FY22E FY23E FY24E
EBITDA Margin 15.3 25.2 27.6 28.3 29.4
EBIT Margin 13.0 23.8 26.6 27.4 28.5
Effective Tax Rate 26.1 (3.0) 25.2 25.2 25.2
Net Margin 6.0 9.4 11.5 15.1 18.5
ROCE 6.8 6.9 10.1 11.8 14.0
ROE 17.3 11.0 11.0 10.4 12.1
RoIC 6.8 6.0 10.6 12.7 15.1
Per Share Data (Rs) FY20 FY21 FY22E FY23E FY24E
EPS 18.4 12.7 19.0 27.3 35.7
CEPS 25.8 14.6 20.7 29.0 37.4
BVPS 115.0 116.2 249.3 276.6 312.2
DPS 0.0 0.0 0.0 0.0 0.0
Valuations (x) FY20 FY21 FY22E FY23E FY24E
PER 74.0 107.0 71.6 49.8 38.1
P/CEPS 52.8 93.4 65.6 46.8 36.4
P/BV 11.8 11.7 5.5 4.9 4.4
EV / Sales 5.8 13.2 9.1 8.1 7.2
EV / EBITDA 37.8 52.3 32.9 28.7 24.6
Dividend Yield (%) 0.0 0.0 0.0 0.0 0.0
Gearing Ratio (x) FY20 FY21 FY22E FY23E FY24E
Net Debt/ Equity 4.0 3.9 0.7 0.5 0.2
Net Debt/EBIDTA 9.6 13.1 3.7 2.6 1.0
Working Cap Cycle (days) 580.4 1,308.5 781.3 702.2 585.2
Growth (%) FY20 FY21 FY22E FY23E FY24E
Revenue 4.5 (56.2) 48.5 8.9 6.8
EBITDA (39.5) (28.1) 62.8 11.9 10.6
EBIT (45.7) (19.6) 65.6 12.3 11.0
PAT (55.6) (94.5) 2,173.3 43.8 30.6
Quarterly (Rs mn) Q2FY21 Q3FY21 Q4FY21 Q1FY22 Q2FY22
Revenue 9,008 15,141 25,336 16,054 21,238
EBITDA 1,444 4,727 8,084 3,759 3,918
EBITDA Margin (%) 16.0 31.2 31.9 23.4 18.4
PAT (3,626) 2,317 3,122 1,608 2,234
EPS (Rs) (36.6) 23.4 31.5 13.4 18.6
Source: Company, Emkay Research
Shareholding Pattern (%) Dec-99 Apr-21 Apr-21 Jun-21 Sep-21
Promoters - 88.5 88.5 88.5 88.5
FIIs - 7.8 7.8 8.7 8.7
DIIs - 1.0 1.0 1.7 1.1
Public and Others 100.0 2.7 2.7 1.1 1.7
Source: Capitaline
This report is intended for [email protected] use and downloaded at 12/01/2021 03:44 PM

Macrotech Developers (LODHA IN) India Equity Research | Company Update
Emkay Research is also available on www.emkayglobal.com and Bloomberg EMKAY<GO>. Please refer to the last page of the report on Restrictions on Distribution. In Singapore, this research report or research analyses may only be distributed to Institutional Investors, Expert Investors or Accredited Investors as defined in the Securities and Futures Act, Chapter 289 of Singapore.
November 29, 2021 | 7
RECOMMENDATION HISTORY TABLE
Date Closing
Price TP
Period (months)
Rating Analyst
15-Nov-21 1,285 1,250 12m Buy Rahul Jain
1-Nov-21 1,150 1,250 12m Buy Rahul Jain
Source: Company, Emkay Research
RECOMMENDATION HISTORY CHART
Source: Bloomberg, Company, Emkay Research
460
658
856
1054
1252
1450
17-A
pr-
21
23-M
ay-2
1
28-J
un
-21
3-A
ug
-21
8-S
ep
-21
14-O
ct-
21
19-N
ov-2
1
BUY Hold Sell Accumulate
Reduce Price Target Price
This report is intended for [email protected] use and downloaded at 12/01/2021 03:44 PM

Macrotech Developers (LODHA IN) India Equity Research | Company Update
Emkay Research is also available on www.emkayglobal.com and Bloomberg EMKAY<GO>. Please refer to the last page of the report on Restrictions on Distribution. In Singapore, this research report or research analyses may only be distributed to Institutional Investors, Expert Investors or Accredited Investors as defined in the Securities and Futures Act, Chapter 289 of Singapore.
November 29, 2021 | 8
Emkay Rating Distribution
Ratings Expected Return within the next 12-18 months.
BUY Over 15%
HOLD Between -5% to 15%
SELL Below -5%
Completed Date: 29 Nov 2021 21:45:22 (SGT) Dissemination Date: 29 Nov 2021 21:46:22 (SGT)
Sources for all charts and tables are Emkay Research unless otherwise specified.
GENERAL DISCLOSURE/DISCLAIMER BY EMKAY GLOBAL FINANCIAL SERVICES LIMITED (EGFSL): Emkay Global Financial Services Limited (CIN-L67120MH1995PLC084899) and its affiliates are a full-service, brokerage, investment banking, investment management and financing group. Emkay Global Financial Services Limited (EGFSL) along with its affiliates are participants in virtually all securities trading markets in India. EGFSL was established in 1995 and is one of India's leading brokerage and distribution house. EGFSL is a corporate trading member of Bombay Stock Exchange Limited (BSE), National Stock Exchange of India Limited (NSE), MCX Stock Exchange Limited (MCX-SX). EGFSL along with its subsidiaries offers the most comprehensive avenues for investments and is engaged in the businesses including stock broking (Institutional and retail), merchant banking, commodity broking, depository participant, portfolio management, insurance broking and services rendered in connection with distribution of primary market issues and financial products like mutual funds, fixed deposits. Details of associates are available on our website i.e. www.emkayglobal.com EGFSL is registered as Research Analyst with SEBI bearing registration Number INH000000354 as per SEBI (Research Analysts) Regulations, 2014. EGFSL hereby declares that it has not defaulted with any stock exchange nor its activities were suspended by any stock exchange with whom it is registered in last five years, except that NSE had disabled EGFSL from trading on October 05, October 08 and October 09, 2012 for a manifest error resulting into a bonafide erroneous trade on October 05, 2012. However, SEBI and Stock Exchanges have conducted the routine inspection and based on their observations have issued advice letters or levied minor penalty on EGFSL for certain operational deviations in ordinary/routine course of business. EGFSL has not been debarred from doing business by any Stock Exchange / SEBI or any other authorities; nor has its certificate of registration been cancelled by SEBI at any point of time. EGFSL offers research services to clients as well as prospects. The analyst for this report certifies that all of the views expressed in this report accurately reflect his or her personal views about the subject company or companies and its or their securities, and no part of his or her compensation was, is or will be, directly or indirectly related to specific recommendations or views expressed in this report. Other disclosures by Emkay Global Financial Services Limited (Research Entity) and its Research Analyst under SEBI (Research Analyst) Regulations, 2014 with reference to the subject company(s) covered in this report EGFSL and/or its affiliates may seek investment banking or other business from the company or companies that are the subject of this material. Our salespeople, traders, and other professionals may provide oral or written market commentary or trading strategies to our clients that reflect opinions that are contrary to the opinions expressed herein, and our proprietary trading and investing businesses may make investment decisions that may be inconsistent with the recommendations expressed herein. In reviewing these materials, you should be aware that any or all of the foregoing, among other things, may give rise to real or potential conflicts of interest including but not limited to those stated herein. Additionally, other important information regarding our relationships with the company or companies that are the subject of this material is provided herein. This report is not directed to, or intended for distribution to or use by, any person or entity who is a citizen or resident of or located in any locality, state, country or other jurisdiction where such distribution, publication, availability or use would be contrary to law or regulation or which would subject EGFSL or its group companies to any registration or licensing requirement within such jurisdiction. Specifically, this document does not constitute an offer to or solicitation to any U.S. person for the purchase or sale of any financial instrument or as an official confirmation of any transaction to any U.S. person. Unless otherwise stated, this message should not be construed as official confirmation of any transaction. No part of this document may be used by private customers in United Kingdom. All material presented in this report, unless specifically indicated otherwise, is under copyright to Emkay. None of the material, nor its content, nor any copy of it, may be altered in any way, transmitted to, copied or distributed to any other party, without the prior express written permission of EGFSL . All trademarks, service marks and logos used in this report are trademarks or registered trademarks of EGFSL or its Group Companies. The information contained herein is not intended for publication or distribution or circulation in any manner whatsoever and any unauthorized reading, dissemination, distribution or copying of this communication is prohibited unless otherwise expressly authorized. Please ensure that you have read “Risk Disclosure Document for Capital Market and Derivatives Segments” as prescribed by Securities and Exchange Board of India before investing in Indian Securities Market. In so far as this report includes current or historic information, it is believed to be reliable, although its accuracy and completeness cannot be guaranteed.
This publication has not been reviewed or authorized by any regulatory authority. There is no planned schedule or frequency for updating research publication relating to any issuer.
Please contact the primary analyst for valuation methodologies and assumptions associated with the covered companies or price targets Disclaimer for U.S. persons only: This research report is a product of Emkay Global Financial Services Limited (Emkay), which is the employer of the research analyst(s) who has prepared the research report. The research analyst(s) preparing the research report is/are resident outside the United States (U.S.) and are not associated persons of any U.S. regulated broker-dealer and therefore the analyst(s) is/are not subject to supervision by a U.S. broker-dealer, and is/are not required to satisfy the regulatory licensing requirements of Financial Institutions Regulatory Authority (FINRA) or required to otherwise comply with U.S. rules or regulations regarding, among other things, communications with a subject company, public appearances and trading securities held by a research analyst account. This report is intended for distribution to "Major Institutional Investors" as defined by Rule 15a-6(b)(4) of the U.S. Securities and Exchange Act, 1934 (the Exchange Act) and interpretations thereof by U.S. Securities and Exchange Commission (SEC) in reliance on Rule 15a 6(a)(2). If the recipient of this report is not a Major Institutional Investor as specified above, then it should not act upon this report and return the same to the sender. Further, this report may not be copied, duplicated and/or transmitted onward to any U.S. person, which is not the Major Institutional Investor. In reliance on the exemption from registration provided by Rule 15a-6 of the Exchange Act and interpretations thereof by the SEC in order to conduct certain business with Major Institutional Investors.
This report is intended for [email protected] use and downloaded at 12/01/2021 03:44 PM
Macrotech Developers (LODHA IN) India Equity Research | Company Update
Emkay Research is also available on www.emkayglobal.com and Bloomberg EMKAY<GO>. Please refer to the last page of the report on Restrictions on Distribution. In Singapore, this research report or research analyses may only be distributed to Institutional Investors, Expert Investors or Accredited Investors as defined in the Securities and Futures Act, Chapter 289 of Singapore.
November 29, 2021 | 9
ANALYST CERTIFICATION BY EMKAY GLOBAL FINANCIAL SERVICES LIMITED (EGFSL) The research analyst(s) primarily responsible for the content of this research report, in part or in whole, certifies that the views about the companies and their securities expressed in this report accurately reflect his/her personal views. The analyst(s) also certifies that no part of his/her compensation was, is, or will be, directly or indirectly, related to specific recommendations or views expressed in the report. The research analyst (s) primarily responsible of the content of this research report, in part or in whole, certifies that he or his associate1 does not serve as an officer, director or employee of the issuer or the new listing applicant (which includes in the case of a real estate investment trust, an officer of the management company of the real estate investment trust; and in the case of any other entity, an officer or its equivalent counterparty of the entity who is responsible for the management of the issuer or the new listing applicant). The research analyst(s) primarily responsible for the content of this research report or his associate does not have financial interests2 in relation to an issuer or a new listing applicant that the analyst reviews. EGFSL has procedures in place to eliminate, avoid and manage any potential conflicts of interests that may arise in connection with the production of research reports. The research analyst(s) responsible for this report operates as part of a separate and independent team to the investment banking function of the EGFSL and procedures are in place to ensure that confidential information held by either the research or investment banking function is handled appropriately. There is no direct link of EGFSL compensation to any specific investment banking function of the EGFSL. 1 An associate is defined as (i) the spouse, or any minor child (natural or adopted) or minor step-child, of the analyst; (ii) the trustee of a trust of which the analyst, his spouse, minor child (natural or adopted) or minor step-child, is a beneficiary or discretionary object; or (iii) another person accustomed or obliged to act in accordance with the directions or instructions of the analyst. 2 Financial interest is defined as interest that are commonly known financial interest, such as investment in the securities in respect of an issuer or a new listing applicant, or financial accommodation arrangement between the issuer or the new listing applicant and the firm or analysis. This term does not include commercial lending conducted at the arm’s length, or investments in any collective investment scheme other than an issuer or new listing applicant notwithstanding the fact that the scheme has investments in securities in respect of an issuer or a new listing applicant.
COMPANY-SPECIFIC / REGULATORY DISCLOSURES BY EMKAY GLOBAL FINANCIAL SERVICES LIMITED (EGFSL):
Disclosures by Emkay Global Financial Services Limited (Research Entity) and its Research Analyst under SEBI (Research Analyst) Regulations, 2014 with reference to the subject company(s) covered in this report-: 1. EGFSL, its subsidiaries and/or other affiliates do not have a proprietary position in the securities recommended in this report as of November 29,
2021 2. EGFSL, and/or Research Analyst does not market make in equity securities of the issuer(s) or company(ies) mentioned in this Research Report Disclosure of previous investment recommendation produced: 3. EGFSL may have published other investment recommendations in respect of the same securities / instruments recommended in this research
report during the preceding 12 months. Please contact the primary analyst listed in the first page of this report to view previous investment recommendations published by EGFSL in the preceding 12 months.
4. EGFSL , its subsidiaries and/or other affiliates and Research Analyst or his/her relative’s does not have any material conflict of interest in the securities recommended in this report as of November 29, 2021.
5. EGFSL, its subsidiaries and/or other affiliates and Research Analyst or his/her relative’s does not have actual/beneficial ownership of 1% or more securities of the subject company at the end of the month immediately preceding the November 29, 2021
6. EGFSL, its subsidiaries and/or other affiliates and Research Analyst have not received any compensation in whatever form including compensation for investment banking or merchant banking or brokerage services or for products or services other than investment banking or merchant banking or brokerage services from securities recommended in this report (subject company) in the past 12 months.
7. EGFSL, its subsidiaries and/or other affiliates and/or and Research Analyst have not received any compensation or other benefits from securities recommended in this report (subject company) or third party in connection with the research report.
8. Securities recommended in this report (Subject Company) has not been client of EGFSL, its subsidiaries and/or other affiliates and/or and Research Analyst during twelve months preceding the November 29, 2021
This report is intended for [email protected] use and downloaded at 12/01/2021 03:44 PM
Macrotech Developers (LODHA IN) India Equity Research | Company Update
Emkay Research is also available on www.emkayglobal.com and Bloomberg EMKAY<GO>. Please refer to the last page of the report on Restrictions on Distribution. In Singapore, this research report or research analyses may only be distributed to Institutional Investors, Expert Investors or Accredited Investors as defined in the Securities and Futures Act, Chapter 289 of Singapore.
November 29, 2021| 10
RESTRICTIONS ON DISTRIBUTION
General This report is not directed to, or intended for distribution to or use by, any person or entity who is a citizen or resident of or located in any locality, state, country or other jurisdiction where such distribution, publication, availability or use would be contrary to law or regulation.
Australia This report is not for distribution into Australia.
Hong Kong This report is not for distribution into Hong Kong.
Indonesia This report is being distributed in Indonesia by PT DBS Vickers Sekuritas Indonesia.
Malaysia This report is not for distribution into Malaysia.
Singapore
This report is distributed in Singapore by DBS Bank Ltd (Company Regn. No. 16800306E) or DBSVS (Company Regn. No. 1860024G) both of which are Exempt Financial Advisers as defined in the Financial Advisers Act and regulated by the Monetary Authority of Singapore. DBS Bank Ltd and/or DBSVS, may distribute reports produced by its respective foreign entities, affiliates or other foreign research houses pursuant to an agreement under Regulation 32C of the financial Advisers Regulations. Singapore recipients should contact DBS Bank Ltd at 6327 2288 for matters arising from, or in connection with the report.
Thailand This report is being distributed in Thailand by DBS Vickers Securities (Thailand) Co Ltd.
United Kingdom
This report is disseminated in the United Kingdom by DBS Vickers Securities (UK) Ltd, ("DBSVUK"). DBSVUK is authorised and regulated by the Financial Conduct Authority in the United Kingdom.
In respect of the United Kingdom, this report is solely intended for the clients of DBSVUK, its respective connected and associated corporations and affiliates only and no part of this document may be (i) copied, photocopied or duplicated in any form or by any means or (ii) redistributed without the prior written consent of DBSVUK. This communication is directed at persons having professional experience in matters relating to investments. Any investment activity following from this communication will only be engaged in with such persons. Persons who do not have professional experience in matters relating to investments should not rely on this communication.
Dubai International Financial Centre
This research report is being distributed by DBS Bank Ltd., (DIFC Branch) having its office at units 608-610, 6th Floor, Gate Precinct Building 5, PO Box 506538, Dubai International Financial Centre (DIFC), Dubai, United Arab Emirates. DBS Bank Ltd., (DIFC Branch) is regulated by The Dubai Financial Services Authority. This research report is intended only for professional clients (as defined in the DFSA rulebook) and no other person may act upon it.
United Arab Emirates
This report is provided by DBS Bank Ltd (Company Regn. No. 196800306E) which is an Exempt Financial Adviser as defined in the Financial Advisers Act and regulated by the Monetary Authority of Singapore. This report is for information purposes only and should not be relied upon or acted on by the recipient or considered as a solicitation or inducement to buy or sell any financial product. It does not constitute a personal recommendation or take into account the particular investment objectives, financial situation, or needs of individual clients. You should contact your relationship manager or investment adviser if you need advice on the merits of buying, selling or holding a particular investment. You should note that the information in this report may be out of date and it is not represented or warranted to be accurate, timely or complete. This report or any portion thereof may not be reprinted, sold or redistributed without our written consent.
United States
DBSVUSA did not participate in its preparation. The research analyst(s) named on this report are not registered as research analysts with FINRA and are not associated persons of DBSVUSA. The research analyst(s) are not subject to FINRA Rule 2241 restrictions on analyst compensation, communications with a subject company, public appearances and trading securities held by a research analyst. This report is being distributed in the United States by DBSVUSA, which accepts responsibility for its contents. This report may only be distributed to Major U.S. Institutional Investors (as defined in SEC Rule 15a-6) and to such other institutional investors and qualified persons as DBSVUSA may authorize. Any U.S. person receiving this report who wishes to effect transactions in any securities referred to herein should contact DBSVUSA directly and not its affiliate.
Other jurisdictions In any other jurisdictions, except if otherwise restricted by laws or regulations, this report is intended only for qualified, professional, institutional or sophisticated investors as defined in the laws and regulations of such jurisdictions.
Emkay Global Financial Services Ltd.
CIN - L67120MH1995PLC084899
7th Floor, The Ruby, Senapati Bapat Marg, Dadar - West, Mumbai - 400028. India
Tel: +91 22 66121212 Fax: +91 22 66121299 Web: www.emkayglobal.com
This report is intended for [email protected] use and downloaded at 12/01/2021 03:44 PM


![]Ys}˝‡—dUeconweb.ucsd.edu/~v2crawford/Camerer_Ch1intro.pdf]Ys}˝‡—dU ... d(d](https://img.dokumen.tips/doc/110x75/613063f61ecc515869441112/-ysaa-v2crawfordcamererch1intropdf-ysaadu-dd.jpg)