Embed Size (px)
Citation preview

Company Update
PT. WASKITA BETON PRECAST, Tbk April 2017

Company Profile
2

Company Milestone
3
Establishment of Precast Division
Precast Division
Establishment of PT Waskita Beton Precast as subsidiary
October 2014
2013
2014
2015 2016
Public
IPO PT Waskita Beton Precast Tbk September 2016
59.99% 40.01%
Vision
To Become Leading Company
In Indonesia In Manufacturing
Sector of Precast, Readymix,
Quarry, Construction
Service And Post-tension Precast
Concrete
0.62
0.80
1.80 2.65
4x
x Production Capacity (Million Ton per Year)

Business Line: Precast
WSBP's Precast Division remains to be the biggest contributor to the company's revenue
Readymix
Precast
WSBP's plant production capacity keeps increasing each year
CAGR 41.97%
Cibitung (350,000 ton)
Sidoarjo (325,000 ton)
Palembang (100,000 ton)
Kalijati (250,000 ton)
Karawang (400,000 ton)
Bojonegara (200,000 ton)
Subang (300,000 ton)
Klaten (100,000 ton)
Sadang (375,000 ton)
Gasing (250,000 ton)
Sales Contribution
Production Capacity
Plant Capacity
(in ton)

Business Line: Readymix
5
Readymix
Precast
Ready Mix contribution to the company's revenue has grown over the year from 20% in
2015 to 35% in 2017
WSBP's Batching Plants are scattered all over the project's area
BATCHING PLANT JABODETABEK 1. Cengkareng 2. Becakayu 3. Cakung 4. Desari 5. Karawaci 6. Bocimi 7. Kemayoran 8. Cimanggis 9. Bekasi Barat BATCHING PLANT PEJAGAN - PEMALANG 1. Balamoa 2. Warureja Adiwerna BATCHING PLANT PEMALANG - BATANG 1. Petarukan 2. Sragi 3. Warung Asem BATCHING PLANT BATANG - SEMARANG 1. Gringsing 2. Subah 3. Kandeman 4. Pegandon
BATCHING PLANT SOLO - KERTOSONO 1. Masaran 2. Banaran 3. Balerejo 4. Sidoharjo 5. Kebonromo 6. Walikukun BATCHING PLANT PASURUAN - PROBOLINGGO 1. Muneng 2. Tongas BATCHING PLANT SURABAYA 1. Darmo 2. Legundi BATCHING PLANT LRT PALEMBANG 1. Jl. Soekarno-Hatta Jakabaring BATCHING PLANT TOL SUMATERA 1. Lampung 2. Medan-Kualanamu
BATCHING PLANT PPKA 1. Pematang Panggang
Sales Contribution
Batching Plant List
Bathcing Plants total : 43
Operational Performance
6
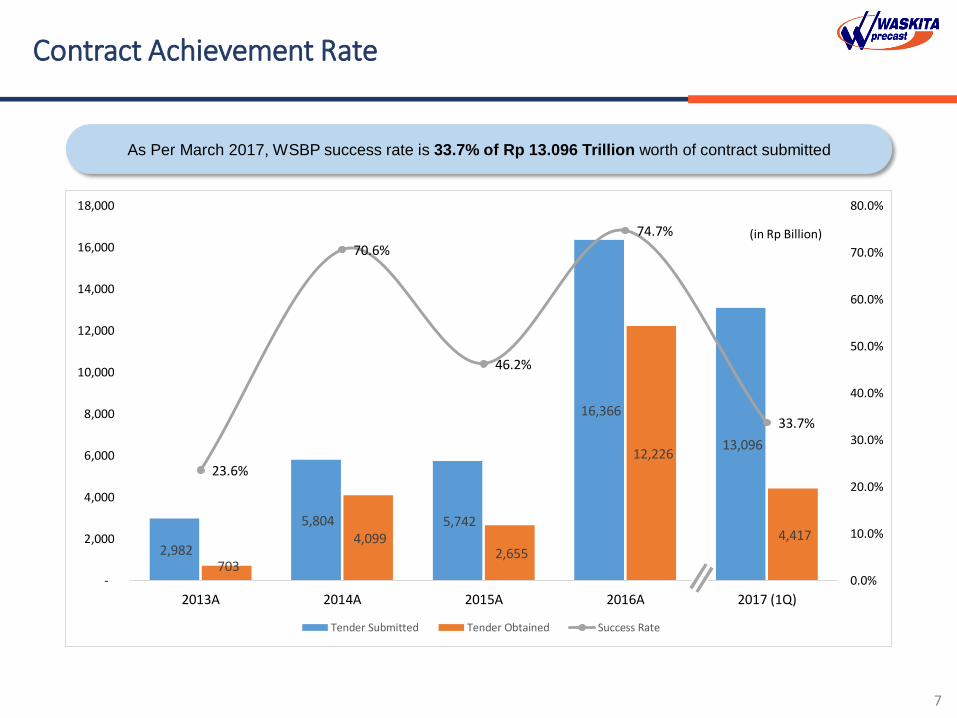
2,982
5,804 5,742
16,366
13,096
703
4,099 2,655
12,226
4,417
23.6%
70.6%
46.2%
74.7%
33.7%
0.0%
10.0%
20.0%
30.0%
40.0%
50.0%
60.0%
70.0%
80.0%
-
2,000
4,000
6,000
8,000
10,000
12,000
14,000
16,000
18,000
2013A 2014A 2015A 2016A 2017 (1Q)
Tender Submitted Tender Obtained Success Rate
7
Contract Achievement Rate
As Per March 2017, WSBP success rate is 33.7% of Rp 13.096 Trillion worth of contract submitted
(in Rp Billion)

4,408
5,871
15,051 14,593
2014 2015 2016 2017 (1Q)
495 355 430 15 558 329 731 303
3,046
1,971
11,066
4,099
4,099
2,655
12,227
2014 2015 2016 2017 (1Q)
Internal External Business Development Total New Contract
8
Contract Achievement & Orderbook
• New Contract per Mar 2017: Rp 4.4 Trillion.
• Contracts have increased dramatically. Mainly supported by business development projects.
• Orderbook as per Mar 2017: Rp 14.6 Trillion (including Carryover 2016 Rp 10.2 Trillion)
• In just 3 month, current 2017 orderbook has achieved ~97% of total orderbook in 2016
WSBP shows significant improvement of contract achievement since 2016
Total Orderbook is consistently increasing throughout the years
‘14 – ’16 CAGR 72.7%
‘14 – ’16 CAGR 84.8%
New Contract Achievement
Total Orderbook
(In Rp Billion) (In Rp Billion)
Notes : 2017 record is for 2 months only (per 28 February)

9
Contract Achievement in 2016 & 2017
No Project in 2017 Value (Rp Bn)
1 Readymix, Spun Pile, PCI Girder - Proyek Tol Pematang Panggang - Kayu Agung STA 108+600-STA 185+600 790.77
2 Readymix, Precast MCB - Jalan tol Jakarta - Cikampek (Japek) 563.917
3 Pile Slab Jalan tol Krian - Legundi - Bunder (KLBM) 447.329
4 Girder, Spun Pile - Jalan Tol Krian Legundi Bunder 274.71
5 Readymix - Jalan Tol Krian Legundi Bunder 272.22
6 LRT Palembang 258.885
7 PCI Girder & Readymix tol Boyolali - Salatiga paket 4 & 5 161.932
8 Tol Gempol - Porong 132.62
9 PCI Girder, Spun pile proyek Kayu agung - Palembang - Betung 73.037
No Project in 2016 Value (Rp Bn)
1 Precast & Readymix Jalan Tol Legundi-Bunder 2,600.00
2 Precast, Readymix - Pekerjaan Pembangunan Jalan Tol Cimanggis - Cibitung (Seksi 2) 2,230.24
3 Precast, readymix Jalan Tol Batang Semarang 1,509.76
4 LRT Palembang 1,021.51
5 Tol Bogor Ciawi Sukabumi Seksi 2,3,4 790.76
6 Kayu Agung - Palembang - Betung 704.76
7 Precast, Readymix - Pembangunan Jalan Tol Pemalang - Batang Seksi I 481.16
8 Tol Terbanggi Besar - Kayu Agung Ruas Terbanggi Besar - Mesuji Lanjutan 1A, 25 KM 469.05
9 Readymix - Proyek Pembangunan Tol Pasuruan - Probolinggo 388.07
10 Proyek Tol Pejagan - Pemalang Seksi IV 368.05
NON EXHAUSTIVE
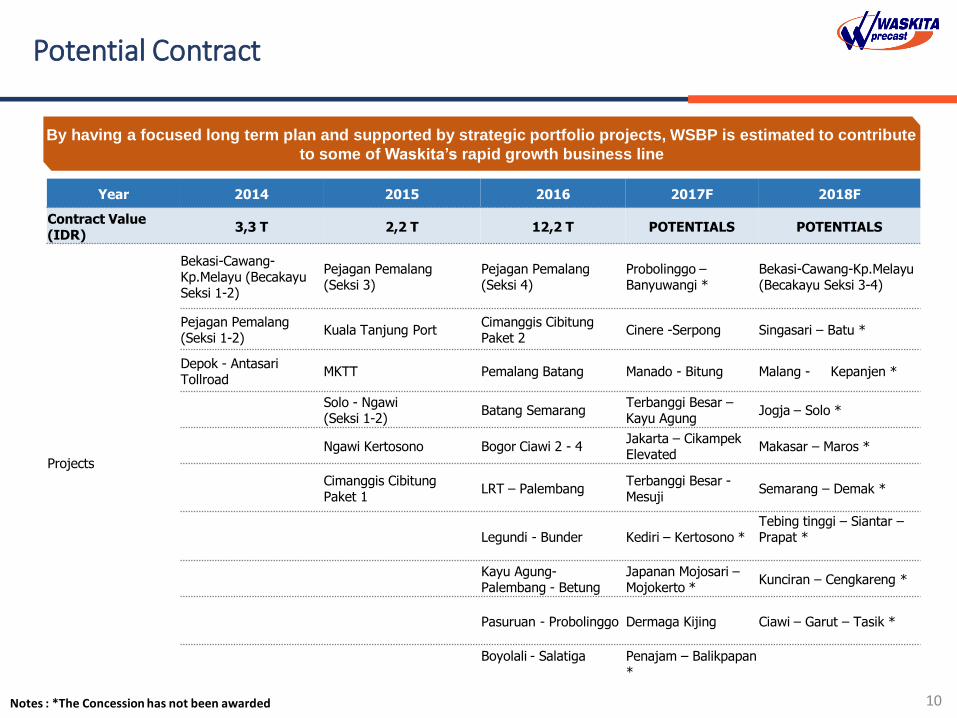
Potential Contract
10
Year 2014 2015 2016 2017F 2018F
Contract Value (IDR)
3,3 T 2,2 T 12,2 T POTENTIALS POTENTIALS
Projects
Bekasi-Cawang-Kp.Melayu (Becakayu Seksi 1-2)
Pejagan Pemalang (Seksi 3)
Pejagan Pemalang (Seksi 4)
Probolinggo – Banyuwangi *
Bekasi-Cawang-Kp.Melayu (Becakayu Seksi 3-4)
Pejagan Pemalang (Seksi 1-2)
Kuala Tanjung Port Cimanggis Cibitung Paket 2
Cinere -Serpong Singasari – Batu *
Depok - Antasari Tollroad
MKTT Pemalang Batang Manado - Bitung Malang - Kepanjen *
Solo - Ngawi (Seksi 1-2)
Batang Semarang Terbanggi Besar – Kayu Agung
Jogja – Solo *
Ngawi Kertosono Bogor Ciawi 2 - 4 Jakarta – Cikampek Elevated
Makasar – Maros *
Cimanggis Cibitung Paket 1
LRT – Palembang Terbanggi Besar - Mesuji
Semarang – Demak *
Legundi - Bunder Kediri – Kertosono * Tebing tinggi – Siantar – Prapat *
Kayu Agung- Palembang - Betung
Japanan Mojosari – Mojokerto *
Kunciran – Cengkareng *
Pasuruan - Probolinggo Dermaga Kijing Ciawi – Garut – Tasik *
Boyolali - Salatiga
Penajam – Balikpapan *
Notes : *The Concession has not been awarded
By having a focused long term plan and supported by strategic portfolio projects, WSBP is estimated to contribute
to some of Waskita’s rapid growth business line

Major Contracts' Progress
11
Solo Kertosono • Contract Value:
Rp 1.004 Tr • Progress: 58.2%
LRT Palembang • Contract Value:
Rp 963.28 Tr • Progress: 85.31%
CCTW • Contract Value:
Rp 2.230 Tr • Progress: 20.87%
Becakayu • Contract Value:
Rp 3.046 Tr • Progress: 92.6%
*Exclude PPN

12
Production Performance in 2016
Plant’s capacity and utility are steadily increasing
Plant’s production is generally contributed by Precast production
Capacity & Utility Precast Production
Volume
800,000
1,800,000
2,650,000
58%
64%
70%
40%
50%
60%
70%
80%
-
500,000
1,000,000
1,500,000
2,000,000
2,500,000
3,000,000
2014 2015 2016
463,200
1,160,000
1,561,229
-
200,000
400,000
600,000
800,000
1,000,000
1,200,000
1,400,000
1,600,000
1,800,000
2014 2015 2016
• In 2016, plant’s capacity and precast production is tripled from 2014
• Gradually, plants achieved better efficiency as reflected by total utility’s increase
(In ton) (In ton)
CAGR 82%
CAGR 84%

Financial Performance
13
14
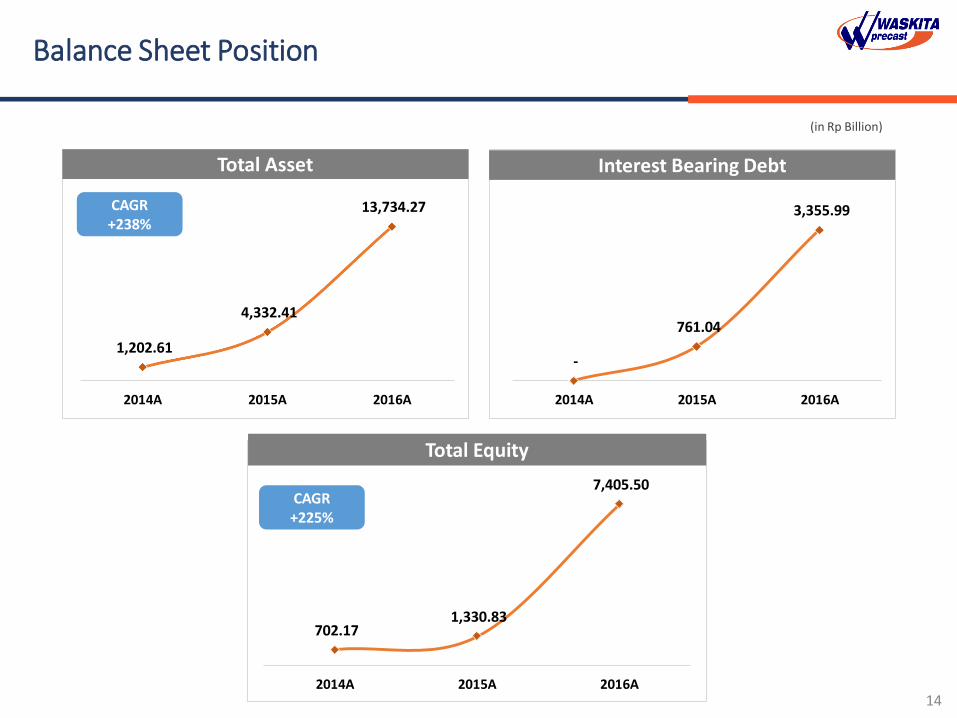
Balance Sheet Position
1,202.61
4,332.41
13,734.27
2014A 2015A 2016A
-
761.04
3,355.99
2014A 2015A 2016A
702.17 1,330.83
7,405.50
2014A 2015A 2016A
Total Asset Interest Bearing Debt
Total Equity
(in Rp Billion)
CAGR +238%
CAGR +225%

15
Earnings Performance
641.93
2,644.32
4,717.15
-
1,000.00
2,000.00
3,000.00
4,000.00
5,000.00
2014A 2015A 2016A
495.23
2,224.89
3,667.09
22.85%
15.86%
22.26%
0.00%
10.00%
20.00%
30.00%
-
1,000.00
2,000.00
3,000.00
4,000.00
2014A 2015A 2016ACOGS Gross Margin
149.20
450.73
1,112.91
23.24%
17.05%
23.59%
0.00%
10.00%
20.00%
30.00%
-
200.00
400.00
600.00
800.00
1,000.00
1,200.00
2014A 2015A 2016A
EBITDA EBITDA Margin
140.31
334.37
634.82
21.86%
12.64% 13.46%
0.00%
5.00%
10.00%
15.00%
20.00%
25.00%
-
200.00
400.00
600.00
800.00
2014A 2015A 2016A
Net Income Net Income Margin
Revenue COGS
EBITDA Net Income
(in Rp Bn) (in Rp Bn)
(in Rp Bn) (in Rp Bn)
CAGR 171%
CAGR 172%
CAGR 173%
CAGR 113%

0.00
0.57
0.45
2014A 2015A 2016A
16
Financial Ratio
1.96
0.41
1.71
2014A 2015A 2016A
21.26%
25.13%
14.53%
2014A 2015A 2016A
11.67%
7.72% 7.02%
2014A 2015A 2016A
Return on Equity Ratio Return on Assets Ratio
Debt to Equity Ratio Current Ratio
CAGR -17%
CAGR -7%
CAGR -22%

17
Capital Expenditure Realization 2016
No Items 2016 Realization
A Plant Investment 702.64
1 Bojonegara Plant 215.00
2 Subang Plant 250.00
3 Palembang (Gasing) Plant 160.11
4 Klaten Plant 77.54
B Ready Mix Investment 252.48
1 20 Batching Plant + 65 Truk Mixer 252.48
C Quarry Investment 91.49
1 Land Acquisition -
2 Transportation -
3 Supporting Tools 3.58
4 Production Machineries 87.92
Total A + B + C 1,046.62
(in Rp Billion)
Realization is 93.8% of Plan

Use of Proceed
18
IPO Fund Allocation 20 Sept - 31 March 2017
Description CAPEX Working Capital Total
Fund Allocation 2,231.91 2,840.62 5,072.53
Use of Proceed:
Expense for CAPEX (452.43) 0 (452.43)
Expense for Working Capital 0 (1,913.29) (1,913.29)
Total Expenses (452.43) (927.33) (2,365.72)
End Balance 1,779.48 474.90 2,719.91
(in Rp Billion)

19
Capital Expenditure Plan
715
1174
700
140
67
197 214
500
0
47
256
0
0
200
400
600
800
1000
1200
1400
1600
1800
2000
2016F 2017F 2018F
Precast Readymix Quarry Truk Mixer
(in Rp Billion)
WSBP Plan in Capital Expenditure
2016F 2017F 2018F Total
Precast 715 1174 700 2.589
Readymix 140 67 197 404
Quarry 214 500 - 714
Truk Mixer 47 256 - 303
Total 1.116 1.997 897 4.010
(in
Rp
Bill
ion
)

Sales 641,931 2,644,320 4,717,150
Cost of good sold (495,226) (2,224,890) (3,667,088)
Selling expenses (102) (2,322) (4,281)
General & administrative expenses (4,700) (53,754) (92,731)
Other income 1,024 2,600 58,852
Other expenses (229) (20,405) (61,273)
Net Revenue
2014A 2015A 2016A
Gross Profit 146,705 419,430 1,050,062
Operating Cost
Total Operating Cost (4,802) (56,076) (97,012)
Operating Profit 141,903 363,355 953,050
Other income (expense)
Total other income (expense) 794 (17,804) 14,295
Earning before income taxes 142,497 345,550 967,345
Net profit 140,305 334,369 634,820
EBITDA 149,201 450,733 1,112,910
of Joint Venture 16,716
Income taxes (2,392) (11,181) (332,525)
Gross Profit Margin 23% 15.86% 22.26%
Operating Profit Margin 22% 14% 20%
Net Profit Margin 22% 12.645% 13.458%
EBITDA Margin 23% 17% 24%
20
Financial Report: Profit and Loss Statement
(in Rp Million)
21
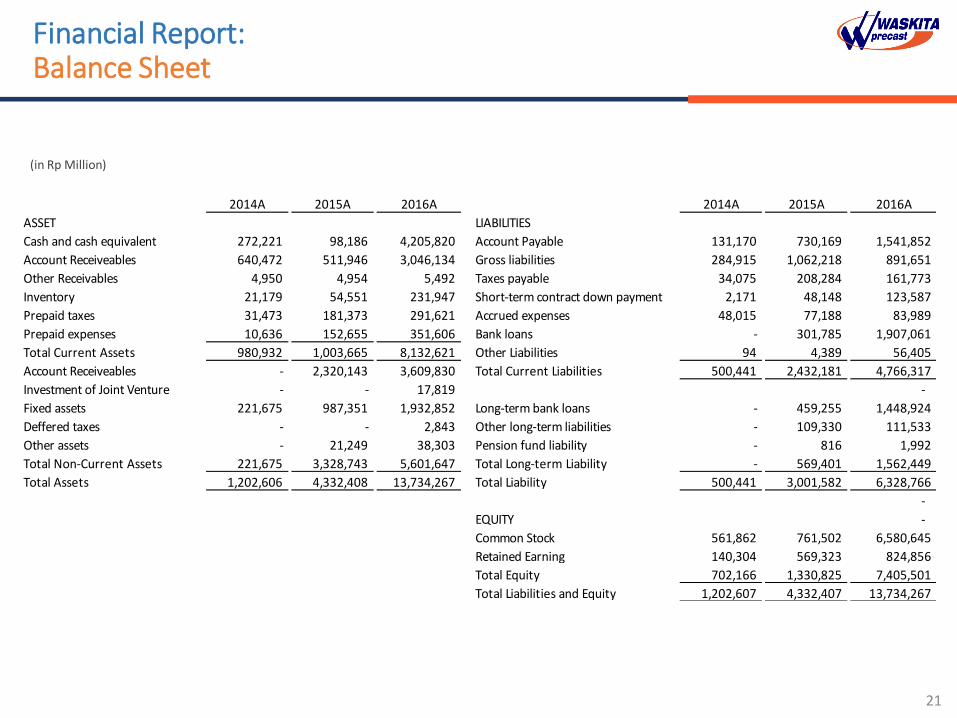
Financial Report: Balance Sheet
Cash and cash equivalent 272,221 98,186 4,205,820 Account Payable 131,170 730,169 1,541,852
Account Receiveables 640,472 511,946 3,046,134 Gross liabilities 284,915 1,062,218 891,651
Other Receivables 4,950 4,954 5,492 Taxes payable 34,075 208,284 161,773
Inventory 21,179 54,551 231,947 Short-term contract down payment 2,171 48,148 123,587
Prepaid taxes 31,473 181,373 291,621 Accrued expenses 48,015 77,188 83,989
Prepaid expenses 10,636 152,655 351,606 Bank loans - 301,785 1,907,061
Other Liabilities 94 4,389 56,405
Account Receiveables - 2,320,143 3,609,830
Investment of Joint Venture - - 17,819 -
Fixed assets 221,675 987,351 1,932,852 Long-term bank loans - 459,255 1,448,924
Deffered taxes - - 2,843 Other long-term liabilities - 109,330 111,533
Other assets - 21,249 38,303 Pension fund liability - 816 1,992
-
-
2014A 2015A 2016A 2014A 2015A 2016A
ASSET LIABILITIES
Total Current Assets 980,932 1,003,665 8,132,621
Total Current Liabilities 500,441 2,432,181 4,766,317
Total Non-Current Assets 221,675 3,328,743 5,601,647 Total Long-term Liability 569,401 1,562,449
Total Assets 1,202,606 4,332,408 13,734,267 Total Liability 500,441 3,001,582 6,328,766
EQUITY
Total Equity 702,166 1,330,825 7,405,501
Total Liabilities and Equity 1,202,607 4,332,407 13,734,267
-
Common Stock 561,862 761,502 6,580,645
Retained Earning 140,304 569,323 824,856
(in Rp Million)

22
Financial Report: Cash Flow
Cash collected from customers 3,630 573,119 978,966
Cash paid to suppliers & third parties (87,304) (1,238,659) (3,620,933)
Tax Income/(expenses) - (11,022) (244,156)
Other income/(expenses) (1,333) (9,573) (148,782)
-
Capital Expenditure (21,615) (123,555) (832,216)
Placement on Joint Venture (1,104)
-
Prepayments for stock issuance (86,210)
Cash receipts from banks - 500,655 3,367,539
Cashpaid to banks 378,844 135,000 (772,256)
Cash receipts from capital deposit - - 5,466,787
cash receipts from non-bank related parties
2014A 2015A 2016A
Cashflow from Operations
Net Cash from Operations (85,007) (686,135) (3,034,905)
Cashflow from Operations
Net Cash from Investing (21,615) (123,555) (833,320)
Cashflow from Financing
Net Cash From Financing 378,844 635,655 7,975,859
Net increase/(decrease) in cash held
Cash at the end of the year 272,221 98,186 4,205,820
- - -
272,221 (174,035) 4,107,635
Cash at the beginning of the year - 272,221 98,186
(in Rp Million)

2017 Targets
23

24
Target 2017
Financial • Revenue : 7.751 Tr
• Net Profit : 1.133 Tr
Operational • New Contract : 12.383 Tr
• Production Capacity : 3.250 Ktons
• Utilization : 70%

Plant Expansion
25
• Medan/Kuala Tanjung
• Palembang • Gasing
• Karawang • Cibitung • Sadang
• Sidoarjo
• Penajam
• Bojonegara • Kalijati • Subang
WSBP has 10 existing plants and 2 upcoming plants
Existing Plants
Upcoming Plants
• Klaten

Infrastructure Overview
26

RPJMN 2015-2019
Rencana Pembangunan Infrastuktur Jokowi 2015-2019
(Source: Konektivitas Infrastruktur Wilayah dan Antar Wilayah. Bappenas, 10 Desember 2014)
Jokowi’s Infrastructure Development Plan: 2015-2019

Infrastructure Potential
CAGR 22%
Sumber: Kemenkeu, NK-APBN 2017
The increase in the infrastructure budget illustrates the Government’s priority in accelerating the national infrastructure development. The 6-year CAGR of the Infrastructure Budget is approximately 22% followed by the increase in state budget portion, which is proposed at 18,6% in APBN 2017.
Infrastructure Budget

29
Rencana Pembangunan Jalan Tol
RPJMN 2015-2019

Disclaimer This material is for information only, and we are not soliciting any action based upon it. This report is not to be construed as an offer to sell or the solicitation of an offer to buy any security in any jurisdiction where such an offer or solicitation would be illegal. The information herein has been obtained from sources believed to be reliable, but we do not warrant that it is accurate or complete, and it should not be relied upon as such. Opinion expressed is our current opinion as of the date appearing on this material only, and subject to change without notice. It is intended for the use by recipient only and may not be reproduced or copied/photocopied or duplicated or made available in any form, by any means, or redistributed to others without written permission of PT Waskita Beton Precast.
Thank You
Head Office: Gedung Teraskita Jakarta, 3 & 3A Floor Jl. MT. Haryono Kav. No. 10A Cawang, Jakarta 13340 Ph. (+6221) 22892999 Website: www.waskitaprecast.co.id