Embed Size (px)
Citation preview

1

2
COMPANY PRESENTATION
IT DAY BANCA IMI – February 23th 2017

3
The gateway to your digital presence

o DADA at a Glance
o Business Overview
o Market & Positioning
o Financials & KPIs
o Strategic Guidelines
o Investment Highlights
Agenda

Leading European Player in Digital & Online Services for SMBs5DADA at a Glance
WHO WE ARE
o Leading European Player in Digital Services for the Online Presence & E-Business
o Domains & Hosting services targeted at SMBs & SoHo
o Product suite covering the entire hosting value chain: Domains, Application, Hosting, Cloud & Managed Hosting.
o Fully Integrated Technology Infrastructure, Proprietary Datacenter, World Class Data Driven Platform
o Listed on the STAR Segment of the Milan Stock Exchange (EV € 78.0** mln)
BY THE NUMBERS
15 years Successful Track Record in the Industry
600* kpaying Clients (+11% yoy)
1.9 mlnDomains* under management
Presence in 7European countries
€62.2 mlnRevenues FY2015 (+4.5% yoy), o/w 56% International
€10.5 mlnEbitda FY2015 (+14% yoy) - 18% Ebitda Margin
455Highly Qualified Employees*
Data as of 30 September 2016
Data Mk Cap as of 17 Feb 2017, NFP as of 30 September 2016*
**

6
DADA today enjoys a strong presence in
the main European D&H Markets… #2 ITALY
#3 UK
#2 IRELAND
#1 PORTUGAL
TOP 8 SPAIN
TOP 5 FRANCE
o DADA operates mainly in UK & Italy where is the 1-3 top player
across D&H segment
o The Group is present in France, Spain, Portugal and Ireland with
leading positioning too
o Offering its products trough its long – standing Brands such as
Register.it, Names.co.uk, Nominalia and Amen with industry- leading
NPS score…
o …and also with the recent acquired ones (Etinet and Sfera)
GER
MA
NY
NL
RU
S
BR
AU
S.
DADA at a Glance
Figure at 2Q 2016 - Source www.centr.org, Domain Wire Global TLD Stat Q2 2016
19,416,1
10,85,6 5,3 3,9 3,9 3,1 3,0 2,9
.CN .DE .UK .NL .RU .BR .EU .AU .FR .IT
MARKET: TOP 10 LARGEST MARKETS BY ccTLDs DOMAIN VOLUME
DADA enjoys a
leading position in 3
of 10 TOP ccTLDs
DADA BRANDS &
RANKING
#2 ITALY
#3 UK
#1 IRELAND
#2 PORTUGAL
TOP 8 SPAIN
TOP 5 FRANCE

7
#3 UK
#2 IRELAND
… with a strong Set of fast growing Business
KPIs..
* Data as of Sept 30° 2016
1.8
1.9
Sept 2015 Sept 2016
+6%
Customer Base Trend Domains Stock
DADA at a Glance
540
600
Sept 2015 Sept 2016
+11%
+30% yoy
New Domains
in 9M 2016
+45% yoy
New Customers
in 9M 2016
BUSINESS & METRICS
1.9 MLN DOMAINS
1.8 MLN EMAILS
10.000 +
SERVERS
600 K
CUSTOMERS
8
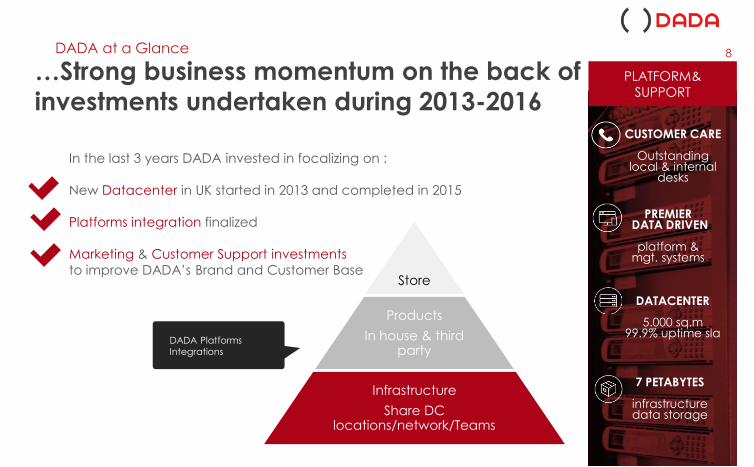
…Strong business momentum on the back of
investments undertaken during 2013-2016
In the last 3 years DADA invested in focalizing on :
New Datacenter in UK started in 2013 and completed in 2015
Platforms integration finalized
Marketing & Customer Support investments
to improve DADA’s Brand and Customer BaseStore
Products
In house & third party
Infrastructure
Share DC locations/network/Teams
DADA Platforms
Integrations
DATACENTER
5.000 sq.m99.9% uptime sla
7 PETABYTES
infrastructuredata storage
CUSTOMER CARE
Outstandinglocal & internal
desks
PREMIERDATA DRIVEN
platform & mgt. systems
DADA at a Glance
PLATFORM&
SUPPORT

ITA
UK
IRL
FR
ES PT
International Business 9
55%45%
UK AREA
Over 75%
TurnoverUK+ITA
Italy
Abroad
9M ‘16 Revenue* Breakdown
DADA at a Glance
* Revenues as of 30 Sept 2016: €47.7 mln

From Local Player to European Leading Position10DADA’s Milestones
From a pure Italian player
to a Leading Multinational
Focus on Core Business and
DC start-up
2011 Sale 100% of
2013 Start New UK Data
Center
Optimization and
Refocusing Completed
2015 Sale 100% of:
July 2015 Acquisition of
2005 - 2010 2011 - 2013 2014 - 2015 2016-2017
Leading European Player in
Online Presence for SMBs
o Strongly Positioned in
o Broad Suite of Solutions &
High – Perfomance UK
Datacenter
o July 2016 Acquisition of
o CISPE Certification
D&H REVENUES: 5% D&H REVENUES: 75% D&H REVENUES: 97% D&H REVENUES: 100%
Core Business incidence
on total Revenues

o DADA at a Glance
o Business Overview
o Market & Positioning
o Financials & KPIs
o Strategic Guidelines
o Investment Highlights
Agenda

12
MARKET AND
PROMOTE
BUSINESS
POWERFUL
AND SAFE
MANAGE
/
STORE DATA
SELL AND
DISTRIBUTE
PRODUCTS
ONLINE
CREATE
ONLINE
IDENTITY
PROTECT
DIGITAL
IDENTITY
o Wide and complete suite of Products
o High level of Security and Reliability
o Constant Support and Consultancy
o Tailor made Solutions
Business Overview
We Help SMBs Go Digital
Dada complies with the code of conduct of CISPE: Cloud Infrastructure Services Provider in Europe
13
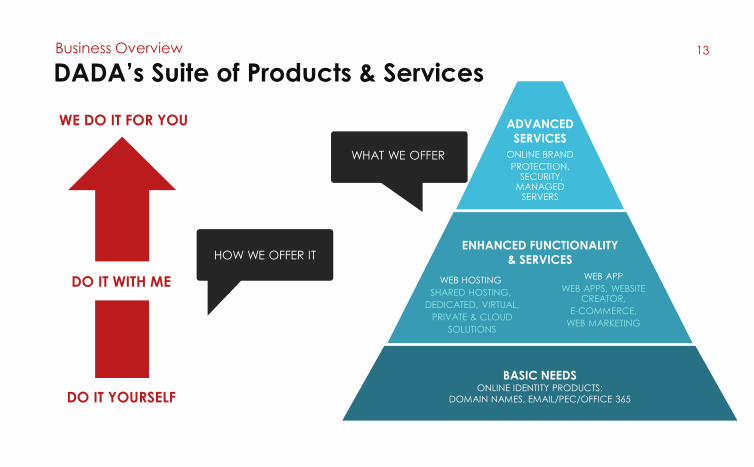
DADA’s Suite of Products & ServicesBusiness Overview
BASIC NEEDSONLINE IDENTITY PRODUCTS:
DOMAIN NAMES, EMAIL/PEC/OFFICE 365
ENHANCED FUNCTIONALITY
& SERVICES
WEB HOSTING
SHARED HOSTING,
DEDICATED, VIRTUAL,
PRIVATE & CLOUD
SOLUTIONS
WEB APP
WEB APPS, WEBSITE CREATOR,
E-COMMERCE,
WEB MARKETING
ADVANCED
SERVICES
ONLINE BRAND
PROTECTION,SECURITY,
MANAGED SERVERS
DO IT YOURSELF
WE DO IT FOR YOU
DO IT WITH ME
WHAT WE OFFER
HOW WE OFFER IT

Broad Suite of Solutions to Meet Different Customer Needs…
Business Overview 14
TECHNICALUSERS
o Dedicated
o VPS
o Backup
o Cloud
o Reseller packages
o Biz Apps
o Custom DC solutions
DIYDO IT YOURSELF
o Domain
o Hosting
o Site Builders
o Advertising packages
o Email solutions
o Biz Apps
DIWMDO IT WITH ME
o Customer build and manage its online presence with the help of a coach via Phone, Chat, …
DIFYDO IT FOR YOU
o Base packages
o Build for me
o Local & Social
o Paid enhanced support
o Web agency services
o OBP

..Supported by World-Class
Customer Care
15
SUPPORT, CONSULT AND DELIGHT OUR CUSTOMERS
CUSTOMER FACING RESOURCES
30% of Human Capital
PROPRIETARY LOCAL PRESENCE
5 Local Desks
MULTICHANNEL
Phone, Email, Chat, Webinar..
WORD-CLASS PERFORMANCES
Top NPS based goalsAND PROMPT
85% in 30sec.90% tickets in 4h
Pre Sales Assistance &
Post Sales Technical Support Team
For High Value Service and Top Level Support
Business Overview

16Business Overview
Reading (UK)
PROPRIETARY POWERFUL & RELIABLE DATACENTERo 5,000 sq. m Green Park Allocation
o Tier 4 like
o 4 Petabytes Data Storage
o 80+Gbps Transit Bandwidth
o 10,000+ Servers
o 24/7/365 Onsite Engineers customer Support
o Certified ISO 27001:2005
All our Services are built on a fully integrated and redundant IT Infrastructure, based on best in class technologies
Reading (DADA)+Milan (BT)
COMPLETE INFRASTRUCTUREo Tier 4
o 7 Petabytes Data Storage
o 120 + Gbps Transit Bandwidth
o 11,000+ servers
o 24/7 customer support
..and by a Powerful IT
Infrastructure

17
In depth Data Driven understanding
of Customer Base and monitoring
of Business Financials
Business Overview
Data Driven Platform & Management Systems
Cutting edge Data Management Systems
o Real time data to Support Sales and Marketing Teams
o In depth Analysis of Customer Segments and Cohorts
o Data driven Product Development
Fuelled by
o Big Data internally developed Platforms
o A.I. proprietary Algorithms
o Dedicated “Quants” Teams

v
Investing in Diverse and Efficient
Customer Acquisition Channels
Business Overview 18
BRAND AWARENESS
o Investment in brand and offer of free products to create customer prospect
ONLINE MARKETING
o Pay per Click campaigns
o Banner Ads & affiliates
IN & OUTBOUND TELESALES
o Wholly-owned and local functions, not out-sourced
o Driven cross-sell and up-sell
LOCALOFFLINE
o Offline sales desks
o Web agency
o Targeting premium customer, higher ARPU
CO-BRANDING CUSTOMER POOL PRE & POST-SALES TRADITIONAL AGENCY
o Boost brand awareness o Acquiring basic cliento Commercial offers
o Renewals: alert deadline
o Orders intake
o Web factory with strong offline expertise

Agenda
o DADA at a Glance
o Business Overview
o Market & Positioning
o Financials & KPIs
o Strategic Guidelines
o Investment Highlights

22.5mSMBs
20
A Large & Underserved MarketMarket & Positioning
Sources: European Commission - SME Performance Review – SME Company Analysis
With more than 600.000 SMB European customers, the current DADA’s Market
Penetration in its core geographies is 5%
LAR
GE M
AR
KET
OP
PO
RTU
NIT
Y
SM
Bs
DIG
ITA
LIZA
TIO
N
OP
PO
RTU
NIT
Y
All Europe
DADA’s Core
Geographies12.1m
SMBs
10.3mSMBs without E-
commerce
3.2mSMBs without
Website

4.164.62
4.925.56
6.24
7.21
2011 2012 2013 2014 2015 2016
Millions of Computer
Market trends D&H 21Market & Positioning
DOMAINS MARKET TREND GLOBAL HOSTING PROVIDERS MARKET
Figure at 3Q 2016 - Source www.centr.org, Domain Wire Global TLD Stat Q2 2016
Keys : ccTLDs (.it, .uk, .ru); gTLDs (.com,.net); new gTLDs (.wine, .London, .sport)
New gTLDs 6.8%
(3% at 3Q15)
Legacy TLDs
50.2%
ccTLDs
43%
Source : Netcraft report nov 2016
+16% yoy
The Market is composed by Hosting Providers (Cloud DC, colo
solutions) and IT Providers (Telco, cabling). The trend is increasing.
68.5 69.6
312 326
3Q15 3Q16
European TLDs
Global TLDs
+9% yoy
Global TLDs Break Down
+2 % yoy
Mln TLDs
Opportunities arising from new gTLDs, released by
ICANN from 2014

Well Positioned to Beat the Market 1/222Market & Positioning
o Leading Positioning in ccTLD, First Adopter
New gTLDs
o Fast Growing Iaas Player
o European leader in digitization, online presence,
Hosting and business services tailored to SMBs
o Diverse & Efficient customer Acquisition
Channels
o Low Customer Churn (monthly) – <1.2% &
Enhanced upselling strategies to Base
MARKET FEATURES AND TRENDS
o ccTLD Domains Markets stabilizing – Arising
opportunities from New gTLDs
o Expected Growth of the Web Presence and
Hosting / Servers market segment
o Increasing Competition to acquire new
customers and Rising COA
o Market Consolidation Trend (M&A)
DADA STRATEGIC POSITIONING

Well Positioned to Beat the Market 2/223Market & Positioning
o Broad Suite of Solutions, Agile Dev. Teams
o Integrated Tech. Platforms & Powerful DC
o Premier Brands Awareness
o Strongly increasing Customer Base – high
retention rate
o Enhanced Tailored Products (DIFY) & Word
Class Proprietary Customer Care
MARKET KEY DRIVERS / BARRIERS
o Quality & Reliability of Services
o Complete Range of Products
o Brand Recognition
o Scale dimensions
o Full Support and Premium Consulting (from DIY to DIFY)
DADA ASSETS / STRENGHTS

o DADA at a Glance
o Business Overview
o Market & Positioning
o Financials & KPIs
o Strategic Guidelines
o Investment Highlights
Agenda

An Appealing Revenue Model..
25
YEAR 1 RENEWAL
RECURRING
REVENUE
UPSELLING
ON EXISTING
CUSTOMERS
NEW
CUSTOMERSYEAR 2
Recurrent revenues from
existing clients represents
over 2/3 of new sales
About 95% of
Upfront payment
methods
KEY FEATURES AND INTRINSIC STRENGTHS
High Revenues Visibility & Predictability - Customer retention > 85%
ARPU increasing overtime – Upgrade to Premium Services and Upsell
Low credit risk & NWC invest. - 95% Revenues from Upfront Payment
Financials & KPIs

9M ‘16 Customer Base Growth – Investing for the future
26
CUSTOMERS – STOCK (000S)
NEW CUSTOMERS ACQUIRED YOY GROWTH
540
600
+11%yoy
+33%yoy
Monthly Churn <1.2%
30 Sep 2015
30 Sep 2016
1Q 2015
1Q 2016
1H2015
9M 2015
FY2015
+20%yoy
+25%yoy
+26%yoy
Strong New Customers increase: effective marketing strategies from 1H2015,
improved COA efficiency
1H2016
+49%yoy
+47%yoy +45%
yoy
9M2016
Financials & KPIs

9M ‘16 Business Metrics - Growing Faster than the Market
27
DOMAIN STOCK(MLN)
NEW DOMAINS REGISTRATIONS
1.81.9
+6%yoy
+30%yoy
DADA continues to grow faster than the Mkt ,
grabbing Mkt Share from competitors Monthly Churn <1.2%
31 Dec2015
30 Sept2016
9M 2015 9M 2016
9M2014
o Domain registrations is the first step for the
SMBs “go digital” and is a key driver to
acquire new customers
o Continued strong New registrations
growth in 9M 2016, DADA grew faster
than the market
o In Italy (.it – ccTLD) market penetration*
exceeded 20%
o Market penetration increased thanks to
effective sales policies, and continuous
products improvement
o Launched in the period new gTLDs such
as: .BARCELONA; .PROMO; .CARS; .INSURANCE;
.SHOP.
o Strong market share in main new gTLDs:
.wine 8% worldwide (60% In Italy)
.bio 18% worldwide
*Calculated on new registrations. Data Registro.it and DADAanalysis
Financials & KPIs
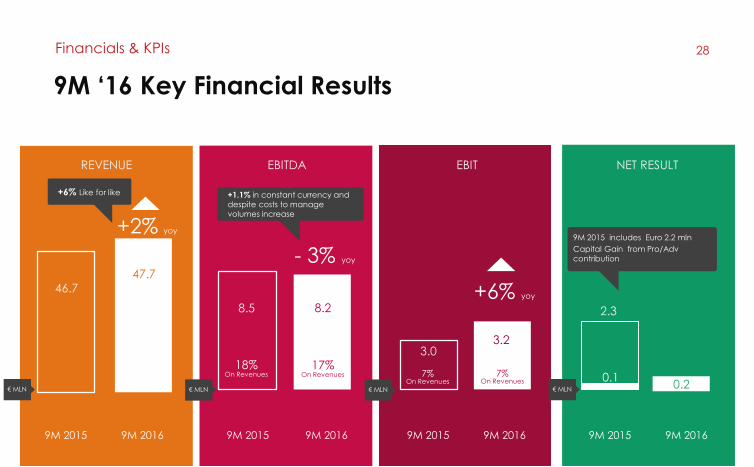
9M ‘16 Key Financial Results
28
REVENUE EBITDA EBIT NET RESULT
46.747.7
+2% yoy
- 3% yoy
9M 2015 9M 2016 9M 2015 9M 2016
3.03.2
+6% yoy
9M 2015 9M 2016 9M 2015 9M 2016
€ MLN
8.5 8.2 2.3
0.2
17%On Revenues
18%On Revenues
€ MLN € MLN € MLN
9M 2015 includes Euro 2.2 mln
Capital Gain from Pro/Adv
contribution
7%On Revenues
7%On Revenues 0.1
+1.1% in constant currency and
despite costs to manage
volumes increase
+6% Like for like
Financials & KPIs

45.5
48.2
9M'15 9M'16
44.546.7 47.7
9M'14 9M'15 9M'16
13.614.8 14.9
Revenue Trend : +6% like for like
29
€ MLN
REVENUE by Quarter* as reported
+2% YoY
*Considering before 2015 only D&H BU
€ MLN3Q’14 3Q’15 3Q’16
Revenue continued
to improve all along
the 3 quarters of 2016
despite negative Euro/Gbp
impact in particular
in 2Q16 & 3Q16
REVENUE 9M as reported
+6% YoY
REVENUE 9M like for like
Like for like view is net of
o €/GBP Effects - €1.7 mln
o Changes in Perimeter:ProAdv €1.2 mln (1H2015)Etinet €0.7 mln (1H2016)Sfera €0.5 mln (3Q2016)
9M 2015 9M 2016
Financials & KPIs

30
9M 2015 ProAdv/Simply
1H2015
D&H EU Forex €/GBP 9M 2016
9M ‘16 Revenue Bridge vs 9M ‘15
D&H UK
46.7 47.7-1.2 +1.2 +1.7 -0.1
€ MLN
+2.3%+4.2%
+9.5%% = Delta vs 9M2015
Others*
-1.7
-3.7%
SFERA
3Q2016
+0.5
*Mainly service fees verso Moqu & 4W MarketPlace
ETINET
1H2016
+0.7
Financials & KPIs

EBITDA:17% margin despite investments
to expand the business
31
EBITDA9M’16 Ebitda trend is due to:
o Benefits arising from full operation of new Datacenter and integration of the operational platforms
o Costs to manage the growth in volumes aimed to improve future profitability including:
Initial Promotion Strategies (time –limited) affecting new customer Arpu and Direct Margins
Cost of personnel increase to face higher volumes, maintain quality of services & provide new tailor made solutions (Insourcing of Customer Care in ‘15, Improving off line channels, consolidation of acquisitions)
o Recent acquisitions Etinet and Sfera contributed positively. Changes in perimeter contributions offset the negative effects of Euro/Gbp trend (-€0.4 mln)
€ MLN
€ MLN
-3.0% YoY
18%16%Ebitda Margin
7.0
8.5 8.2
9M'14 9M'15 9M'16
8.5 8.6
9M'15 9M'16
EBITDA constant Currency + 1.1%
Financials & KPIs
17%
o/w R&D Capex 2.3 1.7 1.7

32
9M 2015
ProAdv/Simply1H2015
9M 2016
9M ‘16 EBITDA Bridge vs 9M ‘15
8.5 8.2-0.0
€ MLN
-3%
+1.3
+4.2%
+0.0 -1.4 -0.02 -0.02 -0.4
18.1% 17.1%% of revenue
PRODUCT MARGIN
COA R&D CAPEXLABOUR COST & CONTRACTORS
G&A
+10%
% = Delta vs 9M 2015
-1.6% +0.4%
- 0.1%
GBP Ex. Rate Impact
ETINET 1H2015
+0.2 +0.2
SFERA 3Q2016
Financials & KPIs

33
9M 2015
R&D* 9M2016
9M ‘16 Capex Composition
4.5 4.51.2
€ MLN
2.0 0.6 0.1 0.1
HARDWARE & SOFTWARE
NEW UK DATA CENTER
DEDICATED SERVERS
CUSTOMER BASE
ACQUISITION
1.7
Financials & KPIs
* R&D: capitalization of the portion of Labor cost for the development of new internal products and processes

18.2
34
9M ‘16 From EBITDA to Net Result
9M2015
11.2
-3.7
9M
2016
8.2
D&A EBITDA EBIT Net Financials Taxes
(4.96)
3.2 (2.3)*
(0.7)
9M
2015
8.5
D&A EBITDA Net
FinancialsTaxes Net Result
(5.4)
(0.3)**
0.3
3.0
EBIT€ MLN
€ MLN
Net Result
0.2
Extraordinary
activity
2.3(1.9)* 2.2
Capital Gain
from transfer of
Proadv
(0.7)
0.1
Includes Euro 2.2 million
capital gain from ProAdv
contribution
Net Financials negatively affected by €/GBP trend,
which contributed with a loss of -€0.3 mln in 9M’16 vs
a profit of +€0.2 in 9M’15
* * Performance Advertising Division Sold in March 2015
8.5
Financials & KPIs
* Including Bank Commissions on Credit card payments: € 0.8 mln as of 30 Sept 2016 and 30 Sept 2015

35
NFPDEC2015
OPERATING ACTIVITIES
NFPSEP
2016
9M ‘16 Cash Flow
27.9 29.4+7.9
€ MLN
-4.5 -1.7
INVESTINGACTIVITIES
FINANCING*ACTIVITIES
Net Operating Cash Flow :
Operating Cash Flow + NWC Chg
+ Income Taxes + Interests Paid
*
6.25.8
9M 2015
9M2015
NET OPERATING CASH FLOW*IMPROVED
€ MLN
9M 2016
+6%
-3.2
SFERA ACQUISITION
Financials & KPIs
* Including Bank commissions on Credit card payments: € 0.8 mln as of 30 Sept 2016

11.8
21.7
-4.1
36
9M‘16 Net Financial Position
Cash = Cash, bank and post office deposits*
9M2015
€ MLN
11.2
20.4
-3.7
SHORT TERM DEBT
MLT DEBT
CASH*
30 SEP2016
31 DEC2015
NFP € 27.9 mlnNFP € 29.4 mln
Financials & KPIs

o DADA at a Glance
o Business Overview
o Market & Positioning
o Financials & KPIs
o Strategic Guidelines
o Investment Highlights
Agenda

Key Pillars of Future Strategy & 2016 Guidelines
Strategic Guidelines 38
STRATEGIC POSITIONING
o Increase Mkt Share in
core geographies
o Broaden range of
services in “We do it for
you” mode
o Strengthen positioning
in Cloud Hosting,
Virtual Dedicated &
Private Servers
KEY REVENUES & PROFITABILITY
DRIVERS
o Build Volumes – New
Clients
o Enhance Retention Rate
and Upselling Activities –
increase ARPU
o Finalize Platforms
Integration
o Increase COA efficiency
BOOST OPPORTUNITIES
o Major offline/ online
push – Organic
Growth
o Small Portfolio
acquisition to
increase mkt share /
add new services
STRENGTHEN EUROPEAN LEADING POSITION & FURTHER IMPROVE FINANCIALS
o Mid-single digit
Revenues increase - on
a like for like basis
o Operating Margins expected to grow in
4Q’16 vs 4Q’15 also
benefitting from
operating initiatives
implemented in the last
months
2016 GUIDELINES

Agenda
o DADA at a Glance
o Business Overview
o Market & Positioning
o Financials & KPIs
o Strategic Guidelines
o Investment Highlights

Investment Highlights 40
Large and Underserved Addressable Market1Leading Position in European Core Geographies2Successful Business Model: Broad and High Value Suite of Products, Powerful & Proprietary Infrastructure, Owned & Local Oustanding Customer Care3Good Revenues Visibility & Predictability 4Significant Economies of Scale with Volumes Growth5Data–Driven Understanding & Managing of Customer Base & Customer Acquisition6Successful Track Record in Revenue Consolidation, Cost Optimization & M&A7

Orascom
TMTI*
69.43%Aruba Spa
5.03%
Other Investors < 5%
25.54%
Overview
DADA Share 41
DADA AS OF FEB 17th 2017MARKET
PRICE
NOSH
MKT CAP
PERFORMANCE -3M
RELATIVE PERF vs STAR INDEX -1Y
AVERAGE DAILY VOLUMES Year to Date €
STAR SEGMENT – MTA
€ 2.9
N.16.7 MLN
€ 48.3 MLN
+40.5%
+23.5%
€ 147,069
SHAREHOLDING STRUCTUREAs of FEB 17th 2017
*Through its wholly-owned subs. Libero Acquisition S.à.r.l.
1,50
1,70
1,90
2,10
2,30
2,50
2,70
2,90
3,10
3,30
0
100
200
300
400
500
600
700
800
900
2-feb-16 2-mar-16 2-apr-16 2-mag-16 2-giu-16 2-lug-16 2-ago-16 2-set-16 2-ott-16 2-nov-16 2-dic-16 2-gen-17 2-feb-17
OFFICIAL PRICES & VOLUMES - 02 Feb 2016 - 17 Feb 2017Volume n.000 Price €

42
APPENDIX

43
9M2015 9M2014
9M ‘16 – Dada Group Consolidated P&L
9M 2016 9M 2015 Delta vs 2015€/mln
9M 2016 Financials & KPIs
* income €2.2 mln from the transfer of ProAdv Bu to 4W Markeplace
44
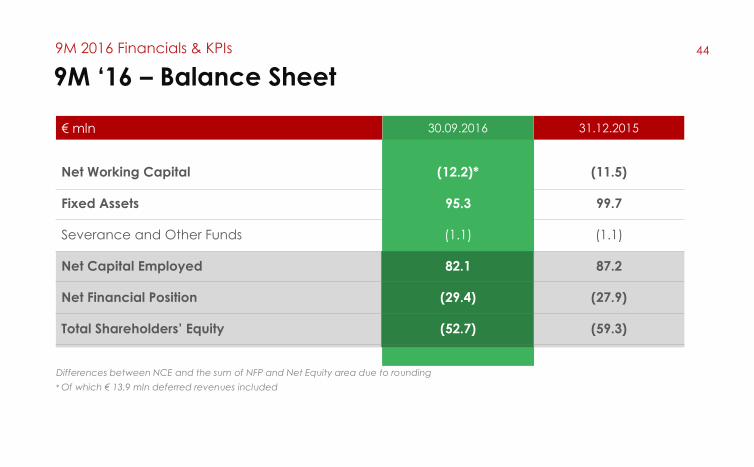
9M ‘16 – Balance Sheet
€ mln 30.09.2016 31.12.2015
Net Working Capital (12.2)* (11.5)
Fixed Assets 95.3 99.7
Severance and Other Funds (1.1) (1.1)
Net Capital Employed 82.1 87.2
Net Financial Position (29.4) (27.9)
Total Shareholders’ Equity (52.7) (59.3)
Differences between NCE and the sum of NFP and Net Equity area due to rounding
* Of which € 13.9 mln deferred revenues included
9M 2016 Financials & KPIs

45
9M ‘16 – NPF Breakdown
€ mln 30.09.2016 31.12.2015
Cash, bank and post office deposits 4.1 3.7
Credit lines, account overdrafts and current bank borrowings (11.7) (11.1)
Non-current bank borrowings (M/L T) (21.6) (20.3)
Derivatives (0.2) (0.1)
NPF (29.4) (27.9)
9M 2016 Financials & KPIs

46
9M ‘16– Cash Flow Statement
€ mln 9M 2016 9M 2015
Cash and Cash Equivalents at the Beginning of Period (8.8) (16.8)
Group Net Profit (Loss) 0.2 2.3
Gross Operating Cash Flow 8.0 8.4
Working capital, Income taxes and Interest paid (1.9) (2.6)
Net Operating Cash Flow 6.2 5.8
Capex & Investing Activities (5.4) (0.7)
Financing Activities (0.2) 6.4
Free Cash Flow 0.6 11.5
Cash and Cash Equivalents at the End of Period (8.3) (5.3)
9M 2016 Financials & KPIs

Structure as of January 2017
Corporate Group
100%FUEPS.
SRL
100%NAMESCO LTD
100
%NAMESCO INC
100%POUNDHOST INTERNET LTD
100%SIMPLY.COM LTD
100%SIMPLY VIRTUAL
SERVER LTD
100%SIMPLY TRANSIT LTD
100%NDO LTD
100%NAMESCO IRELAND LTD
100%NOMINALIA INTERNET SL
100%AMEN NETHERLAND BV
100%AMEN NETHERLAND BV
100%AMENWORLDSERVICIOS INTERNET SOCIEDAD UNIPERSONAL LDA
100%
AGENCE DE MEDIAS NUMERIQUE SAS
100%ETINET SRL
100%CLARENCE SRL100%REGISTER.IT SPA
AMENWORLDSERVICIOS INTERNET SOCIEDAD UNIPERSONAL LDA
100
%SFERA NETWORK SRL
25
%4W MARKETPLACE SRL
47

48
M&A Activity
DADA M&A
July 2006
Last 3% acquisition
August 2006
100% acquisition
May 2008
100% acquisitionJanuary 2010
100% acquisition
July 2008
100% acquisition
July 2007
100% acquisition May 2011
100% sale
March 2015
100% sale
June 2015
100% contribution
July 2015
100% acquisitionJuly 2016
100% acquisition

49
Country Brand YearEV/Ebitda
Acqu. MultipleDADA Trading
Multiple
2006 12.8x2.7x
2007
2008
2008
2010
15.1x8.6x
6.7x4.9x
5.6x6.8x
4.5x2.7x
2015 6.6x2.6xItaly
UK
UK
Spain
Ireland
France
Portugal
M&A Multiples
DADA M&A
2016 6.4x4.8x Italy

50
Many thanks!
ContactsChiara Locati
Investor Relations DADA
Tel: +39 349 8636553
All forecasts included in this document are subject to risks and uncertainties of DADA itself and of Internet, media and Telco markets.
All forecasts are based on currently available information and reflect DADA Group management expectations.
All forecasts reflect market parameters, assumptions and other fundamentals which could change and therefore influence the future results.
All the forecasts are based on an hypothesis of organic growth and commercial and regulatory stability, particularly in the mobile market.
This document does not constitute solicitation of public saving.