Embed Size (px)
Citation preview


111
Company Overview
HDIL Group
– HDIL listed on BSE/NSE in July 2007
– Over three Decades of expertise in the Real Estate Business
– Developed over 100 million sq. ft. area
Company Profile
– A major player in Mumbai Realty with 90% land Reserves in the Mumbai Metropolitan Region (MMR)
– Total Land Reserves (including TDR) of *192.96 million sq. ft. as on 31st March. 2010
– Market Leader in SRA projects
– Currently executing the largest SRA project for rehabilitation of approx. 85,000 slum dwellers under expansion & modernization of ChhatrapatiShivaji International Airport, Mumbai
– Execution and completion for Phase 1 of Airport Slum Rehab. Projects
– Currently approx 61 million sq. ft. sale area of projects under construction
– 17 ongoing projects with a combination of Residential, Commercial & Retail
– More than 4.7 million sq. ft. of Residential apartments sold
– Launched 4.5 million sq. ft. of Commercial Projects
Strong track record of performance, consistent growth and profitabilityStrong track record of performance, consistent growth and profitability
* Company estimates

22
Largest Player in Mumbai Metropolitan Region (MMR)
MMR Carmicheal Road PropertyWorli Commercial PropertyDadar PropertyBandra (E) SRS Scheme Metropolis PropertyMumbai Airport Project SRSBombay OxygenKilburn EngineeringEvereadyGhatkopar (W) PropertyHarmonyKandivali MultiplexDewanmannVasai MallSasunavghar PropertyDongre PhaseAgashiMega Township VirarVirar (E) PropertyProject Premier, Kurla (W)Project Galaxy, Kurla (E)PalgharHDIL industrial parkRental Housing VirarPanvel Property, KalamboliGoregaon (W) PropertyMalad (W) Property
Outside MMR HyderabadKochiPune
Vasai-Virar belt (Part of Thane district) Preferred residential destination, well connected with rail and road networkMajority of Mumbai’s working population resides in this regionPotential business destination/ districtHDIL is one of the largest land holders in this area
Vasai-Virar belt (Part of Thane district) Preferred residential destination, well connected with rail and road networkMajority of Mumbai’s working population resides in this regionPotential business destination/ districtHDIL is one of the largest land holders in this area
Major potential for slum rehabilitation and redevelopmentMajor investment in infrastructure in the regionPhase I of the MIAL project nearing completionSold over 4.7 million sq. ft. of Residential space during the last financial year
Major potential for slum rehabilitation and redevelopmentMajor investment in infrastructure in the regionPhase I of the MIAL project nearing completionSold over 4.7 million sq. ft. of Residential space during the last financial year
Old business district of MumbaiExploring potential options in South Mumbai
Old business district of MumbaiExploring potential options in South Mumbai
BKC
Churchgate
Virar
Bandra
Chur
chga
teto
Vit
ar(5
2 km
s)
Band
rato
Vit
ar(3
0 km
s)
Total Land in MMR 175 million sq. ft.Total Land in MMR 175 million sq. ft.

33
Diversified Project Mix
17 Ongoing Projects aggregating 60.17 million sq. ft.17 Ongoing Projects aggregating 60.17 million sq. ft.
Segment wise Project Breakup
Ongoing Projects
Ongoing ProjectsResidential 12%
Commercial 9%
Retail 2%
SRS/Redevelopment 77%
46.59 mn
7.18 mn
5.43 mn
0.97 mn

4
Consolidated Data (Ongoing Projects)
Project
Saleable Area
(in sq ft)Average Sales Rate (in Rs.)
Expected Sales Realisation (in Rs.) Completion Period
Rehabilitation Area (in sq ft)
Premiere (Kurla, West) 10,00,000 5700 5,70,00,00,000 F.Y 11-12 75,00,000
Galaxy (Kurla, East) 4,75,000 4500 2,13,75,00,000 F.Y 11-12 8,00,000
Metropolis (Andheri, West) 6,50,000 9000 5,85,00,00,000 F.Y 12-13 -
Majestic (Bhandup) 13,00,000 6500 8,45,00,00,000 F.Y 12-13 9,00,000
Residency Park (Virar) 12,50,000 2600 3,25,00,00,000 F.Y 11-12 -
Harmony (Goregaon, West) 65,850 8451 55,64,98,350 F.Y 11-12 -
47,40,850 259,439,98,350 92,00,000
Residential Projects:
ProjectSaleable Area
(in sq. ft.) Sales (%) Leasing (%)
Metropolis (Andheri, West) 10,20,000 - ~20%
Premier (Kurla, West) 20,00,000 - -
HDIL Industrial Park (Virar) 15,00,000 ~90% -
Harmony (Goregaon, West) 43,858 ~75% -
45,63,858
Sales to be recognised- Approx. Rs. 2600 crores
Commercial Projects:

5
Residential Projects- Construction UpdateResidential Projects- Construction Update
Metropolis Premiere

6
Location Kurla, West
Launch Date 6th March, 2009
Total Saleable Area 10,00,000 sq. ft.
Average Size 1,000 sq. ft.
Type 1 BHK/2 BHK
Launch Rate Rs. 5251/ sq. ft
Current rate Rs. 6351/ sq. ft
Units offered 1,050
Sold > 95%
Premier- Kurla (W)
Week 3, Feb 10 Week 4, May 10
1

7
Location Kurla, East
Launch Date 10th April, 2009
Total Saleable Area 4,75,000 sq. ft.
Average Size 600 sq. ft.
Type 1 BHK/2 BHK
Launch Rate Rs. 4251/ sq. ft
Current rate Rs. 5251/ sq. ft + flr rise
Units offered 450
Sold > 90%
Galaxy- Kurla (E)
Week 3, Feb 10 Week 4, May 10
2

8
Location Andheri, West
Launch Date 20th March, 2009
Total Saleable Area 6,50,000 sq. ft.
Average Size 1,500 sq. ft.
Type 2 BHK/3 BHK/4 BHK
Launch Rate Rs. 7651/ sq. ft
Current rate Rs. 11, 500/ sq. ft + flr rise
Units offered 414
Sold > 95%
Metropolis- Andheri (W)
Week 3, Feb 10 Week 4, May 10
3

9
Location Bhandup
Launch Date 29th October, 2009
Total Saleable Area 13,00,000 sq. ft.
Average Size 1,100 sq. ft.
Type 2 BHK/3 BHK
Launch Rate Rs. 5751/ sq. ft
Current rate Rs. 5751/ sq. ft
Units offered 1,000
Sold > 40%
Majestic- Bhandup (W)
Week 4, May 10Week 3, Feb 10
4

10
Residency Park- Virar (W)
Location Virar
Launch Date January, 2010
Total Saleable Area 12,50,000 sq. ft.
Average Size 650 sq. ft.
Type 1 BHK/2 BHK
Launch Rate Rs. 2521/ sq. ft
Current rate Rs. 2650/ sq. ft
Units offered 728
Sold > 75%
Week 3, Feb 10 Week 4, May 10
5

11
Location Goregaon (W)
Launch Date May, 2010
Total Saleable Area 43858 sq. ft
Average Size 1160-1180 sq. ft
Launch Rate Rs. 8451/ sq. ft
Current rate Rs. 8751/ sq. ft
Units offered 38
Sold ~ 95%
Harmony- Goregaon (W)
Week 4, May 10
6

12
Meadows- Goregaon (W)
Location Goregaon (W)
Launch Date June, 2010
Total Saleable Area 46,00,000 sq. ft
Residential Area-Phase 1 20,00,000 sq. ft
Construction Start Date April, 2010
Launch Rate -
Units offered ~ 2000
7

13
Commercial Projects- Construction UpdateCommercial Projects- Construction Update
Harmony Metropolis

14
HDIL Industrial Park- Virar (W)
Location Virar
Launch Date September, 2009
Total Saleable Area 15,00,000 sq. ft.
Launch Rate Rs. 2100/ sq. ft
Current rate Rs. 2375/ sq. ft
Units offered 1068
Sold ~90- 95%
Week 3, Feb 10 Week 4, May 10
1

15
Metropolis- Andheri (W)
Location Andheri (W)
Launch Date July, 2009
Total Saleable Area 10,20,000 sq. ft.
Type Lease Model
Average Lease Rent ~ Rs. 140/ sq. ft
Pre-Leasing ~ 20%
Week 4, May 10Week 3, Feb 10
2

16
Harmony- Goregaon (W)
Location Goregaon (W)
Launch Date May, 2010
Total Saleable Area 65,850 sq. ft
Average Size 250-600 sq. ft
Launch Rate
Rs. 14,500/ sq. ft (Gr. Flr)
Rs. 12,501/ sq. ft (1st Flr)
Current rate
Rs. 14,500/ sq. ft (Gr. Flr)
Rs. 12,501/ sq. ft (1st Flr)
Units offered 163
Sold ~ 75%
Week 4, May 10
3

1717
4
23
12
11 10
9
13
8
7
6
1
27
26
30
29
28
25
32
5
4
22
3
2
31
14
15
20
17
18
19
16
21
31A
PRIORITY 1
PRIORITY 2
PRIORITY 2A
PRIORITY 3
Largest Urban Rehabilitation Scheme in India Rehabilitation > 1 million peopleNo. of Hutments – 85,000 approx.Scale similar to Town Planning & Urban Renewal SchemeVital Public Infrastructure Project.Approved FSI of 4Airport Modernization & Expansion Provide World Class InfrastructureGeneration of more than 10,000 jobs over next few years
MIAL Rehabilitation Project: Uplifting face of Mumbai
HIGHLIGHTS
MIAL Project would help in uplifting the face of MumbaiMIAL Project would help in uplifting the face of Mumbai

1818
PremiereSite
Kurla Station
Vidyavihar Station
L B
S Ro
ad
N
BKC
18
Aerial Snapshot of MIAL Phase I Rehab. Sites
Bhandup
Kurla
Airport
1
2
3
HIGHLIGHTS
Premiere Kurla Bhandup
No. of Families
18,000 –20,000 2000 2500
Rehab. Area (Sq. ft.) 6 mn. 0.5 mn. 0.7 mn.
Project Start Date May 08 May 08 Sep 09
Work completd > 75 % > 75 % >25%
< 10 km
< 2.5 KM
< 1 km
N
N

19
MIAL Rehabilitation Project- Phase 1
8mn sq ft of rehabilitation
0.5 mn sq ft of amenities
25,000 apartments
Completed > 75% (in 2 yrs)
Relocation < 3 months

20
Amenities for Project Premiere/Galaxy/Majestic (Slum Rehabilitation- Phase 1)
Sr. No Amenities Features
1. Internal Roads 6m, 9m and 12 m roads to be constructed
2. S.W.D Provided on both sides of the road
3. Electrical Lamp Post 625 nos.
4. Electrical Sub- Station 6 nos.
5. Receiving Station 2000 sq.m
6. Sewage Treatment Plant Capacity- 10,500 M3
7. Electrical Machineries and Cablesi) 1250 KVA Transformer- 14 nos.
ii) 110 KVA Receiving Transfer-2 nos.
8. Hospital Building Gr + 7 floors
Investment of ~Rs. 300 crores

21
Amenities for Project Premiere/Galaxy/Majestic (Slum Rehabilitation- Phase 1)
9. Educational Institutions
i) School
ii) Science, Commerce and Arts College
iii) I.I.T College
iv) Central Library
v) Cafeteria
vi) Fine Arts College
vii) Appheel Art College
10. Social Infrastructure
i) Police Station
ii) Bank
iii) Gymnasium and Indoor Games
iv) Community Hall and Library
v) Post Office
vi) Utility Service Road
11. B.M.C Drainage Total Length- 774 Rmts.
Investment of ~Rs. 300 crores

22
Virar Rental Housing Project
22
Executing Largest Rental Housing Scheme in Mumbai Metropolitan Region since 1947 with MMRDA Executing Largest Rental Housing Scheme in Mumbai Metropolitan Region since 1947 with MMRDA
HIGHLIGHTS
Largest Rental Housing Scheme in MMR since 1947 Development of 525 acres aggregating to 56 million sq. ft. of built up area - FSI of 4Completion in 4 phases by 2015Approx. 40,000 rental units of 160 sq. ft. carpet area aggregating to 13 million sq. ft. of built up area to be given to MMRDA free of costHDIL to generate 50 million sq. ft. of saleable areaRevenue visibility from sale of FSI as well as constructed areaDevelopment of 4 million sq. ft. of Social InfrastructureEnvironment Management Plan
RENTAL HOUSING SECTORRENTAL HOUSING SECTOR
FREE SALE HOUSING SECTORFREE SALE HOUSING SECTOR

2323
Financial OverviewFinancial Overview

*** Cash on 31/3/10 = Rs. 787.38 crs
Net Debt = Rs. 3264.34 crs
Net Debt/ Equity= 0.45
Housing Development and Infrastructure Limited
Rs. in crores
Stand alone Consolidated
Quarter ended Quarter ended Year ended Year endedParticularsGrowth %
3/31/2010 3/31/2009 3/31/2010 12/31/2009Growth %
3/31/2010 3/31/2009 3/31/2010 3/31/2009
Turnover (Net) 434.07 357.86 21.30% 434.07 408.88 6.16% 1,491.99 1,719.29 1,502.12 1,728.44
Other Income 30.39 30.92 1.71% 30.39 26.59 14.29% 107.59 95.28 34.51 53.98
Total Income 464.46 388.78 19.46% 464.46 435.47 6.66% 1,599.58 1,814.57 1,536.63 1,782.42
PBT 230.85 96.87 138.32% 230.85 195.18 18.28% 735.28 815.33 705.19 765.63
PBT % to income 49.70% 24.92% 49.70% 44.82% 45.97% 44.93% 45.89% 42.95%
EBIDTA 257.51 127.42 102.11% 257.51 215.36 19.57% 819.29 877.19 823.77 833.71
EBIDTA % to income 55.44% 32.77% 55.44% 49.46% 51.22% 48.34% 53.61% 46.77%
PAT 183.47 61.91 196.33% 183.47 162.76 12.72% 602.30 721.21 572.23 671.37
PAT % to income 39.50% 15.92% 39.50% 37.38% 37.65% 39.75% 37.24% 37.67%
Net worth 7,117.74 4,467.65 59.32% 7,117.74 6,806.91 4.57% 7,117.74 4,467.65 7,042.87 4,421.82
Debt*** 4,051.72 4,143.32 -2.21% 4,051.72 3,351.25 20.90% 4,051.72 4,143.32 4,101.72 4,143.32
Debt Equity ratio 0.57 0.93 0.57 0.49 0.57 0.93 0.58 0.94
EPS -Basic 5.14 2.25 5.14 4.71 18.23 30.14 17.35 28.57
Inventories 8,033.66 6,441.70 24.71% 8,033.66 7,557.75 6.30% 8,033.66 6,441.70 8,756.65 6,912.80
Financial Performance/ Ratios

Standalone FinancialsStandalone Financials

SOURCES OF FUNDS SchedulesShareholders' fundsShare capital A 3,588,426,760 2,754,926,760 Reserves and surplus B 66,809,008,378 41,921,529,288 Share warrant 780,000,000 71,177,435,138 - 44,676,456,048
Loan funds CSecured loans 40,517,169,430 40,933,197,165 Unsecured loans - 40,517,169,430 500,000,000 41,433,197,165
Deferred tax liability D 53,331,845 24,015,192
Total 111,747,936,413 86,133,668,405
APPLICATION OF FUNDSFixed assets E
Gross block 1,905,307,862 629,284,465 98,307,030 48,938,205
Net block 1,807,000,832 580,346,260 Capital work-in-progress 22,803,833 1,829,804,665 147,160,778 727,507,038
Investments F 5,964,763,586 3,029,192,908
Current assets, loans and advancesInventories G 80,336,624,006 64,416,959,166 Sundry debtors H 2,007,175,938 1,653,973,927 Cash and bank balances I 7,873,879,147 751,652,648 Other current asset J 27,907,283 20,130,323 Loans and advances K 22,053,163,267 21,830,007,474
112,298,749,641 88,672,723,538 Less : Current liabilities and provisionsCurrent liabilities L 8,022,747,781 6,114,809,433 Provisions M 322,633,698 180,945,646
8,345,381,479 6,295,755,079 Net current assets 103,953,368,162 82,376,968,459
N - -
111,747,936,413 86,133,668,405
Miscellaneous expenditure (to the extent not written off or adjusted)
31-Mar-200931-Mar-2010
Less : Accumulated depreciation
(Amount in Rs.)(Audited)
Housing Development and Infrastructure Limited Balance Sheet as at
(Audited)(Amount in Rs.)

Quarter ended Quarter ended Quarter ended Year ended Year endedSchedules 31-Mar-2010 31-Dec-2009 31-Mar-2009 31-Mar-2010 31-Mar-2009
(Audited) (Unaudited) (Audited) (Audited) (Audited)(Amount in Rs.) (Amount in Rs.) (Amount in Rs.) (Amount in Rs.) (Amount in Rs.)
INCOMETurnover O 4,340,723,892 4,088,765,646 3,578,619,065 14,919,917,617 17,192,904,194 Other income P 303,881,541 265,897,812 309,227,863 1,075,907,120 952,839,865
4,644,605,433 4,354,663,458 3,887,846,928 15,995,824,737 18,145,744,059 EXPENDITUREVariation in stock in trade Q 251,423,369 (926,610,547) (672,252,939) (391,507,225) (1,373,109,987) Variation in work-in-progress R (5,010,589,138) (2,855,444,444) (1,482,047,507) (15,528,157,615) (12,015,366,721) Transfer to Investment / Fixed assets (193,478,550) (281,438,829) (54,065,986) (690,716,779) (61,869,585)
S 5,572,842,015 5,062,338,845 3,514,647,331 19,147,668,693 16,537,164,636 Project specific interest T 1,176,116,191 963,063,518 1,075,646,778 4,366,496,459 5,202,139,469 Employees' remuneration and welfare expenses U 78,173,524 72,924,236 41,147,767 260,281,700 198,883,018 Administrative expenses V 195,061,769 166,186,905 190,640,633 638,890,270 886,012,880 Interest T 245,021,365 190,155,149 296,596,400 788,999,281 579,711,259 Depreciation / Amortisation 21,485,839 11,676,435 8,860,540 51,028,438 23,562,129 Preliminary and other expenses written off - - - - 15,350,724
2,336,056,384 2,402,851,268 2,919,173,017 8,642,983,222 9,992,477,822 Operating Profit before Tax 2,308,549,049 1,951,812,190 968,673,911 7,352,841,515 8,153,266,238 Less :Provision for tax 459,800,000 314,600,000 348,096,290 1,300,000,000 918,965,290 Less:-Provision for Fringe benefit tax - - (1,302,359) - 12,995,641 Less:-Provision for Wealth tax 224,351 110,541 73,000 568,471 334,000 Less :Deferred tax liability 13,807,021 9,479,921 2,670,090 29,316,652 8,893,583 Operating Profit after Tax 1,834,717,677 1,627,621,728 619,136,890 6,022,956,392 7,212,077,724 Balance brought forward from previous quarter / year 7,767,474,901 8,614,853,173 13,421,806,171 6,054,236,187 5,736,706,874 Add : MAT credit entitlement - - - - 336,604,329 Add/ Less :Excess/ (Short) Provision for taxation no longer required (56,351,232) - - (56,351,232) 755,554,134 Profit available for appropriation 9,545,841,346 10,242,474,901 14,040,943,061 12,020,841,346 14,040,943,061 Appropriations :Less : Transferred to General Reserve - - 5,736,706,874 - 5,736,706,874 Less : Transferred to Debenture Redemption Reserve 3,716,600,000 2,475,000,000 2,250,000,000 6,191,600,000 2,250,000,000 Profit Carried to Balance Sheet 5,829,241,346 7,767,474,901 6,054,236,187 5,829,241,346 6,054,236,187
Earnings per share - Basic (Amount in Rs.) 5.14 4.71 2.25 18.23 30.14 - Diluted (Amount in Rs.) 4.98 4.56 2.25 17.81 30.14Equity shares of per value Rs. 10/- eachNumber of shares used in computing earnings per share
Basic 345,987,120 345,842,676 275,492,676 327,375,278 275,492,676 Diluted 357,261,992 356,551,009 275,492,676 334,996,367 275,492,676
Cost of construction, Land and development expenses
Housing Development and Infrastructure Limited Profit and Loss Account for the

A Cash flow from operating activitiesNet profit before tax 2,308,549,049 7,352,841,515 8,153,266,238 Adjustments for :
(1) Depreciation 21,485,839 51,028,438 23,562,129 (2) Preliminary expenses written off - - 15,350,724 (3) Interest expenses 245,021,365 788,999,281 579,711,259 (4) Profit on sale of units of mutual funds (359,670) (12,723,960) (1,769,865) (5) Interest received (211,181,491) (793,484,456) (569,319,376) (6) Dividend received (6,719) (626,819) (337,500) (7) Loss on sale of investment 10,835,730 10,835,730 (8) Loss on sale of asset 214,907 66,009,961 1,536,988 45,565,202 315,804 47,513,175
Operating profit before working capital changes 2,374,559,010 7,398,406,717 8,200,779,413 Movements in working capital :
Decrease / (Increase) in inventory (4,952,644,319) (16,610,381,618) (13,388,476,708) Decrease / (Increase) in sundry debtors 266,799,869 (353,202,011) (1,095,659,652) Decrease / (Increase) in other receivables 1,279,789,735 (230,932,753) (5,507,598,440) (Decrease) / Increase in trade and other payables 1,006,462,443 1,894,191,048 1,206,431,662
Net movement in working capital (2,399,592,272) (15,300,325,334) (18,785,303,138) Cash generated from operations (25,033,262) (7,901,918,617) (10,584,523,725) Less : Direct taxes paid (net of refunds) 218,829,525 1,201,484,351 628,140,168 Net cash from operating activities (243,862,787) (9,103,402,968) (11,212,663,893)
B Cash flows from investing activities(1) (Increase) / Decrease in capital WIP (5,197,536) (124,938,401) (94,914,525) (2) (Increase) / Decrease in investments (net) (943,397,847) (2,992,685,476) (903,642,630) (3) Interest received 211,181,491 793,484,456 569,319,376 (4) Dividend received 6,719 626,819 337,500 (5) Purchase of fixed assets (241,355,591) (294,219,820) (77,538,025) (6) Profit on sale of UTI Mutual Fund 359,670 12,723,960 1,769,865 (7) Sale of fixed assets 741,014 1,291,014 246,000
Net cash from investing activities (977,662,080) (2,603,717,448) (504,422,439)
C Cash flows from financing activities(1) Proceeds from borrowings 9,517,062,641 19,811,424,826 25,013,701,632 (2) Repayment of borrowings (2,512,392,485) (20,727,452,561) (14,707,937,294) (3) Proceeds from share warrant 1,330,000,000 3,900,000,000 - (4) Increase in share capital including share premium - 16,884,000,000 - (5) Share issue expenses - (249,626,069) - (6) Dividend paid (including dividend distribution tax) - - (751,321,133) (7) Interest paid (245,021,365) (788,999,281) (579,711,259)
Net cash used in financing activities 8,089,648,791 18,829,346,915 8,974,731,946
Net increase in cash and cash equivalents (A + B + C) 6,868,123,924 7,122,226,499 (2,742,354,386) Cash and cash equivalents at the beginning of the year/period 1,005,755,223 751,652,648 3,494,007,034 Cash and cash equivalents at the end of the year /period 7,873,879,147 7,873,879,147 751,652,648
Components of cash and cash equivalents as at 31-Mar-2010 31-Mar-2010 31-Mar-2009Cash on hand 60,052,874 60,052,874 9,277,253 With banks - on current account 2,913,279,160 2,913,279,160 214,810,799 - on deposit account 4,900,547,113 4,900,547,113 527,564,596
7,873,879,147 7,873,879,147 751,652,648 - - -
(Audited)(Amount in Rs.)
(Audited)
Quarter ended Year Ended Year ended
(Audited)(Amount in Rs.) (Amount in Rs.)
31-Mar-2009
Housing Development and Infrastructure Limited Cash Flow Statement for the
31-Mar-2010 31-Mar-2010

Consolidated FinancialsConsolidated Financials

31-Mar-2010 31-Mar-2009(Amount in Rs.) (Amount in Rs.)
SOURCES OF FUNDS SchedulesShareholders' fundsCapital A 3,588,426,760 2,754,926,760
Reserves and surplus B 66,060,261,992 41,463,273,949
Share warrant 780,000,000 -
Loan funds CSecured loans 41,017,169,430 40,933,197,165 Unsecured loans - 500,000,000
Minority interest 45,584 31,774
Deferred tax liability D 63,105,048 30,259,414
Total 111,509,008,814 85,681,689,062
APPLICATION OF FUNDSFixed assets E
Gross block 1,936,800,125 653,829,930
Less : Depreciation 106,784,264 56,199,535
Net block 1,830,015,861 597,630,395 Capital work-in-progress 216,945,996 151,705,101
2,046,961,857 749,335,496
Goodwill on consolidation F 2,590,602,552 478,469,247
Investments G 2,429,077,098 2,490,875,420
Deffered tax assets H 11,865,923 6,492,996
Current assets, loans and advancesInventories I 87,566,529,045 69,128,001,031 Sundry debtors J 2,029,890,901 1,669,113,714 Cash and bank balances K 7,917,678,438 754,892,904 Other current asset L 27,911,928 20,130,807 Loans and advances M 15,649,294,149 17,077,242,227
113,191,304,461 88,649,380,683 Less : Current liabilities and provisionsCurrent liabilities N 8,435,608,679 6,520,427,305 Provisions O 325,194,398 172,437,475
8,760,803,077 6,692,864,780 Net current assets 104,430,501,384 81,956,515,903
P - -
Total 111,509,008,814 85,681,689,062
Housing Development and Infrastructure Limited
Miscellaneous expenditure (to the extent not written off or adjusted)
Consolidated Financial Statements for the year ended

Schedules 31-Mar-2010 31-Mar-2009(Amount in Rs.) (Amount in Rs.)
INCOMETurnover Q 15,021,244,889 17,284,413,785 Other income R 345,100,818 539,832,062
15,366,345,707 17,824,245,847 EXPENDITUREVariation in stock in trade S (403,873,063) (1,373,447,715)Variation in work-in-progress T (17,621,738,842) (12,525,837,176)Transfer to Investment / Fixed assets (696,668,903) (61,869,585)Cost of Construction, development and operating expenses U 20,135,917,120 16,951,695,560 Project specific interest V 4,772,105,849 5,367,472,180 Employees' remuneration and welfare expenses W 285,071,571 220,751,075 Administrative expenses X 657,814,584 908,351,627 Interest V 461,832,027 581,735,737 Depreciation, amortisation and impairment 723,116,223 83,713,639 Preliminary expenses written off 847,936 15,380,447
8,314,424,502 10,167,945,788 Operating profit before tax 7,051,921,204 7,656,300,059 Less :Provision for tax 1,301,588,635 920,777,153 Less:-Provision for fringe benefit tax - 13,362,320 Less: Provision for wealth tax 568,471 334,000 Less :Deferred tax liability 30,344,470 8,959,825 Add : MAT Credit entitlement - 816,759 Add :Deferred tax asset 2,845,416 42,627 Profit after tax (before adjustment for minority interest) 5,722,265,044 6,713,726,147 Less : Minority interest 133,167 (5,460,761)Balance brought forward from previous year 5,544,435,483 5,723,893,346 Add : MAT Credit entitlement - 336,604,329 Add:-Excess provision for taxation no longer required 1,542 757,711,639 Add : Deffered tax asset for earlier year - 295,992
56,380,569 9,812 Less: Deffered tax liabilities for earlier year 27,835 - Less : Preliminary expenses written off - 728,224 Less : Share issue expenses - 405,456 Add: Profit on delink of subsidiary 12,847,756 - Adjustments for subsidiaries added - (113,450)Profit available for appropriation 11,223,008,255 13,536,435,272 Appropriations :Transferred to General Reserve - 5,736,706,874 Transferred to Debenture Redumption Reserve 6,191,600,000 2,250,000,000 Profit (after adjustment for minority interest) 5,031,408,255 5,549,728,398 Less : Losses of minority adjusted against majority interest 2,280,613 5,406,365 Less : Preacquisition profit 178,046 (113,450)Profit carried to Balance sheet 5,028,949,596 5,544,435,483
Earnings per share - Basic (Amount in Rs.) 17.35 28.57 - Diluted (Amount in Rs.) 16.95 28.57 Equity shares of par value Rs. 10/- eachNumber of shares used in computing earnings per share
Basic 327375278 275492676Diluted 334996367 275492676
Less: Short provision for income tax/fringe benefit tax for earlier year
Housing Development and Infrastructure LimitedConsolidated Profit and Loss Account for the year ended

A Cash flow from operating activitiesNet profit before tax 7,051,921,204 Adjustments for :
(1) Depreciation / amortisation 723,116,223 (2) 847,936 (3) Interest expenses 461,832,027 (4) Interest received (59,641,359) (5) Income from investments (13,480,779) (6) Loss on sale of Investment 10,835,730 (7) Profit on sale of assets (45,142) (8) Loss on sale of assets 1,536,988 1,125,001,624
Operating profit before working capital changes 8,176,922,828 Movements in working capital :
Decrease / (Increase) in inventory (19,135,196,917) Decrease / (Increase) in sundry debtors (360,777,187) Decrease / (Increase) in other receivables 1,418,944,031 Increase / (Decrease) in trade and other payables 1,924,757,848
Net movement in working capital (16,152,272,225) Cash generated from / (used in) operations (7,975,349,397) Less : Direct taxes paid (net of refunds) 1,201,760,967 Net cash from / (used in) operating activities (9,177,110,364)
B Cash flows from investing activities(1) Sale of fixed assets 1,368,514 (2) Sale / (Purchase) of investments 4,683,524 (3) Interest received 59,641,359 (4) Income from investments 13,480,779 (5) (Increase) / Decrease in capital work-in-progress (316,554,587) (6) Purchase of fixed assets (including additional Goodwill) (3,107,654,737) (3,345,035,148)
Net cash from / (used in) investing activities (3,345,035,148)
C Cash flows from financing activities(1) Proceeds from issue of equity shares 16,884,000,000 (2) Proceeds from Share warrant 3,900,000,000 (3) Proceeds from borrowings 20,311,424,826 (4) Repayments of borrowings (20,727,452,561) (5) Interest paid (461,832,027) (6) Dividend paid (including dividend distribution tax) (26,094) (7) Preliminary expenses - (8) Expenses towards increase in share capital (248,455,659) 19,657,658,485
Net cash from/ (used in) financing activities 19,657,658,485
Net increase / (decrease) in cash and cash equivalents (A + B + C) 7,135,512,973
Cash and cash equivalents at the beginning of the year 754,892,904 Less : Delink of subsidiary (44,661) Add : Upon addition of new subsidiaries 27,317,222 782,165,465
Cash and cash equivalents at the end of the year 7,917,678,438
Components of cash and cash equivalents as at 31st March 2010Cash on hand 65,914,866 With banks - on current account 2,951,166,459 - on deposit account 4,900,597,113
7,917,678,438
Expenses of increasing authorised share capital written off
(Amount in Rs.)
Housing Development and Infrastructure LimitedConsolidated Cash Flow Statement for the year ended
31-Mar-2010

3333
Annexure 1: SRSAnnexure 1: SRS

3434
HDIL is executing largest SRA project in India of Mumbai International Airport Slum RehabilitationHDIL is executing largest SRA project in India of Mumbai International Airport Slum Rehabilitation
Leader in Slum Rehabilitation Scheme (SRS)
SRS
Non-SRS
Low cost of land
High cost of land
Long Gestation
Short Gestation
High entry barriers
Low entry barriers
Low Cost High Margin Business
DeveloperLand resources are scarce in urban cities like MumbaiCost of land is only the cost of construction for Rehab of slum dwellersAdditional FSI up to 3 timesFor higher slum density FSI up to 4
DeveloperLand resources are scarce in urban cities like MumbaiCost of land is only the cost of construction for Rehab of slum dwellersAdditional FSI up to 3 timesFor higher slum density FSI up to 4
Slum DwellersRehabilitation in 269 sq. ft. tenements free of cost
GovernmentHelps government fulfill social obligationsRelease of land for infrastructure development purposes
Slum DwellersRehabilitation in 269 sq. ft. tenements free of cost
GovernmentHelps government fulfill social obligationsRelease of land for infrastructure development purposes
Key Benefits to Stakeholders
3535
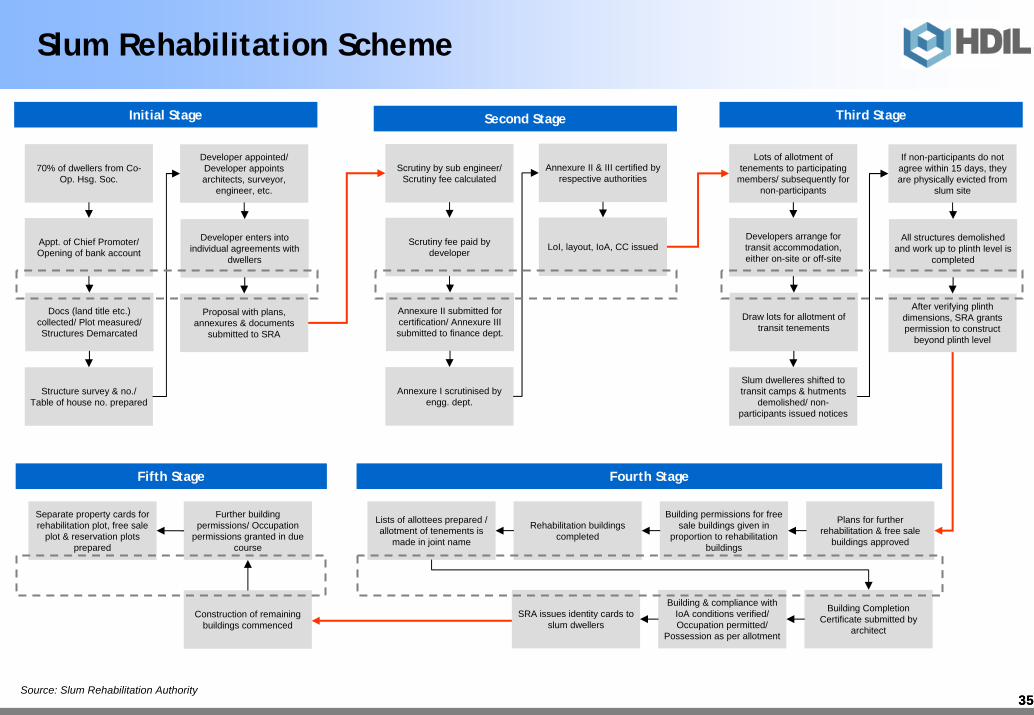
Slum Rehabilitation Scheme
Source: Slum Rehabilitation Authority
70% of dwellers from Co-Op. Hsg. Soc.
Appt. of Chief Promoter/ Opening of bank account
Docs (land title etc.) collected/ Plot measured/ Structures Demarcated
Structure survey & no./ Table of house no. prepared
Developer appointed/ Developer appoints architects, surveyor,
engineer, etc.
Developer enters into individual agreements with
dwellers
Proposal with plans, annexures & documents
submitted to SRA
Initial Stage
Scrutiny by sub engineer/ Scrutiny fee calculated
Scrutiny fee paid by developer
Annexure II submitted for certification/ Annexure III submitted to finance dept.
Annexure I scrutinised by engg. dept.
Second Stage
Lots of allotment of tenements to participating
members/ subsequently for non-participants
Developers arrange for transit accommodation, either on-site or off-site
Draw lots for allotment of transit tenements
Slum dwelleres shifted to transit camps & hutments
demolished/ non-participants issued notices
If non-participants do not agree within 15 days, they are physically evicted from
slum site
All structures demolished and work up to plinth level is
completed
After verifying plinth dimensions, SRA grants permission to construct
beyond plinth level
Third Stage
Lists of allottees prepared / allotment of tenements is
made in joint name
Rehabilitation buildings completed
Building permissions for free sale buildings given in
proportion to rehabilitation buildings
Plans for further rehabilitation & free sale
buildings approved
SRA issues identity cards to slum dwellers
Building & compliance with IoA conditions verified/ Occupation permitted/
Possession as per allotment
Building Completion Certificate submitted by
architect
Fourth Stage
Annexure II & III certified by respective authorities
LoI, layout, IoA, CC issued
Fifth Stage
Separate property cards for rehabilitation plot, free sale
plot & reservation plots prepared
Further building permissions/ Occupation
permissions granted in due course
Construction of remaining buildings commenced

3636
Disclaimer
This investor presentation has been prepared by Housing Development and Infrastructure Ltd (“HDIL”). and does not constitute a prospectus or placement memorandum or an offer to acquire any securities. This presentation or any other documentation or information (or any part thereof) delivered or supplied should not be deemed to constitute an offer.
No representation or warranty, express or implied is made as to, and no reliance should be placed on, the fairness, accuracy, completeness or correctness of such information or opinions contained herein. The information contained in this presentation is only current as of its date. Certain statements made in this presentation may not be based on historical information or facts and may be “forward looking statements”, including those relating to the general business plans and strategy of HDIL, its future financial condition and growth prospects, future developments in its industry and its competitive and regulatory environment, and statements which contain words or phrases such as ‘will’, ‘expected to’, ‘horizons of growth’, ‘strong growth prospects’, etc., or similar expressions or variations of such expressions. These forward-looking statements involve a number of risks, uncertainties and other factors that could cause actual results, opportunities and growth potential to differ materially from those suggested by the forward-looking statements. These risks and uncertainties include, but are not limited to risks with respect to its real estate business, SEZ business and its infrastructure business.
HDIL may alter, modify or otherwise change in any manner the content of this presentation, without obligation to notify any person of such revision or changes. This presentation cannot be copied and disseminated in any manner.
No person is authorized to give any information or to make any representation not contained in and not consistent with this presentation and, if given or made, such information or representation must not be relied upon as having been authorized by or on behalf of HDIL. This presentation is strictly confidential.

Thank You