Embed Size (px)
Citation preview

Compacted Graphite Iron - Mechanical and Physical Properties
for Engine Design
©SinterCast 2012 www.sintercast.com


1
Introduction As the demand for high torque, low emissions and improved fuel economy continues to grow, engine
designers are forced to seek stronger materials for engine block construction. This is particularly true in the
diesel sector where resolution of the conflicting performance objectives requires increased cylinder bore
pressures. The bore pressures in today’s direct injection diesels hover around 135 bar while the next
generation of DI diesels are targeting 160 bar and beyond. Peak combustion pressures in heavy duty truck
applications are already exceeding 200 bar. At these operating levels, the strength, stiffness and fatigue
properties of grey cast iron and the common aluminum alloys may not be sufficient to satisfy performance,
packaging and durability criteria. Several automotive OEM’s [1-3] have therefore evaluated Compacted
Graphite Iron (CGI) for their petrol and diesel cylinder block and head applications.
Although compacted graphite iron has been known for more than forty years, and several review papers
have been published [4-11], the properties of CGI are not yet as well known as those of grey cast iron and
the common aluminum alloys. This paper therefore provides more detailed information on the mechanical
and physical properties of CGI as a function of the graphite nodularity, carbon content and the influence of
ferrite and pearlite. The data presented are primarily from tests conducted at independent laboratories,
although literature data is included and referenced where appropriate.
Microstructural Considerations
As shown in Figure 1, the graphite in compacted graphite iron (sometimes referred to as vermicular iron)
appears as individual ‘worm-shaped’ or vermicular particles. Although the particles are elongated and
randomly oriented as in grey iron, the compacted graphite particles are shorter and thicker, and have
rounded edges. While the compacted graphite particle shape may appear worm-like when viewed with a
conventional light microscope, deep-etched SEM micrographs (Figure 2) show that the ‘worms’ are
connected to their nearest neighbours within the eutectic cell. This complex graphite morphology, together
with the rounded edges and irregular bumpy surfaces, results in strong adhesion between the graphite and
the iron matrix. Ultimately, the compacted graphite morphology inhibits both crack initiation and propagation
and is the source of the improved mechanical properties relative to grey cast iron.
Figure 1: Compacted Graphite Iron
microstructure with 10% nodularity
Figure 2: Deep-etched SEM micrographs show the true three dimensional graphite morphology

2
Figure 3:
The percent nodularity of all test specimens was evaluated by image analysis using the criteria described in
Reference [12]. The micrograph presented in Figure 1 has a calculated nodularity of 10%. In addition to the
influence of nodularity, the presence of graphite flakes or discrete patches of flake-type graphite also impacts
upon the mechanical and physical properties of CGI. In order to allow the data obtained from flake-containing
microstructures to be plotted together with data from CGI and nodular microstructures, the present study
introduces a nodularity range of 0 to -5% nodularity to represent the amount of flake graphite present in the
otherwise compacted microstructure. Specimens containing isolated patches of flake graphite are assigned
nodularity ratings ranging from -1 to -5% with increasingly negative values representing increasing severity of
flake patch occurrence. A value of 0% nodularity corresponds to a fully compacted structure, while -5%
represents a fully flake graphite microstructure. The abrupt step from 0% nodularity for CGI to -5% nodularity
for grey iron is intentionally chosen to parallel the rapid transition from a fully compacted microstructure to a
flake-containing structure. In practice, this transition can occur due to a decrease of only 0.001% magnesium
in the molten cast iron. A flake patch micrograph with an assigned value of -3% nodularity is presented in
Figure 3 as a visual reference.
Finally, the pearlite content of the test specimens was evaluated visually with the criteria that pearlite-plus-
ferrite must equal 100%. Cementite (carbide) was not present in any of the test pieces. All microstructure
results are obtained directly from the test pieces after the relevant mechanical or physical property has been
evaluated. The nodularity and pearlite results represent the average value of at least three fields of view
(>10 mm2
total area) subjectively chosen to represent the bulk microstructure of the test piece.
Insufficient Magnesium treated leads to isolated flake patches in the com- pacted graphite microstructure. This micrograph is assigned a value of -3% nodularity

3
Test Piece Production The data presented in this paper were obtained from standardised test pieces produced in a production
foundry. The base iron was melted in 6 tonne coreless medium frequency induction furnaces and held in a
60 tonne coreless line frequency furnace as part of the standard base iron for ductile iron series production.
Base treatment was performed with a commercially available MgFeSi alloy followed by SinterCast analysis
and corrective additions of 5 mm magnesium and/or 9 mm diameter inoculant cored wires to obtain the
desired graphite shape. Test pieces were poured from a one-tonne production ladle. Specific details of test
piece geometry, chemistry and microstructure are provided in each section of the paper as appropriate.
Tensile Properties
The test pieces used for tensile testing were machined from as-cast cylindrical test bar samples produced
according to the ASTM A 536 standard. Three tensile specimens were machined from each bar. The tensile
tests were conducted by the ABB Corporate Research laboratories in Västerås Sweden using a Wolpert
100 kN:s universal testing machine according to the ASTM E 8M (room temperature) and ASTM E 21
(elevated temperature) norms. The individual results presented in this section represent the average of two
separate ‘pulls’ for the room temperature data and three separate ‘pulls’ for the data at 100°C and 300°C. A
total of 84 tensile tests were performed.
The experimental design of the tensile tests was established to focus on the most relevant microstructures
for the production of CGI cylinder blocks and to identify the variation in tensile properties as the
microstructure strays beyond the desired range. Thus, the materials studied can be separated into two
categories:
1 CGI with fixed (0-10%) nodularity and as-cast matrix structures ranging from 20-100% pearlite, and
2 CGI with fixed (85-100%) as-cast pearlite content and graphite shape ranging from mixed CGI/flakepatch
structures up to 90% nodularity.
Eleven different microstructure Groups were evaluated to represent the total range of cast iron
microstructures. The microstructure data and chemical composition for the eleven different microstructure
Groups are summarized in Table I while the tensile results are presented in Table II.
The change in the ultimate tensile and the 0.2% yield strength of predominantly (85-100%) pearlitic cast
irons as a function of nodularity is shown in Figure 4. While the strength gradually increases with increasing
nodularity, the presence of even a small amount of flake graphite results in a step-reduction of 20-25%
tensile strength. Extrapolation of the data suggests that a fully A-Type flake structure would have a
roomtemperature tensile strength of approximately 200 MPa at the carbon content required to produce CGI.
It is apparent from these results that flake graphite must be avoided in CGI castings.

4
Table I
Chemistry and microstructure data for tensile specimens
Group
Number
Nodularity
(%)
Pearlite
(%)
Chemical Analysis(%)
C Si Mn S Mg Cu Sn Cr Al P 1 4 25 3.63 2.49 0.42 0.014 0.007 0.42 0.039 0.02 0.008 0.010 2 4 45 3.54 2.49 0.41 0.010 0.007 0.40 0.040 0.02 0.003 0.011 3 8 50 3.54 2.50 0.41 0.012 0.010 0.41 0.040 0.02 0.003 0.011 4 7 75 3.61 2.49 0.40 0.014 0.008 0.45 0.053 0.03 0.004 0.011 5 6 94 3.59 2.48 0.39 0.013 0.011 0.71 0.094 0.03 0.007 0.011 6 -3 86 3.60 2.45 0.40 0.014 0.008 0.45 0.051 0.03 0.004 0.010 7 -2 93 3.57 2.48 0.39 0.014 0.006 0.72 0.094 0.03 0.008 0.010 8 0 99 3.58 2.48 0.39 0.016 0.010 0.71 0.094 0.03 0.008 0.010 9 33 87 3.57 2.50 0.40 0.011 0.023 0.41 0.039 0.03 0.003 0.011
10 67 90 3.50 2.47 0.41 0.010 0.027 0.44 0.052 0.02 0.003 0.011 11 80 90 3.58 2.50 0.39 0.012 0.030 0.72 0.095 0.03 0.007 0.011
Table II
Summary of tensile results as a function of temperature
Group
Number
Nodularity
(%)
Pearlite
(%)
BHN (10/3000)
(25°C)
UTS (MPa) 0.2% YS (MPa) E° (GPa) Elong (%)
25 100 300 25 100 300 25 100 300 25 100 300
1 4 25 158 298 289 270 232 220 210 138 128 139 4.0 3.1 1.6
2 4 45 174 340 314 303 261 238 240 137 126 130 3.5 2.7 1.1
3 8 50 200 332 324 299 253 239 243 143 -- -- -- 1.5 1.5
4 7 75 219 435 419 377 316 295 284 147 160 132 3.5 2.4 1.4
5 6 94 234 475 472 429 347 333 324 147 144 132 1.5 1.5 1.0
6 -3 86 202 300 285 242 232 219 195 120 124 84 2.8 1.3 0.9
7 -2 93 219 347 316 -- 273 256 220 134 114 90 1.5 0.7 0.7
8 0 99 239 440 422 391 324 308 299 148 147 142 1.5 1.1 0.9
9 33 87 239 567 533 497 359 317 300 162 172 136 4.3 3.0 3.3
10 67 90 244 649 602 566 370 337 325 168 166 159 5.8 6.9 5.0
11 80 90 239 715 672 626 412 359 347 168 151 158 5.8 6.6 4.2
Figure 4: Ultimate tensile strength and 0.2% yield strength of 85-100% pearlitic cast irons as a
function of nodularity and temperature
Ultimate Tensile Strength
0.2% Yield Strength
Nodularity (%)

5
The data of Figure 4 also indicate the effect of increasing nodularity which occurs naturally due to increased
cooling rates in the thin sections of a casting. The gradual increase in tensile strength with increasing
nodularity is validated by extrapolation of the 25°C line which tends toward 750 MPa for pearlitic ductile
(>90% nodularity) iron. However the 0.2% yield strength was measured to only increase by 5% over the
range of 0 to 50% nodularity. Other literature sources report 10% [4] and 20% [8] increases in yield strength
over the same nodularity range. Regardless of the actual amount, the strength increase from 0 to 50%
nodularity is gradual rather than a step function.
The tendency toward increased graphite nodularity and thus increased strength in thin sections may at first
appear contrary to the traditional approach to grey iron engine design, which requires graphite homogeneity
throughout the casting. With grey iron, thin sections become naturally weaker. However, the increase in the
strength of thin-section CGI may be beneficial in many product applications. In the specific example of
passenger car cylinder blocks, ‘thin’ means less than approximately 4.5 mm. If the remaining ‘thick’ sections
of the block contain 5-15% nodularity, the thin sections may contain 30-60% nodularity depending on the
gating system, their location and thus their cooling rate. As the thin walls are typically water jacket housings,
crankcase housings and ribs, there are no thermal or machining requirements and the increased strength
and stiffness of the higher nodularity material benefits the product. Microstructually inhomogeneous products
are not uncommon in the industry and include some cylinder liners, flywheels, glass bottle molds and even
the extreme examples of cast iron liners in aluminum cylinder blocks and ductile iron bearing caps or
bedplates in grey iron cylinder blocks. Specific materials are used where their properties can best contribute
to the performance of the finished component. The natural tendency of CGI toward higher nodularity in thin
sections provides opportunities to place thermally efficient low-nodularity CGI in the central portions of a
cylinder block and higher strength higher nodularity microstructures in the mechanically loaded areas. Indeed,
this approach has been advocated in recent inhomogeneous graphite cylinder block patents and patent
applications from Mazda [13] and Ford [14].
The influence of pearlite content on the tensile and 0.2% yield strengths of 0-10% nodularity CGI (Figure 5)
is linear with R-squared correlation coefficients in excess of 0.95. In consideration of the normal variation in
mechanical property test results, and particularly in the visual determination of pearlite content, it appears
that a 20% pearlite specification range (for example, 60 to 80% pearlite with a target of 70% pearlite) will
result in a 10-15% range of ultimate tensile strength. In the final analysis the pearlite specification for most
applications should be based on hardness, wear and machinability considerations rather than tensile
properties.
With regard to elongation, the data presented in Table II clearly show the ductile nature of CGI and the fact
that elongation increases with increasing nodularity and decreasing pearlite content. The data presented in
Table II are in good agreement with data published in the open literature [15].

6
Figure 5: Ultimate tensile strength and 0.2% yield strength of 0-10% nodularity CGI as a function of pearlite content
As shown in Figure 6, the variation in elastic modulus as a function of graphite nodularity is similar to that
observed for tensile and yield strength. The presence of even a small amount of flake patches reduces the
elastic modulus of CGI by as much as 20%. While the elastic modulus of conventional pearlitic grey iron
ranges from 105-110 GPa, interpolation of the room temperature data in Figure 6 suggests the elastic
modulus of a fully A-Type flake structure produced with CGI base iron chemistry would be less than 100 GPa.
Again, flake graphite must be avoided.
Figure 6: Elastic Modulus of 85-100% pearlite cast irons as a function of nodularity and temperature
Nodularity (%)
Ela
sti
c M
od
ulu
s (
GP
a)
Pearlite (%)
0.2% Yield strength
Ultimate Tensile Strength

7
The elastic modulus of pearlitic Cr-Mo alloyed grey iron, pearlitic CGI and ductile iron as a function of applied tensile load and temperature. After [7]
The data presented in Table II show that the elastic modulus of 0-10% nodularity CGI is constant in the
range of 145-150 GPa for pearlite contents above approximately 50%. The modulus gradually decreases at
lower pearlite contents and increases with increasing nodularity.
Another important design consideration regarding the elastic modulus of CGI is that, unlike grey iron, the
elastic modulus of CGI remains constant in the presence of applied tensile stress and elevated temperatures
[16]. As shown in Figure 7, because grey iron does not elongate when subjected to tensile stress, it
immediately experiences a linear decrease in elastic modulus when subjected to tensile stress. In contrast,
ductile materials such as CGI and steel iron have a distinct range of proportionality between stress and strain
and thus maintain a constant elastic modulus until a certain temperature-dependent stress limit is reached.
The modulus then decreases in a linear manner. The practical significance of this is that the actual elastic
modulus (stiffness) of dynamically loaded CGI components can be 50-75% higher than identically designed
and loaded grey iron components.
Compression Properties
The compressive yield strength of cast irons plays an important role in determining the thermal fatigue life of
constrained components, particularly for the valve-bridge area of heavy-duty diesel engine cylinder heads.
The 0.2% compressive yield strength of unalloyed and Cr-Mo alloyed compacted graphite irons was
therefore evaluated together with a pearlitic grey cast iron according to the DIN 1691 standard for GG25.
The compression tests were conducted at the Swedish National Testing and Research Institute (Sveriges
Provnings-och Forskningsinstitut) in Gothenburg, Sweden. The tests were conducted at room temperature
and 400°C according to the ASTM E 9 standard with ‘medium’ length test bars. All test specimens were
produced in the manner previously described for the tensile specimens. The microstructure and chemistry
details of each test material are presented in Table III while the compressive properties are summarised in
Table IV. The results reported for compressive yield strength and elastic modulus represent the average of
three individual compression tests.
Stress (MPa)
Pearlitic Ductile Iron
Compacted Graphite Iron
Cr-Mo alloy Grey
Ela
sti
c M
od
ulu
s (
GP
a)
Figure 7:

8
Table III
Chemical and microstructural details of compression test specimens
Sample
Number
Sample
Description
Nodularity
(%)
Pearlite
(%)
Chemical Analysis(%)
C Si Mn S Mg Cu Sn Cr Mo
1 Pearlitic Grey A-Flake 100 3.25 1.91 0.70 0.08 0.001 0.20 0.003 0.12 0.01 2 70% P CGI 10 70 3.73 2.35 0.39 0.013 0.009 0.55 0.04 0.03 <0.001 3 100% P CGI 5 98 3.66 2.26 0.42 0.012 0.009 0.67 0.07 0.02 <0.001 4 60% P Mo-CGI 5 60 3.63 2.33 0.37 0.013 0.010 0.55 0.03 0.03 0.27 5 100% P Mo-CGI 5 100 3.74 2.35 0.38 0.013 0.012 0.56 0.18 0.03 0.26 6 Cr-Mo CGI 5 90 3.70 2.23 0.41 0.015 0.011 0.42 0.04 0.24 0.28
Table IV
Compressive properties of the irons presented in Table III
Sample
Number
Sample
Description
Hardness
(BHN 5/750)
E-Modulus
(GPa @ 20°C) 0.2% Y.S.
(MPa @ 20°C) 0.2% Y.S.
(MPa @ 400°C)
1 100% Pearlitic Grey 190 119 349 297
2 70% Pearlite CGI 207 136 409 332
3 100% Pearlite CGI 240 156 437 370
4 60% Pearlite Mo-CGI 190 146 385 312
5 100% Pearlite Mo-CGI 255 148 478 394
6 90% Pearlite Cr-Mo CGI 235 150 432 360
The compression results show that the compressive yield strength of unalloyed pearlitic CGI is approximately
25% higher than that of the Cr-Mo alloyed grey iron. The data also show that the room temperature
compressive yield strength increases linearly with increasing pearlite content and is apparently insensitive to
the effects of chrome and molybdenum alloying. The role of chrome is to stabilize pearlite at elevated
(>400°C) temperatures while molybdenum improves creep and thermal fatigue performance. Finally, the
compression tests show that the elastic modulus of CGI (145-155 GPa) is the same in both tension and
compression.
Hardness
The graphite growth and carbon diffusion behaviour during solidification of compacted graphite iron naturally
favours the formation of ferritic rather than pearlitic matrices. Therefore, pearlite stabilizers such as copper
and tin must be added to the base iron to ensure a predominantly pearlitic matrix. The solidification
behaviour of compacted graphite iron results in 10 to 15% higher hardness than grey cast iron when
compared at equal pearlite contents. While a typical Brinell hardness range for fully pearlitic grey iron
cylinder blocks may be BHN 179-223, fully pearlitic CGI cylinder blocks may range from BHN 192-255.
Compacted graphite iron cylinder blocks containing approximately 70% pearlite have a similar hardness to
fully pearlitic grey iron blocks. As shown in Figure 8, the hardness level of CGI increases linearly with
increasing pearlite content. While this trend is certainly true, the slope and intercept of the linear correlation
depend on the concentration of manganese, chromium, titanium and other trace elements in the raw
materials as well as the casting shake-out time.

9
Figure 8: Brinell hardness of unalloyed 0-10% nodularity CGI as a function of pearlite content
The influence of the graphite growth behaviour on hardness is evident from Figure 9. At a fixed (85-100%)
pearlite content, the Brinell hardness is effectively constant from 0 to 90% nodularity. However, a step-
reduction in hardness occurs as soon as flake patches begin to form. The rapid decrease in hardness
between CGI and grey iron is due to the complex compacted graphite morphology which prevents slip and
fracture in the matrix and at the graphite/matrix interface.
Figure 9: Brinell hardness of 85-100% pearlitic cast irons as a function of nodularity
Nodularity (%)
BHN = 1.09* P% + 133.52 R2 = 0.95
Pearlite (%)
Hard
nes
s (
BH
N)
Hard
nes
s (
BH
N)

10
Wear Resistance Wear is a complex phenomenon that comprises several tribological mechanisms and has no universally
accepted test procedure or quantitative criteria for establishing the suitability of a given material. In contrast
to the clearly defined specification limits for tensile properties or hardness, the wear behavior of materials is
typically evaluated relative to the performance of other candidate materials. Experimental procedures can
vary from sophisticated real-load simulations to relatively simple pin-on-disk or abrasion tests.
In general, unalloyed pearlitic CGI incurs approximately one-half of the wear of unalloyed pearlitic grey cast
irons when exposed to scarring or abrasion conditions. Hrusovsky [17] showed that the average scar width in
LFW-1 pin-on-disc tests was 45% less for pearlitic CGI than for pearlitic grey iron. Similar results have been
reported for abrasion tests where the weight loss of CGI specimens during abrasion tests is 40-55% less
than that of grey iron [18,19]. Although the test techniques and results vary, the consistency shows that CGI
has superior wear resistance to grey iron and is a viable material for cylinder liner applications.
In order to determine the suitability of CGI as a cylinder liner material, a series of scuffing tests were
conducted to compare the wear resistance of various CGI microstructures and compositions with
commercially available cylinder liner materials. The scuffing test [20] was conducted by pushing a test
specimen against a rotating nitrided steel cylinder. The load range and the sliding velocity (5.7 cm/sec) were
selected to simulate the conditions near dead-centre in the cylinder bore of a combustion engine. Lubricant
was not used in order to exacerbate the wear conditions. As the scuffing test proceeds, the surface of the
test material roughens and the friction between the test piece and the nitrided cylinder increases. The
relative scuffing resistance of each material is determined by comparing the lowest friction coefficient
recorded, and the normal load above which the friction coefficient first exceeds 0.3. These points are known
to relate to friction and scuffing behavior in internal combustion engines [20].
The chemical analysis of the four CGI variants and the conventional liner materials studied in these tests is
summarized in Table V. The phosphorous-alloyed grey iron specimens and the surface-treated aluminum
and grey iron specimens were sectioned from commercially available centrifugally cast cylinder liners or from
the top-dead-centre sliding surface of parent bore cylinder blocks. Calibrations were made to account for the
different area of surface contact for curved and flat specimens.
Table V
Chemical analysis of specimens used in scuffing tests
Sample
Number Description
Pearlite
(%)
Nodularity
(%)
Chemical Analysis(%)
C Si Mn S Mg Cu Sn Cr Mo P
1 Ferritic CGI 20 10 3.58 2.60 0.39 0.011 0.011 0.29 -- 0.03 -- 0.01 2 Hypereutectic CGI 95 15 3.85 2.26 0.40 0.010 0.008 0.30 -- 0.03 -- 0.01 3 Cr-Mo alloyed CGI 90 15 3.76 2.23 0.40 0.013 0.013 0.41 0.04 0.28 0.28 0.01 4 Pearlitic CGI 95 10 3.60 2.29 0.40 0.013 0.012 0.74 0.07 0.03 -- 0.01 5 P-alloyed Grey-I 100 -- 3.05 1.76 0.67 0.061 0.006 0.16 0.01 0.34 0.19 0.48 6 P-alloyed Grey-II 100 -- 3.21 2.46 0.60 0.075 0.006 0.20 0.05 0.62 0.23 0.62 7 P-B (0.1%) alloyed grey 100 -- 2.90 2.40 0.70 0.10 -- 0.40 -- 0.30 -- 0.30 8 Laser hardened grey 100 -- 3.3 2.3 0.7 0.11 -- 0.6 0.06 0.3 -- <0.15 9 Nicasil-coated Al -- -- -- -- -- -- -- -- -- -- -- --

11
The scuffing results plotted in Figure 10 show the minimum coefficient of friction for each material and the
applied normal load at which the coefficient of friction first exceeds 0.3. Ideal wear materials should have a
low coefficient of friction and simultaneously tolerate high loads without incurring wear and thus increasing
friction. According to these criteria, and for the conditions of this test, the performance of unalloyed pearlitic
CGI is superior to that of the Nicasil coated aluminum liner and the laser hardened and Cr-alloyed grey iron
liner. The behavior of unalloyed pearlitic CGI is not statistically significantly different from the phosphorous
and phosphorous-boron alloyed grey iron specimens. The best performance was realized by the Cr-Mo
alloyed pearlitic CGI which simultaneously displayed the lowest friction and the highest scuffing load.
Figure 10: Coefficient of friction and normal load for various wear materials in scuffing bench tests
Comparative wear tests have also been conducted by Volvo Technological Development [21] to discern the
difference between unalloyed pearlitic CGI and conventional P-alloyed grey iron cylinder liners for diesel
application. The engine simulation test rig pushes a standard top compression ring against a honed liner
specimen with a normal load of 320 N. The ring is then oscillated with an 8 mm amplitude reciprocating
motion at a frequency of 10 Hz. The contact region is submerged in used 10W/30 engine oil and heated to
80°C to replicate the wear behavior in running engines.
Operationally, the test is interrupted after three hours and the wear volume is measured by 3D profilometry to
determine the running-in wear. The specimen is then repositioned and tested for a further thirteen hours to
determine the steady-state wear behavior. The results of the comparative test show that the running-in
(0-3 hours) and steady-state (3-16 hours) wear behavior of unalloyed pearlitic CGI is not statistically
significantly different from that of the standard phosphorous-alloyed grey iron reference liners.
CGI Alloys
Lo
ad
at
Coe
ffic
ient
of
Fri
ctio
n =
0.3
Alloyed Grey Laser hardened Cr-grey
Nicasil Aluminium
Min
imum
Co
eff
icie
nt
of F
riction
Load @ 0.3
Coeff. of Friction

12
Fatigue and Notch Sensitivity Similar to tensile properties, the fatigue strength of a material is influenced by its microstructure and alloying
elements. Therefore, fatigue data should always be presented together with microstructure data and the
monotonic tensile strength of the base material to serve as a reference point. Fatigue data in this section are
thus reported in terms of two dimensionless indices:
Endurance Ratio = Unnotched fatigue limit
Ultimate tensile strength
Fatigue Strength = Unnotched fatigue limit
Reduction Factor Notched fatigue limit
These indices allow the notched and unnotched fatigue limits of a material to be approximated directly from
its tensile strength. A summary of rotating-bending fatigue data from four different literature sources is
provided in Table VI while classical S-N plots for notched and unnotched CGI are shown in Figure 11.
Table VI
Fatigue and notch sensitivity data for cast irons subjected to rotating-bending fatigue tests
Ref
Number Iron
Type Pearlite
(%) Nodularity
(%) Hardness
(BHN) UTS
(MPa) Fatigue Limit (MPa) Endurance
Ratio Fatigue Strength
Reduction
Factor Unnotched Notched
22 CGI
CGI
CGI
70-80
>90
>90
0-10
0-10
20-300
184
205
217
388
414
473
178
185
208
100
108
116
0.46
0.45
0.44
1.77
1.72
1.80 23 CGI
CGI
SG
SG
<20
>85
<20
>85
10-20
10-30
90
90
134
229
159
277
351
583
449
727
196
255
226
275
131
180
142
183
0.57
0.44
0.50
0.38
1.50
1.42
1.59
1.50 24 CGI
CGI
SG
SG
ferrite
pearlite
ferrite
pearlite
--
--
--
--
134
223
143
223
248
346
269
404
186
186
235
255
137
118
147
147
0.58
0.45
0.57
0.35
1.36
1.57
1.60
1.73 25 CGI
CGI
SG
SG
Grey
ferrite
ferrite
ferrite
ferrite
ferrite
--
--
--
--
--
143
143
137
128
103
388
355
320
285
201
221
201
196
157
98
137
127
108
93
88
0.57
0.57
0.61
0.55
0.49
1.61
1.58
1.82
1.68
1.11
The literature data show that the rotating-bending Endurance Ratio of CGI ranges from 0.44 to 0.58,
although values as low as 0.37 have been reported [6]. Pearlitic irons tend toward the lower end of the
Endurance Limit range which means that ferritic CGI retains a larger portion of its monotonic strength in
fatigue applications. Nonetheless, the absolute fatigue limit of pearlitic CGI is approximately 25% higher than
that of ferritic CGI (Figure 11). The rotating-bending fatigue limit of pearlitic CGI is approximately double that
of pearlitic grey iron and similar to that of ferritic ductile iron.

13
Figure 11: S-N fatigue plot for ferritic and pearlitic CGI in rotating-bending [23]
It is well known that the notch sensitivity of cast irons is a direct function of the geometry of the imposed
notch. Reference [22] employed a relatively severe 45o V-notch with a 0.25 mm root radius and obtained
Fatigue Strength Reduction Factors of 1.72-1.80 for CGI. In contrast, Reference [24] incorporated a relatively
smooth ‘notch’ geometry (actually a 1.2 mm diameter hole drilled through the centre of the test specimen)
and obtained Fatigue Strength Reduction Factors ranging from 1.36 to 1.58. Finally, Reference [23] used the
intermediate notch geometry of a 0.5 mm diameter by 0.5 mm deep drill hole and obtained intermediate
results (1.42-1.50). While it is clear that CGI has a higher notch sensitivity than grey iron (1.05-1.15) and a
lower sensitivity than ductile iron (1.50-1.85), the most critical factor is the notch geometry. Indeed, Palmer
[22] states that if the root radius of the notch was increased to 5 mm in a 10.6 mm diameter fatigue specimen,
the notch effect would be eliminated.
In addition to the basic data provided by conventional rotating-bending tests, designers are also interested in
the fatigue behavior of components subjected to uniaxial (tension-compression) loading. This is particularly
true for components which are subjected to both an underlying tensile load and cyclical stress fluctuations
which are imposed about the mean tensile stress level. Depending on the mean stress level and the
magnitude of the fluctuations, the resulting fatigue cycle can be either tension-tension or tension-
compression. Tests of this nature are conducted with uniaxial hydraulic servo fatigue machines [26,27]. The
results of such fatigue tests are presented in so-called Goodman diagrams as shown in Figure 12 [7,26] for
uniaxial loading and in Figure 13 [7] for three-point bending. The fatigue limits in the absence of any mean
stress can be read directly from the intersection of the fatigue limit lines with the vertical axis, while the
maximum permissible stress (at 107 cycles) at any mean stress level is represented by the distance between
the 45o line and the respective fatigue line for the material. Again, the performance of pearlitic CGI is similar
to that of ferritic ductile iron.
Number of stress cycles
Str
es
s a
mp
litu
de (
MP
a)
Notched
Unnotched

14
The behavior of CGI under fully reversed torsional fatigue conditions has been studied by Sumimoto et al
[28]. Although they only studied ferritic cast irons, their data (Table VII) show that the torsional fatigue limit of
CGI is approximately the same as that of ductile iron, and thus approximately 40% higher than that of steels
with similar tensile strengths. The values obtained for the Endurance Ratio of CGI are also in good
agreement with that presented in Table VI for rotating-bending conditions.
Table VII
Fully reversed torsional fatigue data [28]
Iron
Type
Matrix
Condition
Hardness
(BHN)
Elongation
(%)
UTS
(MPa)
Fatigue
Limit (MPa)
Endurance
Ratio
CGI Ferrite 156 5.5 336 152 0.45 CGI Ferrite 163 4.7 335 157 0.47 CGI Ferrite / Pearlite 210 1.9 366 157 0.43 CGI Ferrite 161 6.0 355 147 0.41 CGI Ferrite 154 4.7 332 142 0.43 SG Ferrite 156 26.3 452 186 0.41 SG Ferrite 163 24.5 445 172 0.39 SG Ferrite 177 23.0 498 216 0.43
Steel Ferrite / Pearlite 114 39.2 444 130 0.29
Mean Stress (MPa)
Recip
roc
ati
ng
Str
ess (
MP
a)
Recip
roc
ati
ng
Str
es
s (
MP
a)
Mean Stress (MPa)
Figure 12: Goodman diagram for determination of permissible stresses under uniaxial tension-compression loading. After [7]
Figure 13: Goodman diagram for determination of permissible stresses under three point bending loads. After [7]
15
The good fatigue performance of CGI stems directly from the compacted graphite morphology. The rounded
edges of the graphite particles do not contribute to crack initiation and actually serve as crack arresters once
cracks are formed. The complex coral-like morphology and irregular surfaces of the graphite particles
thereafter result in good adhesion and thus present a more tortuous crack propagation path relative to the
smooth flake surfaces in grey iron. These same morphological characteristics result in a two-to-four-fold
increase in the thermal fatigue resistance of CGI relative to grey iron [29-31]. Despite that consistently
superior thermal fatigue results have been reported for CGI under a variety of thermal cycle conditions, it
must be stressed that such results may not be directly transferable to the performance of thermally loaded
components such as cylinder heads. The difference in geometry, constrainment and the critical roles of
thermal conductivity and elastic modulus in transferring heat and stress cannot be accurately simulated in
uniaxial test pieces. Practical experience has shown that CGI can improve the service life of high
performance direct injected diesel engine cylinder heads provided that the flame deck thickness is reduced
to facilitate heat transfer and distribution of accumulated stress.
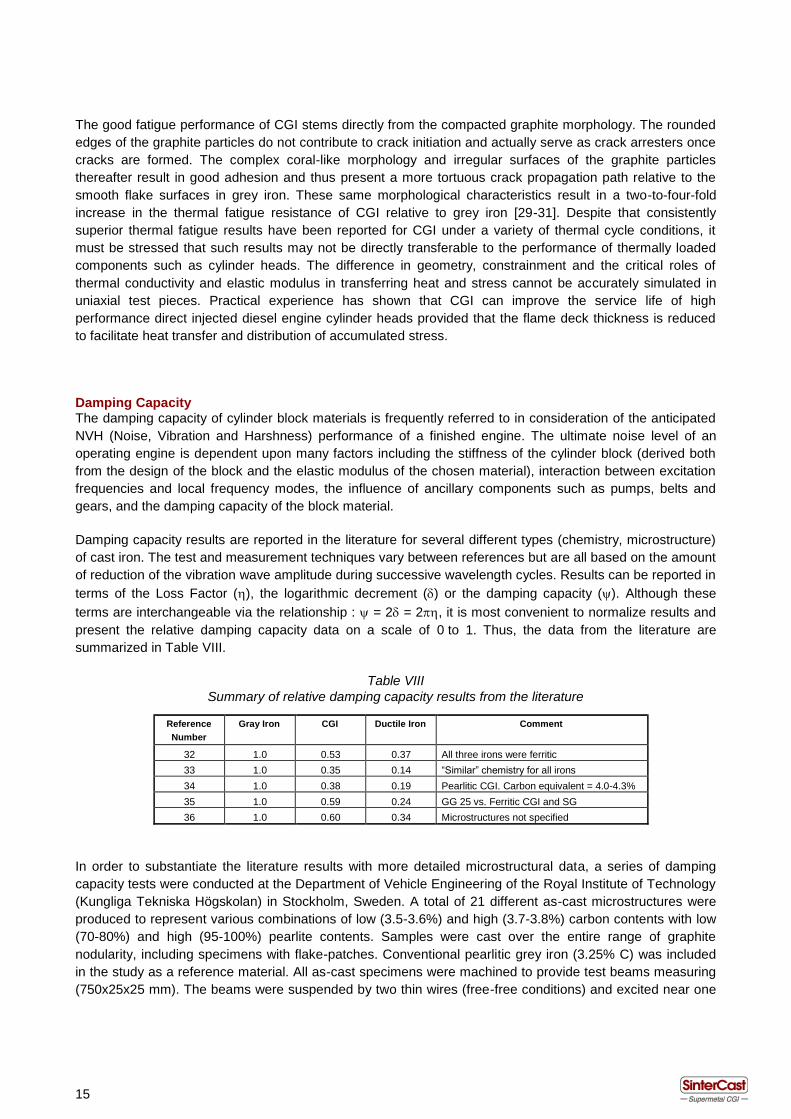
Damping Capacity The damping capacity of cylinder block materials is frequently referred to in consideration of the anticipated
NVH (Noise, Vibration and Harshness) performance of a finished engine. The ultimate noise level of an
operating engine is dependent upon many factors including the stiffness of the cylinder block (derived both
from the design of the block and the elastic modulus of the chosen material), interaction between excitation
frequencies and local frequency modes, the influence of ancillary components such as pumps, belts and
gears, and the damping capacity of the block material.
Damping capacity results are reported in the literature for several different types (chemistry, microstructure)
of cast iron. The test and measurement techniques vary between references but are all based on the amount
of reduction of the vibration wave amplitude during successive wavelength cycles. Results can be reported in
terms of the Loss Factor (), the logarithmic decrement () or the damping capacity (). Although these
terms are interchangeable via the relationship : = 2 = 2, it is most convenient to normalize results and
present the relative damping capacity data on a scale of 0 to 1. Thus, the data from the literature are
summarized in Table VIII.
Table VIII
Summary of relative damping capacity results from the literature
Reference
Number Gray Iron CGI Ductile Iron Comment
32 1.0 0.53 0.37 All three irons were ferritic 33 1.0 0.35 0.14 “Similar” chemistry for all irons 34 1.0 0.38 0.19 Pearlitic CGI. Carbon equivalent = 4.0-4.3% 35 1.0 0.59 0.24 GG 25 vs. Ferritic CGI and SG 36 1.0 0.60 0.34 Microstructures not specified
In order to substantiate the literature results with more detailed microstructural data, a series of damping
capacity tests were conducted at the Department of Vehicle Engineering of the Royal Institute of Technology
(Kungliga Tekniska Högskolan) in Stockholm, Sweden. A total of 21 different as-cast microstructures were
produced to represent various combinations of low (3.5-3.6%) and high (3.7-3.8%) carbon contents with low
(70-80%) and high (95-100%) pearlite contents. Samples were cast over the entire range of graphite
nodularity, including specimens with flake-patches. Conventional pearlitic grey iron (3.25% C) was included
in the study as a reference material. All as-cast specimens were machined to provide test beams measuring
(750x25x25 mm). The beams were suspended by two thin wires (free-free conditions) and excited near one
16
end by a mechanical hammer. The vibrations were monitored by a 2 gram accelerometer attached near the
opposite end of the beam, but on the same face that was struck by the hammer. The data presented in this
section represent the average values of five individual measurements at each resonant frequency. The
measurements uncertainty was estimated to be 10%.
The damping capacity of a material is evaluated at its resonant frequency. Upon excitation, the 750 mm test
beams developed seven different resonances ranging from 200 to 5000 Hz. In order to minimize the effect of
microstructural variations in the long test beams, the relative damping capacity results (calculated from the
logarithmic decrement) plotted in Figure 14 represent the average of the values measured at each of the
seven resonant frequencies.
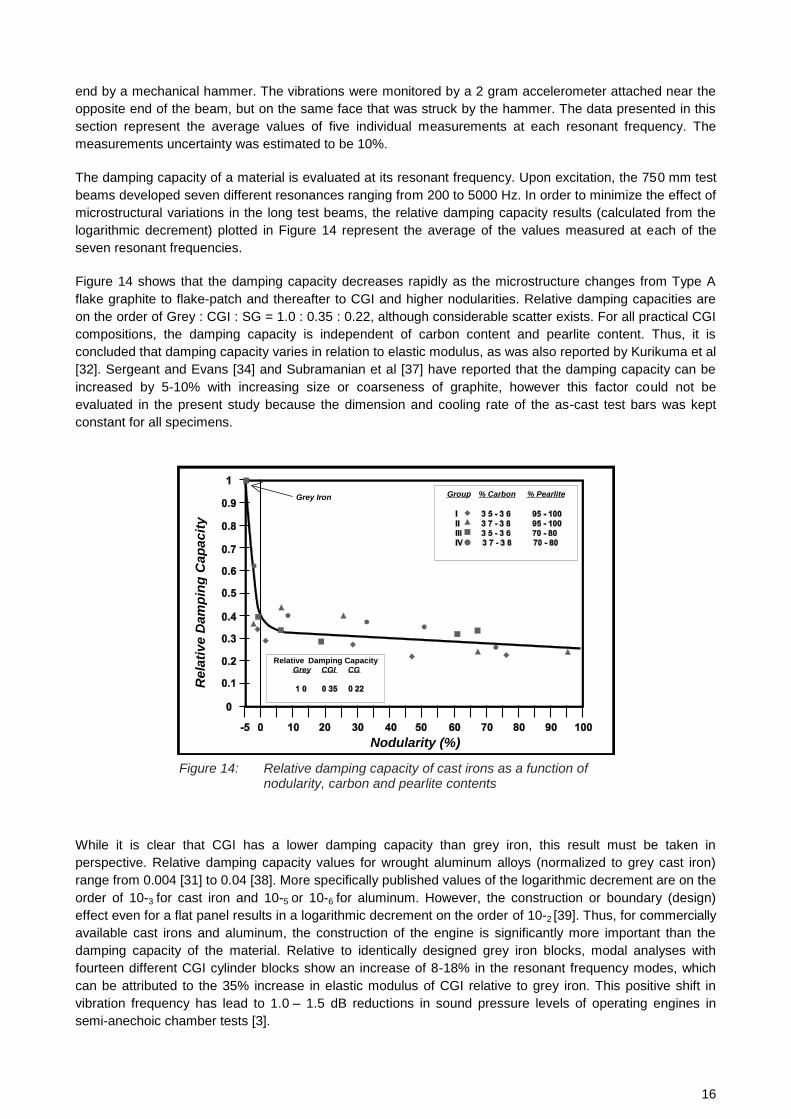
Figure 14 shows that the damping capacity decreases rapidly as the microstructure changes from Type A
flake graphite to flake-patch and thereafter to CGI and higher nodularities. Relative damping capacities are
on the order of Grey : CGI : SG = 1.0 : 0.35 : 0.22, although considerable scatter exists. For all practical CGI
compositions, the damping capacity is independent of carbon content and pearlite content. Thus, it is
concluded that damping capacity varies in relation to elastic modulus, as was also reported by Kurikuma et al
[32]. Sergeant and Evans [34] and Subramanian et al [37] have reported that the damping capacity can be
increased by 5-10% with increasing size or coarseness of graphite, however this factor could not be
evaluated in the present study because the dimension and cooling rate of the as-cast test bars was kept
constant for all specimens.
Figure 14: Relative damping capacity of cast irons as a function of
nodularity, carbon and pearlite contents
While it is clear that CGI has a lower damping capacity than grey iron, this result must be taken in
perspective. Relative damping capacity values for wrought aluminum alloys (normalized to grey cast iron)
range from 0.004 [31] to 0.04 [38]. More specifically published values of the logarithmic decrement are on the
order of 10-3 for cast iron and 10-5 or 10-6 for aluminum. However, the construction or boundary (design)
effect even for a flat panel results in a logarithmic decrement on the order of 10-2 [39]. Thus, for commercially
available cast irons and aluminum, the construction of the engine is significantly more important than the
damping capacity of the material. Relative to identically designed grey iron blocks, modal analyses with
fourteen different CGI cylinder blocks show an increase of 8-18% in the resonant frequency modes, which
can be attributed to the 35% increase in elastic modulus of CGI relative to grey iron. This positive shift in
vibration frequency has lead to 1.0 – 1.5 dB reductions in sound pressure levels of operating engines in
semi-anechoic chamber tests [3].
Nodularity (%)
Rela
tiv
e D
am
pin
g C
ap
acit
y
Grey Iron
Relative Damping Capacity Relative Damping Capacity Grey CGI CG
Group % Carbon % Pearlite

17
Thermal Conductivity The thermal conductivity of the graphite phase in cast irons is three to five times greater than that of either
ferrite or pearlite [40]. It is therefore intuitively evident that the amount and shape of graphite are the critical
factors in defining the thermal conductivity of cast irons. In order to quantify the effects of carbon content
(in the practical CGI range of 3.5-3.8%), graphite shape, matrix composition and temperature on thermal
conductivity, a series of controlled tests were conducted at the Austrian Foundry Institute (Österreichisches
Giesserei-Institut, Leoben). The composition of the specimens, the test technique and the results are
presented in this section.
The thermal conductivity specimens were cast as ASTM A 536 Y-block samples according to the method
previously described for the tensile tests. Cylindrical samples (25 mm diameter by 25 mm long) were
machined from the central area of the Y-block. Each specimen is ‘stacked’ in tight thermal contact between
two reference materials of the same diameter and the thermal conductivity is evaluated by a comparative
method with stationary axial heat flow. The upper reference specimen was coupled to a heat source while
the lower reference was coupled to a heat sink. Radial heat losses were minimized by a guard heater and
insulators. The reference material was SRM 8421 electrolytic iron supplied by the US National Institute of
Standards and Technology.
Type N thermocouples were embedded at known locations in the cast-iron specimens and the reference
materials. The temperature difference along the length of the specimen was approximately 10°C and the
average value of the temperatures measured at the two thermocouple points was taken as the bulk
temperature of the specimen. All measurements were conducted under argon atmosphere. The total
uncertainty of the thermal conductivity results was estimated at 7%.
A total of 18 specimens were examined to determine the influence of carbon content, nodularity and pearlite
content on thermal conductivity in the temperature range of 55-400°C. As shown in Table IX, the specimens
were grouped into four broad categories of similar carbon (3.5-3.6%C and 3.7-3,8%C) and pearlite (70-80%
and 95-100%) contents. The data, which are plotted in Figure 15 (a-d) thus show the change in thermal
conductivity as a function of nodularity, pearlite content and temperature. Each line in Figure 15 is identified
by its nodularity in parentheses which allows for cross-reference to the raw data contained in Table IX. The
thermal conductivity of conventional pearlitic grey iron [4,38,41] is included in each of the Figure 15 plots as
a reference.
The trends revealed in each of Figure 15 (a) through 15 (d) show that the thermal conductivity of CGI is
approximately 25% less than that of pearlitic grey iron at room temperature and 15-20% less at 400°C. The
observation that the thermal conductivity of grey iron decreases with increasing temperature is well known.
However, it is interesting to note that even the presence of relatively small amounts of flake graphite in a
predominantly compacted graphite microstructure also causes the conductivity to decrease with temperature.
This is observed in the flake-patch specimens in each of the four microstructure groups. In contrast, the
thermal conductivity of CGI and nodular cast irons gradually increases with increasing temperature. This is
also in agreement with the literature which sometimes reports that the thermal conductivity of ferritic CGI can
exceed that of pearlitic grey iron at temperatures above 200°C [16,42].

18
The trending of the thermal conductivity data presented in Figure 15 is logical, however the results show that
compositional changes within the practical production range of 3.5-3.8% carbon can only influence the thermal
conductivity by a maximum of 10%. While the microstructural latitude of CGI may be too narrow to significantly
increase thermal conductivity, the data indicate that increases in nodularity from 10-30% cause a further 10%
decrease in the thermal conductivity of CGI relative to grey iron. Therefore, it is more meaningful for CGI
specifications to focus on avoiding high nodularity (and thus conductivity losses) in thermally loaded areas
rather than trying to identify opportunities to increase conductivity. This is particularly true in consideration of
the risk of the rapid decrease in tensile properties if flake graphite begins to appear in the CGI.
Figure 15: Thermal conductivity of cast irons as a function of nodularity, carbon content and pearlite content
Temperature (°C)
Th
erm
al
Co
nd
uc
tiv
ity
(W
/m-°
C)
Th
erm
al
Co
nd
uc
tiv
ity
(W
/m-°
C)
Temperature (°C)
Th
erm
al
Co
nd
uc
tiv
ity
(W
/m-°
C)
Th
erm
al
Co
nd
uc
tiv
ity
(W
/m-°
C)
(a) Group I (b) Group II 95-100% Pearlite 95-100% Pearlite
Grey, 3.25% C Grey, 3.25% C
Grey, 3.25% C Grey, 3.25% C
70-80% Pearlite 70-80% Pearlite (a) Group III (a) Group IV
Temperature (°C)
Temperature (°C)

19
Table IX
Chemical analysis and microstructure data of thermal conductivity specimens
Microstructure
Group Sample
Number Nodularity
(%) Pearlite
(%) Chemical Analysis(%)
C Si Mn S Mg Cu Sn Cr Al I
(3.5-3.6%C)
(95-100%P)
I-1
I-2
I-3
I-4
I-5
-1
2
27
57
90
95
95
98
98
100
3.49
3.48
3.49
3.55
3.60
2.13
2.12
2.18
2.19
2.22
0.43
0.43
0.43
0.43
0.45
0.014
0.015
0.012
0.013
0.015
0.006
0.008
0.015
0.027
0.032
0.77
0.77
0.77
0.76
0.75
0.07
0.07
0.07
0.76
0.75
0.03
0.03
0.03
0.03
0.04
0.008
0.008
0.007
0.006
0.007 II
(3.7-3.8%C)
(95-100%P)
II-1
II-2
II-3
II-4
II-5
-3
3
30
70
95
98
98
100
98
98
3.65
3.66
3.74
3.82
3.81
2.09
2.26
2.35
2.41
2.42
0.42
0.42
0.42
0.41
0.40
0.013
0.012
0.013
0.011
0.009
0.008
0.009
0.020
0.013
0.022
0.40
0.67
0.66
0.83
0.84
0.11
0.07
0.08
0.09
0.09
0.03
0.02
0.02
0.03
0.03
0.004
0.006
0.005
0.009
0.009 III
(3.5-3.6%C)
(70-80%P)
III-1
III-2
III-3
III-4
-1
5
19
47
80
80
80
70
3.50
3.57
3.58
3.57
2.12
2.10
2.15
2.10
0.41
0.40
0.40
0.38
0.015
0.012
0.014
0.010
0.009
0.011
0.015
0.022
0.55
0.52
0.51
0.51
0.04
0.04
0.04
0.04
0.03
0.02
0.03
0.03
0.008
0.008
0.008
0.003 IV
(3.7-3.8%C)
(70-80%P)
IV-1
IV -2
IV -3
IV -4
-1
10
75
95
70
70
70
80
3.66
3.73
3.75
3.69
2.09
2.35
2.36
2.42
0.41
0.39
0.39
0.41
0.012
0.013
0.013
0.010
0.007
0.009
0.013
0.020
0.39
0.55
0.55
0.48
0.05
0.04
0.04
0.07
0.03
0.03
0.03
0.03
0.005
0.007
0.005
0.005
Summary
The graphite shape, carbon content and pearlite content of cast irons each play an important role in
determining the mechanical and physical properties of cast irons. While some material properties, such as
Poisson’s ratio or thermal expansion, are effectively constant over a wide range of microstructure and
chemistry, the present study addresses the effect of microstructural changes on the properties of compacted
graphite iron.
The mechanical properties of CGI decrease by 20-25% as soon as flake-type graphite appears in the
microstructure. Although the mechanical properties gradually increase as the nodularity exceeds 20%,
thermal conductivity is reduced and castability and machinability become more difficult. The data obtained at
increased nodularity levels also serve to indicate the expected change in material properties as the
nodularity varies between thin and thick sections of a casting, which can be used to advantage in CGI engine
design. Although the demands of every component are unique, the data suggest that a nodularity range of
0-20% is appropriate for the cylinder bore walls and other structural regions of a cylinder block. Flake
graphite is inadmissible. The pearlite content, which is linearly related to hardness and tensile strength, can
be specified to suit the wear, machinability and high temperature performance requirements of the
component. Alloying elements can also be specified to improve selected properties.

20
References 1 Sonderheft 10 Jahre TDI: MTZ Motortechnische Zeitschrift, Okt, 1999. To be published.
2 D-Moment, Auto Motor und Sport, Issue 10 1999, pp. 92-94.
3 F. Indra, M. Tholl, "Compacted graphite iron (CGI) - A new material for internal combustion engines", Fifth Aachen Colloquium on
Vehicles and Automobile Technology, pp 331-350 (1995).
4 I.C.H. Hughes and J. Powell, ‘Compacted Graphite Irons - High quality engineering materials in the cast iron family’, SAE Paper
840772, 1984.
5 J.D. Altstetter and R.M. Nowicki, ‘Compacted Graphite Iron - Its properties and automotive applications’, AFS Transactions 82-188,
1982, pp. 959-970.
6 C.R. Loper, M.J. Lalich, H.K. Park and A.M. Gyarmaty, ‘The relationship of microstructure to mechanical properties in compacted
graphite irons’, AFS Transactions 80-160, 1980, pp. 313-330.
7 E. Nechtelberger, The properties of cast iron up to 500°C, English edition published in 1980 by Technicopy Ltd, England; German
edition published in 1977 by Fachverlag Schiele und Schön GmbH, Germany.
8 K. Röhig, ‘Gusseisen mit vermiculargraphit-herstellung, eigenschaften, anwendug’, Konstruieren + Giessen, Vol. 16, No. 1, 1991,
pp. 7-27.
9 D.M. Stefanescu, R. Hummer and E. Nechtelberger, ‘Compacted Graphite Irons’, Metals Handbook, Ninth Edition, Vol. 15, 1988,
pp. 667-677.
10 T. Okamoto, A. Kagawa, K. Kamei and H. Matsumoto, ‘Effect of graphite shape on thermal conductivity, electrical resistivity,
damping capacity and Young’s modulus of cast iron below 500°C’, Journal of Japan Foundrymen’s Society, Vol. 55, No. 2, 1983.
11 Y. Tanaka, H. Saito, K. Ikawa, ‘Relation between graphite structure and physical and mechanical properties of compacted/
vermicular graphite cast iron’, Journal of Japan Foundrymen’s Society, Vol. 53, No. 4, 1981.
12 SinterCast Nodularity Rating Charts, SinterCast, 1997.
13 Y. Gu, Ford Motor Company Ltd, "Engine cylinder block", European Patent Application EP 0 769 615 A1, (April 23, 1997).
14 Mazda Motor Corporation, "Ductile iron cylinder block with grey iron bore region", Japanese Patent 6-106331, (April 19, 1994).
15 G.F. Ruff, ‘Mechanical properties of compacted graphite cast iron’, SAE Paper 810209, 1981.
16 E. Nechtelberger, H. Puhr, J.B. van Nesselrode and A. Nakayasu, ‘Cast iron with vermicular/compacted graphite - state of the art’,
International Foundry Congress, Chicago, April 1982, pp. 1-39.
17 J.P. Hrusovsky, Formation, production and properties of compacted graphite iron, Ph.D. Thesis, Case Western Reserve University,
Cleveland, Ohio, 1982.
18 F.K. Bobylev, A. S. Glinkin, N.N. Aleksandrov and V.I. Popov, ‘Compacted graphite iron for D50 cylinder liners’, Russian Castings
Production, November 1976, pp. 445-446.
19 Riposan, M. Chisamera and L. Sofroni, ‘Contribution to the study of some technological and applicational properties of compacted
graphite cast iron, AFS Transactions, 85-07, 1985, pp. 35-48.
20 S. Hogmark, J. Alander, ‘Wear of cylinder liners and piston rings’, Wear of Materials, Virginia, pp 38-44 (1983)
21 L. Lundin, Volvo Technological Development AB Technical Report, "Wear properties of compacted graphite iron (CGI): a comparison
with Volvo truck company’s standard grey iron D10 liners", 27 March 1988.
22 K. B. Palmer, ‘Mechanical properties of compacted graphite iron’, BCIRA Report 1213, 1976, pp. 31-37.
23 M. Shikida, Y. Kanayama and H. Nakayama, ‘Strength and crack growth behaviours of compacted graphite vermicular cast iron in
rotating bending’ (in English), 29th Japan Congress on Materials Research, 1986, pp. 23-28.
24 T. Maezono, Y. Ohtsuka, R. Takahashi and K. Otsuka, ‘Fatigue crack growth of spheroidal graphite and compacted/vermicular
graphite cast iron’ (in Japanese), Journal of Japan Foundrymen’s Society, Vol. 56, No. 11, 1984, pg 658.
25 T. Shiota and S. Komatsu, ‘Influence of notch effect and effective sectional area on fatigue strength of cast irons with various
graphite shape’ (in Japanese), Journal of the Society of Materials Science of Japan, Vol. 27, No. 294, 1978, pg 291.
26 H. Suzuki, M. Ouyabu, T. Ueki and T. Kunio, ‘Influences of microstructure and mechanical properties on fatigue strength of
compacted vermicular and nodular cast iron’ (in Japanese), Journal of the Society of Material Science of Japan, Vol. 50, No. 451,
1984, pp. 520-525.
27 M. Shikida, Y. Kanayama and H. Nakayama, ‘Fatigue strength, crack growth rate and fracture appearance in compacted graphite
vermicular graphite cast iron’ (in Japanese), Journal of Material Science Japan, Vol. 36, No. 404, 1987, pg. 455.
28 H. Sumimoto, K. Nakamura and Y. Umeda, ‘Relationship between graphite morphology and fatigue limit in compacted vermicular
and ductile cast iron’ (in Japanese), Kinki University Research Report, Vol. 22.
29 K.R. Ziegler and J.F. Wallace, ‘The effect of matrix structure and alloying on the properties of compacted graphite iron’, AFS
Transactions, 84-123, pp. 735-748.
30 Y.J. Park, R. B. Gundlach and J.F. Janowack, ‘Effects of molybdenum on thermal fatigue resistance of ductile and compacted
graphite irons’, AFS Transactions, 87-90, pp. 267-272.
31 Iron Castings Handbook, C.F. Walton and T.J. Opar (Eds), Iron Castings Society, Cleveland, Ohio, 1981.
32 T. Kurikuma, Y. Makimura, M. Tada and T. Kobayashi, ‘Effects of graphite morphology and matrix microstructure on damping
capacity, tensile strength and Young’s modulus of casting irons’ (in Japanese), J. of Japan Engineering Society, Vol. 68, October
1998, pp 876-882.
33 A. A. Usol’tev, ‘Damping capacity of vermicular graphite cast iron’, Steel in the USSR, Vol. 20, October 1990, pp. 503-504.
34 G. F. Sergeant and E.R. Evans, ‘Production and properties of compacted graphite irons’, BCIRA Publication 1978.
35 A. Visnapuu, B. A. Betts and L. A. Neumeier, ‘Influence of graphite morphology on the damping properties of selected cast iron
structures’, Rolla Research Centre, Bureau of Mines, U.S. Dept of Interior, Rolla, Mo. 65401, USA, 1977.
36 R. D. Schelleng, ‘Cast iron with at least 50% of the graphite in vermicular form and process for making same’, United States Patent
3,421,886, 14 January 1969.
37 S. V. Subramanian and A. J. Genualdi, ‘Optimization of damping capacity and strength in hyper-eutectic grey cast iron, AFS Paper
96-138, American Foundrymen’s Society, 1996, pp. 1-2
38 Smithells Metals Reference Book, Seventh Edition, E. A. Brandes and G. B. Brook (Eds), Butterworth, 1992.
39 Noise and Vibration Control, Revised Edition, L.L. Beranek (Ed.), Inst. of Noise Control Engineering 1988, pg. 449.
40 H.T. Angus, Cast Irons: Physical and engineering properties, Second Edition Butterworths, 1976.
41 D.B. Craig, M.J. Hornung and T.K. McCluhan, ‘Grey Iron’, ASM Handbook, Vol. 15, ASM 1988, pg. 644.
42 P.A. Blackmore and K. Morton, ‘Structure-property relationships in graphite cast irons’, Int. J. Fatigue, July 1982, pp 149-155.

Head Office SinterCast Ltd Kingswick House Kingswick Drive Sunninghill Berkshire SL5 7BH United Kingdom Tel: +46 150 794 40 Technical Centre SinterCast AB (publ) Kungsgatan 2 641 30 Katrineholm Sweden Tel: +46 150 794 40 USA SinterCast Inc 1755 Park Street Suite 200 Naperville IL 60563 USA Tel: +1 630 778 3466
China SinterCast AB Beijing Room 1801-41, 18
th Floor
Building A, Capital Group Plaza No. 6 Chaoyangmen Beidajie Dongcheng District, Beijing China, 100027 Tel: +86 10 8528 3636 ext 8124 Korea SinterCast Korea Co., Ltd 6
th floor, DaeHan Life Insurance Building
472-3, Guem Am-Dong DukJin-Gu, JeonJu-City Jeolla Buk Do, South Korea Tel: +82 10 9228 1764 India SinterCast India Arvind Deodhar, A3 – 301, Kohinoor Estate Mula Road, Kirkee PUNE – 411 003 India Tel: +91 9860 383149
www.sintercast.com [email protected]

![HIGHACTIVEINOCULANTFERROALLOYTO CONTROL … · 50 % CG) on the other (NG -nodular graphite; CG -compacted graphite) [1, 2]. Every one of these four types of cast iron has particular](https://img.dokumen.tips/doc/110x75/5b5a9aa47f8b9ab8578c3976/highactiveinoculantferroalloyto-control-50-cg-on-the-other-ng-nodular-graphite.jpg)