Embed Size (px)
Citation preview

HH -p1 NL
Template Version 1.0
Community Survey on ICT usage
in households and by individuals 2016
Quality report
Please read this first !!!
General guidelines on using this template
• In the title line of this page, please delete the non-applicable term (Metadata / Quality Report).
• Fill in the required information in the space (box) foreseen next to or below the item heading, if a box is irrelevant for your national survey, indicate ‘non-applicable’ to avoid we have to come back to you on this item. An increase of the box’ size after inserting several lines or paragraphs is no problem. However, when reporting several pages for one item, we kindly ask you to give a short summary and refer to the full text in an annex.
• Keep the numbering of the chapters and items. Additional comments can be given at the end of the report.
• This template is designed to serve both the requirements for the Metadata as well as the Quality report. Chapters 1 to 6 shall be completed for the metadata report (deadline for submission: before 31/05/2016), chapters 7 to 10 can be postponed until the Quality report (deadline for submission: not later than 05/11/2016). However, where provisional information for the Quality Report topics is already available, we invite you to provide us with this data in the Metadata report (and update it in the Quality Report).
• Please submit the national questionnaire used (in national language and if available in English) annexed to the metadata report.
• Please replace in the header field the code ‘EU’ with your country code.
• All information provided in this report on coverage of questions/items, net sample sizes, number of respondents, proportions, etc. should be in line with the transmitted data file(s).
We kindly thank you for respecting these guidelines.
1. Cover information
1.1 Country
1.2 Organisation responsible for the surveyPlease also indicate the organisation running the survey if different from the organisation responsible (e.g. because of sub-contracting).
Statistics Netherlands
Statistical Analysis Department
CBS-weg 11
6412 EX Heerlen Netherlands
1.3 Contact person(s) (name, unit, e-mail, phone, fax)
Mr. Ger Linden, Project Manager
Department of Labour, Income and Living conditions
Heerlen
[email protected] Phone +3145-5707486 Fax +3145-5706272
1.4 Name of the collection The name of the survey in its original language(s) and in English (e.g. name used in the statistical office’s English website).
Onderzoek ICT gebruik bij huishoudens en personen, 2015
Survey on ICT usage in Households and by Individuals, 2015
T H I S P L A C E C A N B E U S E D T O P L A C E T H E N S I N A M E A N D L O G O

Community Survey on ICT usage in households and by individuals 2016 HH -p2 NL
1.5 Date / Last update of this report Please indicate the date of the last update of this report, for the case we have several versions (i.e. use different dates for the metadata report and the quality report).
November 4th 2016
New update: November 16th 2016

Community Survey on ICT usage in households and by individuals 2016 HH -p3 NL
2. General methodological information
2.1 Reference period(s) The main reference period for the ICT variables as well as the background variables, e.g. first quarter of the year or last three months before the interview (with an indication of the respective months), or a specific date.
Last three months before the day of interviewing
2.2 Survey period The beginning and end date – if already known – of the data collection period.
Data collection in April and May 2015. The start of the fieldwork is April 1th (last week of March letter of invitation to the sample persons). Usually May 31th is the last day of data collection.
2.3 Survey vehicle Stand-alone or embedded in another survey. If embedded, give a short description of the survey the ICT modules are inserted in.
Stand-alone survey
2.4 Survey type Short description of the survey type (face-to-face interview, self-administered mail survey, telephone interview, combination of techniques, other; etc.).
If a combination of techniques was applied, please indicate the proportion of each technique related to the total number of achieved interviews.
A mixed-mode of two data collection modes was applied. First step (CAWI: Computer Assisted Web Interviewing) and Second step (CATI: Computer Assisted Telephone Interviewing).
The proportion of CAWI of the total number of achieved interviews is 68%, CATI 32%
2.5 Survey participation Please indicate whether the survey is mandatory or voluntary.
The survey is voluntary ( as usual in the Netherlands)
2.6 Main methodological differences compared to previous survey(s) If any, indicate the changes in methodology that may have an impact on the (comparability over time of the) results delivered to Eurostat, e.g. survey type, change in reference period, new reference sampling frame, different scope, different grossing-up method, different treatment of non-response, etc. No need for giving detailed technical analyses, a bullet point overview of the main differences and the expected impact is sufficient.
The redesign of the ICT 2014 survey was maintained for the next annual ICT surveys in 2015 and 2016.

Community Survey on ICT usage in households and by individuals 2016 HH -p4 NL
3. Statistical unit(s), scope and target population
3.1 Statistical unit Please indicate whether the statistical unit follows recommendations by ticking Yes or No (and specify the deviations, if any):
Yes No (please specify the deviations)
Module A in the Eurostat model questionnaire: households with at least one member aged 16 to 74
X
Modules B to F in the Eurostat model questionnaire: individuals aged 16 to 74
X
3.2 Age groups covered Please indicate the age scope (in the Yes column), or tick No if not applicable
Yes No
Individuals younger than 16 ? If ticked, please specify (e.g. 12-15):
12-15
Individuals aged 16 to 74 ? X (compulsory)
Individuals older than 74 ? If ticked, please specify (e.g. 75-80):
75-high
3.3 Territorial coverage If applicable, indicate the parts of the country that are not included as well as an estimate of the resulting percentage of undercoverage (non-covered population compared to total country population).
The sample covers the total population in the Netherlands aged 12 years and older, living in private households
Universe Households Individuals
3.4 Target population The number of households and individuals in the target population (scope, universe). Please restrict the numbers to the Eurostat scope (if additional age groups are covered in the national survey, these can be reported separately between brackets). If not directly available, please provide an estimate (e.g. based on other social surveys). If not applicable, please indicate why.
Should be updated for 1.4.2016
7.0 mln households with
at least one member of 16-74
year
( no additional households for
the age group 12-15 years)
date: 1.4.2016
12.6 mln individuals aged 16-74 years old living in private
households
0.8 mln individuals aged 12-15 years old living in private
households
date: 1.4.2016

Community Survey on ICT usage in households and by individuals 2016 HH -p5 NL
3.5 Non-target population The approximate number of households and individuals outside the general scope of the survey (e.g. individuals younger than 16 or older than 74; households with all members over 74 years old), i.e. the difference between the total population (in terms of households or individuals) in the country and the target population). If not applicable, please indicate why.
Should be updated for 1.4.2016
0.8 mln Households with only members of
75+
date: 1.4.2016
1,2 mln individuals aged 75+ years old
living in private households
2.0 mln people younger than 12 years and about 0.3 mln people
living in institutions
date: 1.4.2016

Community Survey on ICT usage in households and by individuals 2016 HH -p6 NL
4. Questionnaire
4.1 Adoption of MANDATORY questions and items from the Eurostat model questionnaire 2016 The questions listed below and its items reflect the required coverage of subjects and characteristics of Annex 2 of the Commission Regulation (EC) 2015/2003 of 10 November 2015. Please indicate in the table possible comments on the question/item coverage in your national questionnaire, e.g. insertion of additional items, different reporting periods, deviations in the routing of ordering of the questions and/or items (see also §4.4), differences in definitions or classifications, alternative sources used (esp. in the background characteristics). Where applicable, please report on the coverage of the questions for age groups beyond the standard scope, i.e. for respondents younger than 16 or for respondents older than 74. Possible comments on this issue can be added to the general column on deviations.
Question Any deviations from question / items in Model Questionnaire
Covered for other age groups?
<16 >74
Module A : Access to selected ICTs � if not applicable, please leave blank
A1 Do you or anyone in your household have access to the Internet at home? No deviations x x
A2 What types of Internet connection are used at home? No deviations x x
A3 What are the reasons for not having access to the Internet at home? No deviations x x
Module B : Use of the Internet � if not applicable, please leave blank
B1 When did you last use the Internet? No deviations x x
B2 How often on average did you use the Internet in the last 3 months? No deviations x x
B3 On which of the following devices did you use the Internet in the last 3 months? No deviations x x
B4 For which of the following activities did you use the Smart TV in the last 3 months? No deviations x x
B5 Did you use any of the following mobile devices to access the Internet away from home or work in the last 3 months?
Tablet is asked as a separate mobile device x x
B6 For which of the following activities did you use the Internet in the last 3 months for private purposes? (18 items)
Item c: Separated items for participating in social networks and also for frequency of
participating x x
B7 Did you use storage space on the Internet to save documents, pictures, music, video or other files for private purposes in the last 3 months, e.g. Google Drive, Dropbox, Windows OneDrive, iCloud, Amazon Cloud Drive?
No deviations x x
B8 Have you conducted any of the following learning activities over the internet for educational, professional or private purposes in the last 3 months?
No deviations x x
Module C : Use of e-Government
C1 Did you contact or interact with public authorities or public services over the internet for private purposes in the last 12 months for the following activities?
Separated questions are used for the measuring of contact or interact of public authorities and public services x x

Community Survey on ICT usage in households and by individuals 2016 HH -p7 NL
Question Any deviations from question / items in Model Questionnaire
Covered for other age groups?
<16 >74
C2 What were the reasons for not submitting completed forms to public authorities' websites for private purposes in the last 12 months?
No deviations x x
Module D : Use of e-Commerce � if not applicable,
please leave blank
D1 When did you last buy or order goods or services for private use over the Internet ?
Separated question for excluding SMS/MMS
or manually typed mails x x
D2 What types of goods or services did you buy or order over the Internet for private use in the last 12 months?
No deviations x x
D3 From whom did you buy or order goods or services for private purpose over the Internet in the last 12 months?
No deviations x x
D4 How many times did you order or buy goods or services over the Internet for private use in the last 3 months?
No deviations x x
D5 How much as an estimate did you spend buying or ordering goods or services over the Internet (excluding shares or other financial services) for private use in the last 3 months?
No deviations x x
D7 How often did you use the following online information before you bought or ordered goods or services over the Internet for private use in the last 12 months?
No deviations x x
D8 Have you bought or ordered any good or service for private use over the Internet by clicking/buying straightaway through an advertisement on a social media website or app (e.g. Facebook) in the last 12 months?
No deviations
x x
D9 Did you carry out any of the following financial activities over the internet (excluding e-mail) for private purposes in the last 12 months?
No deviations x x
Module E : E-Skills � if not applicable,
please leave blank
E1 Which of the following computer or mobile device related activities have you carried out in the last 12 months?
No deviations <16 x >74 x
E2 Which of the following software related activities have you carried out in the last 12 months?
No deviations <16 x >74
Module F : Privacy and protection of personal identity
� if not applicable,
please leave blank
F1 What type of personal information did you provide over the internet in the last 12 months?
No deviations x x
F2 Have you carried out any of the following to manage access to your personal information on the internet in the last 12 months?
No deviations x x
F3 Did you know that cookies can be used to trace movements of people on the Internet, to make a profile of each user and service them tailored ads?
No deviations x x

Community Survey on ICT usage in households and by individuals 2016 HH -p8 NL
Question Any deviations from question / items in Model Questionnaire
Covered for other age groups?
<16 >74
F5 Have you ever changed the settings in your internet browser to prevent or limit the amount of cookies put on your computer?
No deviations x x
F6 Do you use anti-tracking software (software that limits the ability to track your activities on the internet)?
No deviations x x
Socio-demographic background variables � if not applicable,
please leave blank
G1 Age No deviations (register) x x
G2 Sex No deviations (register) x x
G3 Country of birth No deviations (register) x x
G4 Country of citizenship No deviations (register) x x
G6 Educational level (according to ISCED 2011) No deviations x x
G7 Employment situation – mandatory variables - No deviations x x
G8 Occupation (according to ISCO, 4 variables) No deviations na na
G9 Region of Residence, NUTS 1 No deviations (register) x x
G11 Geographical location: «less developed region«, «transition region«, «more developed region«
No deviations (register) x x
G12 Degree of urbanisation No deviations (register) x x
G13 Number of members in the household – mandatory variable -
No deviations x x
G14 of which, number of children under 16 – mandatory variable -
No deviations x x
4.2 Adoption of OPTIONAL questions and items from the Eurostat model questionnaire 2016 Please indicate in the table below if and which optional variables and questions were included in the national questionnaire. For each question or item, an "x" in the column named Question included means that it was included in the national questionnaire. Where applicable, please report also on the coverage of the questions for age groups beyond the standard scope, i.e. for respondents younger than 16 or for respondents older than 74.
Question / Item Question included ?
Any deviations from question / items in Model Questionnaire
Covered for other age groups?
<16 >74
A2c Dial-up access over normal telephone line or ISDN
Yes, the order of the questions is different and some more sub
questions are used x x
A2d Mobile narrowband connection (less than 3G) See A2c x x
B8d Other (learning activities over the internet)
In the national questionnaire some more sub questions are used and because of this the
answer option other can have a different meaning here.
x x
Community Survey on ICT usage in households and by individuals 2016 HH -p9 NL
Question / Item Question included ?
Any deviations from question / items in Model Questionnaire
Covered for other age groups?
<16 >74
C2e Reason for not submitting completed forms: Lack of or problems with electronic signature or electronic ID/certificate
No deviations x x
D6 Did you encounter any of the following problems when buying or ordering goods or services over the Internet for private use in the last 12 months? (10 items)
No deviations x x
F4 How concerned are you with your online activities being recorded to provide you with tailored advertising?
No deviations x x
G5 De facto marital status No deviations (register) x x
G7 Full time employment No deviations x x
G7 Part time employment No deviations x x
G7 Employee No deviations x x
G7 Employee, permanent - -
G7 Employee, temporary - -
G7 Self-employed (incl. family workers) No deviations x x
G7 Economic sector (10 items) No deviations x x
G7 Details on status for other, not in the labour force (5 items) - -
G8 Coverage of all ISCO-08 2-digit categories No deviations na na
G10 Region of Residence, NUTS 2 No deviations (register) x x
- Region of Residence, NUTS 3 for production of new regional breakdowns (rural/intermediate/urban)
No deviations (register) x x
G13 Number of persons aged 16-24 No deviations (register) x x
G13 Number of students aged 16-24 No deviations (register) x x
G13 Number of persons aged 25-64 No deviations (register) x x
G13 Number of persons aged more than or equal to 65 No deviations (register) x x
G14 Number of children aged from 14 to 15 No deviations (register) x x
G14 Number of children aged from 5 to 13 No deviations (register) x x
G14 Number of children aged less than or equal to 4 No deviations (register) x x
G15 Household income in quartiles No deviations (register) x x
G15 Household income (equivalised) in quintiles No deviations (register) x x

Community Survey on ICT usage in households and by individuals 2016 HH -p10 NL
4.3 Additional questions introduced in the national questionnaire, if any
- Access to devices and devices with access internet in the household
- Receiver for digital radio
- Place of internet use
- Some internet activities (downloading film, music, finding job, discussion forum for social or political topics)
4.4 Effects of deviations from the routing used in the Eurostat model questionnaire, if any
No effects of deviations
Community Survey on ICT usage in households and by individuals 2016 HH -p11 NL
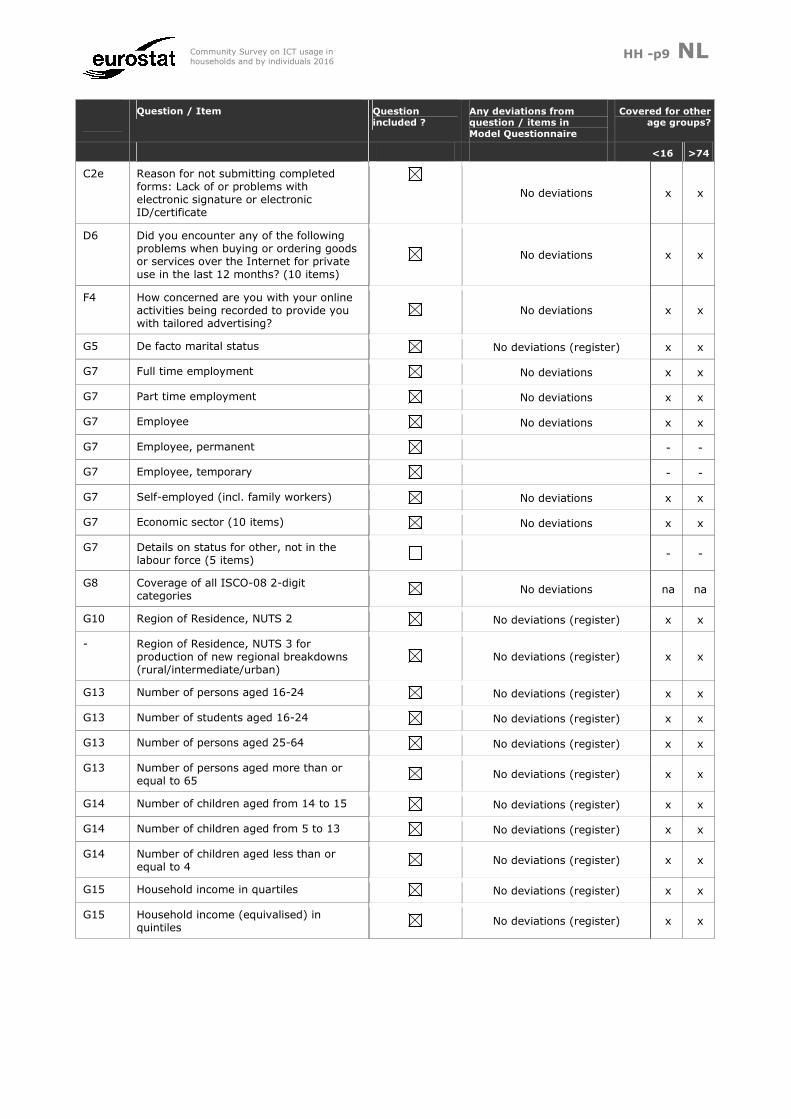
5. Sampling frame
5.1 Name and short description of the sampling frame or register used
Please mention the frame population and the units listed therein (e.g. districts, municipalities, addresses, households, persons, telephone numbers, etc.).
If the sample is selected from a sample of another survey, from a micro-census or from a master sample (in the case of multi-phase sampling designs), then please mention the frame population used for the other survey/the micro-census/the master sample.
If more than one sampling frame are used e.g. one sampling frame for each sampling stage or one sampling frame for each national region, then please mention all of them.
Please describe if different frames are used to draw the sample and to gross up.
Please mention if RDD (Random Digit Dialling) is used.
Sample frame: Municipal Population Register (GBA). This register contains all the persons who are registered in Dutch municipalities
5.2 Is the sample drawn from another survey sample, master sample or micro-census?
If yes, please, name the survey: Insert text
If yes, then the sampling stages used to select the other survey sample have to be further included in the description of sampling design.
If yes, then we have a case of multi-phase sampling.
Yes No
5.3 Known shortcomings of the sampling frame, if any Shortcomings in terms of timeliness (e.g. time lag between last update of the sampling frame and the moment of the actual sampling), geographical coverage, coverage of different subpopulations, etc.
Advantage of using the Municipal Population Register is the actuality of information from the registered individuals. Information about birth, death, move (house), new addresses et cetera is coming in daily. Regular the information is incorporated in the mentioned register. After the register is brought up to date in month t, individuals are selected for interviewing in month t+2

Community Survey on ICT usage in households and by individuals 2016 HH -p12 NL
6. Sampling design
6.1 Is the sampling design a probability design? A probability sampling design ensures known probabilities for units selected. In practice, non-response generally makes samples depart from the probability ones. However, the point here is to report on whether or not the gross sample (net sample plus non-respondents) has been selected in a probability way.
Yes No
6.2 What is the number of sampling stages? If the survey sample is selected from a sample of another survey, from the micro-census or from the master sample, then please include the number of sampling stages from all sampling phases into the total number of sampling stages.
If there are differences in the same country with regard to the number of sampling stages for different population groups, e.g. one-stage sampling in urban areas and two-stage sampling in rural areas, then report the number of sampling stages for each of the population groups.
For the ICT survey a stratified two-stage sample is used
6.3 Is there (explicit) stratification at the first stage? If there are differences as regards stratification at stage 1 between population groups (e.g. rural/urban, etc.), then please answer separately for each case.
Yes No
6.4 What are the stratification variables at the first stage? Examples:
-region/ province/ county/ district/ code of administrative territories; -size/ population density/ degree of urbanisation; -type of municipality/ settlement; -type of residence: urban/ rural; -age, gender, etc.
In the first stage NUTS3 is used as stratification variable. Then municipalities are selected. Large municipalities being selected with a probability of 1. All the other municipalities are selected at random, taking into account the size of the municipalities. In the second stage the number of individuals, as determined for every municipality, are selected. Individuals from 12 year and older are selected.

Community Survey on ICT usage in households and by individuals 2016 HH -p13 NL
6.5 What is the sampling method at the first stage? The sampling method (for the sampling units) refers to the way the sample is selected. For example, the sampling method can be a simple random sampling, whereby all samples are given the same probability of selection. Other possible methods include systematic sampling with equal or unequal probabilities, other proportional-to-size sampling (πps), etc.
Please mention if the systematic sampling has stratification effect (gives rise to implicit stratification). If there are differences as regards the sampling design at stage 1 between population groups (e.g. rural/urban, etc.), then please answer separately for each case.
Exhaustive selection Simple random sampling Systematic sampling with equal probabilities
With stratification effect, please mention the related auxiliary variable: Insert Text Without stratification effect
Systematic sampling with probabilities proportional-to-size With stratification effect,
please mention the related auxiliary variable: Insert text Without stratification effect
Other proportional-to-size (πps) sampling, please indicate: Insert Text Other, please indicate: Insert text
For stage 1 it is important to know if there are self-representing primary sampling units (with probability of selection equal to 1). Please mention if this is the case:
Yes, see the answer on 6.4
6.6 What is the sampling unit at the first stage (PSU)? Examples: census enumeration areas, sections, municipalities, communes, villages, settlements, households, individuals, etc.
If there are differences in the same country with regard to the type of primary sampling units (PSUs), e.g. households as PSUs in urban area and villages as PSUs (and households as SSUs) in rural areas, then report the relevant sampling unit at stage 1 for each of the population groups. Please do this also for the sampling units at further stages at the next questions.
At the first stage municipalities are selected
6.7 Are the sampling units at the first stage self-representing? In case of self-representing primary sampling units i.e. of PSUs purposefully included in the sample (selected with probability of one), these are treated as primary strata and their secondary sampling units are treated as primary sampling units.
Yes No
6.8 If yes to 6.7
What is the sampling unit at the second stage (SSU)? Examples: dwellings, households, individuals, etc.
In case of self-representing primary sampling units, the secondary sampling units are treated as primary sampling units.
Individuals from 12 years and older

Community Survey on ICT usage in households and by individuals 2016 HH -p14 NL
6.9 What is the sampling unit at the ultimate stage? Examples: dwellings, households, individuals, etc.
Individuals
6.10 How many individuals are interviewed in the household? Interviewed units are units from which data are collected. The interviewed unit can be different from the ultimate sampling unit.
For instance, the sampling unit at an ultimate stage can be a household and the interviewed unit can be an individual (all eligible individuals in the household are interviewed — this is a cluster sampling).
Furthermore, the sampling unit at the ultimate stage can also be an individual and the interviewed unit can be all eligible individuals in the same household. This is an indirect cluster sampling.
One or some
All
6.11 Does the survey have a longitudinal component? The survey collects data from the same sample elements on multiple occasions over time.
Yes No
6.12 If yes to 6.11, please provide additional information! If the survey sample is based on rotation groups, please specify the number of rotation groups.
Are the rotation groups of equal sizes?
What is the frequency of rotation of groups?
How are new rotation groups selected?
If the survey sample is drawn from another survey sample/micro-census/master sample, then does the rotation take place at the level of the other survey sample/micro-census/master sample?
Insert text
6.13 Please provide any additional information on the sampling design.
Sample persons who have not responded by internet in the first step are re-approached in the second step by phone (if a phone number is available), still to take part on the survey. The service and telephone registers of Experian is used to search for fixed and mobile telephone numbers.
Sample size Households Individuals (aged 16 to 74)
Individuals(younger than
16)
Individuals (older than 74)
6.14 Gross sample size The number of households/individuals initially selected from the sampling frame (if not applicable, please indicate why). Please restrict the numbers in the first two columns to the Eurostat scope (if additional age groups are covered, these can be reported separately in the last two columns).
See individuals 12 421
� if not applicable, please leave blank
758 1 207
6.15 Net sample size The number of households/individuals that can be used in the final database (if not applicable, please indicate why).
To be filled in under §7.C (final report)

Community Survey on ICT usage in households and by individuals 2016 HH -p15 NL
7. Response and non-response (quality report)
Note: This chapter only deals with non-response error. Other non-sampling error such as frame errors, measurement and processing errors or model assumption errors are discussed elsewhere or outside the scope of this methodological report.
UNIT NON-RESPONSE Unit non-response occurs when not all elements (households and/or individuals) of the gross sample (i.e. the initial sample drawn from the reference sampling frame) participate in the survey and are thus not included in the net sample. However, not all types of non-response are taken into account when calculating the response rate (in §7.D) as they can be rather related to the quality of e.g. the sampling frame than to the quality of the survey data. Note: In this report - for reasons of comparability across countries - all non-contacts are considered to be non-response of eligible cases (where in reality some of the non-contacts may concern ineligible cases). If additional age groups were covered, please report separately for individuals in the general scope (16-74), and any additional age groups covered (see the last two columns). If no additional age groups were covered (see also §3.2 and §4.1), the last two columns can be left blank.
Number of households
Number of individuals
(aged 16-74)
Number of individuals
(<16)
Number of individuals
(>74)
7.A Gross sample size The number of households/individuals initially selected from the sampling frame (if not applicable, please indicate why).
See individuals
10 450 � if not applicable, please leave as is
645 754
Type of unit non-response (ineligible cases)
Number of households
Number of individuals
(aged 16-74)
Number of individuals
(<16)
Number of individuals
(>74)
7.1 Ineligible: out-of-scope E.g. selected household is not in the target population because all members are over 75 years old.
See individuals
Not applicable
� if not applicable, please leave as is
-1 -1
7.2 Other ineligible E.g. no dwelling exists at the selected address or selected individual has died between the reference data of the sampling frame (cf. §5.2) and the moment of the interview.
See individuals
721 41 41
7.B Number of eligible elements I.e. the gross sample size corrected for the ineligible cases. ► [§7.B] = [§7.A] – [§7.1] – [§7.2]
See individuals
9 729 604 713
Type of unit non-response (eligible cases) Number of households
Number of individuals
(aged 16-74)
Number of individuals
(<16)
Number of individuals
(>74)
7.3 Non-contact E.g. no one was home or postal survey was never sent back.
See individuals
773
� if not applicable, please leave as is
41 10

Community Survey on ICT usage in households and by individuals 2016 HH -p16 NL
7.4 Refusal E.g. selected household or individual was contacted but refused to take part in the survey.
See individuals
1 021 85 73
7.5 Inability to respond E.g. selected household or individual was unable to participate due to language barriers or cognitive or physical incapacity to respond.
See individuals
213 15 97
7.6 Rejected interviews E.g. the selected household/individual did take part but the survey form cannot be used (poor quality - e.g. strong inconsistencies; unacceptable item-response – e.g. individual left most of the questions unanswered; survey form got lost and interview cannot be repeated; etc.).
See individuals
34 1 9
7.7 Other non-response Please specify the other types of non-response encountered. Note: please add the other non-response related to ineligibility of the selected elements under §7.2. Cannot be interviewed: moved to another home
No contact by phone (wrong phone number)
No phone number available for interviewing
See individuals
237
43
2 846
9
0
161
4
5
110
7.C Net sample size The number of households/individuals that can be used in the final database (if not applicable, please indicate why). This notion corresponds to the final sample in the Tabulation Scheme. ► [§7.C] = [§7.B] – [§7.3] – [§7.4] – [§7.5]
– [§7.6] – [§7.7]
See individuals
4 561 291 404
Community Survey on ICT usage in households and by individuals 2016 HH -p17 NL
Households Individuals (aged 16-
74)
Individuals (<16)
Individuals (>74)
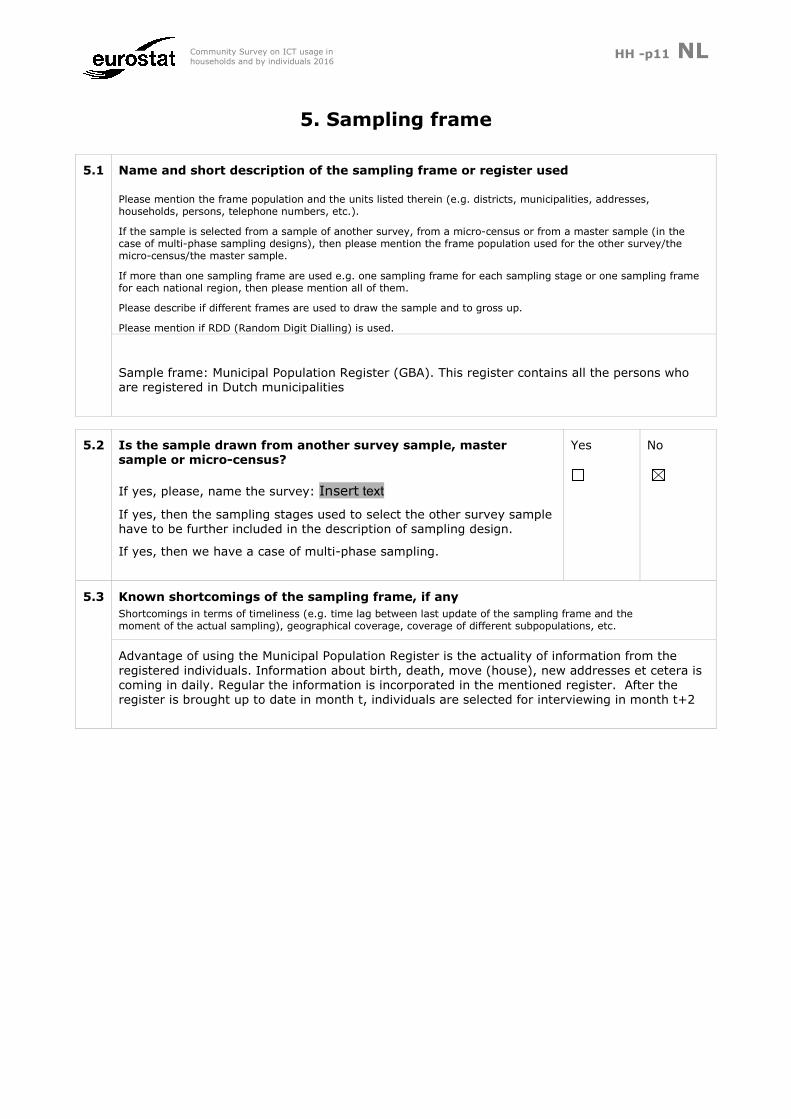
7.D Unit response rate The unit response rate is the ratio of the number of in-scope respondents (= the number of achieved interviews or the net sample size, see §7.C) to the number of eligible elements selected from the sampling frame (see §7.B). The number of eligible elements equals the gross sample size (see §7.A) minus the ineligible cases (see §7.1 and §7.2). ► [§7.D] = [§7.C] / [§7.B]
See individuals
46,9 � if not applicable, please leave as is
48,2 56,7
7.8 Comments on the unit response rate, if any
The overall response rate (cawi + cati) was calculated
7.9 Methods used for minimizing unit non-response Where applicable, give a description of measures taken to reduce the unit non-response:
• advance notification in the form of a letter or phone call; • system of reminders, number of visits, number of attempts for phone calls, etc. • showing respondents how the data they are providing are being used; • etc.
In advance a letter of notification was sent to the household/individual. For persons under 16 the approval of the parents was asked. In the first step (April) sample person are asked to take part at the survey by answering the questionnaire by internet. This request is followed up by a reminder after two weeks and a second reminder one week after the first reminder. In the second step (May), sample persons are approached/interviewed by phone (if available) and 6 (fixed) or 7 (mobile) phone calls were allowed to make contact
7.10 Methods used for dealing with unit non-response Indicate whether imputations are made for unit non-response and give a short description of the methods used (e.g. correction factor in the weighting procedure, imputation based on background characteristics known from the sampling frame, etc.).
Weighting procedure individuals: The subgroups for which weighting factors are calculated are based on the demographic and socio-economic variables: sex, age, marital status, origin, income, size of the household, urban density and region. These weighting factors partially correct biases caused by the unit non-response for target variables, such as the use of computer and internet.
The weighting factor for households is the quotient of: the individual weighting factor / household size of individuals aged 16-74 in the population

Community Survey on ICT usage in households and by individuals 2016 HH -p18 NL
7.11 Has substitution been used? Please indicate whether the instructions to interviewers allow for proxy interviews (another person in the household than the one who was randomly selected can answer the questions).
If yes, please give an estimate of the percentage of proxy interviews (compared to the total number of interviews).
Substitution rate (%) 0%
On which criterion has the selection of the substituted units been based?
Insert text
Yes No
ITEM NON-RESPONSE Item non-response occurs when a respondent provides some, but not all, of the requested information, or if the reported information is not useable (note that entirely non-useable questionnaire are already counted in the unit non-response, see §7.6). It may occur for a variety of reasons. Items may be missing because the respondent broke off the interview after partially completing it (but enough data were provided so that the questionnaire is not classified as a unit non-response). Items may be missing because the respondent inadvertently skipped an item, a module or a page (especially in self-administered mail surveys). Or a respondent may simply not have the information on the question (and no don’t know option is foreseen) or refuse to give the requested information. As item non-response usually goes hand-in-hand with systematic bias (e.g. the proportion of No answers may be higher among people with item non-response compared to those who did answer on a specific item), it is useful to assess the degree and impact of this type of non-response.
7.12 Questions or items with item response rates below 90% If any, identify the items with low response rates (the cut-off value to be used is 0.90) and indicate their respective response rates. The item non-response rate should of course be calculated taking into account the routing and filtering in the questionnaire.
On the household question of type of broadband connection more than 10% of the respondents answered with don’t know’. So the figures of this (sub) items are unreliable and not usable, without correction or imputation (see 7.13 and 7.15).

Community Survey on ICT usage in households and by individuals 2016 HH -p19 NL
7.13 What imputation methods have been used? Indicate whether imputations are made for item non-response and give a short description of the methods used (e.g. nearest-neighbour imputation, hot deck imputation, mode imputations within classes, etc.).
(Multiple choices possible)
None
Deductive imputation
An exact value can be derived as a known function of certain characteristics (e.g. the value received for a family allowance is a known function of certain characteristics like income class, age of children, etc. As soon as those characteristics are known, it becomes possible to calculate the value of a family allowance without error.)
Deterministic imputation
Deterministic imputation leads to estimators with no random component, that is, if the imputation were to be re-conducted, the outcome would be the same.
Mean/Median
Mean/Median by class
Regression-based
Donor
Other (please specify): Insert Text
Random imputation
Random imputation leads to estimators with a random component, that is, if the imputation were re-conducted, it would lead to a different result.
Hot-deck
Cold-deck
Simulated residuals
Other (please specify): Insert text
Multiple imputation
Multiple imputation methods offer the possibility of deriving variance estimators by taking imputation into account. In multiple imputation each missing value is replaced (instead of a single value) with a set of plausible values that represent the uncertainty of the right value to impute. The incorporation of imputation variance can be easily achieved based on the variability of estimates among the multiply imputed data sets.
7.14 What was the overall imputation rate for the main indicators?
For each of the target indicators below, please report the proportion of observations that are imputed values. Moreover, if applicable, please report the share of the estimate that is contributed by the imputed values.
Main target indicator
Imp. Rate
(% of observations)
Imp. Rate
(share of estimate)
Proportion of households having access to the Internet at home
(item ‘Yes’ in A1 of the 2016 model questionnaire)
0% 0%
Proportion of households using a broadband connection
(a ‘Yes’ on option a or b in A2 of the 2016 model questionnaire)
2.4%
96.8%
Proportion of individuals regularly using the Internet: overall
(indivduals who ticked option 1 or 2 in B2 of the 2016 model questionnaire)
0% 0%

Community Survey on ICT usage in households and by individuals 2016 HH -p20 NL
7.15 Other comments relating to the item non-response If any, please use this box to inform on additional issues on the non-response calculation (e.g. method used in national publications, etc.).
An imputation in 2016 was made again for the household/persons who had answered don’t know on the question on access to broadband (question A3, item a = fixed broadband). The results of the sub items fixed broadband and mobile broadband connection are not reliable and could not be used for analyses. For the imputation we compared simply the DK answers from respondents with the internet activities. If there are 2 or more specific broadband activities like telephoning by internet or reading paper, watching TV etc., the DK answer was ticked first as fixed broadband and added up with mobile broadband to the total of broadband.
The results of this imputation are used for the delivered micro data of individuals and households of the survey on ICT usage 2016. Figures about the total of broadband are quite usable, but as mentioned the data for the sub items fixed and mobile broadband are unreliable

Community Survey on ICT usage in households and by individuals 2016 HH -p21 NL
8. Grossing-up procedures (quality report)
Please give a description of the extrapolation or weighting procedures used to gross up the households (§8.1) and the individuals (§8.2) in the net sample to the (target) population, discussing the different steps taken or factors applied to the design weighting to take into account the (post)stratification, balancing for unit non-response, etc. In case similar methods are used for grossing-up the net samples of households and individuals, the discussion can be integrated under one heading.
How were the design weights calculated?
Was balanced sampling used and what are the balancing variables?
Has re-weighting for units non-response been performed?
Has adjustment to external data sources been performed?
Is the sample self-weighted?
8.1 Grossing-up procedures for households
The grossing-up procedure for households was enclosed in the weighting procedure (see also question 7.10). All variables used in this procedure are containing the population numbers on the 1e of April 2016.
8.2 Grossing-up procedures for individuals
The grossing-up procedure for individuals was enclosed in the weighting procedure (see also question 7.10). All variables used in this procedure are containing the population numbers on the 1e of April 2016.

Community Survey on ICT usage in households and by individuals 2016 HH -p22 NL
9. Sampling error (quality report)
Standard error (for a selection of indicators)
The sampling error reflects the fact that only a particular sample was surveyed rather than the entire population. It is estimated by the standard error and can be expressed by the square root of the estimate of the sampling variance (σ θˆ )ˆ( ). The estimation of the sampling variance should ideally take into account the sampling design (e.g. the stratification).
Please comment on the approach for calculating sampling errors in §9.6. In case the standard errors are derived using the variance formula for simple random sampling and incorporating a factor which reflects the multi-stage, clustered nature of the sampling design, please provide more detailed information in §9.6 d and e.
Please indicate below the number of respondents (absolute value for Yes answers), the estimated value of the proportion (in %) as well as the respective standard error (in percentage points) for the indicators and subindicators mentioned.
Please note that the accuracy measure used, i.e. the STANDARD DEVIATION, was also addressed in the 2006-2014 report templates but differs from the 2004 and 2005 report templates (where the coefficient of variation was used).
The section 9.7 should be completed with comments on reliability and representativeness of results and completeness of dataset. The two questions should be left blank if not applicable, i.e. if standard errors found were adequate or if subgroups of the population had always a sufficient number of respondents.
Indicator or subindicator
- on households and individuals in the general scope (16-74) and related subgroups -
Number of respondents
Estimated proportion
(%)
Standard error (% points)
9.1 Proportion of households having access to the Internet at home (item ‘Yes’ in A1 of the 2016 model questionnaire)
4561 98,0 0,21
9.2 Proportion of households using a broadband connection (a ‘Yes’ on option a or b in A2 of the 2016 model questionnaire)
4561 96,8 0,26
9.3 Proportion of individuals regularly using the Internet: overall (indiv. who ticked option 1 or 2 in B2 of the 2016 model questionnaire)
4561 96,8 0,26
9.3.1 Proportion of ind. regularly using the Internet: males (as % of all men)
2241 93,8 0,51
9.3.2 Proportion of ind. regularly using the Internet: females (as % of all women)
2320 92,9 0,53
9.3.3 Proportion of ind. regularly using the Internet: age group 16-24 years (as % of all individuals aged 16-24 years)
654 97,2 0,64
9.3.4 Proportion of ind. regularly using the Internet: age group 25-34 years (as % of all individuals aged 25-34 years)
502 98,0 0,62
9.3.5 Proportion of ind. regularly using the Internet: age group 35-44 years (as % of all individuals aged 35-44 years)
671 96,7 0,69
9.3.6 Proportion of ind. regularly using the Internet: age group 45-54 years (as % of all individuals aged 45-54 years)
1053 95,9 0,61
9.3.7 Proportion of ind. regularly using the Internet: age group 55-64 years (as % of all individuals aged 55-64 years)
1089 92,2 0,81
9.3.8 Proportion of ind. regularly using the Internet: age group 65-74 years (as % of all individuals aged 65-74 years)
592 79,1 1,67
9.3.9 Proportion of ind. regularly using the Internet: low educational level (as % of all individuals with low education)
1107 83,2 1,12
9.3.10 Proportion of ind. regularly using the Internet: medium educat. level (as % of all individuals with medium education)
1804 96,1 0,46
9.3.11 Proportion of ind. regularly using the Internet: high educational level (as % of all individuals with high education)
1472 99,0 0,26
9.3.12 Proportion of ind. regularly using the Internet: students (as % of all students)
153 96,7 1,44

Community Survey on ICT usage in households and by individuals 2016 HH -p23 NL
9.3.13 Proportion of ind. regularly using the Internet: employees or self-employed (as % of all employees or self-employed)
3139 97,0 0,30
9.3.14 Proportion of ind. regularly using the Internet: unemployed (as % of all unemployed)
119 95,0 2,01
9.3.15 Proportion of ind. regularly using the Internet: retired, other inactive (as % of all retired and other inactive)
1150 82,8 1,11
9.4 Proportion of individuals having submitted completed forms in the last 12 months (individuals who ticked item c in variable C1 of the 2016 model questionnaire)
4561 55,1 0,74
9.5 Proportion of individuals having ordered goods or services for private use over the internet in the last 12 months (individuals who ticked option 1 or 2 in variable D1 of the 2016 model questionnaire)
4561 75,0 0,64
9.6 Calculation of the standard error
There exist different methods by which the standard error of an estimated proportion can be assessed based on the distribution in the sample. Please, describe below the approach which you have followed. This information will help Eurostat to evaluate the comparability of the standard errors supplied in the previous section by the different statistical institutes participating in the survey.
a) Name and brief description of the applied estimation approach
Analytic Method Linearization Method Taylor linearization Linearization based on influence functions
Other, please specify: Insert Text Replication Methods Jackknife Bootstrap Balanced repeated Replication / Balanced half-samples Random Groups
Other, please specify: Insert Text Other, please specify: Insert Text
b) Basic formula
= √ p*q n
c) What tools were used?
CLAN GENESEES SUDAAN POULPE CALJACK BASCULA ReGenesees
Other, please specify: Insert Text
d) Do the methods take into account the effect of:
unit non-response?

Community Survey on ICT usage in households and by individuals 2016 HH -p24 NL
The variance estimator ( )θ̂V̂ has to be adjusted to take unit non-response into account. Different methods can be used: methods based on the assumption that respondents are missing at random or completely at random within e.g. strata or constructed response homogeneity groups, methods using the two-phase approach, etc.
If yes, please indicate:
imputation?
Imputation variance can be estimated if multiple imputation is used.
Replication and analytic methods can be used to incorporate imputation into variance estimation.
Deville and Särndal (1994) proposed a method for the regression imputed Horvitz-Thompson estimator.
If yes, please indicate:
coverage errors (over-coverage, multiple listings)?
Methodology of domain estimation can be used. Target population has to be defined as a domain of the frame population.
The related loss of precision can be quantified.
If yes, please indicate:
implicit stratification?
One way to consider implicit stratification is to define explicit strata, from which each of an independent sample is supposed to have been selected.
Other methods using analytic formulae are available.
If yes, please indicate:
rotating samples?
In case of rotating sample schemes, the overlap of samples between e.g. successive quarters reduces the precision of the average of estimates from e.g. quarterly samples and increases the precision for e.g. the quarter-to-quarter estimates of change.
If yes, please indicate:
calibration?
Methods to account for the effect of calibration on variance should be used. E.g. Deville and Särndal method (1992).
If yes, please indicate:
e) Main reference in the literature
Spss 20.0 Standard Errors of the Mean (SEMEAN). A measure of how much the value of the mean may vary from sample to sample taken from the same distribution. It can be used to roughly compare the observed mean to a hypothesized value (that is, you can conclude the two values are different if the ratio of the difference to the standard error is less than –2 or greater than +2).

Community Survey on ICT usage in households and by individuals 2016 HH -p25 NL
9.7 Comments on reliability and representativeness of results and completeness of dataset
These comments should reflect on the standard errors reported for the indicators and subgroups in 9.1 to 9.5 above as well as on the other indicators and breakdowns. The estimated standard error shall not exceed 2% points for the overall proportions and shall not exceed 5% points for the proportions relating to the different subgroups of the population where these subgroups constitute at least 10% of the total population in the scope of the survey. If problems were found, these could have implications for future surveys (e.g. need to improve sampling design or to increase sample sizes for households or individuals).
Indicators and breakdowns in sections 9.1 to 9.5 above:
No comments
Other indicators and breakdowns:
See 7.15 for broadband indicator
Community Survey on ICT usage in households and by individuals 2016 HH -p26 NL
10. Closing remarks
10.1 Problems encountered and lessons to be learnt These comments can relate to methodological issues as well as to the questionnaire itself (item construction, clarity of definitions to interviewers and respondents, routing and filtering, outcome of pre-tests, etc.)
No information
10.2 Other comments, if any
No comments
11. Annexes
Note: Please also provide the annexes in a computer-readable format and in English
11.1 Questionnaire in national language
11.2 Questionnaire in English (if available)
11.3 Interviewer instructions (if available)
11.4 National reports on methodology (if available)
11.5 Analysis of key results, backed up by tables and graphs (if available)
11.6 Other annexes Please give an overview of other annexes (whether or not referred to in the preceding chapters of this report)
• …
• …