Embed Size (px)
Citation preview
10th World Telecommunication/ICT
Indicators Meeting (WTIM-12) Bangkok, Thailand, 25-27 September 2012
Information document Document INF/26-E 2 October 2012
English
SOURCE: Information Technology Authority, Sultanate of Oman
TITLE: Information and Communication Technologies (ICT) Indicators (2011) Government and Higher Education Sector
INFORMATION AND COMMUNICATION
TECHNOLOGIES (ICT) INDICATORS (2011)
GOVERNMENT AND HIGHER EDUCATION SECTOR

HIS MAJESTY SULTAN QABOOS BIN SAID

4
5
Page No.
Introduction 7
Survey’sObjectives 8
SurveyMethodology 8
Survey’sReferenceYear 9
ListofFigures-GovernmentSector 10
ListofFigures-HigherEducationSector 11
InformationandCommunicationTechnologies(ICT)UsageinGovernmentSurvey(2011) 12
InformationandCommunicationTechnologies(ICT)AccesstoandUsageinHigherEducationSurvey(2011) 18
Contents

6
7
The Digital Oman Strategy/e.oman Initiative outlines the blueprintfor several key IT initiatives in the Sultanate ofOmanwhich aim toempower the citizens by providing meaningful interaction througheServices.
ThroughtheimplementationofeServices,thegovernmentseeksnewandinnovativewaystobetterengageandinteractwithcitizensinthedelivery of public services. It imperative that assessment is carriedoutalongwiththeexecutionoftheplan.Thisisessentialtoquantifythe successful implementationof thekey initiativesand to facilitateany challenges identified during the course of the implementation,effectively and efficiently. Information Technology Authority strictlyfollows “Core Information and Communication Technologies (ICT)Indicators” that have been developed under the umbrella ofInternational Telecommunication Union (ITU) by the Partnership onMeasuringICTforDevelopmentwhosemembersare:-
a. InternationalTelecommunicationUnion(ITU)
b. UnitedNationsConferenceonTradeandDevelopment(UNCTAD)
c. United Nations Educational, Scientific and Cultural Organization(UNESCO)
d. Eurostat
e. OrganisationforEconomicCo-operationandDevelopment(OECD)
f. United Nations Department of Economic and Social Affairs(UNDESA)
g. InstituteforStatistics(UIS)
h. TheWorldBank
i. Four United Nations Regional Commissions (the UN EconomicCommission for Africa, the UN Economic Commission forLatin America and the Caribbean, the UN Economic and SocialCommission for Asia and the Pacific, and theUN Economic andSocialCommissionforWesternAsia).
Thispublicationpresentstheresultsoftwosurveysforthereference
Introduction:
8
year of 2011; ICTUsage in Government Survey and ICT Access andUsageinHigherEducationSurvey.
ITAwishestothankallgovernmentandprivateorganizationwhohavecooperatedandassistedinconductingthesesurveys.
Survey’s Objectives:
• To measure ICT penetration rate in government and highereducationsectors.
• To compile ICT statistics fromgovernment and higher educationsectorstoassistdecisionmakersindevelopingstrategicplans.
• Collect and analyze ICT Indicators in compliance with theInternational Telecommunication Union (ITU) and GlobalCommunityunifiedindicatorsanddefinitionsofITsector.
• ToprovideICTdataforinternationalandregionalbenchmarking.
Survey Methodology:
Survey Sample:
• Government Sector: The survey covered most government entities. A total of 58
organizationsweresurveyedand91%(53entitiesresponded).
• Higher Education Sector: The survey covered most higher education institutions totally
around46whichareasfollow:• MinistryofHealth:(15)HealthInstitutes• MinistryofHigherEducation: (6CollegesofAppliedSciences
and16Private)HigherEducationInstitutions• MinistryofManpower:(7)TechnicalColleges• SultanQaboosUniversity• CollegeofBankingandFinancialStudies
Survey’s Period:
The Survey period including data collection, data validation, dataanalysisandfinalresultsapproximately4months.
9
Survey Questionnaire:
ThequestionnairesweredesignedaccordingtoITU-CoreICTindicators2010 that had been developed by themembers of the Partnershipon Measuring ICT for Development with consideration to ITA’srequirementstoimplemente.omanStrategy.
Training:
Allfocalpointsingovernmententitiesandhighereducationinstitutionsreceived training in data collection procedures. The questionnaireswereexplainedtoensuremaximumresponserateandaccuratedata.
Data Collection:
TheSurveywasonlineatITAwebsite(www.ita.gov.om).
Data Editing, Processing and Analyzing:
Data verification and validation was conducted by calling back viavariousmethods e.g. fax, emails and telephone calls. Data analysesweredonebyaspecializedstaffinanalyzingICTdata.
Survey’s Reference Year:
• Government Sector:Yearof2010.• Higher Education Sector:AcademicYearof2009\2010.
10
Figure
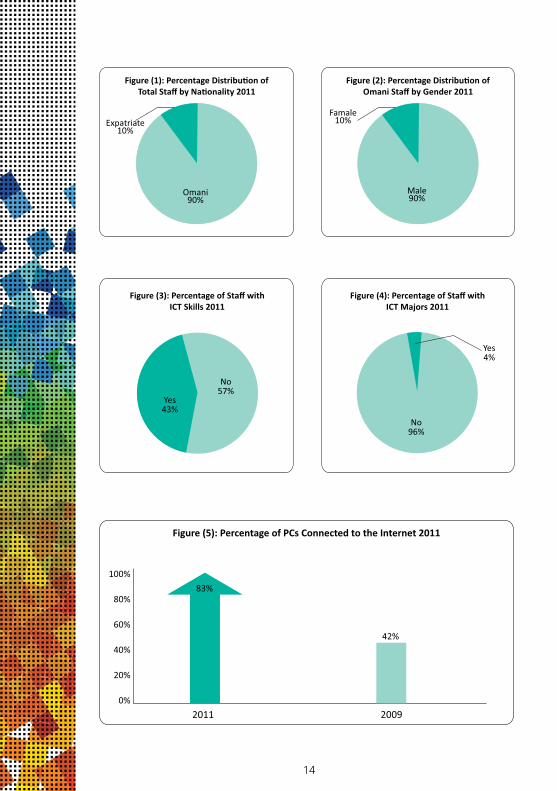
Figure (1): Percentage Distribution of Total Staff byNationality2011
Figure (2): Percentage Distribution of Omani Staff byGender2011
Figure (3): PercentageofStaffwithICTSkills2011
Figure (4): PercentageofStaffwithICTMajors2011
Figure (5): PercentageofPCsConnectedtotheInternet
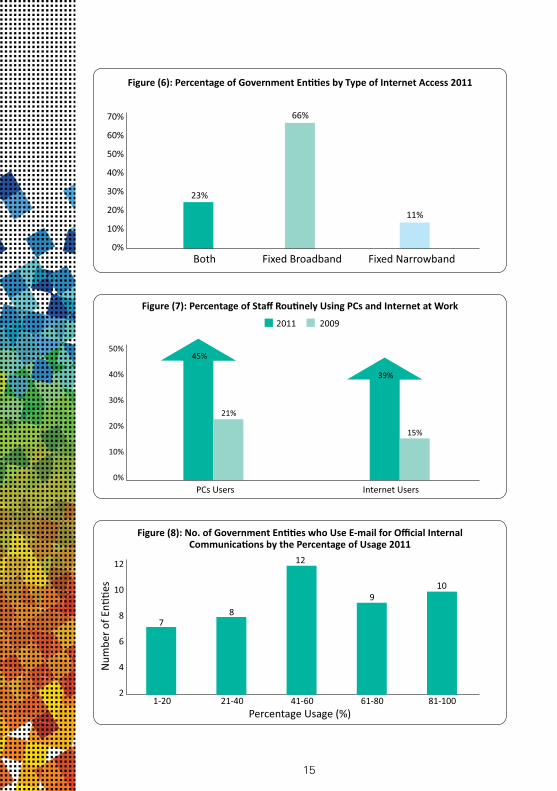
Figure (6): PercentageofGovernmentEntitiesbyTypeofInternetAccess2011
Figure (7): PercentageofStaffRoutinelyUsingPCsandInternetatWork
Figure (8): No.ofGovernmentEntitieswhoUseE-mail forOfficialInternalCommunicationsbythe PercentageofUsage2011
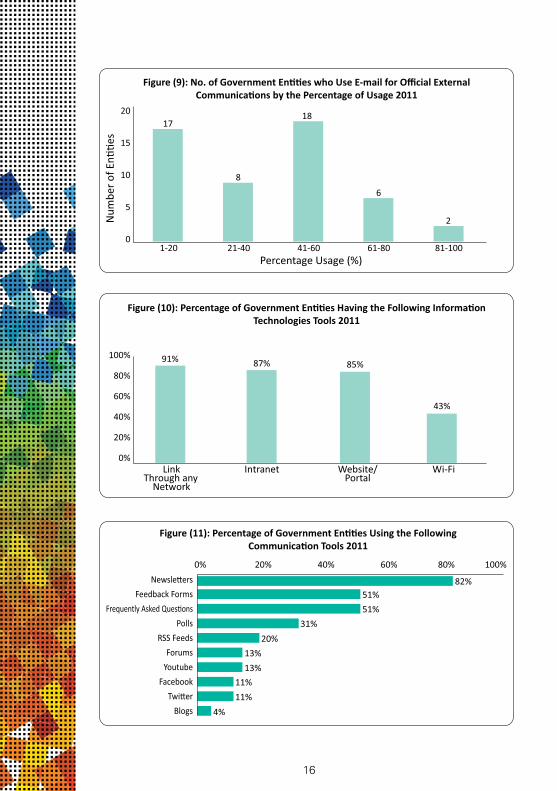
Figure (9): No.ofGovernmentEntitieswhouseE-mailForOfficialExternalCommunicationsbythePercentageofUsage2011
Figure (10): PercentageofGovernmentEntitiesHavingtheFollowingInformationTechnologiesTools,2011
Figure (11): Percentage of Government Entities UsingtheFollowingCommunicationTools,2011
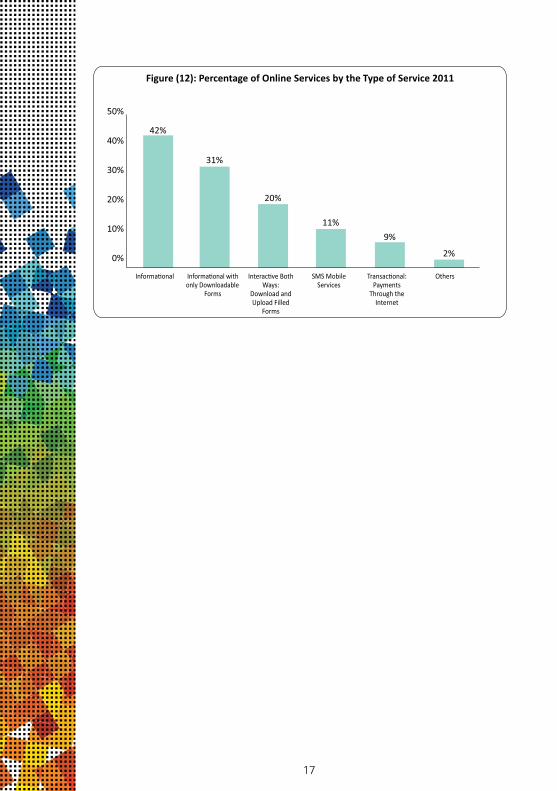
Figure (12): PercentageofOnlineServicesbythe TypeofService,2011
14
14
14
14
14
15
15
15
16
16
16
17
List of Figures- Government Sector
Page
11
Figure
Figure (13): Percentage of Institutions by Type and Type ofInternetAccess2011
Figure (14): PercentageofPCsConnectedtotheInternetbyTypeofInstitution2011
Figure (15): PercentageofInstitutionsthatProvideanOfficialE-mailAccountto
Figure (16): Percentage of Institutions that Provide anOfficialE-mailAccounttoAdmin.StaffbyTypeofInstitution2011
Figure (17): PercentageofInstitutionsthatProvideanOfficialE-mail Account to Academic Staff by Type ofInstitution2011
Figure (18): PercentageofInstitutionsthatProvideanOfficial E-mailAccounttoStudentsbyTypeofInstitution2011
Figure (19): Percentage of Institutions Having the FollowingInformationTechnologiesbyTypeofInstitution2011
Figure (20): Percentageof InstitutionsbyTypeof InstitutionandTypeofNetwork2011
Figure (21): PercentageofInstitutionsOffering2011
Figure (22): PercentageofICTMajorsoutofTotalMajors2011
Figure (23): PercentageofStaffWithICTMajorsandSkills
Figure (24): Percentage of Students Enrolled in ICT RelatedMajors2011
Figure (25): Percentage of Students Enrolled in ICT RelatedMajorsbyTypeofInstitution2011
Figure (26): Percentage of Students Enrolled in ICT RelatedMajorsbyGender2011
List of Figures- Higher Education Sector
Page
20
20
20
21
21
21
22
22
22
23
23
23
24
24
12
Information and Communication
Technologies (ICT) Usage in
Government Survey (2011)
13
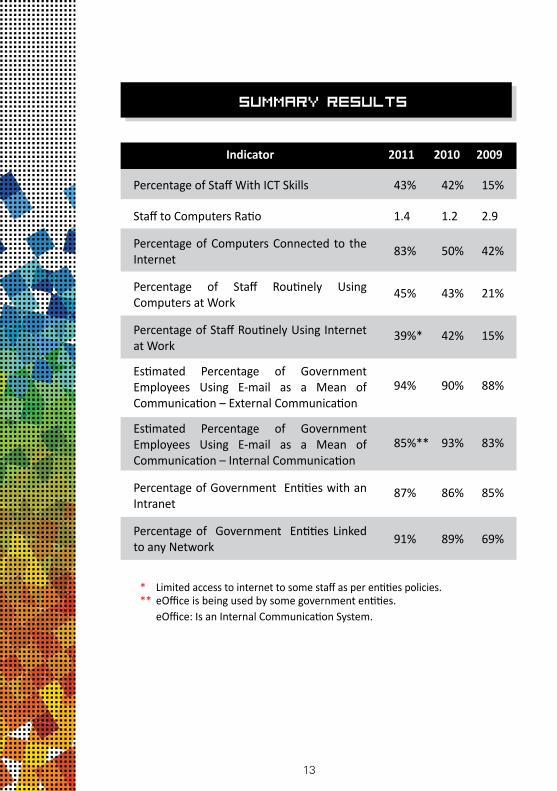
Summary Results
PercentageofStaffWithICTSkills
StafftoComputersRatio
PercentageofComputersConnected to theInternet
Percentage of Staff Routinely UsingComputersatWork
PercentageofStaffRoutinelyUsingInternetatWork
Estimated Percentage of GovernmentEmployees Using E-mail as a Mean ofCommunication–ExternalCommunication
Estimated Percentage of GovernmentEmployees Using E-mail as a Mean ofCommunication–InternalCommunication
PercentageofGovernmentEntitieswithanIntranet
Percentageof Government EntitiesLinkedtoanyNetwork
43%
1.4
83%
45%
39%*
94%
85%**
87%
91%
42%
1.2
50%
43%
42%
90%
93%
86%
89%
15%
2.9
42%
21%
15%
88%
83%
85%
69%
Indicator 2011 2010 2009
* Limitedaccesstointernettosomestaffasperentitiespolicies.** eOfficeisbeingusedbysomegovernmententities. eOffice:IsanInternalCommunicationSystem.
14
Figure (1): Percentage Distribu�on of Total Staff by Na�onality 2011
Omani90%
Expatriate10%
Figure (2): Percentage Distribu�on of Omani Staff by Gender 2011
Male90%
Famale10%
Figure (3): Percentage of Staff withICT Skills 2011
Figure (4): Percentage of Staff withICT Majors 2011
Yes4%
No57%
Yes43%
No96%
Figure (5): Percentage of PCs Connected to the Internet 2011
100%
80%
60%
40%
20%
0%
83%
42%
2011 2009
15
Figure (8): No. of Government En��es who Use E-mail for Official InternalCommunica�ons by the Percentage of Usage 2011
Percentage Usage (%)
Num
ber
of E
n��e
s
81-10061-8041-6021-401-20
12
10
8
6
4
2
12
910
87
Figure (7): Percentage of Staff Rou�nely Using PCs and Internet at Work
PCs Users Internet Users
50%
40%
30%
20%
10%
0%
45%
21%
39%
15%
2011 2009
Figure (6): Percentage of Government En��es by Type of Internet Access 2011
Both Fixed NarrowbandFixed Broadband
70%
60%
50%
40%
30%
20%
10%
0%
23%
66%
11%
16
Figure (10): Percentage of Government En��es Having the Following Informa�onTechnologies Tools 2011
Link Through any
Network
Intranet Website/Portal
Wi-Fi
100%
80%
60%
40%
20%
0%
85%
43%
91% 87%
Figure (11): Percentage of Government En��es Using the FollowingCommunica�on Tools 2011
82%51%
51%
31%
20%
13%
13%
11%
11%
4%
0% 20% 40% 60% 80% 100%
Newsle�ers
Feedback Forms
Frequently Asked Ques�ons
Polls
RSS Feeds
Forums
Youtube
Twi�er
Blogs
Figure (9): No. of Government En��es who Use E-mail for Official ExternalCommunica�ons by the Percentage of Usage 2011
Percentage Usage (%)
Num
ber
of E
n��e
s
81-10061-8041-6021-401-20
20
15
10
5
0
18
2
17
8
6
17
Figure (12): Percentage of Online Services by the Type of Service 2011
Informa�onal Informa�onal withonly Downloadable
Forms
Interac�ve BothWays:
Download and Upload Filled
Forms
SMS MobileServices
Transac�onal:Payments
Through theInternet
Others
50%
40%
30%
20%
10%
0%
42%
31%
20%
11%
9%
2%
18
Information and Communication
Technologies (ICT) Access to and
Usage in Higher Education Survey
(2011)
19
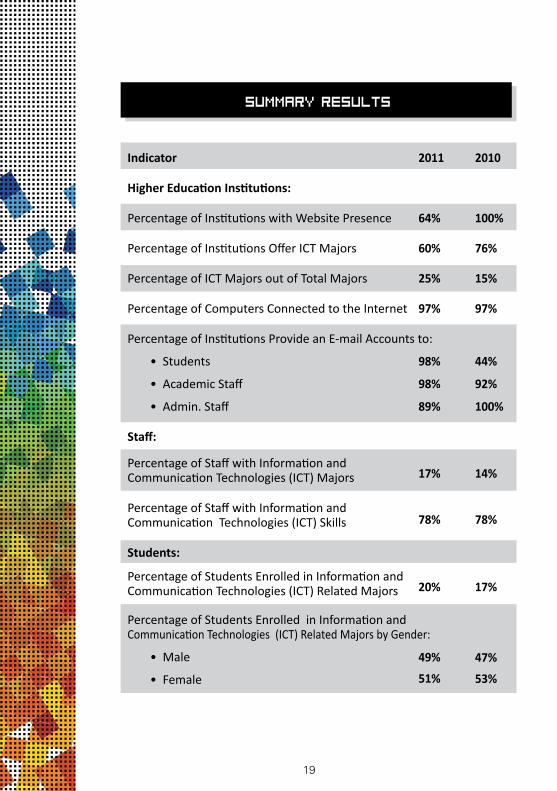
Indicator
Higher Education Institutions:
PercentageofInstitutionswithWebsitePresence
PercentageofInstitutionsOfferICTMajors
PercentageofICTMajorsoutofTotalMajors
PercentageofComputersConnectedtotheInternet
PercentageofInstitutionsProvideanE-mailAccountsto:
•Students
•AcademicStaff
•Admin.Staff
Staff:
PercentageofStaffwithInformationandCommunicationTechnologies(ICT)Majors
PercentageofStaffwithInformationandCommunicationTechnologies(ICT)Skills
Students:
PercentageofStudentsEnrolledinInformationandCommunicationTechnologies(ICT)RelatedMajors
PercentageofStudentsEnrolledinInformationandCommunicationTechnologies(ICT)RelatedMajorsbyGender:
•Male
•Female
2011
64%
60%
25%
97%
98%
98%
89%
17%
78%
20%
49%
51%
2010
100%
76%
15%
97%
44%
92%
100%
14%
78%
17%
47%
53%
Summary Results
20
Students Admin. StaffAcademic Staff
100%
80%
60%
40%
20%
0%
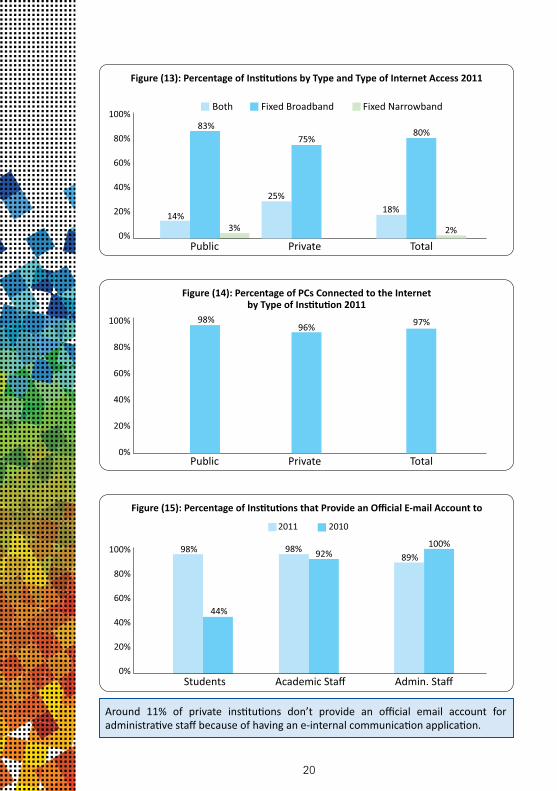
44%
92%98%98%
2011 2010
100%89%
Around 11% of private ins�tu�ons don’t provide an official email account for administra�ve staff because of having an e-internal communica�on applica�on.
Figure (15): Percentage of Ins�tu�ons that Provide an Official E-mail Account to
Figure (14): Percentage of PCs Connected to the Internetby Type of Ins�tu�on 2011
Public TotalPrivate
100%
80%
60%
40%
20%
0%
98%96% 97%
Figure (13): Percentage of Ins�tu�ons by Type and Type of Internet Access 2011
Public TotalPrivate
100%
80%
60%
40%
20%
0%
83%75%
25%
14%3% 2%
Both Fixed Broadband Fixed Narrowband
80%
18%
21
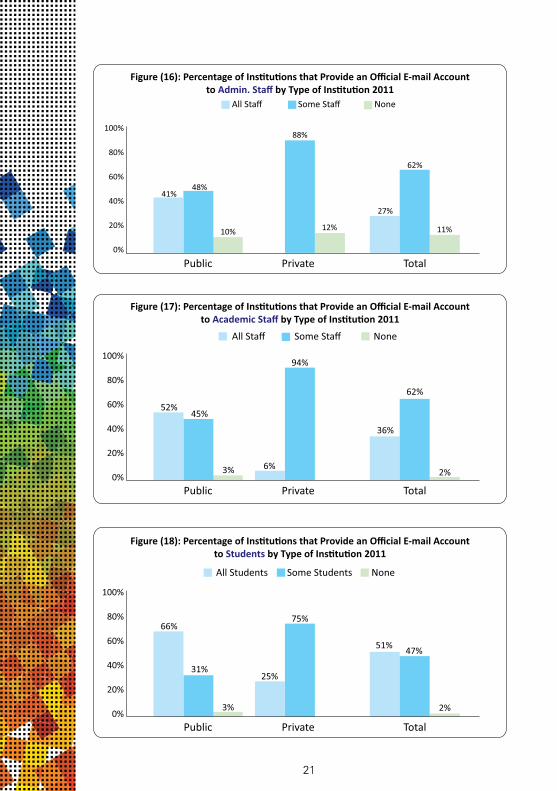
Figure (17): Percentage of Ins�tu�ons that Provide an Official E-mail Accountto Academic Staff by Type of Ins�tu�on 2011
Public TotalPrivate
100%
80%
60%
40%
20%
0%
45%
3% 2%
94%
52%
All Staff Some Staff None
62%
36%
6%
Figure (18): Percentage of Ins�tu�ons that Provide an Official E-mail Accountto Students by Type of Ins�tu�on 2011
Public TotalPrivate
100%
80%
60%
40%
20%
0%
31%
3% 2%
75%66%
All Students Some Students None
47%51%
25%
Figure (16): Percentage of Ins�tu�ons that Provide an Official E-mail Accountto Admin. Staff by Type of Ins�tu�on 2011
Public TotalPrivate
100%
80%
60%
40%
20%
0%
48%
10% 11%12%
88%
41%
All Staff Some Staff None
62%
27%
22
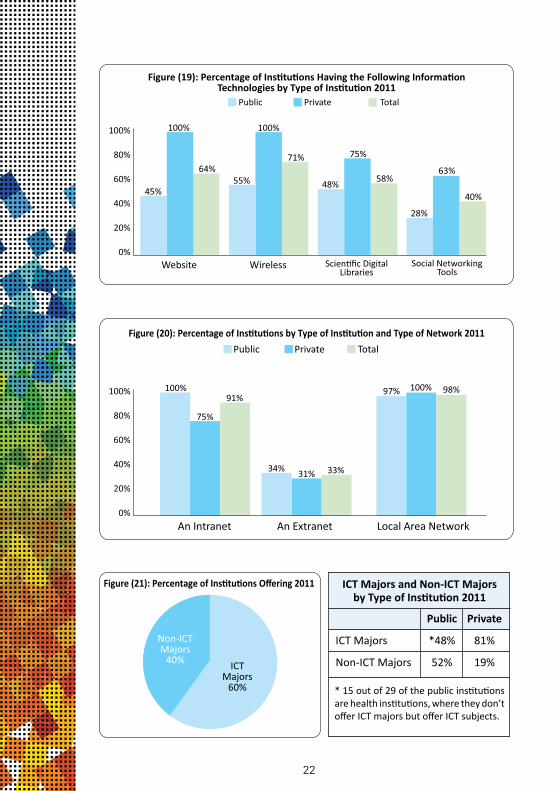
Figure (21): Percentage of Ins�tu�ons Offering 2011
ICTMajors
60%
Non-ICTMajors
40%
Figure (20): Percentage of Ins�tu�ons by Type of Ins�tu�on and Type of Network 2011
An Intranet Local Area NetworkAn Extranet
100%
80%
60%
40%
20%
0%
75%
91%
33%
98%
31%
100%
Public Private Total
100%97%
34%
Figure (19): Percentage of Ins�tu�ons Having the Following Informa�onTechnologies by Type of Ins�tu�on 2011
Website Wireless Scien�fic Digital Libraries
Social Networking Tools
100%
80%
60%
40%
20%
0%
100%
64%
45%
100%
71%
55%
75%
58%48%
63%
40%
28%
Public Private Total
Public Private
ICTMajors *48% 81%
Non-ICTMajors 52% 19%
ICT Majors and Non-ICT Majorsby Type of Institution 2011
*15outof29ofthepublicinstitutionsarehealthinstitutions,wheretheydon’tofferICTmajorsbutofferICTsubjects.
23
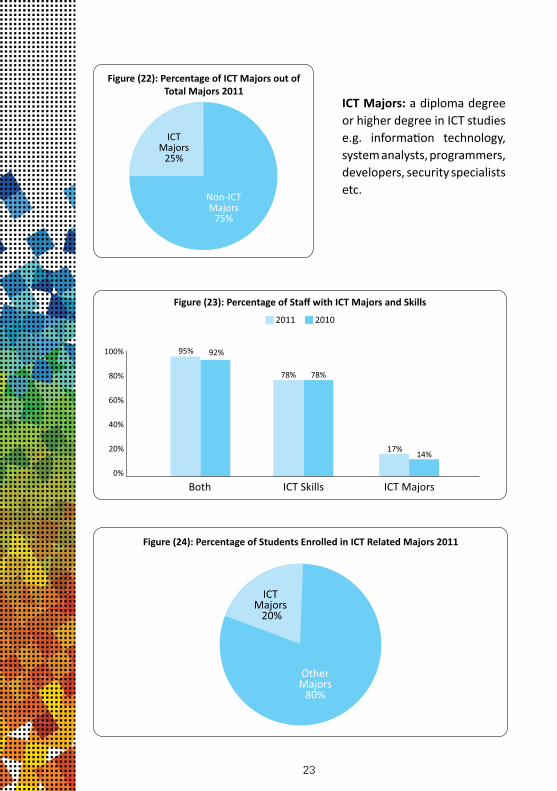
Figure (22): Percentage of ICT Majors out of Total Majors 2011
Non-ICTMajors
75%
ICTMajors
25%
Figure (23): Percentage of Staff with ICT Majors and Skills
Both ICT MajorsICT Skills
100%
80%
60%
40%
20%
0%
92%
78%78%
95%
2011 2010
14%17%
Figure (24): Percentage of Students Enrolled in ICT Related Majors 2011
ICT Majors 20%
Other Majors
80%
ICT Majors:adiplomadegreeorhigherdegreeinICTstudiese.g. information technology,systemanalysts,programmers,developers,securityspecialistsetc.
24
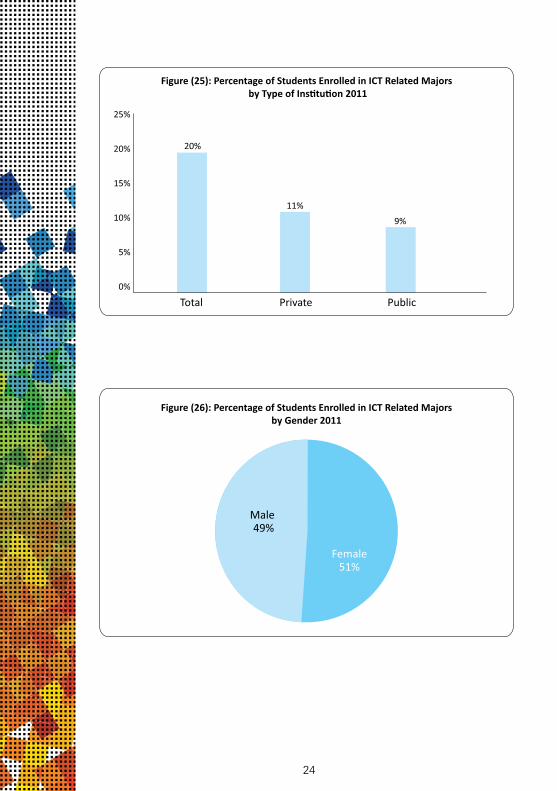
Figure (26): Percentage of Students Enrolled in ICT Related Majorsby Gender 2011
Male 49%
Female51%
Figure (25): Percentage of Students Enrolled in ICT Related Majors by Type of Ins�tu�on 2011
Total PublicPrivate
25%
20%
15%
10%
5%
0%
11%
20%
9%