Embed Size (px)
Citation preview

Community services & nutrition: How do I identify and manage the nutritional risks of my patients?
Heather Keller RD PhD Schlegel Research Chair, Nutrition & Aging University of Waterloo
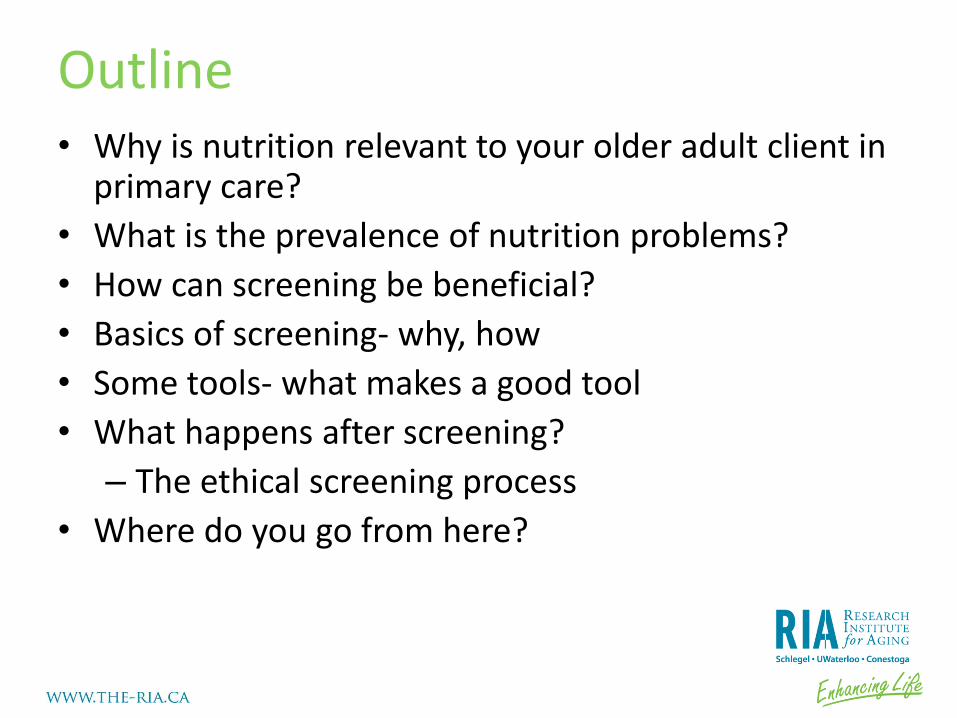
Outline • Why is nutrition relevant to your older adult client in
primary care?
• What is the prevalence of nutrition problems?
• How can screening be beneficial?
• Basics of screening- why, how
• Some tools- what makes a good tool
• What happens after screening?
– The ethical screening process
• Where do you go from here?
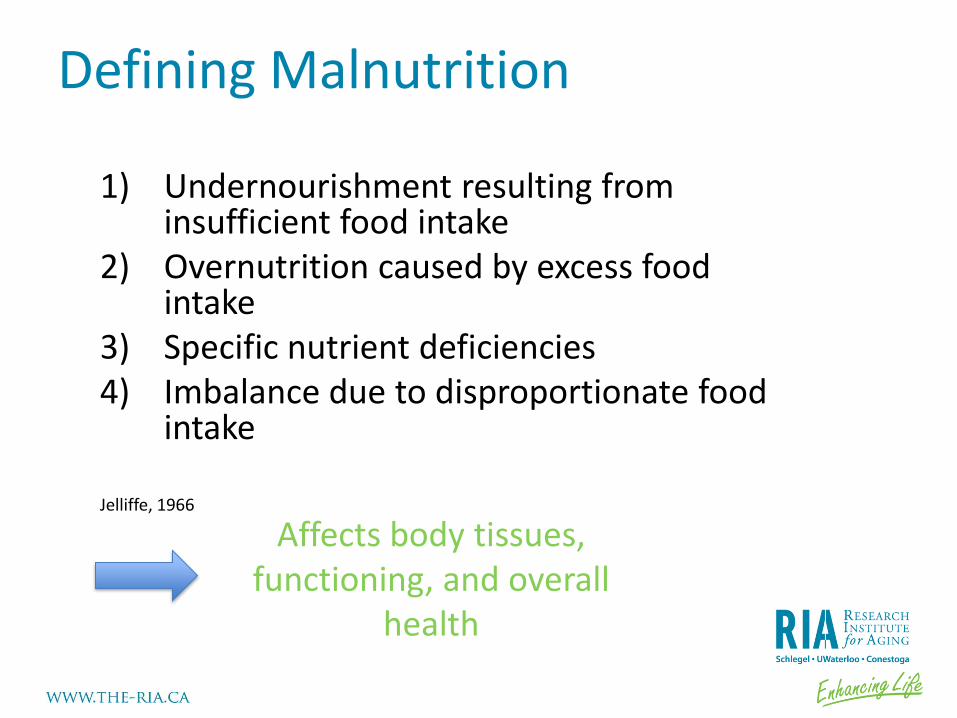
1) Undernourishment resulting from
insufficient food intake 2) Overnutrition caused by excess food
intake 3) Specific nutrient deficiencies 4) Imbalance due to disproportionate food
intake
Jelliffe, 1966
Defining Malnutrition
Affects body tissues, functioning, and overall
health

Malnutrition
Morbidity
Wound healing ↓
Infections
Complications
Convalescence ↓
Mortality
Treatment
Hospital
COSTS QOL ↓

Prevalence of malnutrition in
older adults Kaiser et al., 2010
• 4507, 12 countries
• Continuum of care
• 75% female, mean age 82 years
• Mini Nutrition Assessment
• Malnutrition 23%, varied by site
– 51% rehab
– 39% hospital
– 14% NH
– 6% community

Some why is this important….
• Malnourished have 5 days longer hospital stay,
2x increased risk of readmission Agarwal et al, 2012
• Higher quality diet (MedD) in 60+ decreases
CVD and all cause mortality Atkins et al., 2014
• Higher protein intake associated with
maintenance of function Imai et al., 2014
• Low intake of micronutrients, energy and protein
associated with frailty Insitari et al., 2011
• Nutrition risk associated with mortality and
HRQOL Keller & Ostbye 2003, Keller et al., 2004
• Malnourished home care recipients more likely
to fall Meijers et al., 2012

Why does malnutrition happen in older adults living in the community? • Mobility deficits
• Lack of social support
• Female
• Depression
• Anxiety
• Comorbidity
• Polypharmacy
• Poor appetite
• Loneliness
• No partner/widowed
• IADL limitations
• Dentition
• Cognitive impairment
• Disease
German et al., 2011;Nykanen et al., 2013; Romero-Ortuno et al., 2011; Schilp et al., 2011; Ramage-Morin & Garriguet, 2013

Nutrition Care in Canadian Hospitals
Study
The Canadian Malnutrition Task Force
Advancing Nutrition Care in Canada
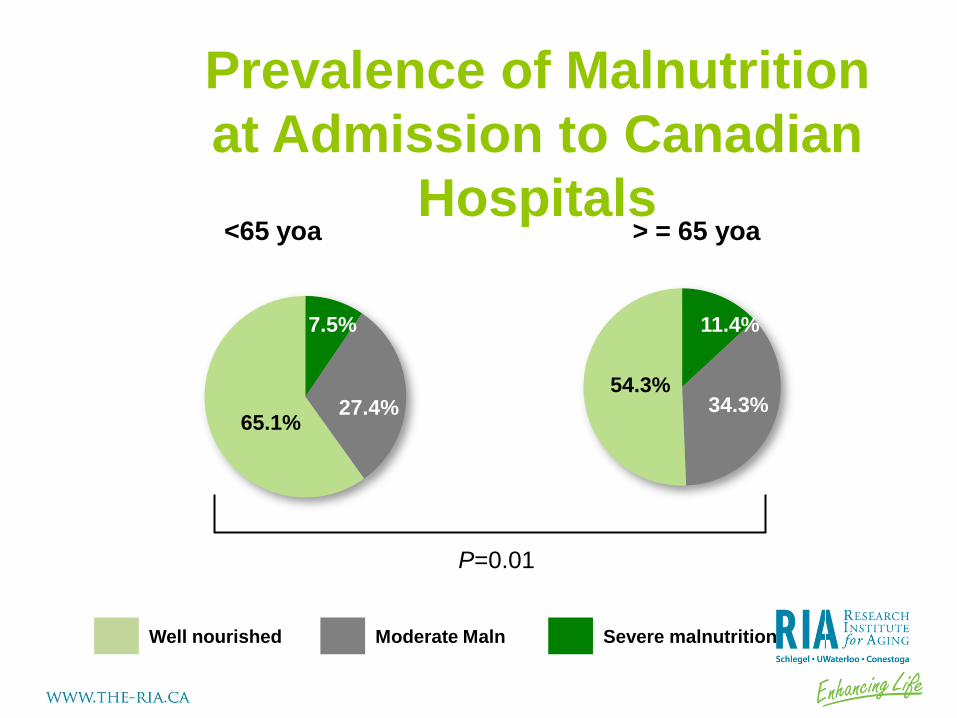
Prevalence of Malnutrition
at Admission to Canadian
Hospitals <65 yoa > = 65 yoa
Well nourished Moderate Maln Severe malnutrition
P=0.01
54.3%
34.3%
11.4% 7.5%
27.4% 65.1%

Post Discharge Nutrition
Parameter < 65 >=65
Nutritional status at
discharge* %
Improved 15.2 14.2
Stayed same 71.2 70.9
Got worse 13.4 14.8
Special diet % Yes 53.5 47.3
Diet different from admission %
Yes 34.0 30.4
Eat with others %* Often/Always 72.2 65.1
Prepares meals %* Patient 47.3 31.0
30 d weight change %* Gained 5+ lbs 19.2 11.5
Lost 5 +lbs 21.9 26.4
30 d appetite %* Fair or poor 20.5 30.1
* Significant different at p<0.05

Prevalence of Nutrition Problems In Canada (based on SCREENII)
Stats Canada 2013
• 34% at risk
• In those at risk – 47% wt change > 5lbs
– 27% poor appetite
– 26% swallowing problems
– 24% skip meals
– 37% low F & V
– 42% eat alone
– 52% cooking difficulty
Vulnerable Keller & McKenzie 2003
• 44% risk
• 22% weight loss
• 45% limits food/difficult
• 48% low F & V
• 20% low Milk products
• 35% chewing
• 23% swallowing
• 28% poor appetite
• 43% cooking difficulty
• 29% shopping

What is nutrition risk?
• A process towards the status of malnutrition, existence of antecedents to malnutrition
(Chen et al., 2001)
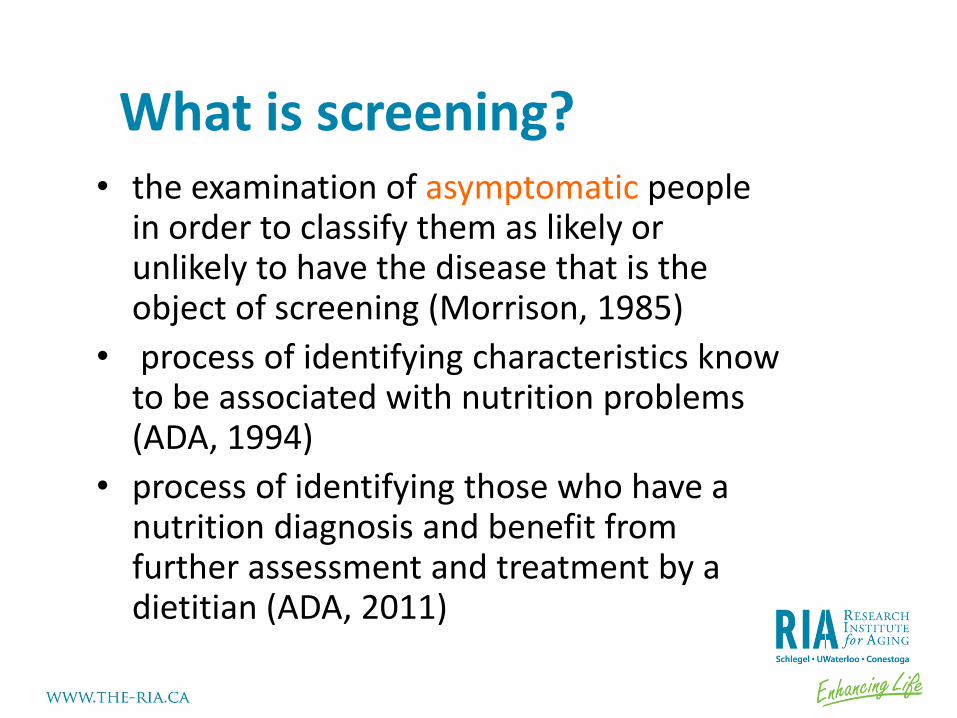
What is screening? • the examination of asymptomatic people
in order to classify them as likely or unlikely to have the disease that is the object of screening (Morrison, 1985)
• process of identifying characteristics know to be associated with nutrition problems (ADA, 1994)
• process of identifying those who have a nutrition diagnosis and benefit from further assessment and treatment by a dietitian (ADA, 2011)
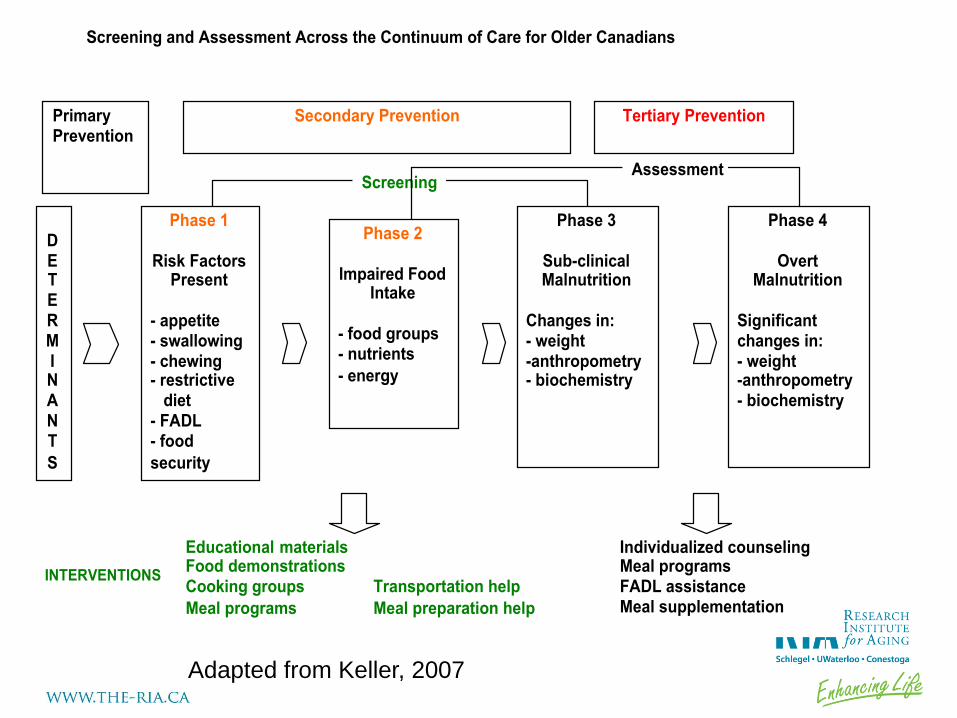
Phase 1
Risk Factors Present
- appetite - swallowing - chewing - restrictive diet - FADL - food
security
Phase 2
Impaired Food Intake
- food groups - nutrients
- energy
Phase 3
Sub-clinical Malnutrition
Changes in: - weight -anthropometry - biochemistry
Phase 4
Overt Malnutrition
Significant changes in: - weight -anthropometry - biochemistry
DE T E RMINANT
S
Educational materials Food demonstrations Cooking groups Transportation help
Meal programs Meal preparation help
Individualized counseling Meal programs FADL assistance Meal supplementation
Screening and Assessment Across the Continuum of Care for Older Canadians
Screening Assessment
INTERVENTIONS
Primary Prevention
Secondary Prevention
Tertiary Prevention
Adapted from Keller, 2007
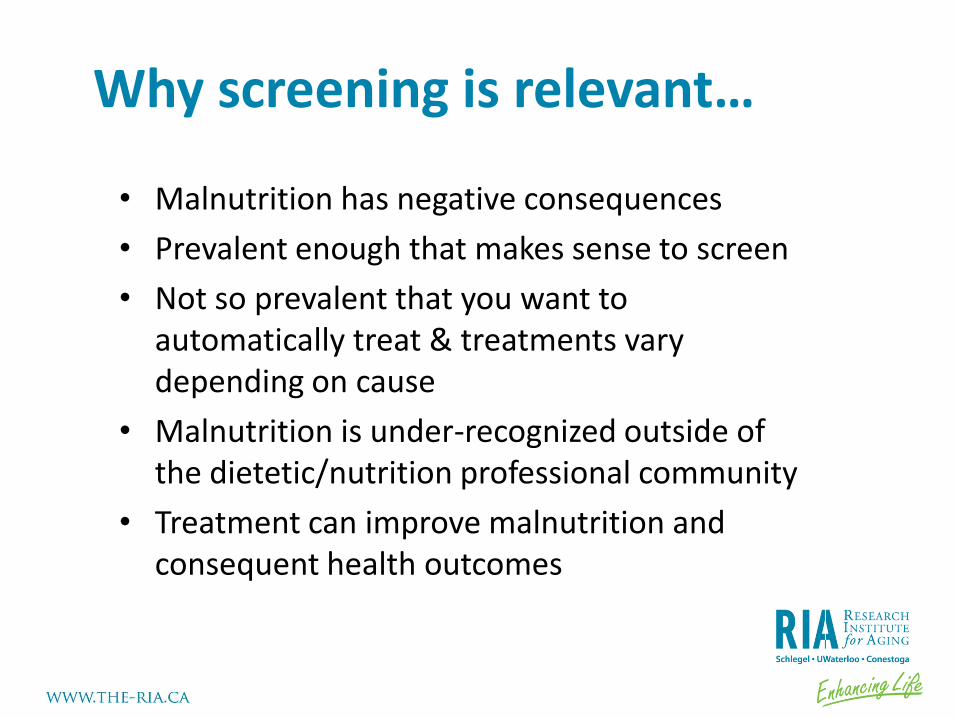
Why screening is relevant…
• Malnutrition has negative consequences
• Prevalent enough that makes sense to screen
• Not so prevalent that you want to automatically treat & treatments vary depending on cause
• Malnutrition is under-recognized outside of the dietetic/nutrition professional community
• Treatment can improve malnutrition and consequent health outcomes
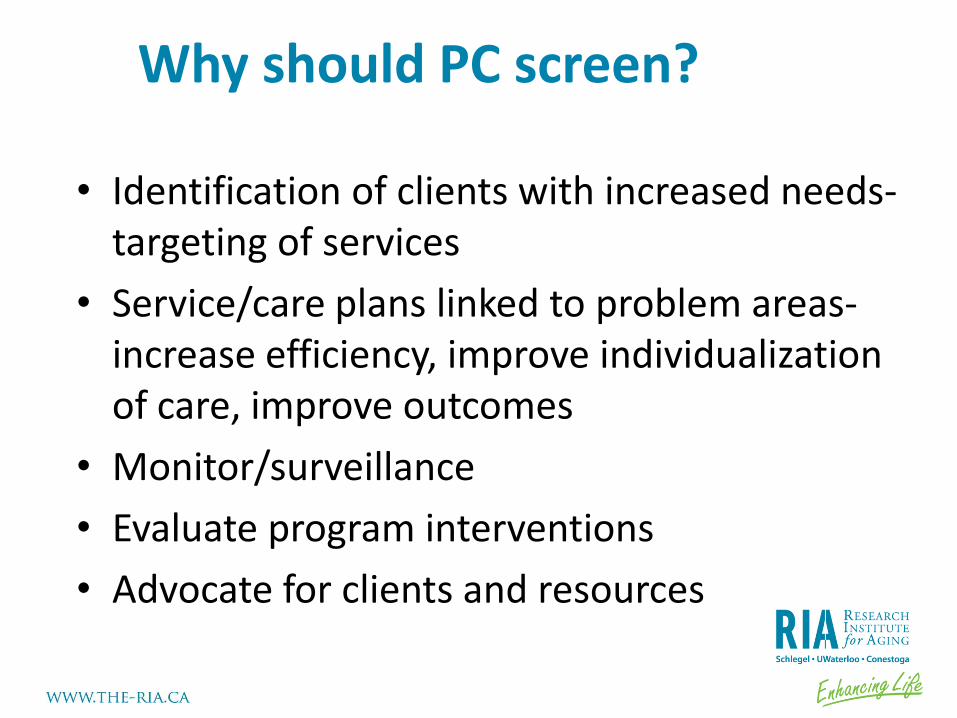
Why should PC screen?
• Identification of clients with increased needs- targeting of services
• Service/care plans linked to problem areas- increase efficiency, improve individualization of care, improve outcomes
• Monitor/surveillance
• Evaluate program interventions
• Advocate for clients and resources

Screening tools…

Main considerations in selecting a screening tool.
• Easy, front-line personnel can use
• Inexpensive to collect on all clients
• Implemented as part of a general work-up
• Data readily available for monitoring
• Appropriate for the setting in which it is to be used
• Specific to the population

Efficacy & Effectiveness Framework
Development
Reliability
Testing
Validity Testing
- Sensitive
- Specific
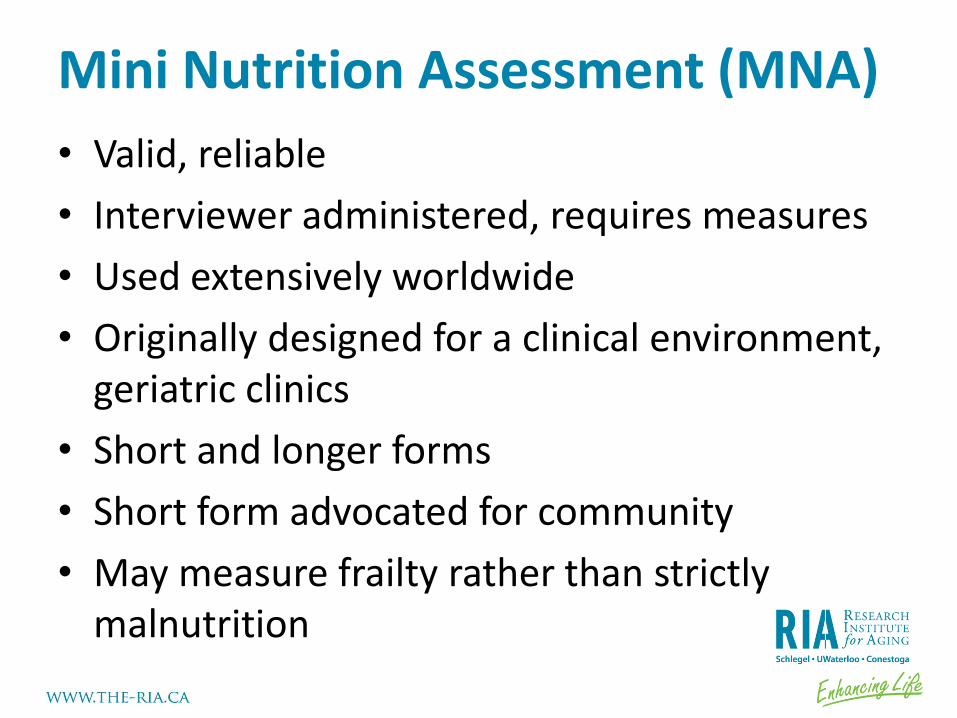
Mini Nutrition Assessment (MNA)
• Valid, reliable
• Interviewer administered, requires measures
• Used extensively worldwide
• Originally designed for a clinical environment, geriatric clinics
• Short and longer forms
• Short form advocated for community
• May measure frailty rather than strictly malnutrition

Items on MNA Short version (6 items)
• BMI or calf circumference (measured)
• Decreased intake in past 3 months (regardless of cause)
• Weight loss in past 3 months
• Mobility
• Psychological stress or acute disease in past 3 months
Long version
• Lives independently
• 3+ prescriptions
• Pressure sores
• # full meals per day
• Consumption of protein
• 2+ F & V
• Fluid per day
• Mode of feeding
• Perception of nutrition status
• Perception of health status
• Mid arm circumference
• Calf circumference

What is
SCREEN? Seniors in the
Community:
Risk
Evaluation for
Eating and
Nutrition
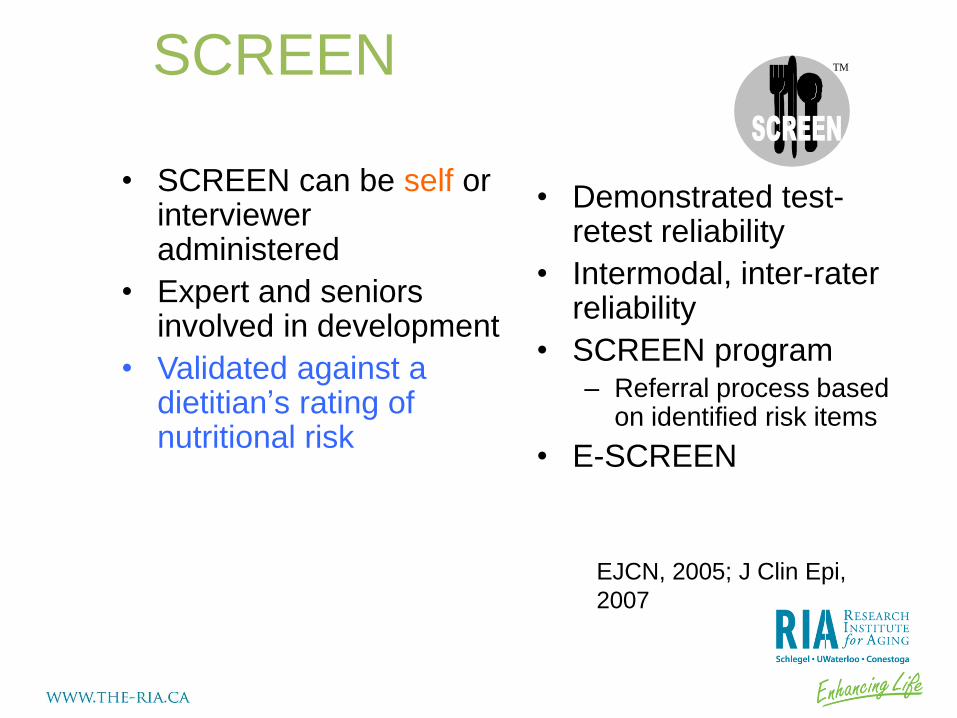
SCREEN
• SCREEN can be self or interviewer administered
• Expert and seniors involved in development
• Validated against a dietitian’s rating of nutritional risk
• Demonstrated test-retest reliability
• Intermodal, inter-rater reliability
• SCREEN program – Referral process based
on identified risk items
• E-SCREEN
TM
EJCN, 2005; J Clin Epi,
2007

Items on SCREENII
• Weight change
– Loss/gain
– Intentionality
– Perception
• Skipping meals
• Diet restrictions/difficulty
• Appetite
• Eating alone
• Use of meal replacements
• Intake
– F& V
– Milk products
– Meat & alternatives
– Fluid
• Swallowing
• Chewing
• Grocery difficulty
• Cooking difficulty
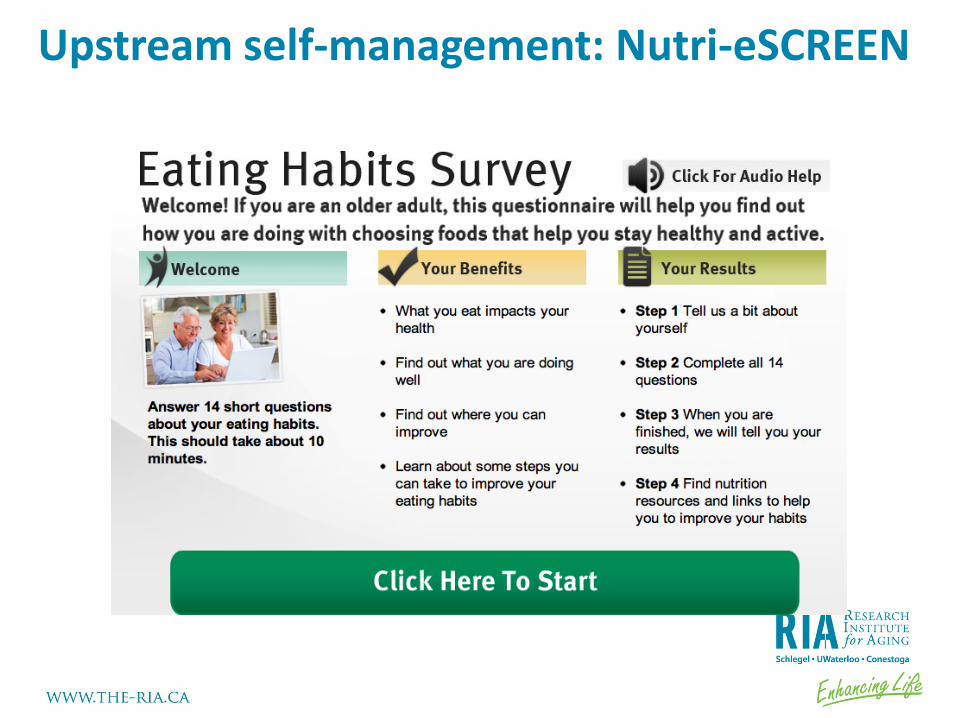
Upstream self-management: Nutri-eSCREEN

Phase 1
Risk Factors Present
- appetite - swallowing - chewing - restrictive diet - FADL - food
security
Phase 2
Impaired Food Intake
- food groups - nutrients
- energy
Phase 3
Sub-clinical Malnutrition
Changes in: - weight -anthropometry - biochemistry
Phase 4
Overt Malnutrition
Significant changes in: - weight -anthropometry - biochemistry
DE T E RMINANT
S
SCREENII MNA MNA-SF MUST
MST
Screening and Assessment Across the Continuum of Care for Older Canadians
Screening Assessment
Screening Tools
Primary Prevention
Secondary Prevention
Tertiary Prevention
Adapted from Keller, 2007

Screening process…
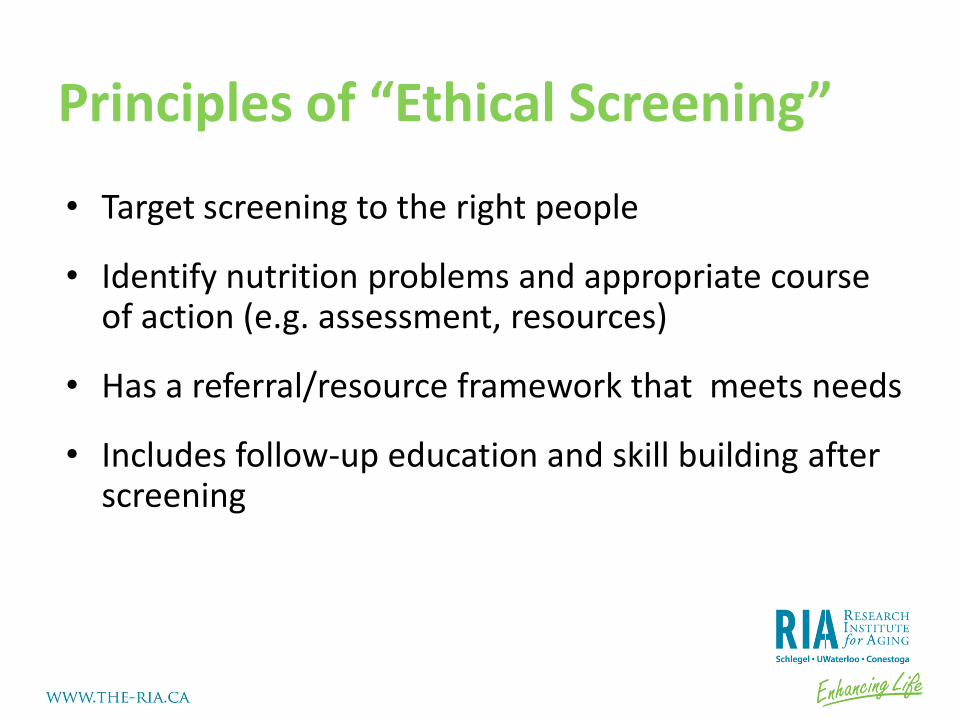
Principles of “Ethical Screening”
• Target screening to the right people
• Identify nutrition problems and appropriate course of action (e.g. assessment, resources)
• Has a referral/resource framework that meets needs
• Includes follow-up education and skill building after screening
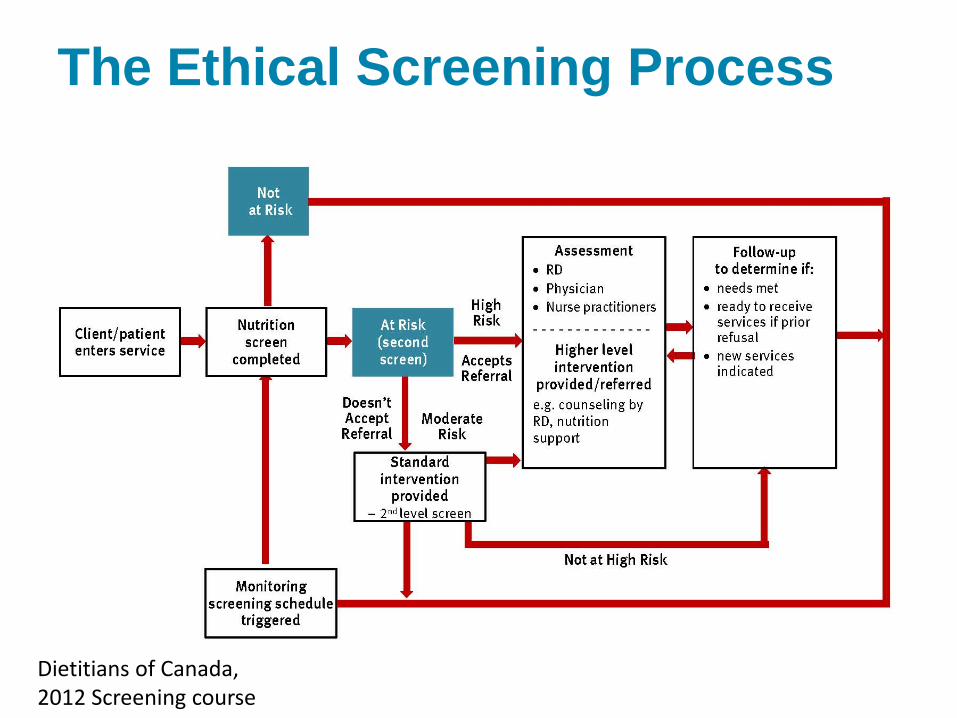
The Ethical Screening Process
29 Dietitians of Canada, 2012 Screening course
What to do with persons at risk…
• Meta-analysis shows oral nutrition supplements modestly improves weight and mortality in undernourished, but no effect on complications, LOS or functional outcomes (Milne et al., 2009)
• Oral nutritional supplements post discharge from hospital is not enough… compliance (McMurdo et al., 2009)

Food Related Services
• Meal programs
- MOW
- Congregate dining
• Seniors centres
• Transportation
• Grocery delivery
service
• Eat Right Ontario
Assessment
• Geriatric day hospital
• Home care RD
• FHT RD
• Speech Pathology
31
Build Capacity
Meeting Nutritional Needs of Older Adults

32

Educational Resources
Eat Right Ontario
• Recipes
• Tips for grocery shopping, cooking, eating alone
Guide to Healthy Eating for Older Adults

Dietitians of Canada, 2012 Screening Program
Resources for moving ahead
• Dietitians of Canada – Nutrition Screening ecourse
• Flintbox- SCREEN – www.flintbox.com/public/project/2750/
• Nutri-eSCREEN – www.eatrightontario.ca/~escreen
• Guide to Healthy Eating for Older Adults – www.drheatherkeller.com
• Canadian Malnutrition Task Force
- www.nutritioncareincanada.ca
Some final thoughts... • Measuring nutrition risk and following
through with services/treatment has the potential to improve outcomes
• Pick a good tool, match to your needs and purpose
• Screening only raises awareness, need to provide services/interventions to improve outcomes
• Develop capacity... If the screening process doesn’t work, screening will not be effective

Discussion

![Senior Friendly 7 - RGP · 2018-11-20 · The SF7 Toolkit - Nutrition V1 2018 4 Nutrition risk increases at older ages [8] About 34% of community-dwelling Canadian older adults aged](https://img.dokumen.tips/doc/110x75/5f0e87037e708231d43fac85/senior-friendly-7-rgp-2018-11-20-the-sf7-toolkit-nutrition-v1-2018-4-nutrition.jpg)