Embed Size (px)
Citation preview
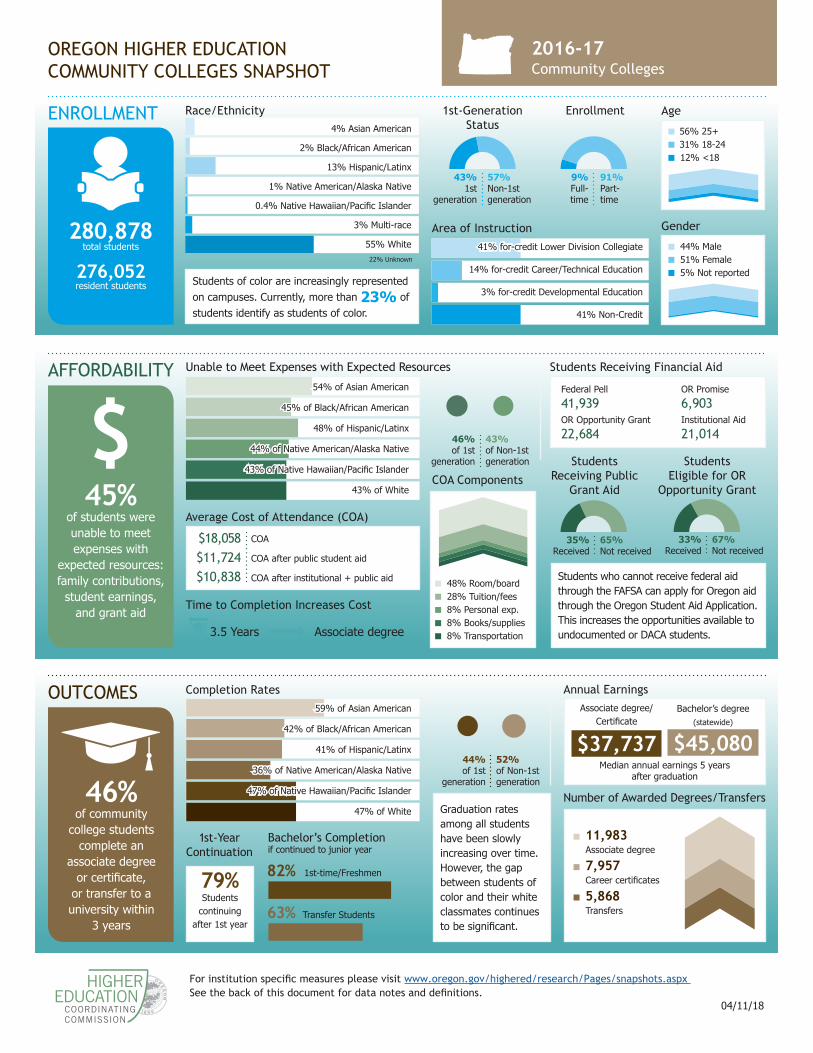
OREGON HIGHER EDUCATION COMMUNITY COLLEGES SNAPSHOT
HIGHEREDUCATION
COORDINATING COMMISSION
2016-17Community Colleges
For institution specific measures please visit www.oregon.gov/highered/research/Pages/snapshots.aspx See the back of this document for data notes and definitions.
04/11/18
Graduation rates among all students have been slowly increasing over time. However, the gap between students of color and their white classmates continues to be significant.
Bachelor’s Completion if continued to junior year
OUTCOMES Annual EarningsAssociate degree/
Certificate
$37,737
Bachelor’s degree (statewide)
$45,080Median annual earnings 5 years
after graduation
Number of Awarded Degrees/Transfers
100+100+100+100+100+100 59+42+41+36+47+47Completion Rates59% of Asian American
42% of Black/African American
41% of Hispanic/Latinx
36% of Native American/Alaska Native
47% of Native Hawaiian/Pacific Islander
47% of White
79%Students
continuing after 1st year
1st-Year Continuation
46% of community
college students complete an
associate degree or certificate,
or transfer to a university within
3 years
44 5244%of 1st
generation
52%of Non-1st generation 46+31+23 11,983
Associate degree
7,957 Career certificates
5,868 Transfers
82+6382% 1st-time/Freshmen
63% Transfer Students
100+100+100+100+100+10054+45+48+44+43+43Unable to Meet Expenses with Expected Resources
54% of Asian American
45% of Black/African American
48% of Hispanic/Latinx
44% of Native American/Alaska Native
43% of Native Hawaiian/Pacific Islander
43% of White
Students Receiving Financial Aid
Federal Pell41,939OR Opportunity Grant22,684
OR Promise6,903Institutional Aid 21,014
18+33+A
35%Received
65%Not received
Students Receiving Public
Grant Aid
17+34+A
33%Received
67%Not received
Students Eligible for OR
Opportunity Grant
AFFORDABILITY
45%of students were unable to meet expenses with
expected resources: family contributions,
student earnings, and grant aid
$Students who cannot receive federal aid through the FAFSA can apply for Oregon aid through the Oregon Student Aid Application. This increases the opportunities available to undocumented or DACA students.
Average Cost of Attendance (COA)
COA after public student aid
COA
COA after institutional + public aid
$18,058$11,724$10,838
Time to Completion Increases Cost
COA Components
48% Room/board 28% Tuition/fees 8% Personal exp. 8% Books/supplies 8% Transportation
48+28+8+8+846%of 1st
generation
43%of Non-1st generation
46 43
3.5 Years Associate degree
Enrollment
5+45+A
9%Full-time
91%Part-time
Age
43%1st
generation
57%Non-1st generation
1st-Generation Status
22+28+A100+100+100+100+100+100+1004+2+13+1+1+3+55Race/Ethnicity
Students of color are increasingly represented on campuses. Currently, more than 23% of students identify as students of color.
ENROLLMENT4% Asian American
2% Black/African American
13% Hispanic/Latinx
1% Native American/Alaska Native
0.4% Native Hawaiian/Pacific Islander
3% Multi-race
55% White
100+100+100+10041+14+3+41Area of Instruction41% for-credit Lower Division Collegiate
14% for-credit Career/Technical Education
3% for-credit Developmental Education
41% Non-Credit
56% 25+ 31% 18-24 12% <18
44% Male 51% Female 5% Not reported
Gender44+51+5280,878 total students
276,052 resident students
56+31+1222% Unknown
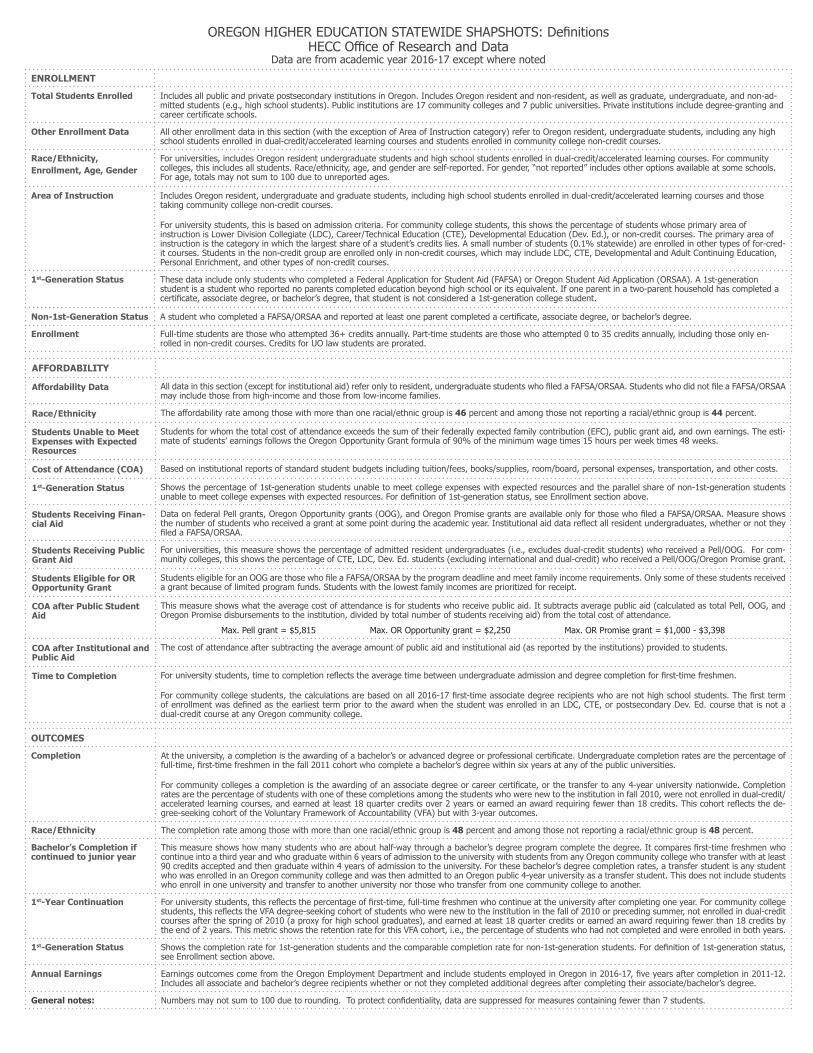
OREGON HIGHER EDUCATION STATEWIDE SHAPSHOTS: DefinitionsHECC Office of Research and Data
Data are from academic year 2016-17 except where notedENROLLMENT
Total Students Enrolled Includes all public and private postsecondary institutions in Oregon. Includes Oregon resident and non-resident, as well as graduate, undergraduate, and non-ad-mitted students (e.g., high school students). Public institutions are 17 community colleges and 7 public universities. Private institutions include degree-granting and career certificate schools.
Other Enrollment Data All other enrollment data in this section (with the exception of Area of Instruction category) refer to Oregon resident, undergraduate students, including any high school students enrolled in dual-credit/accelerated learning courses and students enrolled in community college non-credit courses.
Race/Ethnicity, Enrollment, Age, Gender
For universities, includes Oregon resident undergraduate students and high school students enrolled in dual-credit/accelerated learning courses. For community colleges, this includes all students. Race/ethnicity, age, and gender are self-reported. For gender, “not reported” includes other options available at some schools. For age, totals may not sum to 100 due to unreported ages.
Area of Instruction Includes Oregon resident, undergraduate and graduate students, including high school students enrolled in dual-credit/accelerated learning courses and those taking community college non-credit courses.
For university students, this is based on admission criteria. For community college students, this shows the percentage of students whose primary area of instruction is Lower Division Collegiate (LDC), Career/Technical Education (CTE), Developmental Education (Dev. Ed.), or non-credit courses. The primary area of instruction is the category in which the largest share of a student’s credits lies. A small number of students (0.1% statewide) are enrolled in other types of for-cred-it courses. Students in the non-credit group are enrolled only in non-credit courses, which may include LDC, CTE, Developmental and Adult Continuing Education, Personal Enrichment, and other types of non-credit courses.
1st-Generation Status These data include only students who completed a Federal Application for Student Aid (FAFSA) or Oregon Student Aid Application (ORSAA). A 1st-generation student is a student who reported no parents completed education beyond high school or its equivalent. If one parent in a two-parent household has completed a certificate, associate degree, or bachelor’s degree, that student is not considered a 1st-generation college student.
Non-1st-Generation Status A student who completed a FAFSA/ORSAA and reported at least one parent completed a certificate, associate degree, or bachelor’s degree.
Enrollment Full-time students are those who attempted 36+ credits annually. Part-time students are those who attempted 0 to 35 credits annually, including those only en-rolled in non-credit courses. Credits for UO law students are prorated.
AFFORDABILITY
Affordability Data All data in this section (except for institutional aid) refer only to resident, undergraduate students who filed a FAFSA/ORSAA. Students who did not file a FAFSA/ORSAA may include those from high-income and those from low-income families.
Race/Ethnicity The affordability rate among those with more than one racial/ethnic group is 46 percent and among those not reporting a racial/ethnic group is 44 percent.
Students Unable to Meet Expenses with Expected Resources
Students for whom the total cost of attendance exceeds the sum of their federally expected family contribution (EFC), public grant aid, and own earnings. The esti-mate of students’ earnings follows the Oregon Opportunity Grant formula of 90% of the minimum wage times 15 hours per week times 48 weeks.
Cost of Attendance (COA) Based on institutional reports of standard student budgets including tuition/fees, books/supplies, room/board, personal expenses, transportation, and other costs.
1st-Generation Status Shows the percentage of 1st-generation students unable to meet college expenses with expected resources and the parallel share of non-1st-generation students unable to meet college expenses with expected resources. For definition of 1st-generation status, see Enrollment section above.
Students Receiving Finan-cial Aid
Data on federal Pell grants, Oregon Opportunity grants (OOG), and Oregon Promise grants are available only for those who filed a FAFSA/ORSAA. Measure shows the number of students who received a grant at some point during the academic year. Institutional aid data reflect all resident undergraduates, whether or not they filed a FAFSA/ORSAA.
Students Receiving Public Grant Aid
For universities, this measure shows the percentage of admitted resident undergraduates (i.e., excludes dual-credit students) who received a Pell/OOG. For com-munity colleges, this shows the percentage of CTE, LDC, Dev. Ed. students (excluding international and dual-credit) who received a Pell/OOG/Oregon Promise grant.
Students Eligible for OR Opportunity Grant
Students eligible for an OOG are those who file a FAFSA/ORSAA by the program deadline and meet family income requirements. Only some of these students received a grant because of limited program funds. Students with the lowest family incomes are prioritized for receipt.
COA after Public Student Aid
This measure shows what the average cost of attendance is for students who receive public aid. It subtracts average public aid (calculated as total Pell, OOG, and Oregon Promise disbursements to the institution, divided by total number of students receiving aid) from the total cost of attendance.
Max. Pell grant = $5,815 Max. OR Opportunity grant = $2,250 Max. OR Promise grant = $1,000 - $3,398
COA after Institutional and Public Aid
The cost of attendance after subtracting the average amount of public aid and institutional aid (as reported by the institutions) provided to students.
Time to Completion For university students, time to completion reflects the average time between undergraduate admission and degree completion for first-time freshmen.
For community college students, the calculations are based on all 2016-17 first-time associate degree recipients who are not high school students. The first term of enrollment was defined as the earliest term prior to the award when the student was enrolled in an LDC, CTE, or postsecondary Dev. Ed. course that is not a dual-credit course at any Oregon community college.
OUTCOMES
Completion At the university, a completion is the awarding of a bachelor’s or advanced degree or professional certificate. Undergraduate completion rates are the percentage of full-time, first-time freshmen in the fall 2011 cohort who complete a bachelor’s degree within six years at any of the public universities.
For community colleges a completion is the awarding of an associate degree or career certificate, or the transfer to any 4-year university nationwide. Completion rates are the percentage of students with one of these completions among the students who were new to the institution in fall 2010, were not enrolled in dual-credit/accelerated learning courses, and earned at least 18 quarter credits over 2 years or earned an award requiring fewer than 18 credits. This cohort reflects the de-gree-seeking cohort of the Voluntary Framework of Accountability (VFA) but with 3-year outcomes.
Race/Ethnicity The completion rate among those with more than one racial/ethnic group is 48 percent and among those not reporting a racial/ethnic group is 48 percent.
Bachelor’s Completion if continued to junior year
This measure shows how many students who are about half-way through a bachelor’s degree program complete the degree. It compares first-time freshmen who continue into a third year and who graduate within 6 years of admission to the university with students from any Oregon community college who transfer with at least 90 credits accepted and then graduate within 4 years of admission to the university. For these bachelor’s degree completion rates, a transfer student is any student who was enrolled in an Oregon community college and was then admitted to an Oregon public 4-year university as a transfer student. This does not include students who enroll in one university and transfer to another university nor those who transfer from one community college to another.
1st-Year Continuation For university students, this reflects the percentage of first-time, full-time freshmen who continue at the university after completing one year. For community college students, this reflects the VFA degree-seeking cohort of students who were new to the institution in the fall of 2010 or preceding summer, not enrolled in dual-credit courses after the spring of 2010 (a proxy for high school graduates), and earned at least 18 quarter credits or earned an award requiring fewer than 18 credits by the end of 2 years. This metric shows the retention rate for this VFA cohort, i.e., the percentage of students who had not completed and were enrolled in both years.
1st-Generation Status Shows the completion rate for 1st-generation students and the comparable completion rate for non-1st-generation students. For definition of 1st-generation status, see Enrollment section above.
Annual Earnings Earnings outcomes come from the Oregon Employment Department and include students employed in Oregon in 2016-17, five years after completion in 2011-12. Includes all associate and bachelor’s degree recipients whether or not they completed additional degrees after completing their associate/bachelor’s degree.
General notes: Numbers may not sum to 100 due to rounding. To protect confidentiality, data are suppressed for measures containing fewer than 7 students.


![Architecture level Optimizations for Kummer based HECC on ... · HECC was introduced by Koblitz in [14] as a larger set of curves compared to ECC with a generalization of the class](https://img.dokumen.tips/doc/110x75/5fe18f22efd54950524e2b16/architecture-level-optimizations-for-kummer-based-hecc-on-hecc-was-introduced.jpg)