Embed Size (px)
Citation preview

Degree project
Communication Network
Analysis in Smart Grid Master's Thesis, 30 credits
Author: Satyendra Nath Lohani
Date: 2012-05-30
Subject:Electrical Engineering
Level: Second
Course code: 5ED06E


The thesis is submitted for partial fulfillment of the requirements for the degree of
Master of Science in Electrical Engineering Specialized in Signal Processing and
Wave Propagation under the supervision of Pieternella Cijvat and Sven Nordebo.
i
Abstract With the world suffering from energy crisis, Smart Grid is the expanding research topic that
deals vigorously with the current problems. It promotes decentralized renewable energy
generation system, participate many local energy producers to energy market, adds vehicle to
grid (V2G), minimize the energy loss in the electrical system, and participate many active
consumers to the real market. It is an emerging project that needs an expert from many fields,
thus it opens door of opportunities for many people around the globe.
The present thesis deals with the communication scenario in smart grid. Communication is the
backbone of Smart Grid and the thesis tries to highlight the available communication
technologies for smart grid application. The thesis discuss most profitable communication
technologies used for this purpose which are power line communication and wireless
communication, in which power line communication aspects and characteristics are covered
more than wireless communication for its use are seen more in upcoming days. In all the thesis
will outline the opportunities and challenges of power line communication and wireless
communication for smart grid application.

ii
Acknowledgement
It gives me immense pleasure to express my sincere gratitude towards my two supervisors for
being a constant source of help, Pieternella Cijvat for showing me the direction to choose my
thesis topic and providing continuous help during the thesis work and Sven Nordebo, for his
useful suggestion and guidance to complete my thesis work in time. I am very thankful to them
that they have given me the opportunity to work freely in the field of my interest.
I would also like to thank my program coordinator Sven-Erik Sandström, for his coordination
and also want to thank the numerous friends of mine for their direct and indirect support. I
would also like to remember the silence room of the library where I spend most of the time
during my thesis work.
Last but not the least; I want to remember my family (Daddy, Mummy & Babu) and relatives,
they must be very happy for this accomplishment.
Tack så mycket !!

iii
Table of Contents Abstract ............................................................................................................................................ i
Acknowledgement ...........................................................................................................................ii
List of Figures ................................................................................................................................... v
List of Tables .................................................................................................................................. vii
List of Acronyms ............................................................................................................................ viii
1. Smart Grid ................................................................................................................................... 1
1.1Introduction ......................................................................................................................................... 1
1.2Communication Network ..................................................................................................................... 2
1.3 Objectives of thesis ......................................................................................................................... 4
2 Modulation and Multiplexing Technique .................................................................................... 5
2.1 Introduction ........................................................................................................................................ 5
2.2 Digital Modulation Techniques ........................................................................................................... 5
2.2.1 PSK (Phase Shift Keying) Modulation .......................................................................................... 7
2.2.1.1 BPSK (Binary PSK) ..................................................................................................................... 7
2.2.1.2 QPSK (Quadrature PSK) ............................................................................................................. 8
2.2.1.3 8-PSK ........................................................................................................................................ 8
2.2.2 QAM Modulation ......................................................................................................................... 9
2.3 OFDM ................................................................................................................................................ 10
2.3.1 Introduction ............................................................................................................................... 10
2.3.2 Basic Principle of OFDM ............................................................................................................. 11
2.3.3 Advantages of OFDM compared to single carrier modulation .................................................. 12
2.3.4 Disadvantages ............................................................................................................................ 12
3. Wired Communication .............................................................................................................. 13
3.1Introduction ....................................................................................................................................... 13
3.2 Power Line Communication .............................................................................................................. 14
3.2.1 Introduction ............................................................................................................................... 14
3.2.2 PLC Network Architecture .......................................................................................................... 15
3.2.3 Channel modeling ...................................................................................................................... 16
3.2.4 Channel Impedance ................................................................................................................... 17

iv
3.2.5 Signal Attenuation ...................................................................................................................... 17
3.2.6 Multipath Modeling ................................................................................................................... 17
3.2.7 Reflection ................................................................................................................................... 19
3.2.8 Noise Model ............................................................................................................................... 19
3.2.9 Electromagnetic Susceptibility ................................................................................................... 21
3.2.10 Coupling ................................................................................................................................... 22
3.2.11 Overview of Standard .............................................................................................................. 22
4. Wireless Communication .......................................................................................................... 25
4.1Introduction ....................................................................................................................................... 25
4.2 LAN Technologies .............................................................................................................................. 25
4.2.1 Bluetooth .................................................................................................................................. 26
4.2.2 Zigbee ......................................................................................................................................... 26
4.2.3 WI-FI ........................................................................................................................................... 27
4.3 WAN Technologies ............................................................................................................................ 28
4.3.1 Cellular Network ........................................................................................................................ 28
4.3.2 WIMAX (Worldwide Interoperability for Microwave Access) .................................................... 29
4.3.3 LTE (Long Term Evolution) ......................................................................................................... 31
4.3.4 Comparison of PLC with Wireless Communication .................................................................... 32
5. Simulations and Results ............................................................................................................ 34
5.1 Introduction ...................................................................................................................................... 34
5.1.1 Transfer Function .......................................................................................................................... 34
5.1.2 Channel Capacity ............................................................................................................................ 35
5.2.1 Reference Channel 1 ...................................................................................................................... 35
5.2.2 Reference Channel 2 .................................................................................................................. 37
5.2.3 Reference Channel 3 .................................................................................................................. 40
5.2.4 Reference Channel 4 .................................................................................................................. 43
5.3 Conclusion ......................................................................................................................................... 46
6. Conclusion ................................................................................................................................. 47
Reference ...................................................................................................................................... 48
v
List of Figures
Figure 1.1 Smart Grid Communication Network………………………………………………………………………………………3
Figure 2.1 In-Phase and Quadrature Phase of the signal………………………………………………………………………….6
Figure 2.2.1.1 BPSK Modulation………………………………………………………………………………………………………..…….7
Figure 2.2.1.2 QPSK Modulation……………………………………………………………………………………………..……..……….8 Figure 2.2.1.3 8-PSK Modulation…………………………………………………………………………………………………………….8 Figure 2.2.2.1 16 QAM…………………………………………………………………………………………………………………………….9
Figure 2.2.2.2 32QAM……………………………………………………………………………………………………………………………10
Figure 2.3.2 Block diagram of OFDM…………………………………………………………………………………………………….11
Figure 3.2.2 PLC Network Architecture (after[19],pp 434)…………………………………………………………………….15
Figure 3.2.6 Echo Model………………………………………………………………………………………………………………………..18
Figure 3.2.8 Noise Model ………………………………………………………………………………………………………………………20
Figure 3.2.11.1 CENELNEC 50065 (after [17],pp 559)……………………………………………………………………………..24 Figure 4.3.1 Cellular Network Architecture……………………………………………………………………………………………29
Figure4.3.2 Basic Wimax Network Architecture…………………………………………………………………………………….30
Figure 4.3.3 Basic LTE Network Architecture………………………………………………………………………………………….31
Fig 5.2.1.1 Frequency Response Reference Channel 1 (100 m, without Branches)…………………………………36
Figure 5.2.1.2 Impulse Response Reference Channel 1 (100 m, without Branches)……………………………….36
Figure 5.2.1.3 Channel Capacity Comparison Reference Channel 1 (length Scaled 1-5 times (variable
X))………………………………………………………………………………………………………………………………………………………….37
Figure 5.2.2.1 Frequency Response Reference Channel 2 (110m, 6 Branches)……………………………………….39
Figure 5.2.2.2 Impulse Response Reference Channel 2 (110m, 6 Branches)…………………………………………..39
Figure 5.2.2.3 Channel Capacity Comparison Reference Channel 2 (length Scaled 1-5 times(variable
X))………………………………………………………………………………………………………………………………………………………….40
Fig 5.2.3.1 Frequency Response Reference Channel 3 (210 m, 8 Branches)…………………………………………..41

vi
Fig 5.2.3.2 Impulse Response Reference Channel 3 (210 m, 8 Branches)………………………………………………42
Figure 5.2.3.2 Channel Capacity Comparison Reference Channel 3 (length Scaled 1-5 times (variable
X))………………………………………………………………………………………………………………………………………………………….43
Fig 5.2.4.1 Frequency Response Reference Channel 4 (numerous branches)………………………………………..44
Fig 5.2.4.2 Impulse Response Reference Channel 4 (numerous branches)…………………………………………….45
Figure 5.2.4.3 Channel Capacity Comparison Reference Channel 4 (length Scaled 1-5 times (variable
X))………………………………………………………………………………………………………………………………………………………….46

vii
List of Tables
Table 1.1 Comparison between traditional and smart grid [2]…………………………………………………………………1
Table 5.2.1 Reference Channel 1 Parameter………………………………………………………………………………………….35
Table 5.2.2 Reference Channel 2 Parameter………………………………………………………………………………………….38
Table 5.2.3 Reference Channel 3 Parameter………………………………………………………………………………………….41
Table 5.2.4 Reference Channel 4 Parameter………………………………………………………………………………………….43

viii
List of Acronyms
V2G Vehicle to grid
HAN Home Area Network
NAN Neighborhood Area Network
WAN Wide Area Network
FDMA Frequency Division Multiple Access
TDMA Time Division Multiple Access
CDMA Code Division Multiple Access
OFDM Orthogonal Frequency Division Multiplexing
OSI Open System Interconnection
PSK Phase Shift Keying
BPSK Binary Phase Shift Keying
QAM Quadrature Amplitude Modulation
FFT Fast Fourier Transform
IFFT Inverse Fast Fourier Transform
PAPR Peak to Average Power Ratio
LV Low Voltage
MV Medium Voltage
HV High Voltage
EHV Extra High Voltage
PLC Power Line Communication
NTU Network Termination Unit
ix
MODEM Modulator-Demodulator
AWGN Additive White Gaussian Noise
IEEE Institute of Electrical and Electronics Engineer
ITU International Telecommunication Union
ETSI European Telecommunications Standard Institute
BTS Base Transceiver Station
BSC Base Station Controller
MSC Mobile Switching Center
WIMAX Worldwide Interoperability for Microwave Access
MS Mobile Station
ASN Access Service Network
CSN Connectivity Service Network
ASN-GW Access Service Network-Gateway
LTE Long Term Evolution
AMI Advanced Metering Infrastructure
UMTS Universal Mobile Telecommunication System
eNB eNodeB
UE User Equipment
E-UTRAN Universal Terrestrial Radio Access Network
EPC Evolve Packet Core
MME Mobility Management Entity
SGW Serving Gateway
PDN-GW Packet Data Network Gateway
ISM Industrial Scientific and Medical
1 | P a g e
Chapter 1
1. Smart Grid
1.1 Introduction Smart grid is the emerging technology which defines the modernization of electrical grid by
implementing communication between its links. The operation procedure of electrical grid has
not changed in great extent since its development over 100 years ago, even though there is
huge developments and modification in the field of science and technology. Globally, the use
and need of energy is increasing day by day and the electrical grid is one of the major elements
which supplies energy to the consumers but the present electrical grid has lots of unsolved
issues which Smart grid tries to resolve.
The non-renewable sources which generate energy are demoted nowadays because they
directly contribute to emission of greenhouse gases. As a result, more distributed renewable
energy networks are used for the generation of electricity. There is also leakage of energy in
our traditional grid networks and sometimes this leakage is more than half of the energy
produced. The end users which are the final consumers of electricity are somewhat not
participating in the electricity market because of lack of modernization in traditional grid. The
lack of good electric storage device that can store energy for more duration of time results to
the waste of generated energy, in the same time some needy consumers are deprived of this
wasted energy because of lack of information shared. These stories show that the traditional
grid cannot fulfill the demand and supply needs. There are many necessities in electrical
distribution in 21’s century which cannot be addressed by traditional grid, that’s why the
modernization in traditional grid is necessary. This modernized electrical grid is intelligent and
includes heterogeneous networks of generation systems, transmission systems, distribution
systems, control and automatic systems, V2G systems and different utility devices like smart
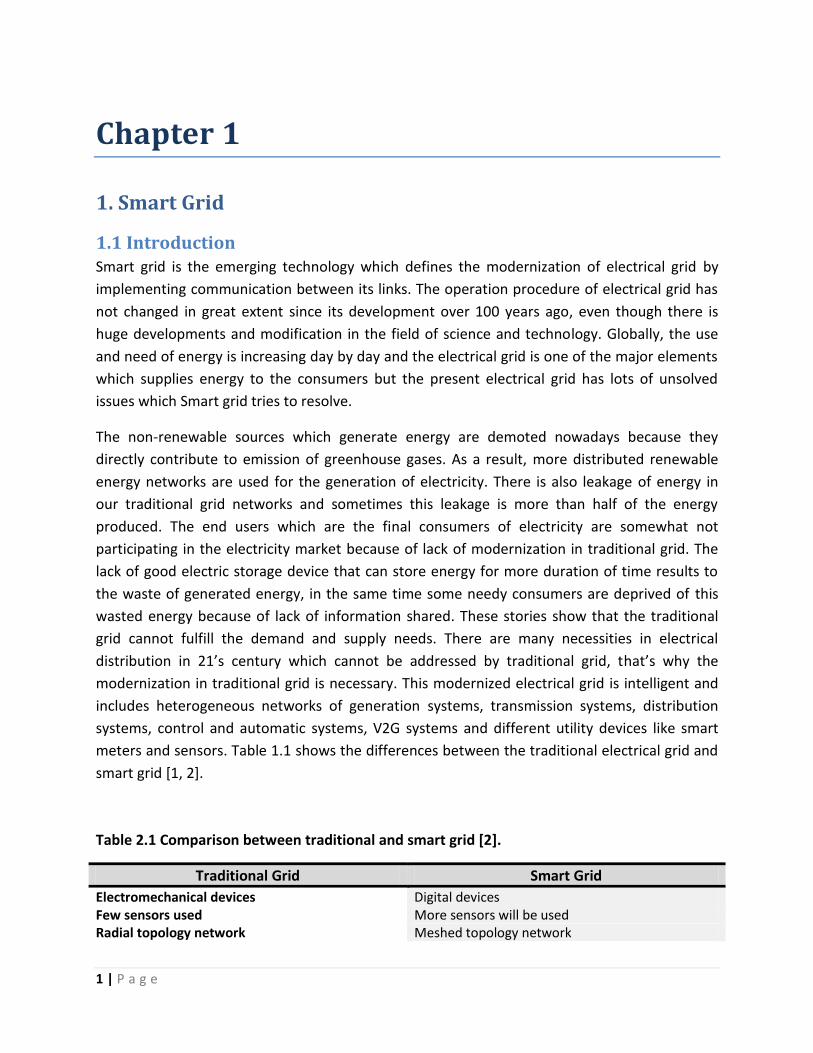
meters and sensors. Table 1.1 shows the differences between the traditional electrical grid and
smart grid [1, 2].
Table 2.1 Comparison between traditional and smart grid [2].
Traditional Grid Smart Grid
Electromechanical devices Digital devices Few sensors used More sensors will be used Radial topology network Meshed topology network
2 | P a g e
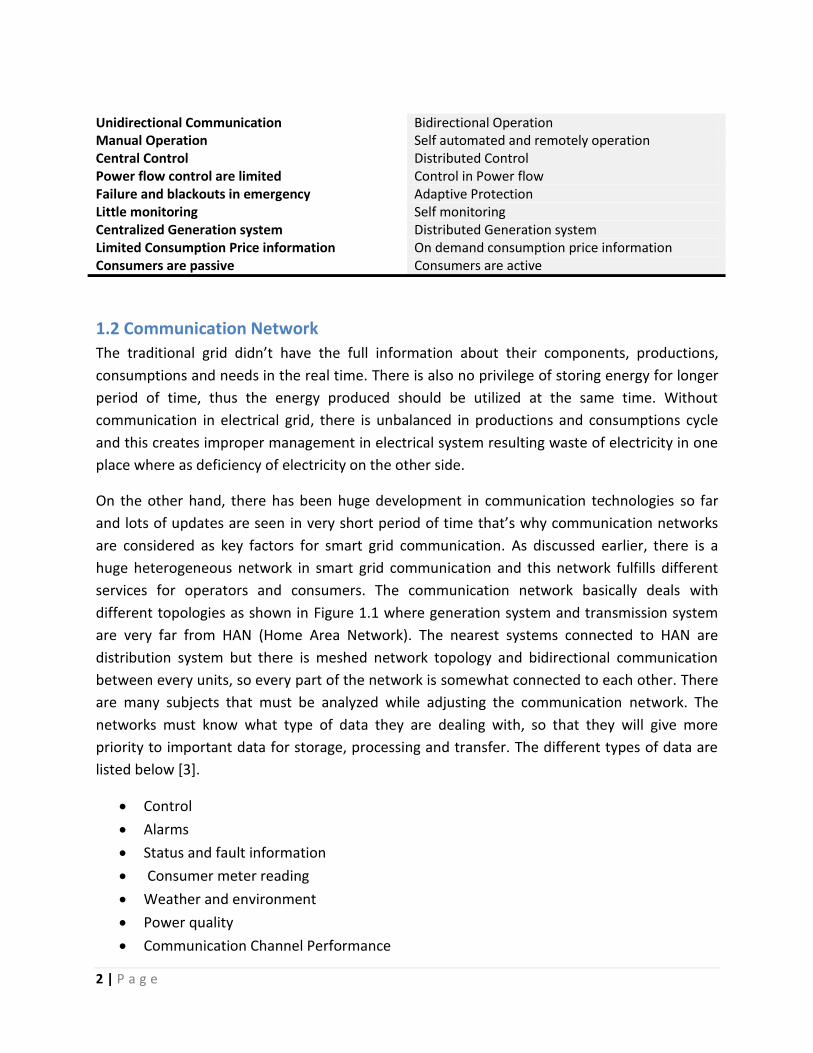
Unidirectional Communication Bidirectional Operation Manual Operation Self automated and remotely operation Central Control Distributed Control Power flow control are limited Control in Power flow Failure and blackouts in emergency Adaptive Protection Little monitoring Self monitoring Centralized Generation system Distributed Generation system Limited Consumption Price information On demand consumption price information Consumers are passive Consumers are active
1.2 Communication Network
The traditional grid didn’t have the full information about their components, productions,
consumptions and needs in the real time. There is also no privilege of storing energy for longer
period of time, thus the energy produced should be utilized at the same time. Without
communication in electrical grid, there is unbalanced in productions and consumptions cycle
and this creates improper management in electrical system resulting waste of electricity in one
place where as deficiency of electricity on the other side.
On the other hand, there has been huge development in communication technologies so far
and lots of updates are seen in very short period of time that’s why communication networks
are considered as key factors for smart grid communication. As discussed earlier, there is a
huge heterogeneous network in smart grid communication and this network fulfills different
services for operators and consumers. The communication network basically deals with
different topologies as shown in Figure 1.1 where generation system and transmission system
are very far from HAN (Home Area Network). The nearest systems connected to HAN are
distribution system but there is meshed network topology and bidirectional communication
between every units, so every part of the network is somewhat connected to each other. There
are many subjects that must be analyzed while adjusting the communication network. The
networks must know what type of data they are dealing with, so that they will give more
priority to important data for storage, processing and transfer. The different types of data are
listed below [3].
Control
Alarms
Status and fault information
Consumer meter reading
Weather and environment
Power quality
Communication Channel Performance

3 | P a g e
Figure 3.1 Smart Grid Communication Network.
The smart grid communication must have good data rates for providing updated energy
consumption to users, signaling while there is fault in the system and provide the control signal
to operate quickly for fast start up and shut down while switching between the substations. The
substation plays the major role of transforming the voltage from generation system to the
distribution system. It contains the transformer, switching, control and protection equipment
which are essential in modern electrical grid system to connect or disconnect transmission line
in the system. Thus it plays a major role in connecting and disconnecting different non
renewable generation systems and other networks in the smart grid network. Modern
substation production companies like Holtab have the ability to produce customize substation
according to the needs which is an essential element for smart grid development [4]. Power line
communication will play an important role in switching and in other activities in smart grids
because it physically touches every transmission lines and its components. So the study of
4 | P a g e
channel model, noise, and coupling mechanism in power line communication is essential
elements for smart grid actions. The data rates required at present for Smart Grid
communication is comparatively lower than other technologies so it can be easily fulfilled by
present communication technologies but the services that Smart Grid will bring along them are
as yet unclear. Data security is another important concern for smart grid communication. The
network security protocol must be standardized between every devices of smart grid
communication and multiplexing technique like OFDM should be used so that data security
threat should be avoided.
1.3 Objectives of thesis The main objective of the thesis is to study the best possible wired and wireless communication
for Smart Grid communication. For wired communication, the utilization of the existing grid for
communication will be profitable and will reduce other deployment cost. The automation and
switching in the present grid can be controlled and monitored from distant place, if we can
transfer data in the electrical grid. So, the study of power line communication is an essential
topic for smart grid communication. There are many challenges that must be considered for
power line communication for example noise, channel modeling, channel capacity, data rates,
security, and user integrity which will affect how efficient our communication will be in power
line carrier.
Also to make smart grid communication more reliable and to integrate information from many
mobile devices which are located in different area of the network the researches in wireless
communication for smart grid application is necessary. In wireless communication we can
characterize the scenario of different interconnection of topologies like Home Area Network
(HAN), Neighborhood Area Network (NAN), and Wide Area Network (WAN).So many wireless
technologies will be used in Smart grid like Wi-Fi, ZigBee, WiMax, and LTE to communicate
between these topologies. The study of thesis will also conclude the difference between
different wireless technologies and highlights the pros and cons between them.
Also an important aspect that is needed to be studied in this thesis is latest multiplexing and
digital modulation technique that plays an essential role in improving the communication. The
thesis will also present the simulation result of the channel modeling and channel capacity of
power line communication for different scenarios and investigate the viability of PLC. At last the
main purpose of my thesis is to research the best possible networks for smart grid
communication by analyzing different parameters in details.

5 | P a g e
Chapter 2
2 Modulation and Multiplexing Technique
2.1 Introduction
It is obvious that modulation and multiplexing is the vital elements for any communication
system. There has been lots of research for modulation and multiplexing technique so far and
today’s communication system utilizes the best techniques according to their requirement.
Modulation is the process of sending our information signal to a receiver through
communication channel by varying its properties with the carrier signal like amplitude,
frequency and phase. Digital modulation is widely used nowadays than analog modulation for
different reasons like security, bandwidth, error correcting and detecting of noise [5]. In digital
modulation also different techniques is developed so far, and the use of specific technique is
very much related to characteristics of the message signal or channel or the performance of the
overall communication system.
For the transmission and receiving different signals in same communication channel
multiplexing and different channel access method was introduced in communication system
[5].In OSI model, modulation is provided by the physical layer and multiplexing is provided by
the data link layer. Different multiplexing and its channel access techniques are used so far like
FDMA, TDMA, and CDMA but with the evolution of OFDM the new revolution happened in the
field of communication system. Today, most of the most communication channel uses the
OFDM technique because it solves the problem of multipath propagation and signal
attenuation. The target of this chapter is to study different digital modulation technique used
for OFDM.
2.2 Digital Modulation Techniques
In digital modulation technique also the amplitude, frequency and phase of the message signal
varies with the carrier signal but here the message signal that is to be transmitted is in digital
form. The main thing that is needed to consider in OFDM is that it is the FDM scheme so only
the amplitude or phase or both at the same time is varied. The first process of digital
modulation technique is converting analog message signal into digital form. The digitized bits
are a complex number and represent the symbol of the signal. There are many digital
modulation techniques having their own importance and different factors are needed to
consider for selecting the appropriate techniques. These different factors are dependent on
6 | P a g e
circuit complexity, data rates, symbol errors, transmitted power, and channel bandwidth. The
different modulation technique is discussed below but before that let’s discuss about the
projection of the signal in vector form [7][8][9].
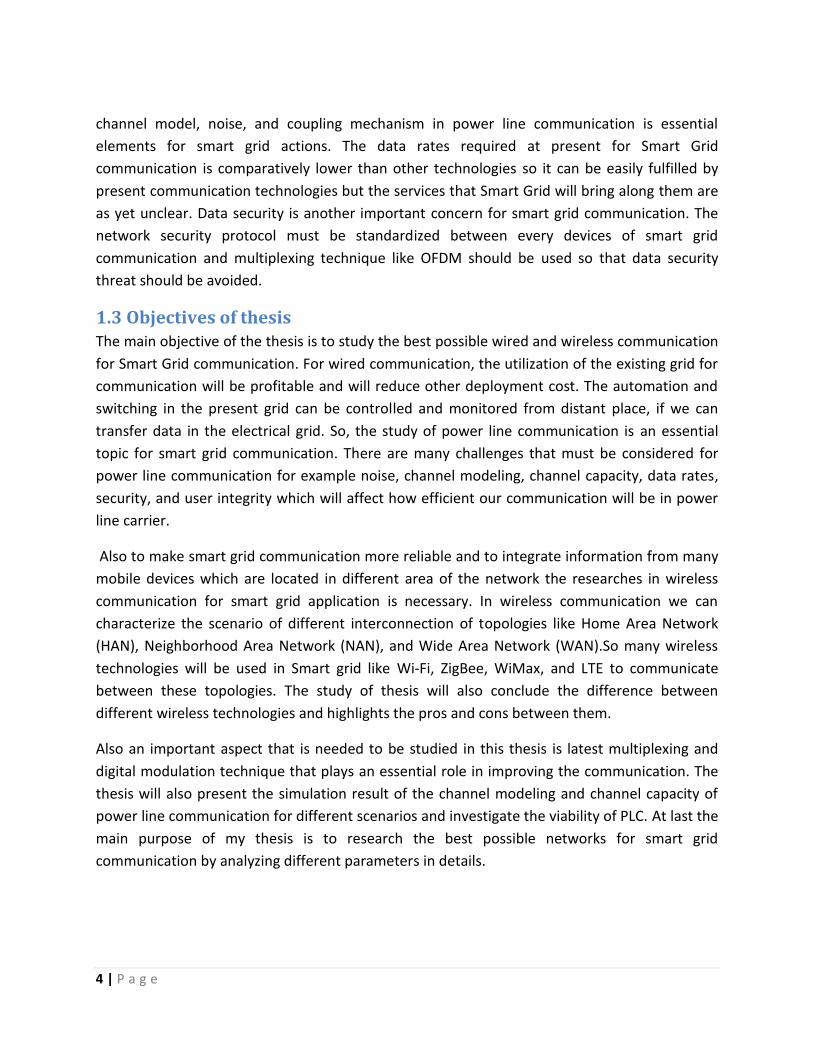
The concept of in-phase and quadrature phase signals appears when the signal are plotted in
vector form. In the Figure 2.1 the s11 is in-phase projection whereas s12 is quadrature projection
of the signal.
Figure 4.1 In-Phase and Quadrature Phase of the signal.
Magnitude of the signal = 𝑠122 + 𝑠12
2
Phase of the signal = 𝑡𝑎𝑛−1 𝑠11
𝑠12
7 | P a g e
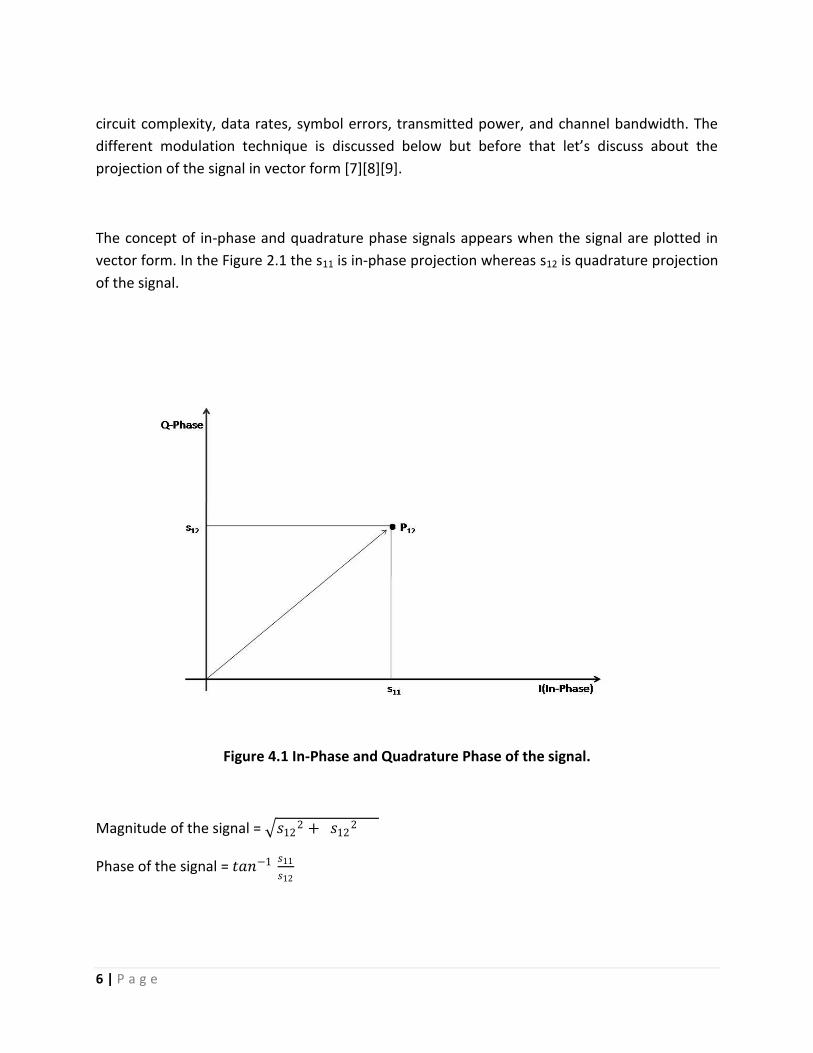
2.2.1 PSK (Phase Shift Keying) Modulation
In PSK modulation the phase of message signal is varied with the carrier signal and the data are represented in the points of circle. Each data has same amplitude and power and the angle (θ) separates the digital data. This type of modulation provides better phase separation between the adjacent points which results the better noise immunity. Constellation diagram are used to represent data in modulation scheme and the data are represented in binary digits.
2.2.1.1 BPSK (Binary PSK)
In BPSK the data are separated by 180 degree and here one bit corresponds to one symbol. The information is plotted inside these bits. It lies only in X-axis and does not have any projection in Y-axis. The error in receiver section is achieved by comparing the vector location of the data, the error can easily be found in BPSK because it is separated by 180 degree phase shift.
Figure 2.2.1.1 BPSK Modulation
8 | P a g e
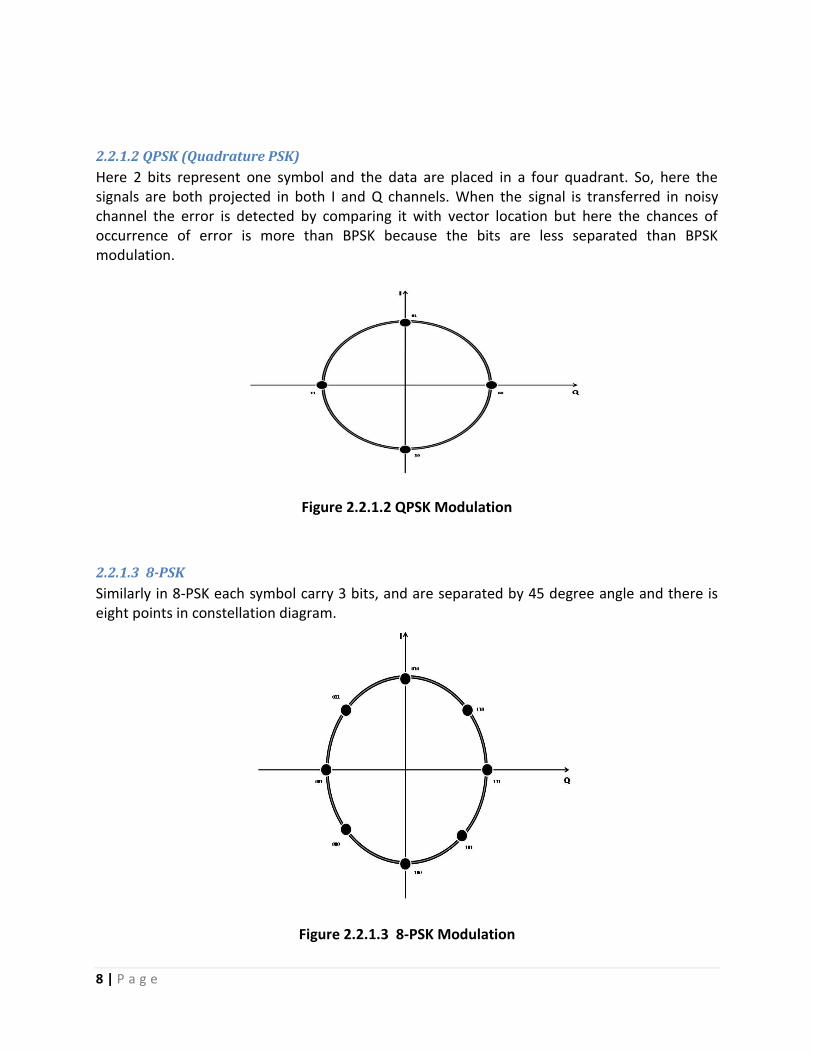
2.2.1.2 QPSK (Quadrature PSK)
Here 2 bits represent one symbol and the data are placed in a four quadrant. So, here the signals are both projected in both I and Q channels. When the signal is transferred in noisy channel the error is detected by comparing it with vector location but here the chances of occurrence of error is more than BPSK because the bits are less separated than BPSK modulation.
Figure 2.2.1.2 QPSK Modulation
2.2.1.3 8-PSK
Similarly in 8-PSK each symbol carry 3 bits, and are separated by 45 degree angle and there is eight points in constellation diagram.
Figure 2.2.1.3 8-PSK Modulation
9 | P a g e
Similarly in 16-PSK each symbol carries 4 bits of data and the points in constellation diagram are separated by 22.5 degree. Bit rate may increase with the increment of bits in data but there is the chance of bit error increment with the increment in order.
2.2.2 QAM Modulation
In this type of modulation scheme data are varied both in amplitude and phase. The signals are
represented in rectangular constellation diagram. In PSK all points lie in a circle but here the
point lies inside a rectangular diagram. In the receiver section vector location of the signal are
more concerned because here both the phase and amplitude of the signal is varied. The 16-
QAM and 64-QAM modulation are discussed below.
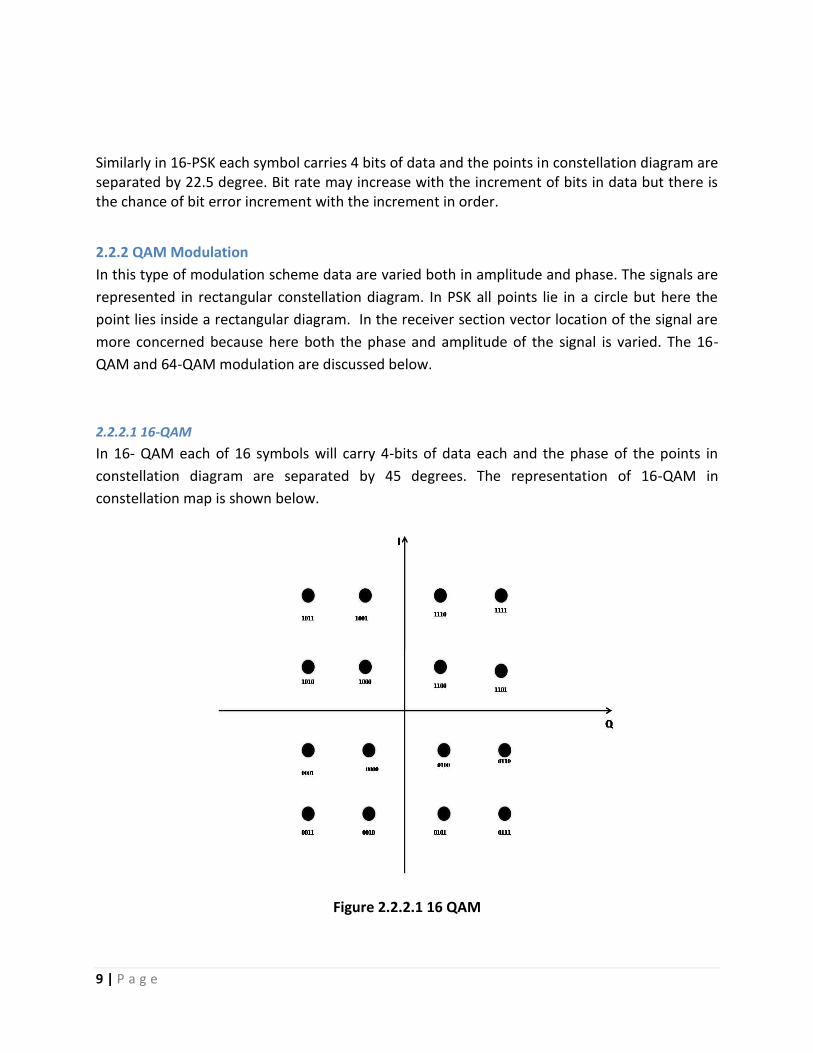
2.2.2.1 16-QAM
In 16- QAM each of 16 symbols will carry 4-bits of data each and the phase of the points in
constellation diagram are separated by 45 degrees. The representation of 16-QAM in
constellation map is shown below.
Figure 2.2.2.1 16 QAM

10 | P a g e
2.2.2.2 32-QAM
In 32 QAM there are 32 symbols in constellation diagram which can be represented in either
rectangular or non rectangular form, each symbol carries 5 bits of data and the phase are
separated by 22.5 degrees. The data rate increase compared to 16-QAM but the probability of
error occurrence is larger in 32 –QAM.
Figure 2.2.2.2 32 QAM
2.3 OFDM
2.3.1 Introduction
OFDM is the frequency division multiplexing scheme which uses multicarrier frequencies to
transfer data. These multicarrier frequencies are orthogonal and are closely spaced with each
other. The need of OFDM is necessary in today’s broadband communication because it offers
higher data rates than traditional multiplexing system. The traditional communication system
uses the single carrier modulation scheme in which many issues were tackled related with
quality of service like throughput, delay, fading, inter symbol interference(ISI) etc .In OFDM the

11 | P a g e
quality of service is improved by dividing single carrier frequencies to multicarrier frequencies
which results in improving the throughput of the communication channel, increase of the
overall data rate of the channel and also there is less probability of the signal for frequency
selective fading because the multicarrier signal will experience flat selective fading at the same
time [10,11].
2.3.2 Basic Principle of OFDM
As discussed earlier, OFDM uses a multicarrier modulation scheme to transfer our information
and this information is represented by digital modulation techniques. The input signal is divided
in channels each with a random carrier frequency and then digitally modulated with the help of
PSK or QAM. Since there is frequency variation in the signal path, a pilot signal is transmitted
from the transmitter side to synchronize with the receiver. The general block diagram of OFDM
can be seen in Figure 2.3.2 which shows the operating principle of OFDM [12].
Figure 2.3.2 Block diagram of OFDM
The digitally modulated symbols are converted in parallel form so that each carrier can be
assign to each symbol. The use of IFFT plays an important role in transforming frequency
12 | P a g e
domain signal to time domain, also in the receiving part the digitally modulated signal are
obtained by applying FFT to the signal. IFFT and FFT are fast and efficient method to compute
DFT. The data rates of the channel are more over determined in this section, if we use 8-PSK
with 50 carrier signals then the OFDM signal will carry 150 bits and similarly if we use 16-QAM
with 50 carrier signals then the OFDM signal will carry 200 bits.
Then the parallel streamed time domain signals are converted into serial form by parallel to
serial converter. Before transmitting the signal, the cyclic prefix is added to this time domain
signal which plays an important role as guard interval. The cyclic prefix is the copy of the first
symbol of the signal sample to last portion the signal, making the signal appearing periodic in
nature which helps to distinguish the sample of the signal at the receiver side. In multipath
propagation the signal gets delayed or attenuated, the addition of the cyclic prefix will also help
to combat such multipath effect [13].
2.3.3 Advantages of OFDM compared to single carrier modulation
1. The bandwidth efficiency is high as it transmits more data in the given bandwidth with
orthogonal signal.
2. The computational problem is easy with the use of FFT and IFFT.
3. Channel Equalization, Estimator and Complexity are simple.
4. It reduces inter symbol interference with the use of cyclic prefix.
5. It has combating power of multipath propagation effect.
6. It has more resistant to frequency selective fading [11].
2.3.4 Disadvantages
1. It has high peak to average power ratio (PAPR), so the complex OFDM signal requires
linear amplification.
2. It is only appropriate for big number of sub carriers because the bandwidth efficiency is
low for small number of subcarriers.
3. It is more sensitive to carrier frequency variation and phase noise, to overcome this
problem a pilot signal is transmitted to synchronized with receiver.
4. Synchronization is needed between transmitter and receiver to correctly remove the
cyclic prefix [10].

13 | P a g e
Chapter 3
3. Wired Communication
3.1 Introduction
The first primitive communication was the direct use of cables between the sender & receiver
and these kind communications is considered to be zero generation (0G). This kind of
communication began in the eighteenth century and is in practice regularly even though there
is huge evolution of wireless communication. The reason behind this is that wired
communication is still considered to be most stable and impervious mode of communication.
The telephone wires made up of copper or aluminum are considered to be the first wired
medium which uses electrical pulses to transfer signals. Twisted pair cables then came to
existence having tolerance of electromagnetic interference and then the coaxial cables came
which provides better shielding of conductor that improves power to interference.
The revolution in wired communication came when there was the invention of optical fiber
which uses light to transfer the signal and these signals can travel greater distance without
electromagnetic interference. Optical fiber cores are made up of pure glass and signal
propagation mechanism follows the principle of total internal reflection. The additional assets
of optical fiber are listed below.
Less weight
More Signal Capacity
Less Signal Attenuation
No electromagnetic interference
This results optical fiber to be the best wired medium that transfers signal to longer distance
with higher data rates [14]. For smart grid communication, the implementation of information
signal on existing power grid made up of copper or aluminum metal will be very beneficial
because it reduces cost of infrastructure and also provides the direct platform to control,
automation and even integration of broadband internet in electrical network. There has been
much development in wired communication and nowadays PLC communication provides
better security, low attenuation and higher data rates in compare to other communication
system.
14 | P a g e
3.2 Power Line Communication
3.2.1 Introduction
The use of power line carrier for the communication network in smart grid will be fruitful.
Smart grid will be interconnected with many large networks like existing generation plant,
decentralized renewable energy plant, transmission substation, distribution substation and
end user networks. The power line carrier is direct path through which these networks are
directly interconnected. The power line carrier will operate in different voltage levels.
Low voltage (LV) less than 0.4 KV
Medium Voltage (MV) greater than 15 or 20 KV
High Voltage (HV) greater than 110 KV
Extra High Voltage (EHV) greater than 220 KV
At the consumer end the voltage level of 110-240 volt and frequency range 50- 60 Hz is used.
The voltage and frequency standard are different in different regions and follow the basic
rules of power distribution of that country [15].
The research on PLC started with the commercialization of electrical power. The earlier
invention was the electrical meters which measure the amount of energy used by the house.
Later on these reading were able to be read from remote stations with the advancement of
signal processing. The first communication technique on PLC was the use of ripple control
which used frequency of 100 to 900 Hz with high transmitted power up to 1kW, the bit rate
was very low with this one way communication technology and was applicable for the
management of street lights and load control. In mid 1980’s many researches on higher
frequency (5 to 500 KHz) were started and gave many values for attenuation and signal to
noise ratio of the signal in the grid [18].
Right now much researches is going on for advance metering infrastructure, automation,
control and detecting fault and tolerance in different overhead and underground cables,
transformers, modems, repeaters, coupler of the PLC system [16]. Copper or Aluminum
metals are used for conducting the AC signals and the integration and transmission of
information signal in these conductors has been a main research topic nowadays. Noise and
Channel Characteristics are being studied to model transmission systems more precisely and
also the use of Shanon Hartley formulae for the channel capacity is developed. Different

15 | P a g e
modulation techniques are being researched to improve data rates and also different
international and national standard are mentioned to restrict the bandwidth and power levels
of communication signals. The European CENELNEC 50065.1 standard is followed widely
which standardized the frequency between 3 KHz to 148.5 KHz and the power level to less
than 500 mW. Recent research is also happening for frequencies above 1 MHz [16] [17].
3.2.2 PLC Network Architecture
As discussed earlier, the electrical grid can be described as interconnection between different
HV, MV, and LV networks and the implementation of PLC helps to share information between
these networks. The network architecture of PLC is somewhat related to telecommunication
architecture models in which the whole network model is divided into in-home access
network or NTU(Network Termination Unit), PLC distribution network, backbone network and
service provider network. The general architecture of PLC access is discussed below.
Figure 3.2.2 PLC Network Architecture (after[19],pp 434)
As shown in Figure 3.2.2, the NTU (Network termination Unit) is the interface between PLC
network and end user. There are LV repeaters for maintaining the quality of signal between

16 | P a g e
LV head end and NTUs. MODEM is used for modulation and demodulation process, the LV
head end and MV modem are the gateway of communication between transformer
substations and the customers. The MV modem is connected to the backbone of the
communication network by means of MV head end cables. The master/slave approach is used
to establish a connection between the central unit and customer premises in which the
central unit plays the master role where it can access information from all its customer ends.
Internet is used as the backbone of the network because it is a large and high bandwidth
network that authenticates and establishes connection and almost every network in this
world is virtually connected to each other by internet. The use of repeaters is essential in PLC
because the attenuation in power line channels is high. Repeaters will help to regenerate the
PLC signals to achieve high performance in communication channel.
For the smart grid concept the use of PLC network is especially for monitoring and
transmitting the signal of PLC equipment. Another use of PLC network is the automation
inside the electrical grid which helps in operating, maintaining and switching between the
whole electrical systems. The use of PLC network is also useful for broadband internet
services without extra installation cost [19, (pp 432-437)].
3.2.3 Channel modeling
The most awakening part of power line communication is to understand its medium
characteristics and model channels with its reference, which is why the characteristics of the
medium play an important role in channel modeling. The transmission line is only medium
here through which the data is transfer but the most important thing to be considered is that
the main role of cable that is to transfer electricity should not be disturbed. Normally a cable
of wire should be treated as transmission line, if the cable length is greater than one tenth of
the wavelength. The wave length of transmission line is given by λ= 𝑣𝑝
𝑓 , where f is signal
frequency and 𝑣𝑝 is phase velocity given by
𝑣𝑝= 𝑐0
휀𝑟𝜇𝑟 , (3.2.3.1)
where 𝑐0 is the speed of light which 3× 10⁸ m/s and 휀𝑟 and 𝜇𝑟 is the dielectric constant and
the permeability of the material. The RF signal losses in normal scenario in transmission line
are due to skin effect and dielectric losses. The electric current flow at the surface of the
conductor called skin depth. It is given by
𝛿= 𝜌
𝜋𝜇𝑓 , (3.2.3.2)
17 | P a g e
where 𝜌 and µ are the specific resistance and permeability of the conductor. When the
frequency of RF signal is increased the skin depth becomes shorter resulting, the effective
resistance of the conductor to increase. Similarly the signal losses in the conductor are also
due to dielectric losses of the insulating material between the conductors [19, (pp 34-37)].
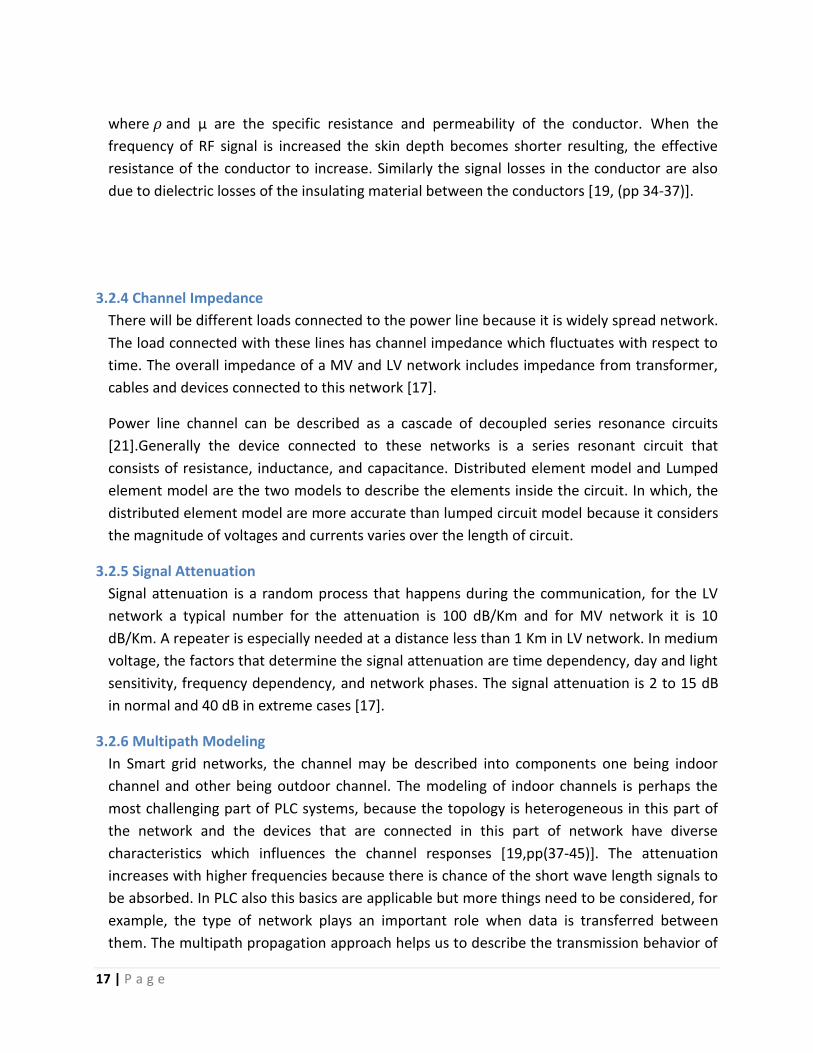
3.2.4 Channel Impedance
There will be different loads connected to the power line because it is widely spread network.
The load connected with these lines has channel impedance which fluctuates with respect to
time. The overall impedance of a MV and LV network includes impedance from transformer,
cables and devices connected to this network [17].
Power line channel can be described as a cascade of decoupled series resonance circuits
[21].Generally the device connected to these networks is a series resonant circuit that
consists of resistance, inductance, and capacitance. Distributed element model and Lumped
element model are the two models to describe the elements inside the circuit. In which, the
distributed element model are more accurate than lumped circuit model because it considers
the magnitude of voltages and currents varies over the length of circuit.
3.2.5 Signal Attenuation
Signal attenuation is a random process that happens during the communication, for the LV
network a typical number for the attenuation is 100 dB/Km and for MV network it is 10
dB/Km. A repeater is especially needed at a distance less than 1 Km in LV network. In medium
voltage, the factors that determine the signal attenuation are time dependency, day and light
sensitivity, frequency dependency, and network phases. The signal attenuation is 2 to 15 dB
in normal and 40 dB in extreme cases [17].
3.2.6 Multipath Modeling
In Smart grid networks, the channel may be described into components one being indoor
channel and other being outdoor channel. The modeling of indoor channels is perhaps the
most challenging part of PLC systems, because the topology is heterogeneous in this part of
the network and the devices that are connected in this part of network have diverse
characteristics which influences the channel responses [19,pp(37-45)]. The attenuation
increases with higher frequencies because there is chance of the short wave length signals to
be absorbed. In PLC also this basics are applicable but more things need to be considered, for
example, the type of network plays an important role when data is transferred between
them. The multipath propagation approach helps us to describe the transmission behavior of
18 | P a g e
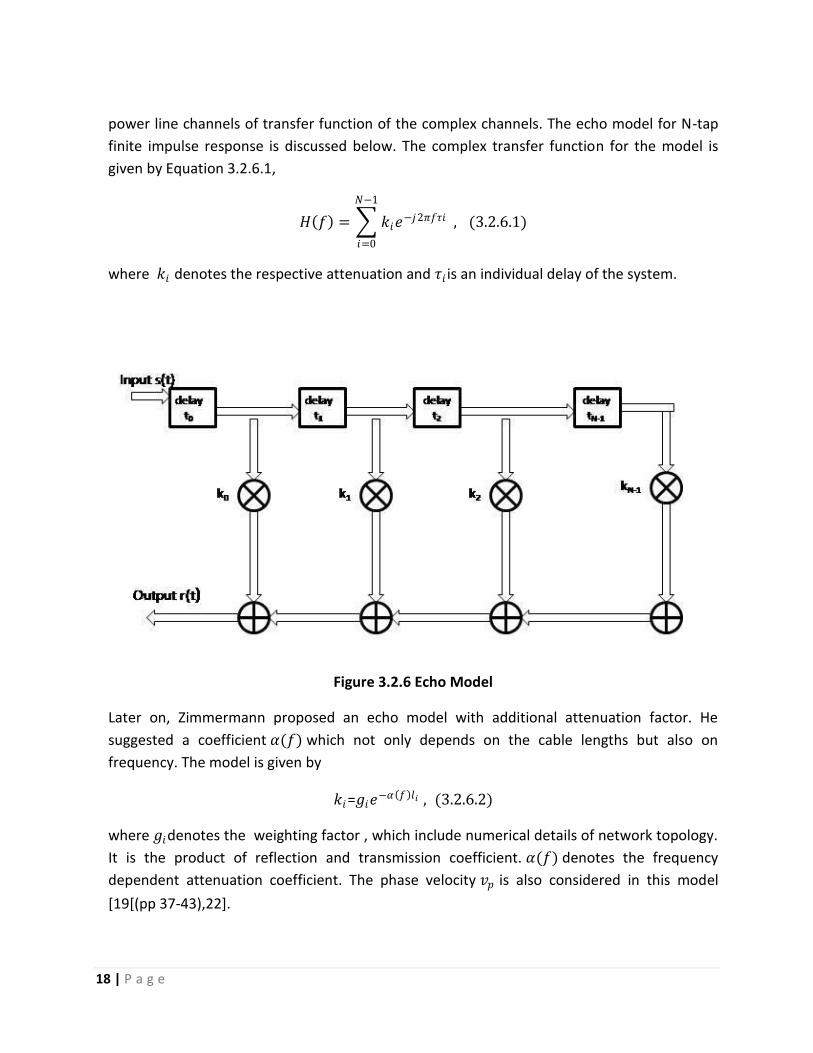
power line channels of transfer function of the complex channels. The echo model for N-tap
finite impulse response is discussed below. The complex transfer function for the model is
given by Equation 3.2.6.1,
𝐻 𝑓 = 𝑘𝑖𝑒−𝑗2𝜋𝑓𝜏𝑖
𝑁−1
𝑖=0
, (3.2.6.1)
where 𝑘𝑖 denotes the respective attenuation and 𝜏𝑖 is an individual delay of the system.
Figure 3.2.6 Echo Model
Later on, Zimmermann proposed an echo model with additional attenuation factor. He
suggested a coefficient 𝛼(𝑓) which not only depends on the cable lengths but also on
frequency. The model is given by
𝑘𝑖=𝑔𝑖𝑒−𝛼 𝑓 𝑙𝑖 , (3.2.6.2)
where 𝑔𝑖denotes the weighting factor , which include numerical details of network topology.
It is the product of reflection and transmission coefficient. 𝛼(𝑓) denotes the frequency
dependent attenuation coefficient. The phase velocity 𝑣𝑝 is also considered in this model
[19[(pp 37-43),22].
19 | P a g e
Finally, 𝐻 𝑓 = 𝑔𝑖𝑒−𝛼 𝑓 𝑙𝑖 𝑒
−𝑗2𝜋𝑓𝑙𝑖𝑣𝑝 .
𝑁−1
𝑖=0
(3.2.6.3)
3.2.7 Reflection
Reflection of wave generally occurs mostly due to non-matched termination of the load in
circuit and sometimes due the imperfection of cables, when there are different loads in the
network having different impedance value then load impedance mismatch results the
reflection of the forward and moving wave. For reducing the reflection effect the proper
impedance matching must be done at receiver side [19(pp 37)]. The reflection factor is given
by
ᴦ =𝑍𝑙 − 𝑍𝐿
𝑍𝑙 + 𝑍𝐿 . (3.2.7)
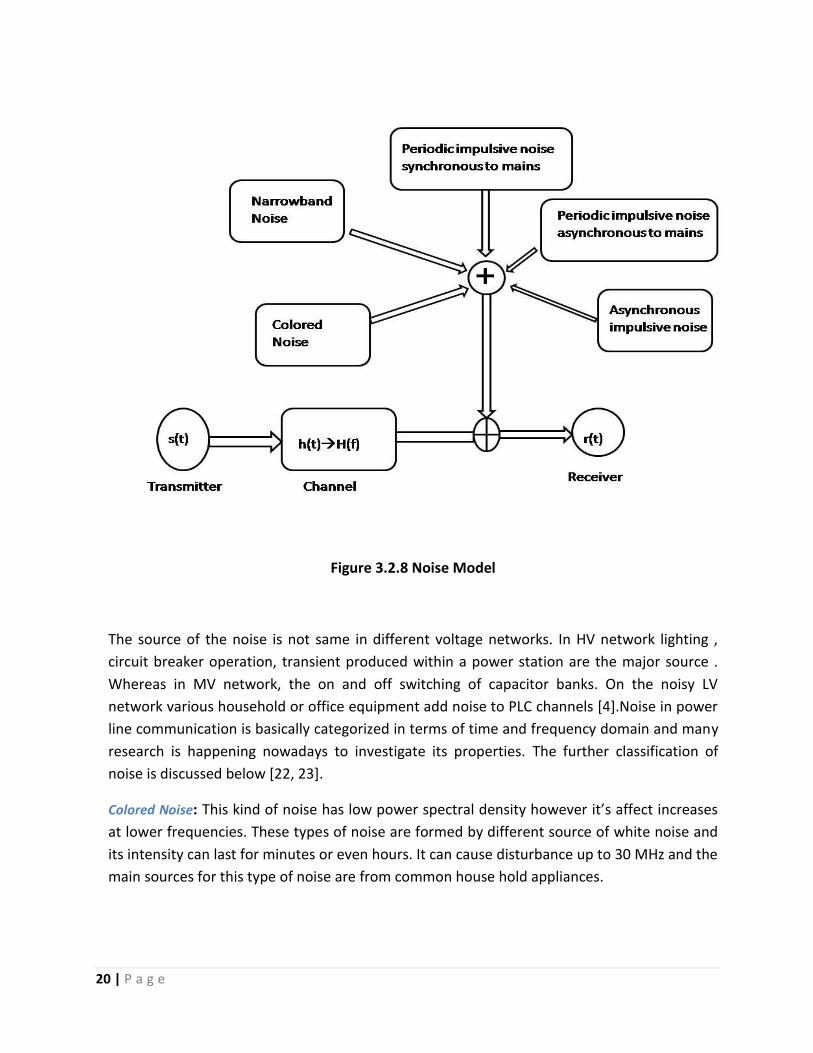
3.2.8 Noise Model
The presence of noise is inevitable in any communication channel that’s why it is not
considered as a supplement issue, it is a basic concept of communication channel. Signals get
attenuated due to cable loss, multipath propagation, and noise in power line communication.
Noise in power line communication is erratic and different situation should be considered
than other communication channel, while modeling. In wireless communication the AWGN
environment can be considered in modeling but the same state cannot be considered in
power line communication.
20 | P a g e
Figure 3.2.8 Noise Model
The source of the noise is not same in different voltage networks. In HV network lighting ,
circuit breaker operation, transient produced within a power station are the major source .
Whereas in MV network, the on and off switching of capacitor banks. On the noisy LV
network various household or office equipment add noise to PLC channels [4].Noise in power
line communication is basically categorized in terms of time and frequency domain and many
research is happening nowadays to investigate its properties. The further classification of
noise is discussed below [22, 23].
Colored Noise: This kind of noise has low power spectral density however it’s affect increases
at lower frequencies. These types of noise are formed by different source of white noise and
its intensity can last for minutes or even hours. It can cause disturbance up to 30 MHz and the
main sources for this type of noise are from common house hold appliances.

21 | P a g e
Narrowband Noise: This type of noise is generated from radio broadcast stations in the
medium and short frequency range. They are sinusoidal in nature and are amplitude
modulated.
Periodic impulsive noise synchronous to mains: These kinds of noise are impulsive in nature and
last for short duration and are synchronous to mains cycle. They have the repetition rate of
50 -100 Hz and are mainly caused by power supplies like rectifiers, which operates
synchronously with the main cycle.
Periodic impulsive noise asynchronous to mains: These kinds of noise are also impulsive in nature
but the repetition rate increases to 50-200 KHz. The major sources of generation of these
kinds noise are from switching power supplies.
Asynchronous impulsive noise: These kinds of noise can affect high speed communication
because its impulses sometimes contain frequencies up to 20 MHz. It has high power spectral
density and can create burst of errors resulting destroying of data. The main source for this
kind of noise is from switching transient from the network.
3.2.9 Electromagnetic Susceptibility
There are many electromagnetic issues that not only disturb the operation of power line
communication systems but also can interfere with the radio communication (3 KHz to 300
GHz) in outer surrounding. The broadband in power line communication needs higher
frequencies as a carrier but these frequencies have greater chance to interact with outer
surroundings. Many electromagnetic issues needs to be considered while implementing
communication over power lines, the injection of the charge in an electronic object can
create high transient current inside it , which can destroy that object so proper steps must be
taken to neutralize these electronic discharges. The fast transient current produced from
switching activities, and the overvoltage transients from lighting will also affect the operation
in communication. Also, electromagnetic waves from nearby radio stations will inject
common mode signals to the power line, so the proper application must be used to reject
these common mode signals from a PLC receiver [19,pp(134-140)].
22 | P a g e
3.2.10 Coupling
The process of injecting communication signals in the power lines is a challenging and critical
task and many technical aspects should be considered to accomplish this process. The power
system and communication system operate in a different scenario. The power signals have
low frequency and high power, voltage and current levels but the communication signals has
high frequency and low power, voltage and current levels. So, the design of coupling circuit is
a concerned subject in power line communication.
The coupling device is the main component which couples the signal in the power line carrier.
Also, the role of the coupling device is to provide the necessary electric isolation between the
PLC device and the power lines. The signals can be coupled by either inductive coupling or
capacitive coupling .In capacitive coupling straight forward electronics principle is used to
couple the signal. Whereas, In inductive coupling the physical connection between the PLC
device and power line is isolated which makes it a safer coupling device, the coupling
transformer plays an important role in isolation and adaptation of impedance, but the
inductive coupling is a lossy coupling method as compared to capacitive coupling scheme.
Both inductive and capacitive schemes are used in coupling device for better performance
while coupling the signal and for the safety of PLC device. The general coupling circuits consist
of coupling capacitor, a coupling device. The coupling capacitor is extensively used in coupling
process because it acts as filter between the power lines and coupling device. These kinds of
coupling capacitors are high frequency and high voltage capacitor which transfers the
communication signal and filters the high voltage from power lines. Beside that blocking
inductor are also used in coupling circuit to block prevent saturation and voltage drops from
power lines. The use of inductor has opposite function to that of a capacitor, it stops the high
frequency signal and passes the low frequency signal, and it is widely used in cases when the
communication signals are prevented to flow in certain path or branches resulting in the
prevention of unnecessary loss of transmitted power. The general relation of capacitor or
inductor with frequency and phase is show in equation 3.2.10.1 and 3.2.10.2 [19 (pp147-156),
24]. Thus
𝑍𝑐=1
𝑗𝑤𝑐=
1
2𝜋𝑓𝑐∠-90°(3.2.10.1)
𝑍𝑙=𝑗𝑤𝑙 = 2𝜋𝑓𝐿 ∠90° (3.2.10.2)
3.2.11 Overview of Standard
The standard maintained in PLC is a very crucial element for the implementation of smart grid
concept because it maintains the interconnection scenario between different PLC and utilities
23 | P a g e
devices. For the proper operation between the PLC devices, communication standards are
developed throughout the world but some standard are established for regions or countries.
The delay in development of standard, acceptable to many vendors, is considered as one of
the main factor for the delaying of the wider installation of PLC. There are many standards
which have been proposed by individual companies and among them; the most popular one
is Home Plug Power Alliance specification. The first specification developed by them was
Homeplug 1.0 which uses OFDM as a multiplexing technique with 84 carrier and provided
data rates of 14 Mbps. The present update on this specification is HomePlug AV with data
rates up to 200 Mbps in the 2-30 MHz band. The international standard are the credible
standard to everyone because it is globally recognized, some of the international standard of
PLC are discussed below [19, (pp 364-405)].
IEEE 1901
It was established in 2005 for developing high speed communication device using the frequency below 100 MHz. The standard supports Wavelet-OFDM, FFT-based OFDM in physical layer. An additional ITU-T and G.9960standard is also compatible with this standard which uses IEEE OFDM standard.
ITU-T G.9960
It is developed by International Telecommunication Union and is commonly known as ‘G.hn’ project and is responsible for developing a worldwide standard for home network transceiver capable of operating with different wired communication with bit rates up to 1Gbps. It supports up to 250 nodes operating in the network.
ETSI TC PLT
It is a popular European standard and is also responsible for making standard especially in the sector of EMC and radio spectrum.
CENELNEC 50065.1
It is the most sophisticated standard developed by European Union which focuses on band width and transmitted power. It provides 5 different channels in the range of 3-148.5 KHz frequency band with power not exceeding 500mW.The frequency and power allocation for a specific channel is shown in Figure 3.2.5.1 [17].

24 | P a g e
Figure 3.2.11.1 CENELNEC 50065 (after [17], pp 559)
25 | P a g e
Chapter 4.
4. Wireless Communication
4.1 Introduction
The use of wireless communication in smart grid applications provides further reliability and
efficiency in its operation because the present technologies in wireless communication offer
low latency, higher data rates, higher throughput, and wider and reliable link range. The power
line carrier physically touches every grid device that should be monitored and controlled but
with the use of wireless communication these services are further enhanced. The wireless
communication in present days provides a huge network in every corner of the world, also with
the use of MIMO system in wireless communication it provides higher throughput and link
coverage using limited frequencies and transmitted power. The operators can get information
more reliable and faster and can monitor and control these network systems with the help of
wireless communication, in the same way the user can also monitor and control their energy
need with the help of mobile devices from any corner of the world. Another advantage of using
wireless communication is that it is cost effective since the communication infrastructure is
already built. The communication infrastructure is widely deployed in the developed place like
Sweden, USA whereas in the least developed countries like Nepal it is limited to some areas.
Anyways, the wireless communication is still an extensive network and it will help for the
boosted network planning and installation of different smart devices in the network. That’s why
the need of wireless communication is essential in smart grid communication.
The radio communication in free space provides the communication channel between the
transmitter and receiver of the communication system. The propagation of these radio waves
are due to reflection, diffraction, refraction, and scattering of electromagnetic waves and the
various types of propagation are ground wave propagation, tropospheric propagation,
ionospheric propagation and line of sight wave propagation. The frequency band and range of
the network is different in different propagation mechanisms. This chapter is intended to
describe the wireless communication considering two network topologies (LAN and WAN) that
are applicable for smart grid communication.
4.2 LAN Technologies
The integration of different energy consuming devices present in our nearby surroundings and
the communication between these devices is essential for smart grid communication. It gives
on demand information to consumers about how much energy they are using in real time. Also

26 | P a g e
the user can spontaneously control his energy consumption. There are many wireless
technologies that are presently being used in local area network which uses unlicensed
frequency bands to operate like Bluetooth, Zigbee, WI-Fi. Each of these technologies has their
own importance and limitation.
4.2.1 Bluetooth
Bluetooth is low cost product which can be used for the smart grid communication inside the
personal area network for monitoring the energy consumption by the individual component. It
can also help to assist for control activity such as switching within the short range network.
Some of the features of Bluetooth is listed below [24].
1. The Bluetooth communication technologies falls under the standard of IEEE 802.15.1
standard and operates in an ISM band centered around 2.45 GHz.
2. It has low power consumption and is suitable for communication in Personal Area
Network (PAN) with range of radius 10 meter.
3. It can manage the data transfer speed up to 3 Mbps and does not require the line of
sight for communicating.
4. It uses the unlicensed frequencies for the communication and interference with the
unwanted components is avoided by using coding or spread-spectrum frequency
hopping techniques.
5. It uses Gaussian shaped frequency shift keying for modulation.
6. Bluetooth channel is associated with piconet which helps to establish ad-hoc network
forming master slave connection between the network, in which one Bluetooth master
device can communicate up to 7 active slave devices.
7. Bluetooth has strong authentication process to provide security to prevent
unauthorized users or devices to establish connection.
4.2.2 Zigbee
Zigbee is a low cost product which can be used for smart grid communication inside the home
area networking and can provide more coverage than Bluetooth connection. It can be used for
monitoring the energy consumption of the individual components connected in the home and
helps in the activities of automatic metering, automatic lightning. There is lots of energy
efficient and interoperable products like smart meters on the market with Zigbee standard, and
27 | P a g e
many companies have became alliance with this standard for making innovative products for
smart grid communication. Some of the features of Zigbee are listed below[25, 26].
1. It falls under the IEEE 802.15.4-2003 standard and operates in the ISM band of
frequencies 868 MHz, 915 MHz, and 2.4 GHz.
2. It has low power consumption resulting long battery life of devices and is suitable for
communication in Home area networking with range of radius 100 m.
3. Its data rate is 20 to 250 Kbps which is less than Bluetooth technology.
4. The direct sequence spread spectrum coding technique is used for avoiding
interferences.
5. It uses the Phase Shift Keying for modulation.
6. It uses the mesh topology to connect device within the network, also there is
acknowledgement between the devices for the successful transfer of data.
7. Like Bluetooth, Zigbee also has strong authentication process to provide security to
prevent unauthorized users or devices to establish connection inside the network.
4.2.3 WI-FI
It is basically used for broadband internet access within the local area network. The use of WI-FI
technologies for smart grid communication is seen for wireless handling different energy
management utilities like monitoring and automatic controlling of the energy usage in different
local areas [27, 28].
1. It falls under the IEEE 802.11b/g/n and operates in the 2.4 and 5 GHz frequency band.
2. It provides wider range up to 250 m resulting accumulation of information from many
systems in the network.
3. It can support data rate up to 54 Mbps and is basically used for broadband internet
access.
4. It uses OFDM or direct sequence spread spectrum coding technique for avoiding
interference.
5. It uses QAM and PSK for modulation.
6. It uses cellular network topology called Basic Service Set (BSS) for connecting systems
into the network.
7. The WPA (WI-FI Protected Access) has a strong authenticate process to provide security
in the network.
28 | P a g e
4.3 WAN Technologies
The local area network comprises all the information that is needed for handling their general
uses. For operating the smart grid communication the information should be transferred and
received from distant places. The consumers should have facility to demand the energy
according to their choices. For this local consumers should always have information about the
generation, transmission and distribution system, and also the present detail of consumers
should always be upgraded to energy providers to share information about their demand and
supply. The wide area network is thus need for the interaction between all the systems. The
present local area network technologies like WI-FI supports mesh networking thus it enable the
communication between neighborhood area networks. To extend the network far beyond and
to get connected with backhaul network the existing wireless communication infrastructure
must be utilized.
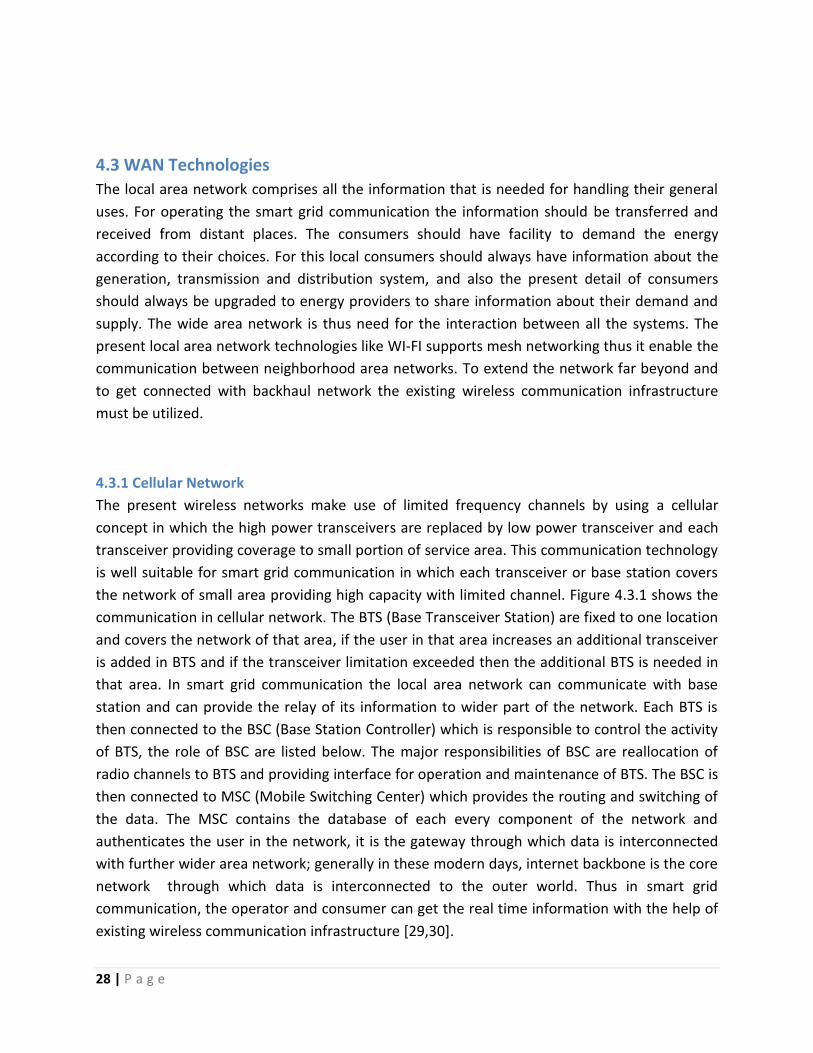
4.3.1 Cellular Network
The present wireless networks make use of limited frequency channels by using a cellular
concept in which the high power transceivers are replaced by low power transceiver and each
transceiver providing coverage to small portion of service area. This communication technology
is well suitable for smart grid communication in which each transceiver or base station covers
the network of small area providing high capacity with limited channel. Figure 4.3.1 shows the
communication in cellular network. The BTS (Base Transceiver Station) are fixed to one location
and covers the network of that area, if the user in that area increases an additional transceiver
is added in BTS and if the transceiver limitation exceeded then the additional BTS is needed in
that area. In smart grid communication the local area network can communicate with base
station and can provide the relay of its information to wider part of the network. Each BTS is
then connected to the BSC (Base Station Controller) which is responsible to control the activity
of BTS, the role of BSC are listed below. The major responsibilities of BSC are reallocation of
radio channels to BTS and providing interface for operation and maintenance of BTS. The BSC is
then connected to MSC (Mobile Switching Center) which provides the routing and switching of
the data. The MSC contains the database of each every component of the network and
authenticates the user in the network, it is the gateway through which data is interconnected
with further wider area network; generally in these modern days, internet backbone is the core
network through which data is interconnected to the outer world. Thus in smart grid
communication, the operator and consumer can get the real time information with the help of
existing wireless communication infrastructure [29,30].
29 | P a g e
Figure 4.3.1 Cellular Network Architecture
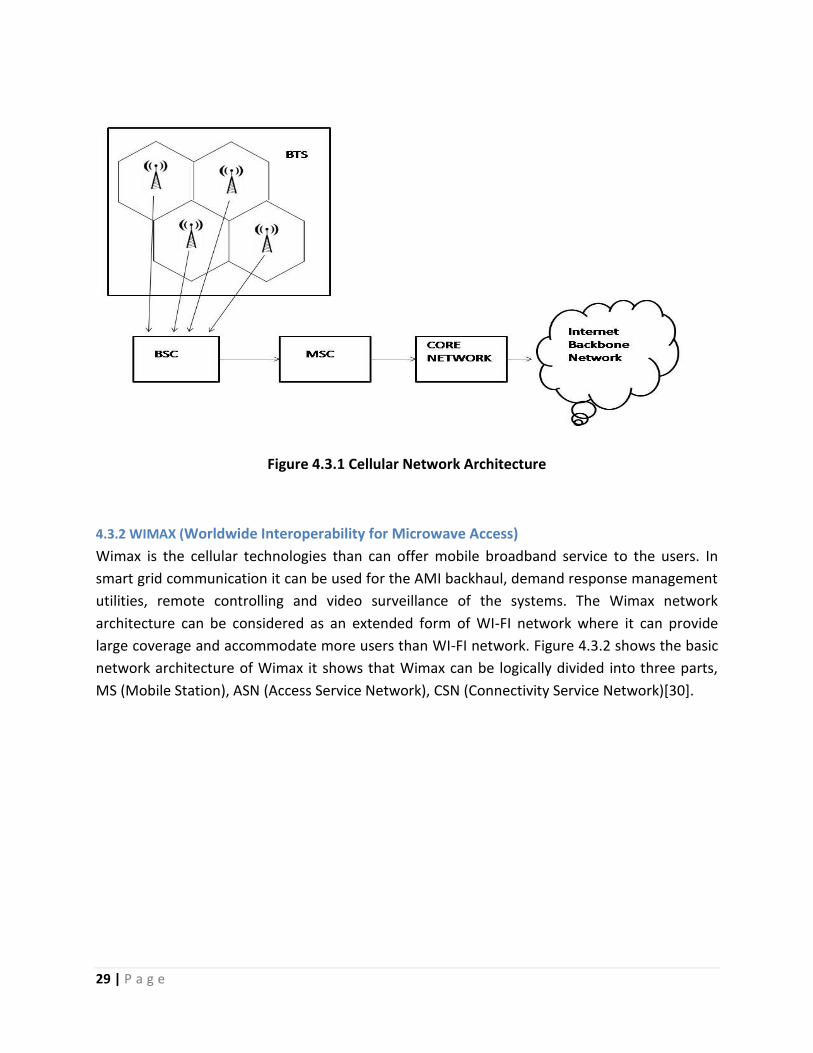
4.3.2 WIMAX (Worldwide Interoperability for Microwave Access)
Wimax is the cellular technologies than can offer mobile broadband service to the users. In
smart grid communication it can be used for the AMI backhaul, demand response management
utilities, remote controlling and video surveillance of the systems. The Wimax network
architecture can be considered as an extended form of WI-FI network where it can provide
large coverage and accommodate more users than WI-FI network. Figure 4.3.2 shows the basic
network architecture of Wimax it shows that Wimax can be logically divided into three parts,
MS (Mobile Station), ASN (Access Service Network), CSN (Connectivity Service Network)[30].
30 | P a g e
Fig4.3.2 Basic Wimax Network Architecture
The MS is used by the end users for accessing the network also it interfaces with the BS which
are responsible to cover the network for particular area. The group of BS is then interconnected
with ASN which are responsible for handoff, establishing connection, QOS and traffic control of
radio resources. The ASN-GW plays an important role as traffic planning for Layer 2 (MAC
layer), intra ASN management, encryption, and connection establishment with BS. The ASN-GW
then forms the link with the CSN which provides the internet connection to the users. The CSN
has AAA servers and handles database of authentication, authorization, and accounting services
also it has firewalls to protect the Wimax equipment. The features of Wimax are listed below.
1. It falls under the standard of IEEE 802.16d-2004, 802.16e-2005, 802.16m standard and operates in the 2.3, 2.5, 3.5 GHz and 450 MHz, 700 MHz licensed bands.
2. It has coverage of 10 Km radius with channel bandwidth from 20 to 28 MHz. 3. It can offer the data rate up to 80 Mbps for downlink and 40 Mbps for uplink by using
modern modulation and multiplexing techniques like QAM and QPSK and OFDM. 4. The MIMO (Multiple Input Multiple Output) concept is implemented in Wimax which
improves the communication performance of the whole system.
31 | P a g e
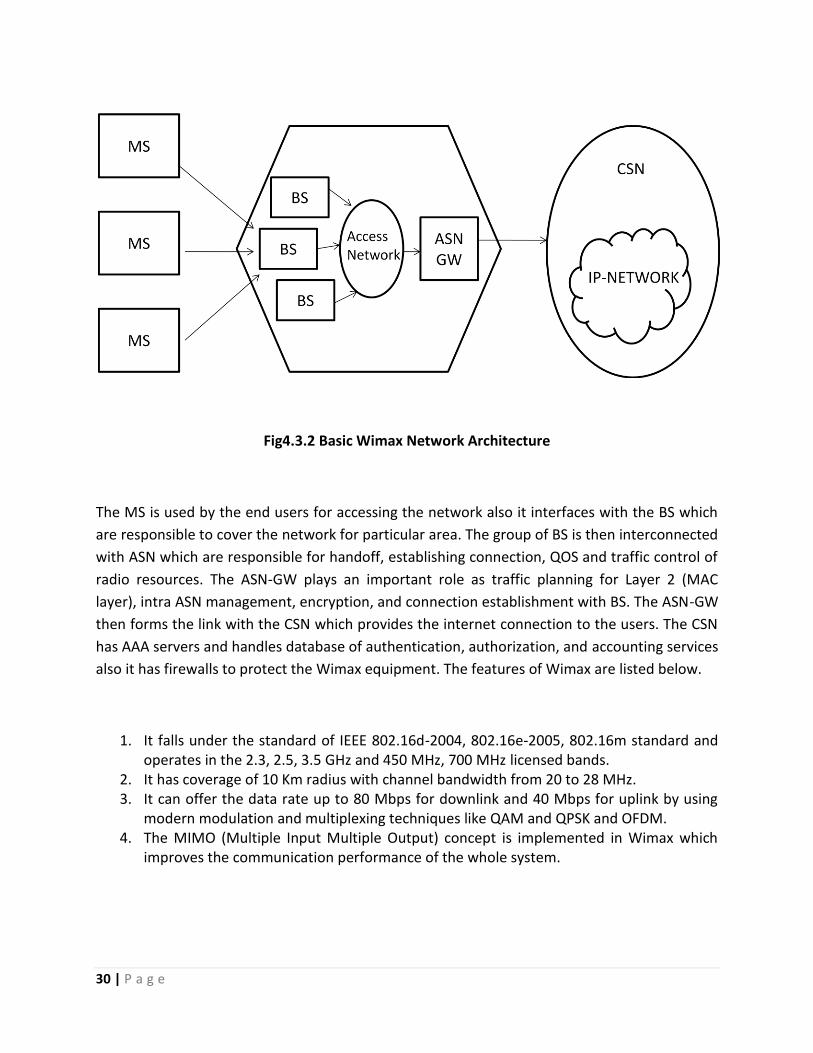
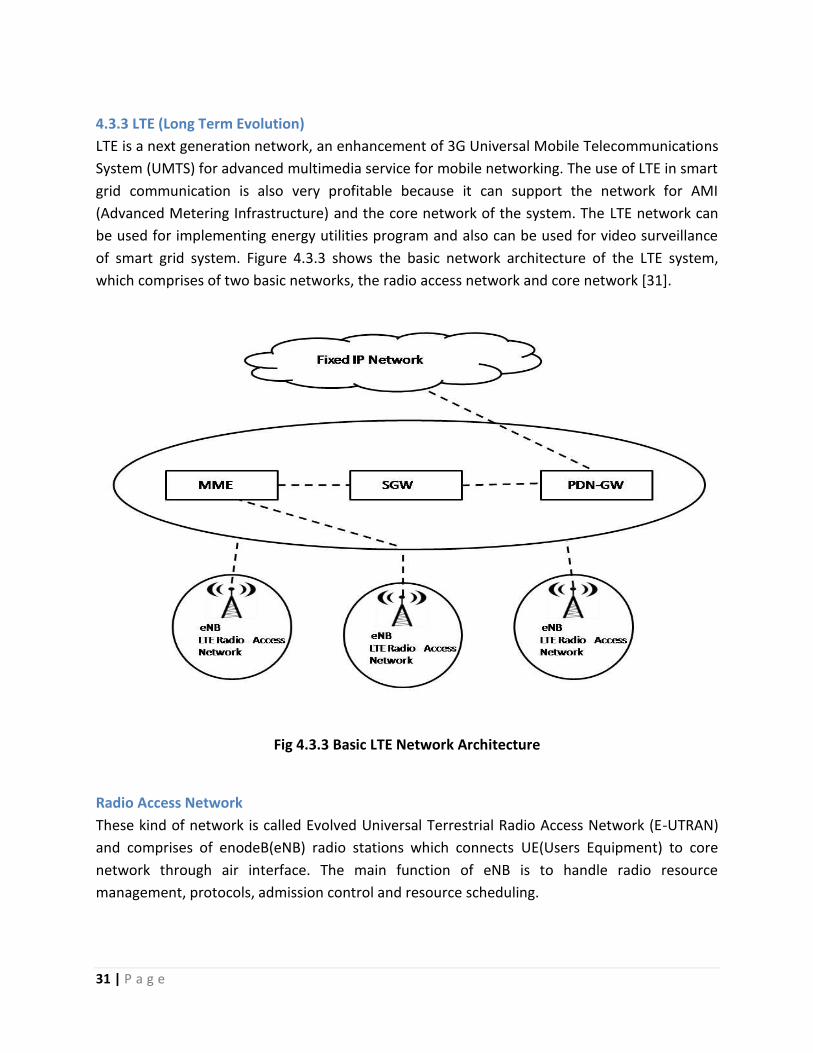
4.3.3 LTE (Long Term Evolution)
LTE is a next generation network, an enhancement of 3G Universal Mobile Telecommunications
System (UMTS) for advanced multimedia service for mobile networking. The use of LTE in smart
grid communication is also very profitable because it can support the network for AMI
(Advanced Metering Infrastructure) and the core network of the system. The LTE network can
be used for implementing energy utilities program and also can be used for video surveillance
of smart grid system. Figure 4.3.3 shows the basic network architecture of the LTE system,
which comprises of two basic networks, the radio access network and core network [31].
Fig 4.3.3 Basic LTE Network Architecture
Radio Access Network
These kind of network is called Evolved Universal Terrestrial Radio Access Network (E-UTRAN)
and comprises of enodeB(eNB) radio stations which connects UE(Users Equipment) to core
network through air interface. The main function of eNB is to handle radio resource
management, protocols, admission control and resource scheduling.

32 | P a g e
Core Network
The core network of LTE uses IP(internet protocol) that’s why it is also referred as EPC(Evolve packet Core). The main components of this network are Mobility Management Entity(MME), Serving Gateway (SGW), Packet Data Network Gateway (PDN-GW).The main function of MME is signaling, UE location update, and session establishment and the role of SGW is to route user data from UE to PDN from Node B's and vice versa. PDN-GW provides the connectivity point between EPC and the external internet service provider. All LTE services provide full mobility for enhanced multimedia services, carrier preferred protocol, low power consumption, with low latency and high capacity, and some of the features of LTE are listed below.
1. It falls under 3GPP Release 9 standard. 2. It has a scalable carrier bandwidth 1,4, 3, 5, 10, 15, and 20 MHz and supports both
FDD (Frequency division duplexing) and TDD (Time division duplexing). 3. The LTE has a coverage area of 3-4 km radius for urban areas, and 7-8 km in rural
areas. 4. It can support data rates up to 100 Mbps for downlink and 50 Mbps for uplink. 5. LTE supports MIMO concept, so there is significant increase in link range without
additional bandwidth and power.
4.3.4 Comparison of PLC with Wireless Communication
Power Line Communication and Wireless Communication are the best feasible network link to
provide deployment of smart grid communication, they are cost effective networks which
minimize additional investment in infrastructure. The comparison between the PLC and
Wireless communication is done in [32] where it outlines the communication characteristics in
terms of different parameters. These are discussed below.
Attenuation
In wireless communication the attenuation depends on environment. The fading of the signal is
more where there is an obstacle between the transmitter and receiver. Whereas, in power line
communication the attenuation depends on the characteristics and length of the cable, the
attenuation also depends on the network of that power line channel. If there are more noisy
loads interconnected in the network, there is more attenuation.
33 | P a g e
Time Dispersion/ Frequency Selectivity
In wireless communication it is basically concerned with reflection, diffraction and scattering of
the signal whereas in power line communication it is governed by reflection of the signal from
the unmatched load.
Time Selectivity/Frequency Dispersion
In wireless communication the time selectivity is due to mobility of transmitter and receiver
whereas in power line communication it depends on impedance connected in network.
Noise
In wireless communication mostly AWGN noise are considered where as in power line
communication the noise structure is more complicated. Generally colored noise, narrowband
noise, periodic impulsive noise, and asynchronous impulsive noise are considered in power line
communication.
34 | P a g e
Chapter 5.
5. Simulations and Results
5.1 Introduction
This chapter presents the results of the simulation performed in MATLAB. The purpose of
simulation is to model the channel by considering the signal power, channel noise, weighting
factor, attenuation parameter and delay parameter. The results can be seen in the form of
channel transfer function and can be compared between different reference channels. The
reference channels taken for simulation is from [33] where there are 4 channels having
different parameters of weighting factor, attenuation parameter and delay parameter. After
obtaining the transfer function for each channel the channel capacity of the channel is
determined; then finally the channel capacity is compared within the same channel by scaling
the propagation path. This shows what changes can be seen in the channel capacity when the
propagation path is increased in length. This simulation shows the changes in channel capacity
when the distance between the specific network is increased.
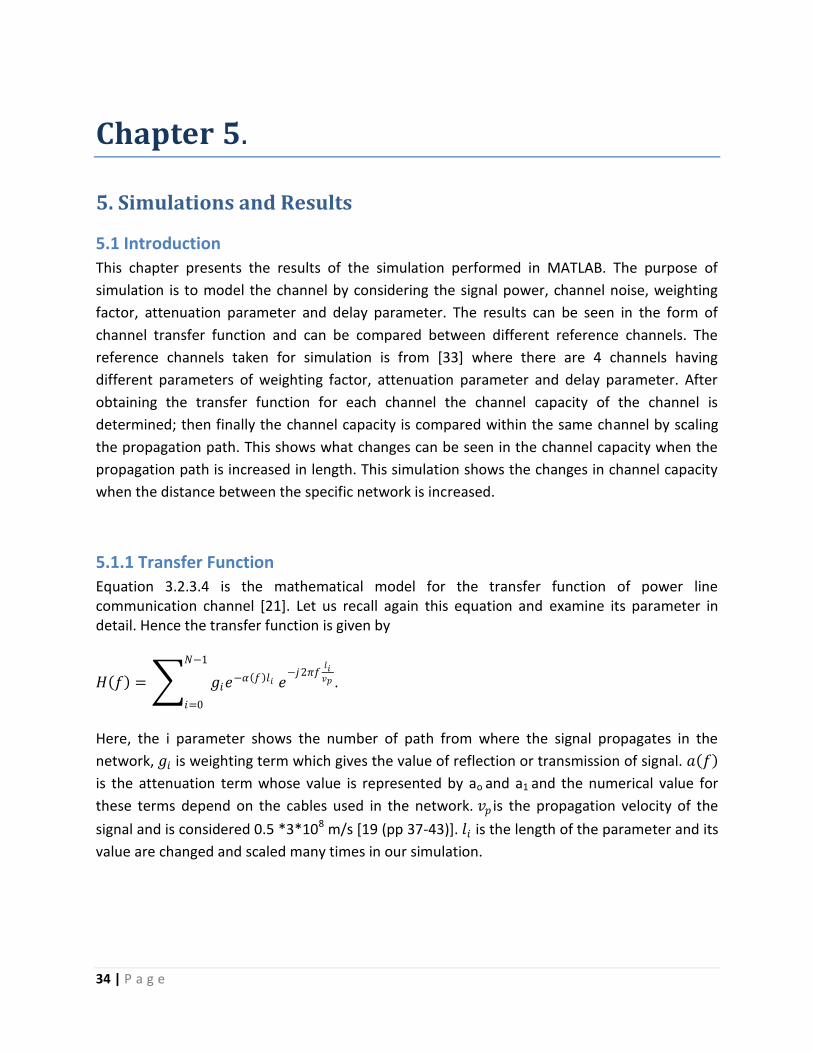
5.1.1 Transfer Function
Equation 3.2.3.4 is the mathematical model for the transfer function of power line communication channel [21]. Let us recall again this equation and examine its parameter in detail. Hence the transfer function is given by
𝐻 𝑓 = 𝑔𝑖𝑒−𝛼 𝑓 𝑙𝑖 𝑒
−𝑗2𝜋𝑓𝑙𝑖𝑣𝑝
𝑁−1
𝑖=0
.
Here, the i parameter shows the number of path from where the signal propagates in the
network, 𝑔𝑖 is weighting term which gives the value of reflection or transmission of signal. 𝑎 𝑓
is the attenuation term whose value is represented by ao and a1 and the numerical value for
these terms depend on the cables used in the network. 𝑣𝑝 is the propagation velocity of the
signal and is considered 0.5 *3*108 m/s [19 (pp 37-43)]. 𝑙𝑖 is the length of the parameter and its
value are changed and scaled many times in our simulation.
35 | P a g e
5.1.2 Channel Capacity
The simulation of channel capacity shows us the total amount of information that can be transferred though any communication channel. The fundamental use of the Shannon–Hartley theorem is applicable to any communication channel and here [34] is used to determine the channel capacity of the channel and it is given by 𝐶 = 𝐵 ∗ 𝑙𝑜𝑔2 (1 + 𝑆𝑁𝑅 ∗ (|𝐻 𝑓(𝑖) |2 ),(5.1) where B is the bandwidth of the signal, SNR is the signal to noise ratio and 𝐻 𝑓 is the channel transfer function.
Reference Channel
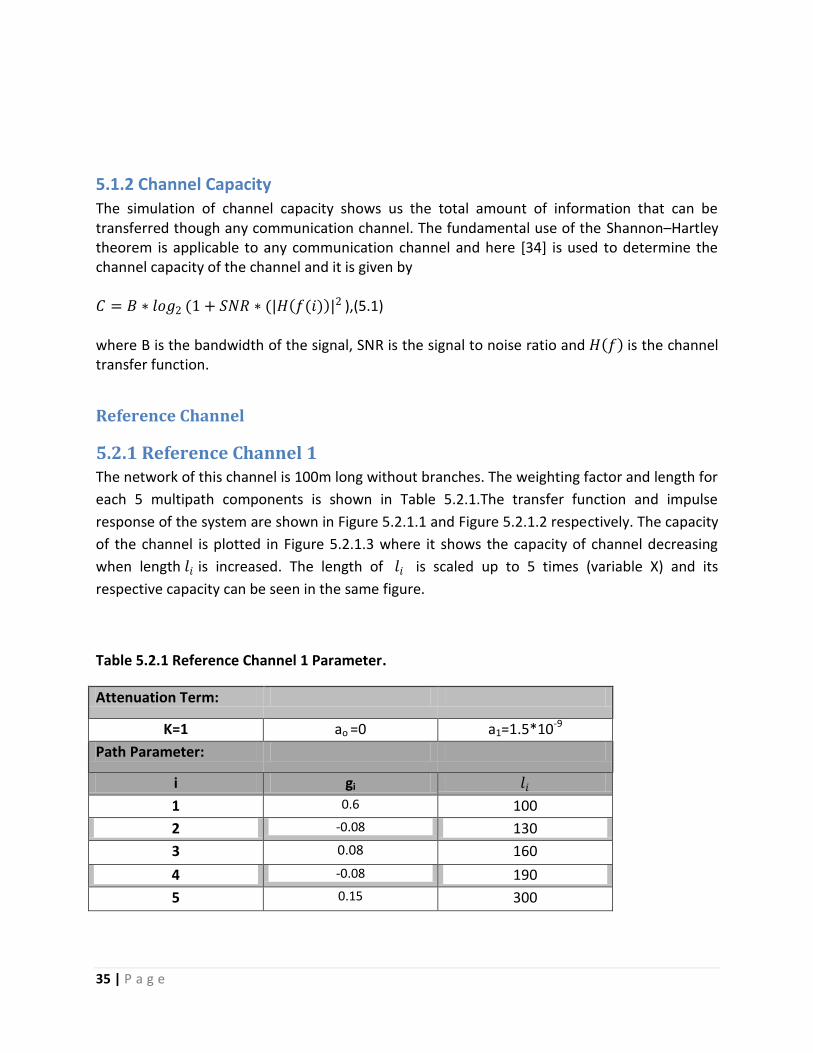
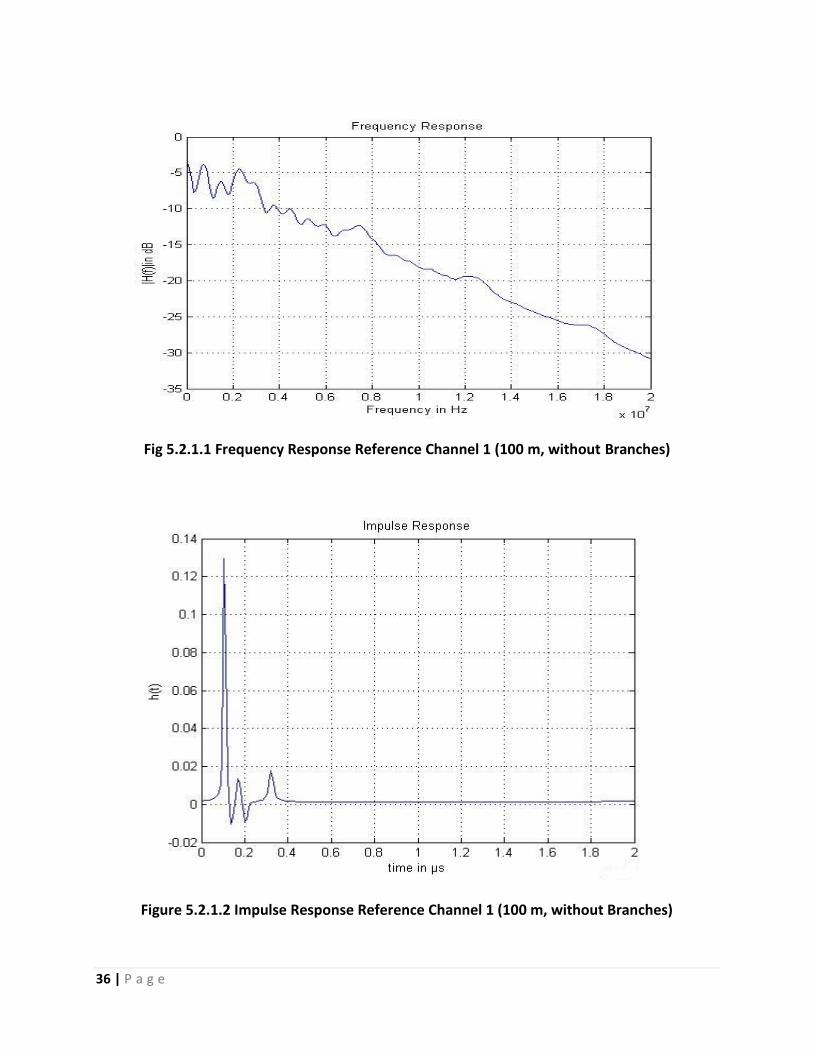
5.2.1 Reference Channel 1 The network of this channel is 100m long without branches. The weighting factor and length for
each 5 multipath components is shown in Table 5.2.1.The transfer function and impulse
response of the system are shown in Figure 5.2.1.1 and Figure 5.2.1.2 respectively. The capacity
of the channel is plotted in Figure 5.2.1.3 where it shows the capacity of channel decreasing
when length 𝑙𝑖 is increased. The length of 𝑙𝑖 is scaled up to 5 times (variable X) and its
respective capacity can be seen in the same figure.
Table 5.2.1 Reference Channel 1 Parameter.
Attenuation Term:
K=1 ao =0 a1=1.5*10-9
Path Parameter:
i gi 𝑙𝑖
1 0.6 100
2 -0.08 130
3 0.08 160
4 -0.08 190
5 0.15 300
36 | P a g e
Fig 5.2.1.1 Frequency Response Reference Channel 1 (100 m, without Branches)
Figure 5.2.1.2 Impulse Response Reference Channel 1 (100 m, without Branches)

37 | P a g e
Figure 5.2.1.3 Channel Capacity Comparison Reference Channel 1 (length Scaled 1-5
times(variable X))
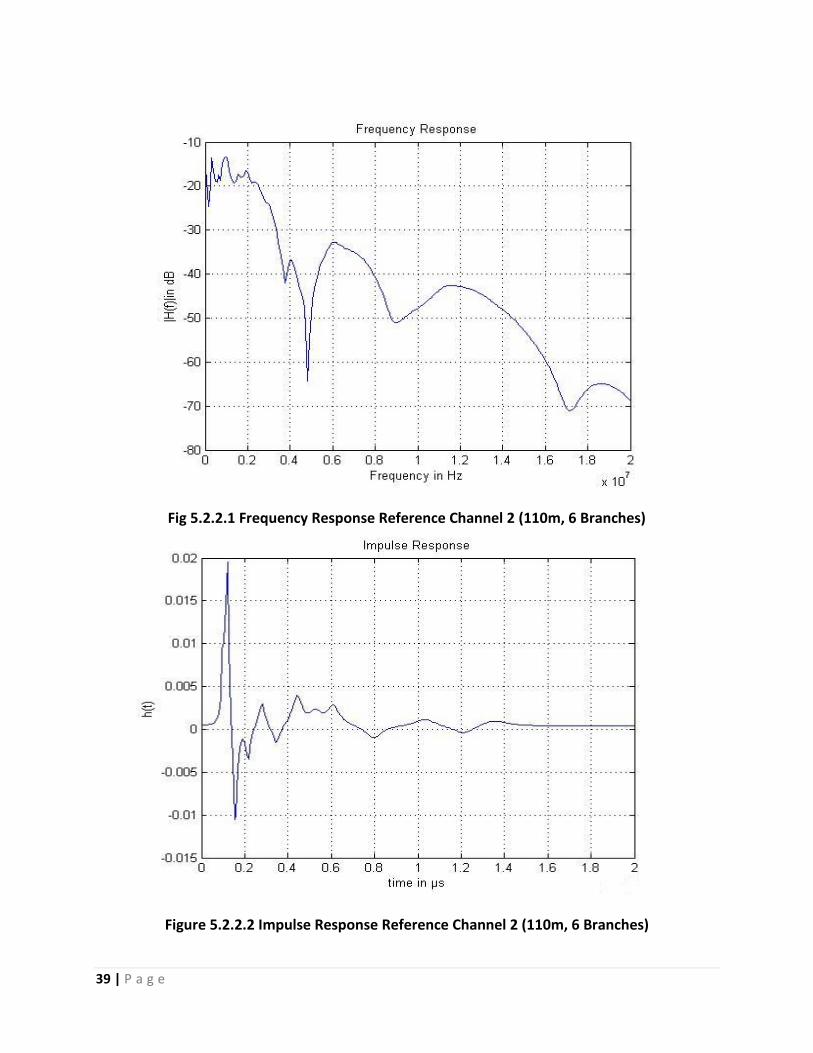
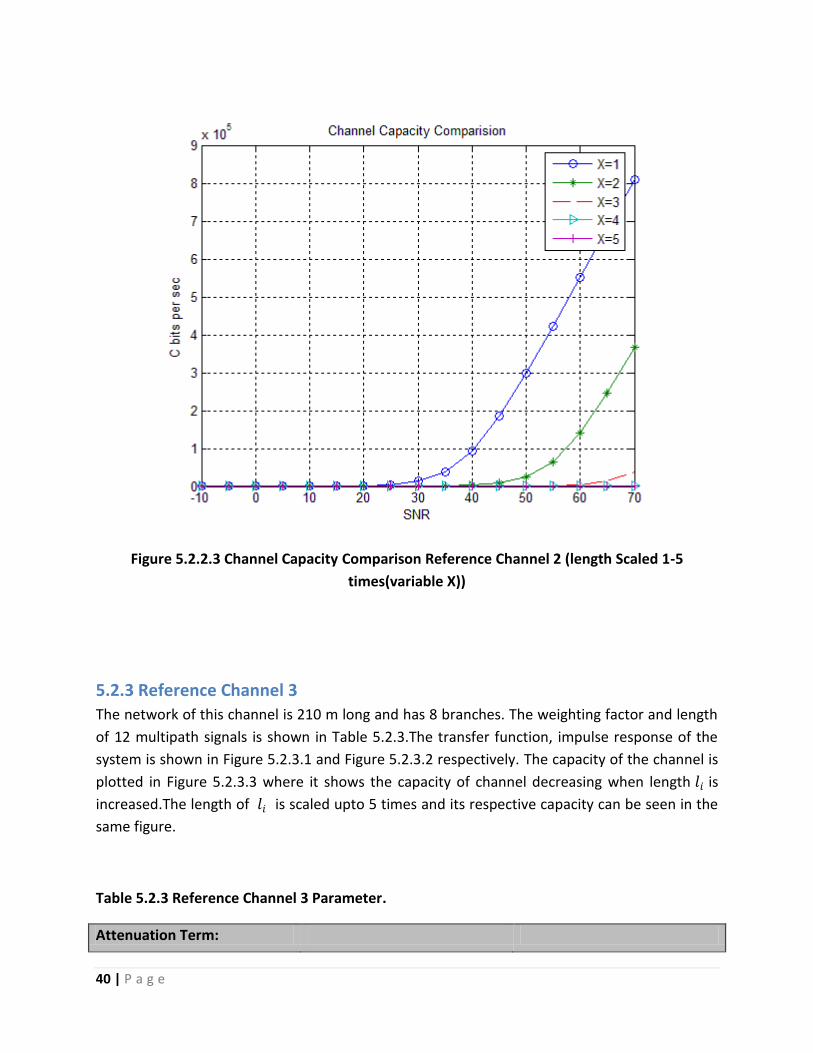
5.2.2 Reference Channel 2
The network of this channel is 110 m long and has 6 branches. The weighting factor and length
of 15 multipath signals is shown in Table 5.2.2.The transfer function and impulse response of
the system is shown in Figure 5.2.2.1 and Figure 5.2.2.2 respectively. The capacity of the
channel is plotted in Figure 5.2.2.3 where it shows the capacity of channel decreasing when
length 𝑙𝑖 is increased. The length of 𝑙𝑖 is scaled upto 5 times and its respective capacity can be
seen in the same figure.

38 | P a g e
Table 5.2.2 Reference Channel 2 Parameter.
Attenuation Term:
K=1 ao =0 a1=2.5*10-9
Path Parameter:
i gi 𝑙𝑖
1 0.103 113.2
2 0.029 90.1
3 0.043 101.8
4 -0.058 143
5 -0.045 148
6 -0.040 200
7 0.038 260
8 -0.038 322
9 0.071 411
10 -0.035 490
11 0.065 567
12 0.055 740
13 0.042 960
14 -0.059 1130
15 0.049 1250
39 | P a g e
Fig 5.2.2.1 Frequency Response Reference Channel 2 (110m, 6 Branches)
Figure 5.2.2.2 Impulse Response Reference Channel 2 (110m, 6 Branches)
40 | P a g e
Figure 5.2.2.3 Channel Capacity Comparison Reference Channel 2 (length Scaled 1-5
times(variable X))
5.2.3 Reference Channel 3
The network of this channel is 210 m long and has 8 branches. The weighting factor and length
of 12 multipath signals is shown in Table 5.2.3.The transfer function, impulse response of the
system is shown in Figure 5.2.3.1 and Figure 5.2.3.2 respectively. The capacity of the channel is
plotted in Figure 5.2.3.3 where it shows the capacity of channel decreasing when length 𝑙𝑖 is
increased.The length of 𝑙𝑖 is scaled upto 5 times and its respective capacity can be seen in the
same figure.
Table 5.2.3 Reference Channel 3 Parameter.
Attenuation Term:

41 | P a g e
K=1 ao =0 a1=2.5*10-9
Path Parameter:
i gi 𝑙𝑖
1 0.17 211.5
2 0.25 228
3 -0.1 243
4 -0.12 254
5 0.33 278
6 -0.37 306
7 0.18 330
8 -0.2 360
9 0.05 390
10 -0.15 420
11 0.15 540
12 -0.15 740
Fig 5.2.3.1 Frequency Response Reference Channel 3 (210 m, 8 Branches)

42 | P a g e
Fig 5.2.3.2 Impulse Response Reference Channel 3 (210 m, 8 Branches)
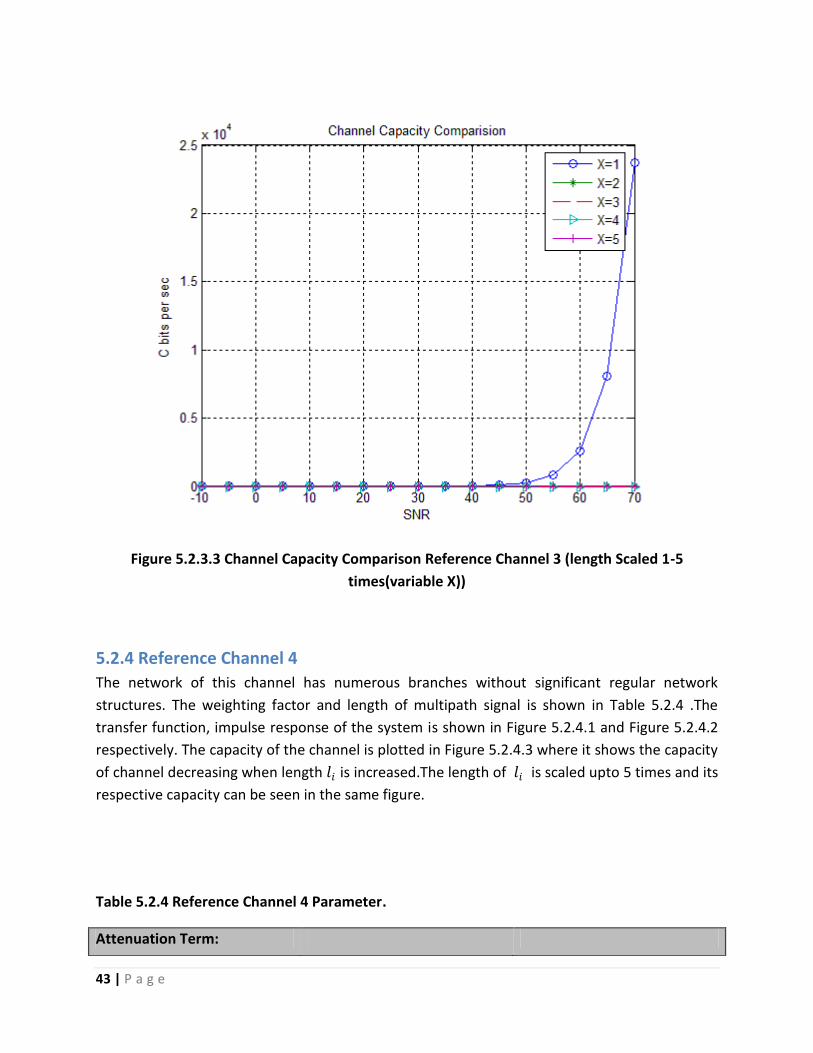
43 | P a g e
Figure 5.2.3.3 Channel Capacity Comparison Reference Channel 3 (length Scaled 1-5
times(variable X))
5.2.4 Reference Channel 4
The network of this channel has numerous branches without significant regular network
structures. The weighting factor and length of multipath signal is shown in Table 5.2.4 .The
transfer function, impulse response of the system is shown in Figure 5.2.4.1 and Figure 5.2.4.2
respectively. The capacity of the channel is plotted in Figure 5.2.4.3 where it shows the capacity
of channel decreasing when length 𝑙𝑖 is increased.The length of 𝑙𝑖 is scaled upto 5 times and its
respective capacity can be seen in the same figure.
Table 5.2.4 Reference Channel 4 Parameter.
Attenuation Term:
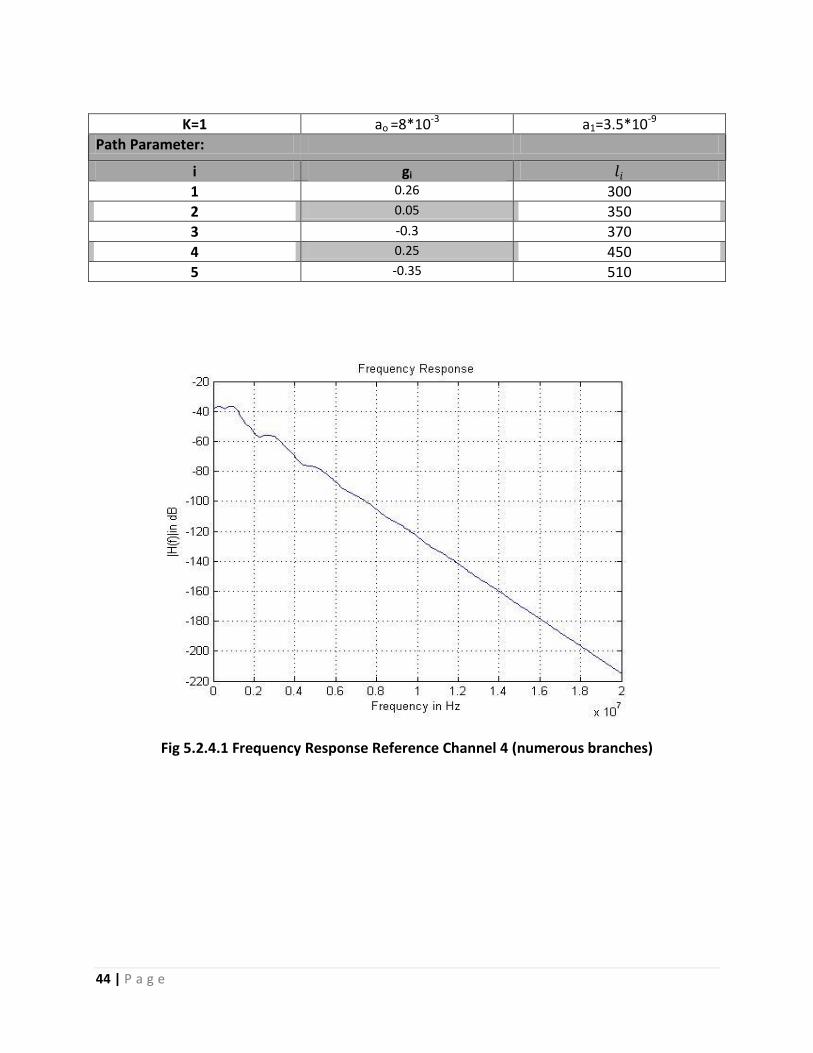
44 | P a g e
K=1 ao =8*10-3 a1=3.5*10-9
Path Parameter:
i gi 𝑙𝑖
1 0.26 300
2 0.05 350
3 -0.3 370
4 0.25 450
5 -0.35 510
Fig 5.2.4.1 Frequency Response Reference Channel 4 (numerous branches)
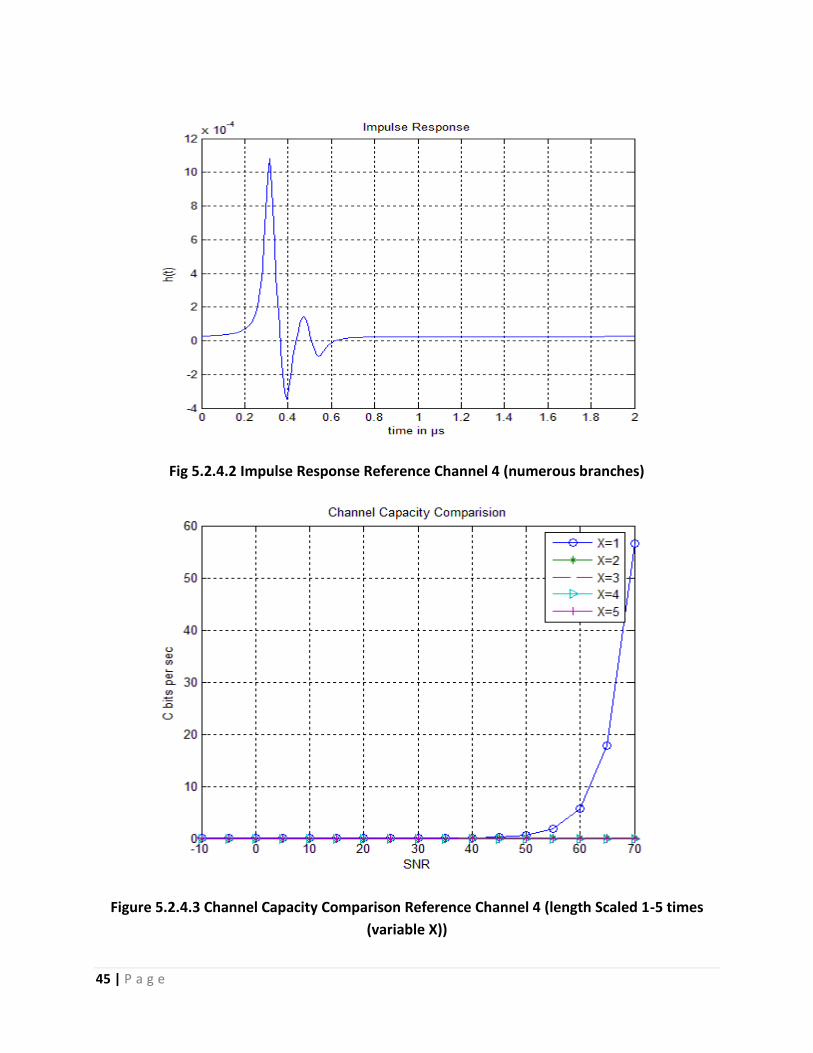
45 | P a g e
Fig 5.2.4.2 Impulse Response Reference Channel 4 (numerous branches)
Figure 5.2.4.3 Channel Capacity Comparison Reference Channel 4 (length Scaled 1-5 times
(variable X))

46 | P a g e
5.3 Conclusion
The results seen in the simulation shows the fading of the signal with the increase of
attenuation parameter and the propagation path. The response of the system in the time
domain in reaction to external change is shown in impulse response figures, the transfer
function is the frequency transform of these impulse responses. The decrement of channel
capacity in the same reference channel proofs the fact that channel capacity of the system is
decreasing when we increase the propagation path length. It is seen in Reference Channel 1,
the maximum channel capacity obtained with SNR 70 dB is 1.50 Mbps, when the length of the
propagation path is scaled to 5 times the channel capacity decreases to 1.10 Mbps, 900 Kbps,
600 Kbps, and 400 Kbps.
If we compare the channel capacity of Reference Channel 1 and Reference Channel 2, the
channel capacity of Channel 2 is very low compared to 1, this is because of the additional
branches and additional multipath propagation of signals in the channel. The maximum channel
capacity in Reference Channel 2 is 800 Kbps, when the length of the propagation path is
increased twice, the channel capacity decreases to 390 Kbps. If we further increase the length
of propagation path to thrice the channel capacity further decreases to 11 Kbps but if the
length propagation path is further increased the communication between these channels is
almost impossible and repeater is needed in this case. Similarly, 25 Kbps is the maximum
channel capacity of reference channel 3 and when the propagation length is increased twice
the communication between these channels is almost impossible. The maximum channel
capacity of reference channel 4 is 55 bps, the channel capacity is considerable in all reference
channels except in reference channel 4.
In all, we can say that the power line communication is a noisy channel and the use of repeaters
is essential, when the attenuation parameter and the distance between the propagation paths
of the network have greater numerical values.

47 | P a g e
Chapter 6
6. Conclusion
No single communication is the best choice of smart grid communication, wired and wireless
communication is both needed for through handling of smart grid application. In which, the
selection of first choice of the communication network moreover depends on the quality of
service (QOS) that it can provide in the given scenario. The choice is concerned with the
security of data, channel capacity, availability of spectrum and geographical background in that
location where the network is established. On the other hand, second choice of communication
network can always be used as a backup system in emergency. The use of both wired and
wireless communication will provide reliability for communication.
The wired communications have more sources of noise than wireless communication, need a
coupling circuit to inject information signal in the power line but it is physically connected to
every electrical network in the electrical grid. Wireless communication on the other hand is
physically not connected the electrical network but it covers good coverage area both in local
and wide area network and provides mobility to smart grid data wirelessly. The bandwidth
efficiency and security of the channel can also be increased by using OFDM in both wired and
wireless communication which provides additional features in a limited frequency band. In all,
the use of both wired and wireless communication is essential for smart grid communication.
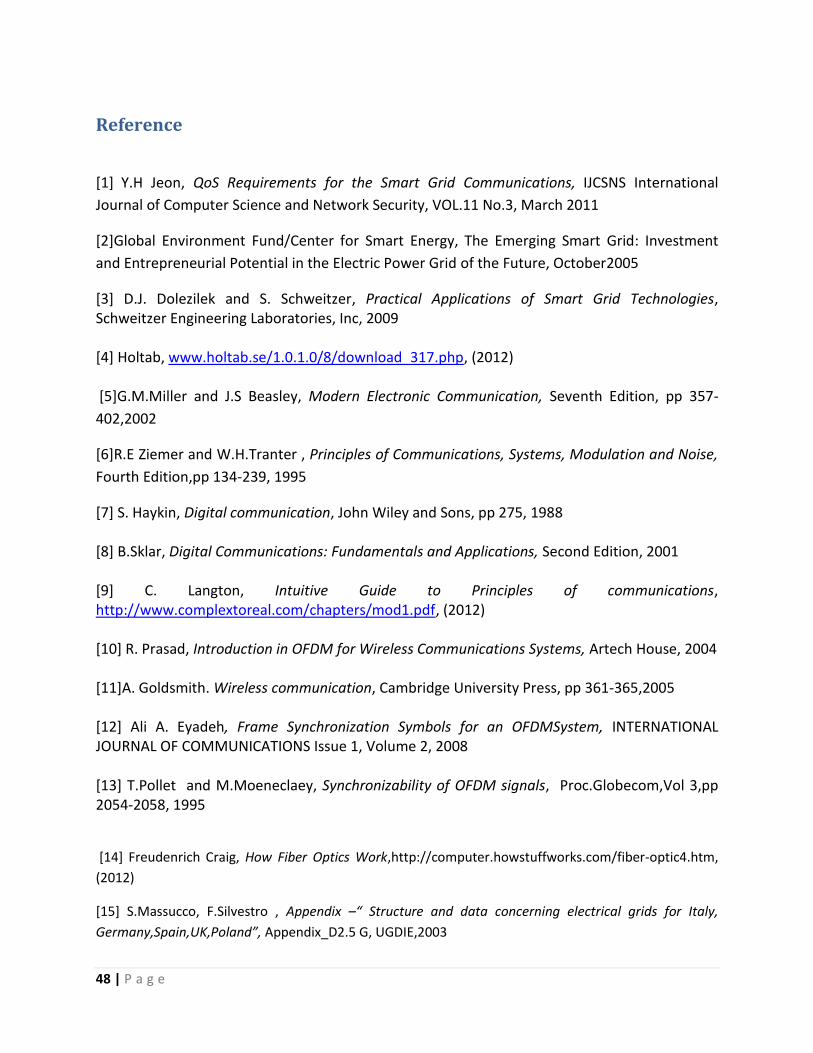
48 | P a g e
Reference
[1] Y.H Jeon, QoS Requirements for the Smart Grid Communications, IJCSNS International
Journal of Computer Science and Network Security, VOL.11 No.3, March 2011
[2]Global Environment Fund/Center for Smart Energy, The Emerging Smart Grid: Investment
and Entrepreneurial Potential in the Electric Power Grid of the Future, October2005
[3] D.J. Dolezilek and S. Schweitzer, Practical Applications of Smart Grid Technologies, Schweitzer Engineering Laboratories, Inc, 2009 [4] Holtab, www.holtab.se/1.0.1.0/8/download_317.php, (2012) [5]G.M.Miller and J.S Beasley, Modern Electronic Communication, Seventh Edition, pp 357-
402,2002
[6]R.E Ziemer and W.H.Tranter , Principles of Communications, Systems, Modulation and Noise,
Fourth Edition,pp 134-239, 1995
[7] S. Haykin, Digital communication, John Wiley and Sons, pp 275, 1988 [8] B.Sklar, Digital Communications: Fundamentals and Applications, Second Edition, 2001 [9] C. Langton, Intuitive Guide to Principles of communications, http://www.complextoreal.com/chapters/mod1.pdf, (2012) [10] R. Prasad, Introduction in OFDM for Wireless Communications Systems, Artech House, 2004 [11]A. Goldsmith. Wireless communication, Cambridge University Press, pp 361-365,2005 [12] Ali A. Eyadeh, Frame Synchronization Symbols for an OFDMSystem, INTERNATIONAL JOURNAL OF COMMUNICATIONS Issue 1, Volume 2, 2008 [13] T.Pollet and M.Moeneclaey, Synchronizability of OFDM signals, Proc.Globecom,Vol 3,pp 2054-2058, 1995
[14] Freudenrich Craig, How Fiber Optics Work,http://computer.howstuffworks.com/fiber-optic4.htm,
(2012)
[15] S.Massucco, F.Silvestro , Appendix –“ Structure and data concerning electrical grids for Italy,
Germany,Spain,UK,Poland”, Appendix_D2.5 G, UGDIE,2003
49 | P a g e
[16] P.A Brown, Power Line Communication – Past Present and Future, NOR.WEB DPL Ltd, Power
Systems Group, (2012)
[17] HC Ferreira, HM Grov´e, 0 Hooijen and AJ Han Vinck, POWER LINE COMMUNICATIONS:An Overview,
Vol-2,pp 558-563,1996
[18] P.Malathi and P.T.Vanathi, Power Line Communication using OFDM and OGA, AIML Journal, Volume
(7), Issue (1), June, 2007
[19] H.C. Ferreira, L.Lampe, J.Newbury, T. G Swart, Power Line Communications: Theory and Applications
for Narrowband and Broadband Communications over Powerline, WILEY,2010
[20] H. Philipps, Modelling of Powerline Communication Channels, pp 14-21, Institute for
Communications Technology Braunschweig Technical University
[21] M.Götz, M.Rapp, and K.Dostert,Power Line Channel Characteristics and Their Effect on
Communication System Design, IEEE Communications Magazine, 2004
[22] M. Zimmermann, K. Dostert, An Analysis of the Broadband Noise Scenario in Powerline Networks,pp 132 -138, Institute of Industrial Information Systems,University of Karlsruhe
[23]O. Bilal, E. Liu, Y. Gao and. T. O. Korhonen, DESIGN OF BROADBAND COUPLING CIRCUITS FOR POWERLINE COMMUNICATION, Communications Laboratory,Helsinki University of Technology
[24]J.C.Haartseen,Ericsson Radio Systems, The Bluetooth Radio System, IEEE Personal
Communications System, pp 28-36,2000
[25] C.Gomez and J. Paradells, Wireless Home Automation Networks: A Survey of Architectures andTechnologies, IEEE Communications Magazine,2010 [26]ZigBee Alliance, ZigBee and Wireless Radio Frequency Coexistence 2007, (2011) [27] P. S. Henry and H.Luo, AT&T Labs — Research, WiFi: What’s Next?, IEEE Communications Magazine,2002 [28] J,S Lee, Y.W.Su, C.C.Shen, A Comparative Study of Wireless Protocols:Bluetooth, UWB, ZigBee, and Wi-Fi, IEEE Industrial Electronics Society (IECON),2007 [29] R. L. Freeman, Fundamental of Telecommunications ,Second Edition, pp 457-465,(2005) (patent) U.S. Patent Application No. 6,269,244 ,Enhanced Cellular Network Architecture,
V.Alperovich,T.Havinis,(2001)
[30] L. Nuaymi, “WiMAX Architecture” in WiMAX Technology for Broadband Wireless Access,
West Sussex, England: John Wiley & Sons, 2007, pp. 208-215

50 | P a g e
[31] P.Beming, L.Frid, G.Hall, P. Malm, T. Noren, M. Olsson and G. Rune, LTE-SAE architecture
and performance,pp 98-104,2007
[32]S. Guzelgoz, Characterizing Wireless and Powerline Communication Channels with Applications to Smart Grid Networks, Theses and Dissertations. Paper 3138, 2011 [33] Patrick.J.Langfeld, The Capacity of typical Powerline Reference Channels and Strategies for
System Design, Institute of Industrial Information Systems, University of Karlsruhe, pp 271-278.
[34]J. Anatory, N.Theethayi, Member, R. Thottappillil, M.M. Kissaka, and N.H. Mvungi, Broadband
Power-Line Communications:The Channel Capacity Analysis, IEEE TRANSACTIONS ON POWER DELIVERY,
VOL. 23, NO. 1, JANUARY 2008