Embed Size (px)
Citation preview

THE CITY OF NEW YORKOFFICE OF THE COMPTROLLER
September 20, 2017
COMMON INVESTMENT MEETINGPublic Session

QUARTERLY PERFORMANCE OVERVIEWQ2 2017

Asset Class IndexSecond
Quarter 2017Fiscal Year To
Date 3 Year 5 Year Expected*
Equities - U.S. Russell 3000 3.0% 18.5% 9.1% 14.6% 7.8%Equities - Developed Intl MSCI EAFE 6.1% 20.3% 1.2% 8.7% 8.9%Equities - Emerging Intl MSCI EMF 6.3% 23.8% 1.1% 4.0% 11.0%Debt - US Govt Long Duration Citigroup Treasury 10+ 4.0% -7.4% 5.7% 2.8%Debt - US Government NYC Treas/Agency +5 2.3% -4.6% 3.6% 2.0% 2.8%Debt - Investment Grade NYC IG Credit 2.3% 1.9% 3.4% 3.7% 3.4%Debt - High Yield Citigroup BB & B 2.1% 11.5% 4.1% 6.2% 6.1%
Market Returns: Q2-2017
Source: State Street
*Average of consultant long-term arithmetic expected returns, as of 2016
3

U.S. Equities FY Ending 6/17
Asset Class Benchmark Index
U.S. Equities 18.5% Russell 3000
Asset Class Benchmark Index
Small Cap 24.6% Russell 2000Mid Cap 18.6% S&P 400Large Cap 18.0% Russell 1000Russell 3000 Value 16.2% Russell 3000 ValueRussell 3000 Growth 20.7% Russell 3000 Growth
Top 2 Sectors 1 Year Return IndexFinancials 41.6% S&P 500Information Technology 38.4% S&P 500
Bottom 2 Sectors 1 Year Return IndexEnergy -1.6% S&P 500Telecommunication Services -10.9% S&P 500
Source: State Street
4

International Equities FY Ending 6/17
Asset Class Benchmark Index
International Equities 20.3% MSCI EAFE
Top 2 Countries 1 Year Return ($) 1 Yr Return (Local Currency) Weight
Austria 64.95% 60.7% 0.24%
Spain 38.39% 34.8% 3.42%
Bottom 2 Countries 1 Year Return ($) 1 Yr Return (Local Currency) Weight
Israel -2.32% -5.97% 0.69%
Belgium 2.08% -0.57% 1.14%
Top 3 Weighted Countries 1 Year Return ($) 1 Yr Return (Local Currency) Weight
Japan 19.18% 30.53% 23.44%
U.K. 13.35% 16.65% 15.76%
France 28.14% 24.82% 10.24%
Source: MSCI
5

Emerging Markets Equities FY Ending 6/17
Asset Class Benchmark Index
Emerging Markets Eq 23.7% MSCI EM
Top 2 Countries 1 Year Return ($) 1 Yr Return (Local Currency) Weight
Greece 50.41% 46.50% 0.39%
Hungary 44.43% 37.75% 0.33%
Bottom 2 Countries 1 Year Return ($) 1 Yr Return (Local Currency) Weight
Philippines -6.18% 0.63% 1.18%
Qatar -2.29% -1.78% 0.67%
Top 3 Weighted Countries 1 Year Return ($) 1 Yr Return (Local Currency) Weight
China 32.19% 32.81% 23.73%
South Korea 34.88% 33.98% 15.61%
Taiwan 32.85% 25.28% 12.48%
Source: MSCI
6

Core Fixed Income FY Ending 6/17
Asset Class Benchmark Index
Core Fixed Income -0.21% Core Plus Five
Government Return Index
Short Duration (1-3 years) -0.09% Citigroup USBIG Treasury 1-3 YearIntermediate Duration (1-10 years) -1.25% Citigroup USBIG Treasury/Agency 1-10 YearLong Duration (10+ years) -7.41% Citigroup Treasury 10+Investment Grade 1.90% NYC - Investment Grade CreditMortgage -0.09% Citigroup Mortgage Index
Source: State Street
7
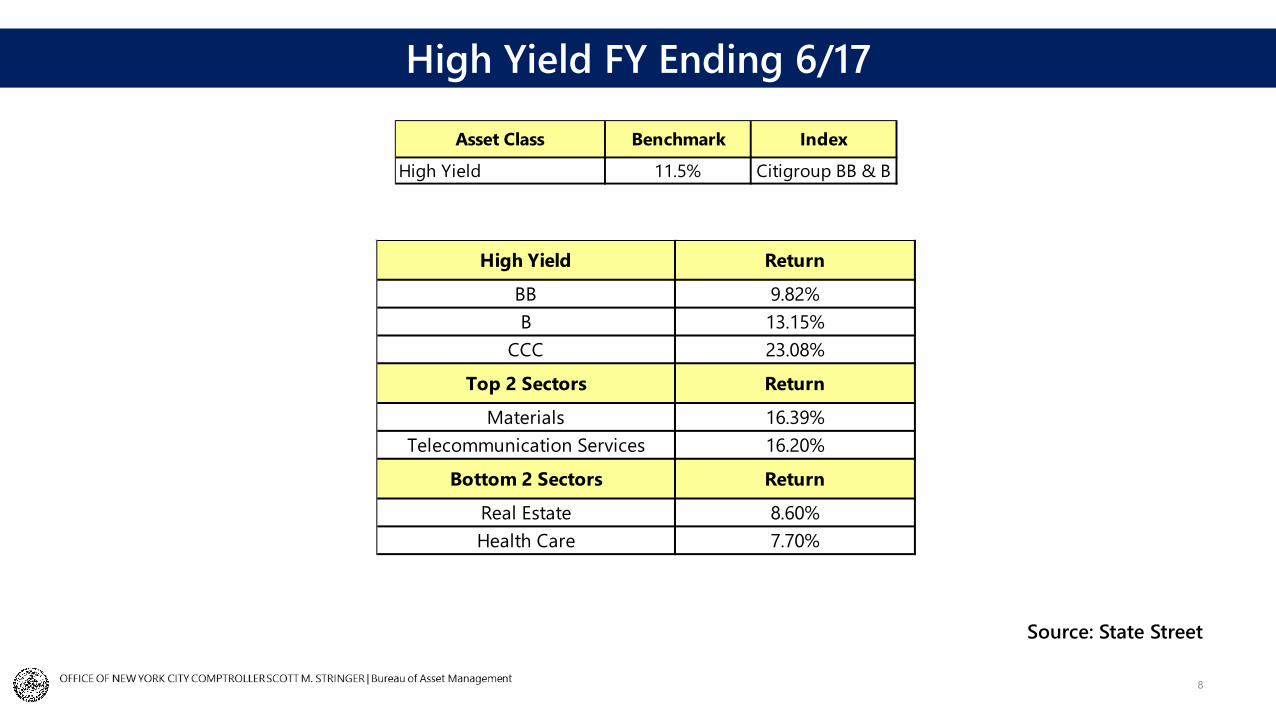
High Yield FY Ending 6/17
Asset Class Benchmark Index
High Yield 11.5% Citigroup BB & B
High Yield Return
BB 9.82%B 13.15%
CCC 23.08%
Top 2 Sectors Return
Materials 16.39%Telecommunication Services 16.20%
Bottom 2 Sectors Return
Real Estate 8.60%Health Care 7.70%
Source: State Street
8

• Domestic– Probability, timing and specifics on US tax and spending policies– Federal Reserve – impact on markets of interest rate increases and Federal Reserve
balance sheet normalization– Change in Fed Chairperson and new Fed governors– US equity market – valuations given stronger earnings with historically high PE ratios
• International– European Central Bank (ECB) – further reduction and end to QE, potential for interest rate
increases– UK-EU separation negotiations– North Korea concerns– China policies post 19th Party Congress in October ‘17– Middle East tensions
Current Global Macro Issues
9

• Change in Global QE– Fed expected to begin balance sheet normalization– ECB expected to further reduce pace of QE purchases in January
2018 and stop completely in 2H 2018• Policy rates remain historically low• U.S. Budget deficit likely to increase both short and long
term
Potential Regime Shift in Interest Rates
10

• US, Europe, UK and Japan government net bond issuance, issuance minus central bank purchases.
Change in Global QE
-1,000
-500
0
500
1,000
1,500
2012 2013 2014 2015 2016 2017e 2018e
US ($ bn) Japan ($ bn) UK ($ bn) Euro ($ bn)
USD, bn
Increase in net issuance
Decrease in net issuance
11

• Fed Funds RealRate at historicallylow level
-Fed Funds rate(yellow) at 1.25%
-ECB policy rate(blue) at -0.4%
-UK policy rate(red) at 0.25%
-BOJ policy rate(green) at -0.1%
Policy Rates Remain Historically Low
Fed Funds Rate Euro Depo Rate UK Base Rate BOJ Policy Rate
Source: Bloomberg 12

• Tax cuts and infrastructurespending will furtherincrease the deficit.
• Increased federal spending(Medicare and socialsecurity outlays) willincrease deficit meaningfullyover time.
U.S. Budget Deficit (% of GDP)
Source: PGIM
13

• Higher yields – impacts valuations of all fixed income securities
• Lower Price-Earnings (PE) multiples – impacts values of domestic and international equities, as well as private equity
• Increased volatility across all asset classes – implications for fixed income, equity, FX and private assets
Market Implications of Rising Interest Rates
14

Net of fees in public asset classes
(SSB P p.23; N, F p.24; T p.24; B p.31)
NYC Pension SystemPortfolio Std
Dev - 1 yr2Q 2017 FY 2017 Three Year
BERS 3.8% 3.6% 15.3% 6.0%TRS 3.7% 3.0% 12.7% 5.6%FIRE 3.4% 3.1% 12.8% 5.7%POLICE 3.3% 3.0% 13.2% 6.0%NYCERS 3.3% 3.0% 13.0% 5.8%Public Mkt Equiv 35 (43/22/35 index) 3.1% 12.0% 5.2%Median Fund - TUCS 3.2% 12.9% 6.0%
15
Total NYC Pension Fund Performance as of 6/30/2017
Source: State Street
PREPARED BY THE OFFICE OF NEW YORK CITY COMPTROLLER SCOTT M. STRINGER | Bureau of Asset Management

16
Asset Allocation Second Quarter 2017 - Growth
Source: State Street
Relative Mix to Adjusted New Policy Weights (SSB F, T, N p.8; P p.10; B p.12)
PREPARED BY THE OFFICE OF NEW YORK CITY COMPTROLLER SCOTT M. STRINGER | Bureau of Asset Management

17
Asset Allocation Second Quarter 2017 – Inflation Protection
Source: State Street
Relative Mix to Adjusted New Policy Weights (SSB F, T, N p.8; P p.10; B p.12)
PREPARED BY THE OFFICE OF NEW YORK CITY COMPTROLLER SCOTT M. STRINGER | Bureau of Asset Management

18
Asset Allocation Second Quarter 2017 - Deflation Protection
Source: State Street
Relative Mix to Adjusted New Policy Weights (SSB F, T, N p.8; P p.10; B p.12)
PREPARED BY THE OFFICE OF NEW YORK CITY COMPTROLLER SCOTT M. STRINGER | Bureau of Asset Management

19
Treasury Duration Actual Vs. Target
10.9
8.3
11.0 10.5
7.6
17.8
10.9
17.8 17.8
10.9
7.066.72
8.04 8.28
5.42
0.0
3.0
6.0
9.0
12.0
15.0
18.0
21.0
6/30/17 Durations Target Durations 3/31/17 DurationsNYCERSTRS POLICE FIRE BERS
Source: State Street
PREPARED BY THE OFFICE OF NEW YORK CITY COMPTROLLER SCOTT M. STRINGER | Bureau of Asset Management

20
Fiscal Year to Date Return – Total Portfolio
-1600
-1400
-1200
-1000
-800
-600
-400
-200
0
200
400
600
800
1000
1200
1400
1600
FYTD Portfolio FYTD Benchmark FYTD Excess
bps
TRS
NYCERS
Police
Fire
BERS
Basis Points of Excess Return (SSB T, P p.12; F p.13; N p.15; B p.19)
Source: State StreetPREPARED BY THE OFFICE OF NEW YORK CITY COMPTROLLER SCOTT M. STRINGER | Bureau of Asset Management
7% AAR

21
Fiscal Year to Date Excess Return – Total Portfolio
-600
-400
-200
0
200
400
600
FYTD Total Excess Return FYTD Asset Allocation FYTD Manager Value Added
bps
TRS
NYCERS
Police
Fire
BERS
Source: State Street
Basis Points of Excess Return (SSB T, P, F p.14; N, p.17; B p.21)
PREPARED BY THE OFFICE OF NEW YORK CITY COMPTROLLER SCOTT M. STRINGER | Bureau of Asset Management

22
Fiscal Year to Date Manager Value Added - Total Portfolio
-600
-400
-200
0
200
400
600
FYTD 3 Year Trailing
TRS
NYCERS
Police
Fire
BERS
bps
Basis Points of Excess Return (SSB T, P, F p.14; N, p.17; B p.21)
Source: State Street
PREPARED BY THE OFFICE OF NEW YORK CITY COMPTROLLER SCOTT M. STRINGER | Bureau of Asset Management

23
Value Added – Total U.S. Equities
-600
-400
-200
0
200
400
600
FYTD 3 Year Trailing
TRS: 30.21%NYCERS: 31.19%POLICE: 34.97%FIRE: 31.92%BERS: 35.48%
Source: State Street
Weights as of6/30/2017
bps
Basis Points of Excess Return (SSB P p.23; N, F p.24; T p.24; B p.31)
PREPARED BY THE OFFICE OF NEW YORK CITY COMPTROLLER SCOTT M. STRINGER | Bureau of Asset Management

24
US Equities FY 2017 Excess in Basis Points
Source: State Street
Mandate Type Manager FY 2017 Excess in Bps:NYCERS TRS Police Fire BERS
Small Core Active Wellington 178 - - - - Mid Cap Active Iridian - 480 466 - Mid Cap Active Wellington 435 434 436 Small Growth Active Brown AM 297 260 260
Small Core Active DFA - - (189) - - Large Core Quant. VTL SP500 (156) - (149) - - Small Core Quant. RAFI (344) - (337) - - Large Core Quant. RAFI (421) - (428) - - Small Value Active Ceredex (1,306) - (1,305) (1,294) - Small Value Active Dalton Greiner (396) (396)
PREPARED BY THE OFFICE OF NEW YORK CITY COMPTROLLER SCOTT M. STRINGER | Bureau of Asset Management

25
Value Added – Total International Equities
-800
-600
-400
-200
0
200
400
600
800
FYTD 3 Year Trailing
TRS: 22.35%NYCERS: 22.02%POLICE: 16.88%FIRE: 16.79%BERS: 23.6%
Source: State Street
Weights as of6/30/2017
bps
Basis Points of Excess Return (SSB P p.25; T, F, p.26; N, p.29; B p.33)
PREPARED BY THE OFFICE OF NEW YORK CITY COMPTROLLER SCOTT M. STRINGER | Bureau of Asset Management

26
Developed Equities FY 2017 Excess in Basis Points
Source: State Street
Mandate Type Manager FY 2017 Excess in Bps:NYCERS TRS Police Fire BERS
EFA Growth Active Baillie Gifford 1,323 1,152 1,476 1,476 1,476 Global Active Generation 1,227 - 1,227 - - EFA Small Core Quant. Acadian 307 572 398 398 398 EFA Growth Active Walter Scott 164 139 142 142 -
EFA Value Active Sprucegrove (80) (175) (136) (136) (133) EFA Small Value Active Pyramis (173) (181) (190) (181) - EFA Value Active Causeway (251) (370) (301) (301) -
PREPARED BY THE OFFICE OF NEW YORK CITY COMPTROLLER SCOTT M. STRINGER | Bureau of Asset Management
27
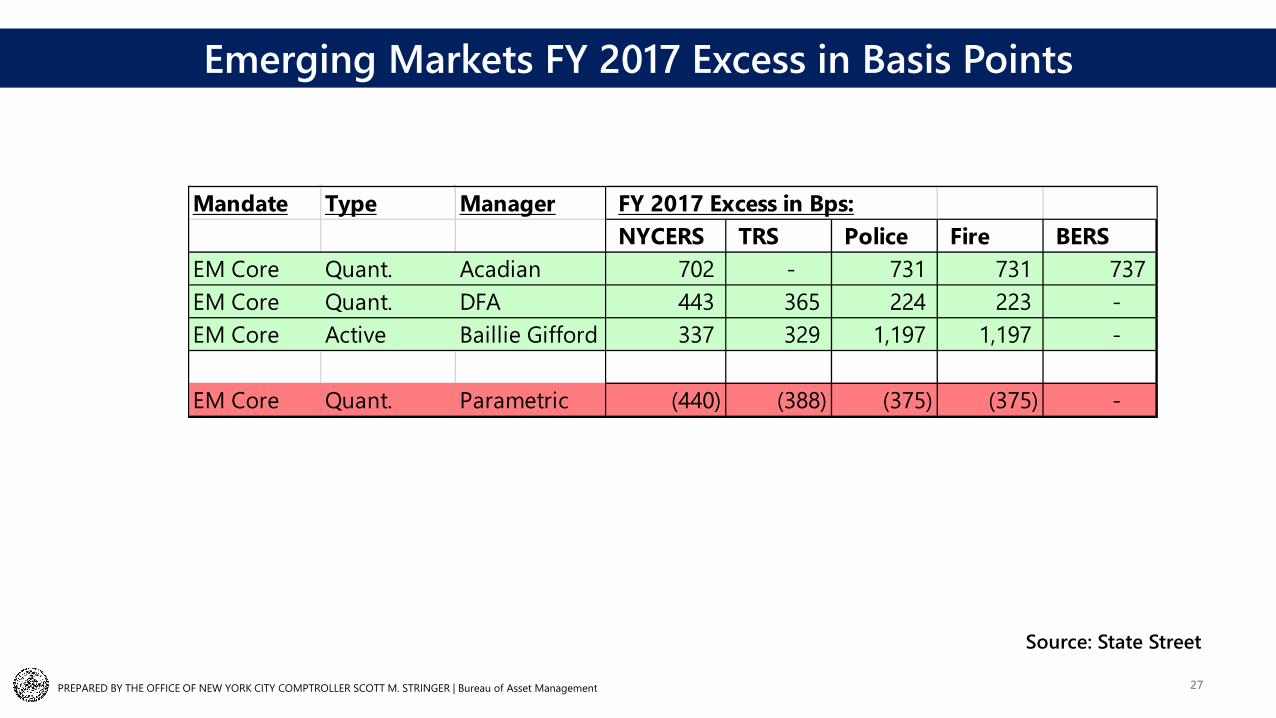
Emerging Markets FY 2017 Excess in Basis Points
Source: State Street
Mandate Type Manager FY 2017 Excess in Bps:NYCERS TRS Police Fire BERS
EM Core Quant. Acadian 702 - 731 731 737 EM Core Quant. DFA 443 365 224 223 - EM Core Active Baillie Gifford 337 329 1,197 1,197 -
EM Core Quant. Parametric (440) (388) (375) (375) -
PREPARED BY THE OFFICE OF NEW YORK CITY COMPTROLLER SCOTT M. STRINGER | Bureau of Asset Management

28
Value Added – Investment Grade
-600
-400
-200
0
200
400
600
FYTD 3 Year Trailing
TRS: 6.01%NYCERS: 5.5%POLICE: 4.86%FIRE: 5.84%BERS: 5.21%
Source: State Street
Weights as of6/30/2017
bps
Basis Points of Excess Return
PREPARED BY THE OFFICE OF NEW YORK CITY COMPTROLLER SCOTT M. STRINGER | Bureau of Asset Management
29
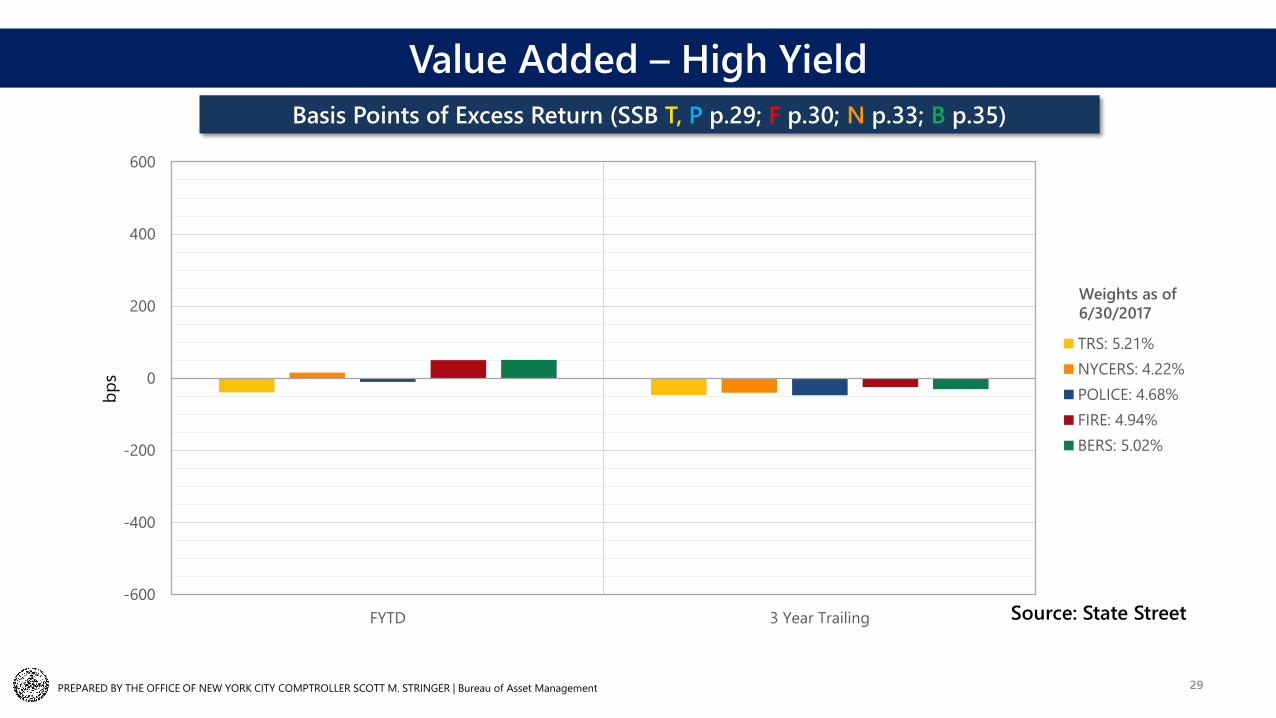
Value Added – High Yield
-600
-400
-200
0
200
400
600
FYTD 3 Year Trailing
TRS: 5.21%NYCERS: 4.22%POLICE: 4.68%FIRE: 4.94%BERS: 5.02%
Source: State Street
Weights as of6/30/2017
bps
Basis Points of Excess Return (SSB T, P p.29; F p.30; N p.33; B p.35)
PREPARED BY THE OFFICE OF NEW YORK CITY COMPTROLLER SCOTT M. STRINGER | Bureau of Asset Management

30
Value Added – Bank Loans
-600
-400
-200
0
200
400
600
FYTD 3 Year Trailing
TRS: 2.53%NYCERS: 1.8%POLICE: 1.62%FIRE: 1.59%BERS: 2.15%
Source: State Street
Weights as of6/30/2017
bps
Basis Points of Excess Return (SSB T p.29; P p.30; F p.31; N p.33; B p.35)
PREPARED BY THE OFFICE OF NEW YORK CITY COMPTROLLER SCOTT M. STRINGER | Bureau of Asset Management

31
Value Added – Economically Targeted Investments
-600
-400
-200
0
200
400
600
FYTD 3 Year Trailing
TRS: 0.87%NYCERS: 1.27%POLICE: 0.98%FIRE: 0.72%BERS: 0.58%
Source: State Street
Weights as of6/30/2017
bps
Basis Points of Excess Return
PREPARED BY THE OFFICE OF NEW YORK CITY COMPTROLLER SCOTT M. STRINGER | Bureau of Asset Management

Value Added- Hedge FundsBasis Points of Excess Return
-600
-400
-200
0
200
400
600
FYTD 3 Year Trailing
TRS: 0%
NYCERS: 0.16%
POLICE: 5.35%
FIRE: 5.41%
BERS: 0%
Source: State Street
Weights as of6/30/2017
32
bps
Value Added - Hedge FundsBasis Points of Excess Return (SSB F p.56; N p.58; P p.60)
PREPARED BY THE OFFICE OF NEW YORK CITY COMPTROLLER SCOTT M. STRINGER | Bureau of Asset Management

PRIVATE MARKET DATA

34
Value Added – Private Equity
(600)
(400)
(200)
-
200
400
600
Excess Return Since Inception; PME Benchmark: Russell 3000 As of 3/31/17
TRS - 07/08/99
NYCERS - 03/29/99
Police - 03/29/99
Fire - 03/29/99
BERS - 07/20/06
Inception Date
300bps Target
Source: StepStone Group & Hamilton Lane
Basis Points of Cumulative IRR above Public Market Equivalent
bps
The PME Spread is the difference between the IRR and the PME Benchmark.
PREPARED BY THE OFFICE OF NEW YORK CITY COMPTROLLER SCOTT M. STRINGER | Bureau of Asset Management

35
Value Added – Opportunistic Fixed Income (OFI)
-600
-400
-200
0
200
400
600
Excess Return Since Inception; PME Benchmark: 50% JP Morgan Global High Yield 50% CS Leveraged Loans as of 6/30/17
TRS - 10/24/2007
NYCERS - 10/24/2007
Police - 10/24/2007
Fire - 10/24/2007
BERS - N/A
Inception Date
300bps Target
Source: State Street
Basis Points of Cumulative IRR above Public Market Equivalent
bps
The PME Spread is the difference between the IRR and the PME Benchmark.
PREPARED BY THE OFFICE OF NEW YORK CITY COMPTROLLER SCOTT M. STRINGER | Bureau of Asset Management

36
Value Added – Private Real Estate - Core
-600
-400
-200
0
200
400
600
Excess Return Since Inception; Core = 40% Equities- Russell 3000 /60% BarcAgg as of 3/31/17
TRS - 12/6/2002
NYCERS - 12/6/2002
Police - 12/6/2002
Fire - 12/6/2002
BERS - 12/13/2010
Inception Date
Source: State Street
Basis Points of Cumulative IRR above Public Market Equivalentbp
s
The PME Spread is the difference between the IRR and the PME Benchmark.
PREPARED BY THE OFFICE OF NEW YORK CITY COMPTROLLER SCOTT M. STRINGER | Bureau of Asset Management

37
Value Added – Private Real Estate – Non-Core
-600
-400
-200
0
200
400
600
Excess Return Since Inception; Non-core = 60% Equities- Russell 3000/40% BarcAgg as of 3/31/17
TRS - 12/6/2002
NYCERS - 12/6/2002
Police - 12/6/2002
Fire - 12/6/2002
BERS - 12/13/2010
Inception Date
Source: State Street
Basis Points of Cumulative IRR above Public Market Equivalentbp
s
The PME Spread is the difference between the IRR and the PME Benchmark.
PREPARED BY THE OFFICE OF NEW YORK CITY COMPTROLLER SCOTT M. STRINGER | Bureau of Asset Management

38
Value Added - Infrastructure
-900
-700
-500
-300
-100
100
300
500
700
900
Excess Return Since Inception; PME Benchmark: 50% R3000 & 50% Barclays Agg. as of 3/31/17
TRS - 11/19/2013
NYCERS - 11/19/2013
Police - 11/19/2013
Fire - 11/19/2013
BERS - 11/19/2013
Inception Date
Source: StepStone Group
Basis Points of Cumulative IRR above Public Market Equivalentbp
s
The PME Spread is the difference between the IRR and the PME Benchmark.
PREPARED BY THE OFFICE OF NEW YORK CITY COMPTROLLER SCOTT M. STRINGER | Bureau of Asset Management

Questions?