Embed Size (px)
Citation preview

Forecasting the conditional volatility of oil spot and futures prices with structural breaks and long memory models
Mohamed El Hedi ArouriLEO, University of Orleans and EDHEC Business School, [email protected]
Amine LahianiLEO, University of Orleans, [email protected]
Duc Khuong NguyenISC Paris School of Management, France, [email protected]
AbstractThis paper investigates whether structural breaks and long memory are relevant features in modeling and forecasting the conditional volatility of oil spot and futures prices using three GARCH-type models, i.e., linear GARCH, GARCH with structural breaks and FIGARCH. By relying on a modified version of Inclan and Tiao (1994)’s iterated cumulative sum of squares (ICSS) algorithm, our results can be summarized as follows. First, we provide evidence of parameter instability in five out of twelve GARCH-based conditional volatility processes for energy prices. Second, long memory is effectively present in all the series considered and a FIGARCH model seems to better fit the data, but the degree of volatility persistence diminishes significantly after adjusting for structural breaks. Finally, the out-of-sample analysis shows that forecasting models accommodating for structural break characteristics of the data often outperform the commonly used short-memory linear volatility models. It is however worth noting that the long memory evidence found in the in-sample period is not strongly supported by the out-of-sample forecasting exercise.
Keywords: oil markets, volatility forecasting, long memory, structural breaks, GARCH, RiskMetricsJEL classifications: C22, C53, F47, G17, Q47, Q43
2
1. Introduction
There is now extensive evidence to suggest that oil price fluctuations influence economic
activity and financial sector (e.g., Jones and Kaul, 1996; Hamilton, 1983; Basher and
Sadorsky, 2006; Driesprong et al., 2008). At the aggregate level, it is generally accepted that
the rise in oil prices leads to reduce economic growth, non-oil industry performance and stock
market activities in almost net oil-importing countries, while some positive effects are found
for oil companies and net oil-exporting countries. Moreover, some recent studies have
consistently documented that oil price changes affect economic activity and stock market
returns in a nonlinear fashion (Ciner, 2001; Maghyereh and Al-Kandari, 2007; Zhang, 2008;
Lardic and Mignon, 2008; Cologni and Manera, 2009). From a sectorial perspective, the
sensitivity to oil price movements differs across different industries depending on the nature
of the sector activity and the capacity of the industry to absorb and transmit the oil risk to its
consumers and other economic sectors (Hammoudeh and Li, 2004; Boyer and Filion, 2007;
Nandha and Faff, 2008).
Understanding oil price volatility is thus of great interest for both investors and
policymakers. One of the main motivations is that the world oil markets have experienced
over the last decades large price variations, and relatively higher price volatility. It is
opportune to recall that after reaching a substantial decline to $19.33 per barrel in December
2001 induced by the world economic downturns as a result of the September 11, 2001
terrorist attack, the West Texas Intermediate (WTI) spot price at Cushing exhibited an upward
trend reaching an unprecedented average level of $133.93 in June 2008. Obviously if oil price
volatility persists, both producers and consumers may expose to substantial risk via the
uncontrolled increases in inventory, transportation and production costs (Pindyck, 2004).
Aggregate output dynamics and corporate earnings can be also severely affected, and
policymakers should consider the volatility impacts of oil price shocks when conducting
3
economic policies. Moreover, to the extent that oil price volatility provides information about
risk levels and how financial asset returns should behave in response to oil shocks, accurately
modeling and forecasting oil price volatility are crucial for financial decisions involving oil
investments and portfolio risk management particularly with regard to the valuation issues of
oil-related products and energy derivative instruments. That is, an investor with efficient oil-
volatility forecast can exploit this information to better manage its portfolio (Kroner et al.,
1995). Finally, some studies suggest crude-oil price volatility is substantially higher than that
of other energy products since the mid-1980s (Plourde and Watkins, 1998; Regnier, 2007).
This motivates future research on the behavior of crude-oil spot and futures price volatility
because of its macroeconomic and microeconomic effects.
In the energy literature, several works have focused on the modeling and forecasting issues
of both crude-oil spot and futures price volatility (e.g., Sadorsky, 2006; Narayan and Narayan,
2007; Kang et al., 2009; Agnolucci, 2009). Of the commonly used volatility models in
financial economics, GARCH-type approach has received a particular interest from almost all
previous papers. For instance, Narayan and Narayan (2007) use an ARCH/GARCH
framework to examine the conditional volatility of crude oil price using daily data for the
period 1991-2006 and find that price shocks have asymmetric and permanent effects on
volatility. Kang et al. (2009) address the forecasting power of different competitive GARCH-
volatility models including the standard GARCH, Fractionally Integrated GARCH
(FIGARCH), Component-GARCH (CGARCH), and Integrated GARCH (IGARCH) for three
crude-oil price benchmarks - WTI (USA), Brent (North Sea) and Dubai (Middle East). They
show that the FIGARCH and CGARCH perform better than GARCH and IGARCH in
modeling and forecasting oil-volatility persistence. Based on different GARCH specifications
allowing for both normal and Student-t distributions of WTI and Brent daily oil returns,
Cheong (2009) finds some evidence of asymmetric effects, heavy-tail innovation impacts and

4
leverage effects1. As far as we know, two studies are concerned by the modeling and
forecasting of the volatility in crude-oil futures using GARCH-family models (Sadorsky,
2006; Agnolucci, 2009). Their main findings indicate that GARCH models outperform a
random walk process and forecasts based on implied volatility. Differently, Fong and See
(2002) employ a Markov regime-switching approach allowing for GARCH-dynamics, and
sudden changes in both mean and variance in order to model the conditional volatility of daily
returns on crude-oil futures prices. They document that the regime-switching model performs
better non-switching models, regardless of evaluation criteria in out-of-sample forecast
analysis.
Albeit they have substantially contributed to the understanding of the behavior of crude-oil
price volatility, it should be noted that previous works often assume a stable structure of
parameters in the oil-return volatility process. This assumption means that the unconditional
variance of crude-oil returns is constant, and leads to ignore the fact that crude-oil markets
can expose to periods of large price changes commonly observed since the liberalization of
these markets in the mid-1980s. Examples of such periods may include the episodes of world
geo-political tensions, Gulf wars, Asian crisis, worries over Iranian nuclear plans, and US and
global recessions. Obviously these shocks can cause breaks in the unconditional variance of
oil price changes and thus the presence of structural breaks in the parameters of the GARCH
dynamics used to model and forecast crude-oil volatility, which ultimately biases both
empirical results and their implications. According to Mikosch and Stărică (2004), and
Hillebrand (2004), neglecting structural breaks in the GARCH parameters induces upward
biases in estimates of the persistence of GARCH-type conditional volatility. Thus, in case of 1 Cheong (2009) employs some variants of GARCH-type models including in particular the GARCH model developed by Bollerslev (1986), the asymmetric power GARCH (APGARCH) model proposed by Ding et al. (1993), the fractionally integrated GARCH (FIGARCH) proposed by Baillie et al. (1996), the FIEGARCH (Bollerslev and Mikkelsen, 1996), and the FIAPARCH (Tse, 1998). The use of all these models aims at capturing the stylized facts of crude-oil conditional volatility, i.e., asymmetry, persistence, leverage and leptokurtic behavior.

5
commodities markets, previous works may overstate the degree of crude-oil volatility
persistence without accounting for the possibility of structural breaks.
For the above reasons, in this paper we extend the existing literature by investigating the
relevance of structural breaks and long memory in modeling and forecasting the conditional
volatility of oil spot and futures prices. At the empirical stage, we build our test for structural
breaks in the conditional volatility of daily oil spot and futures returns on the application of a
modified version of Inclan and Tiao (1994)’s iterated cumulative sum of squares (ICSS)
algorithm that allows for dependent processes. By inspecting the parameters of GARCH
processes which are estimated over different subsamples separated by structural break dates,
we provide clear evidence of parameter instability. In line with previous works (Kang et al.,
2009, and references therein), we find that long memory is significantly present in the data
and a FIGARCH model seems to better describe the behavior of time-varying oil-return
volatility in several cases. More importantly, in the out-of-sample evaluation we show that
forecasting models accommodating for the structural break characteristics of the data
outperform the GARCH(1,1) and RiskMetrics in most of cases. In contrast, the long memory
model outperforms the GARCH and RiskMetrics models only in few cases. At this stage we
are questioning the evidence of long memory shown by the long memory tests and suspecting
a spurious long memory.
As far as it is concerned by the behavior of oil volatility, our paper can be viewed as
widely related to the contribution of Fong and See (2002) in the sense that we also consider
the potential of instability in energy prices, but we are more general by firstly dating the
structural breaks in the series studied, and secondly allowing our GARCH dynamics to
accommodate for any detected breaks and long memory patterns. Further, the performance of
our empirical GARCH with structural breaks and long memory is also compared to that of

6
three commonly used forecasting models in the out-of-sample tests, which is not the case in
Fong and See (2002).
The remainder of the paper is organized as follows. Section 2 describes the empirical
framework that permits to examine the relevance of both structural breaks and long memory
characteristics in the oil price data. Section 3 presents the data used and reports the results
obtained from the empirical analysis. Section 4 concludes and discusses the main implications
of the results.
2. Empirical method
We first compute the daily continuously compounded returns of all spot and futures price
series by taking the difference between the logarithms of two successive prices as follows:
)ln()ln( 1 ttt PP (1)
where tP is the spot or futures price of oil at time t.
Second, as we are interested in modeling and forecasting the unconditional variance of the
returns series, we follow previous works and treat the unconditional and conditional mean of
t as zero (Rapach and Strauss, 2008 and references therein). We consider different
competing models. If there is no break in the unconditional variance, a stable GARCH
process can be used to characterize the conditional volatility of oil prices. However, the
instability of the unconditional variance implies the introduction of structural breaks in the
GARCH process. In line with most previous works of the existing literature on GARCH
models, information criteria select the standard GARCH(1,1) model and we consider the latter
as the benchmark model for comparison purpose.
We then proceed to estimate different specifications of the GARCH(1,1) model, namely
the GARCH with structural breaks (SB-GARCH), the Fractionally Integrated GARCH

7
(FIGARCH), the 0.50 rolling window GARCH, the 0.25 rolling window GARCH, and the
RiskMetrics, and to compare their predictive performance relative to the benchmark model. In
what follows, we briefly present the models we use as well as tests of structural breaks and
long memory.
2.1 Modeling oil price volatility
The standard GARCH(1,1) model developed by Bollerslev (1986) for conditional volatility
is given by:
12
1
1-t )1,0(,
ttt
tttt
hh
NIzzh
(2)
In Equation (2), tz represents the white noise process which follows a normal distribution
with a mean of zero and variance of one. 1tI stands for the information set at time (t-1);
refers to the deterministic term of the conditional volatility equation and is assumed to be
positive. and are referred to as the ARCH and GARCH parameters which must satisfy
the following constraints to preserve the stationarity condition: 0 , 0 and 1 .
Note that 1 implies that an integrated GARCH (IGARCH) specification is more
appropriate for modeling the conditional volatility of the return series considered.
The FIGARCH(1,d,1) model, which nests a GARCH(1,1) model with no persistence in the
volatility process (d = 0) and an IGARCH model with complete persistence (d = 1), takes the
following form:
21 )1)(1()1(1 td
t LLLh (3)
where L is a lag polynomial so that 1 ttL and d is the long memory parameter
measuring directly the long-term persistence of a shock on conditional variance. The main

8
advantage of the FIGARCH model is that it allows a finite persistence of volatility shocks,
i.e., long memory behavior of oil return series and a slow rate of decay after a shock affecting
the volatility.
The SB-GARCH(1,1) model is written as follows:
12
1
1-t )1,0(,
ttst
tttt
hh
NIzzh
(4)
where ksws ,1,0, , refer to deterministic coefficients of (k+1) segments in the conditional
volatility process with k being the optimal number of structural breaks indentified by the ICSS
algorithm. Thus, the unconditional variance, )1( sw , can change from one regime to
another.
The RiskMetrics model based on an expanding window is a restricted version of the simple
GARCH(1,1) model with 0 , 94.0 and 1 . It has advantage of
accommodating for potential structural breaks present in the data, but neglected in the model
specification.
Finally, the 0.50 and the 0.25 rolling window GARCH models are one other than the
standard GARCH(1,1) model estimated using a rolling window with sizes equal to one half
and one quarter of the length of the estimation period respectively.
2.2 Structural break test
Examining whether energy prices and volatilities are subject to structural breaks over time is
of great interest as individual and firms naturally wish to better manage the risks associated
with frequent changes in energy markets (see, e.g., Lee and Lee, 2009; Lee et al., 2010). It is
commonly accepted that variations in the price of oil and other energy assets reflects, in
addition to changes in socio-political and economic instability as well as sudden changes in

9
both world’s energy demand and offer, several typical events such as market regulation, oil
crises, technological changes in the renewable energy sector, and modifications in the storage
and logistic infrastructure of international oil markets (see, e.g., Horsnell and Mabro, 1993;
Charles and Darné, 2009). The observed substantial fluctuations in the oil spot and futures
prices over the last decade, with most of the extreme movements occurred between 2006 and
2008 seem to suggest that oil price, returns, and volatility as measured by squared returns are
usually subject to multiple breaks (see, Figures 1 to 3). Thus, ignoring the potential of
structural instability in the oil-return volatility generating process would result in unreliable
estimates of oil volatility, and in turn lead to inaccurate actions in energy risk management
since oil price serves as underlying benchmark for pricing of many oil-related products and
derivatives. More importantly, recent research shows that the presence of structural breaks or
regime switches can generate “spurious long memory process” in the observed data series
(see, e.g., Granger and Hyung, 2004; Choi and Zivot, 2007; Choi et al., 2010). That is, the
evidence of high oil-price volatility persistence reported in previous studies (see, e.g., Elder
and Serletis, 2008) may be overstated without appropriately taking structural change behavior
into account. For instance, Choi and Hammoudeh (2009) find evidence that the long memory
parameter for all the return series on oil and refined products is lower after adjusting for the
presence of structural breaks.
As in this paper we are interested in testing the null hypothesis of a constant unconditional
variance of the oil return series, modeled by the simple stable GARCH(1,1) model, against
the alternative of structural breaks in the unconditional variance implying structural breaks in
the GARCH process, the adjusted cumulative sum of squares statistics of Inclan and Tiao
(1994) can be used and it is given by:
kka FTICSS 5.0sup

10
where Tkk CTkCF )/(ˆ 5.0 , and kt tkC
1 for k = 1,…,T (total number of
observations. imi
mi ˆ)1(12ˆˆ1
10
, 2211
221 ˆˆˆ t
kt ti T , and
TCT 12ˆ . m is a lag truncation parameter selected using the procedure in Newey and West
(1994). The estimate of the break date is the value of k that maximizes kFT 5.0 . Under
normality assumption of tr , the asymptotic distribution of the ICSSa statistics is given by
)(sup * cWc
, where )1()()(* cWcWcW is a Brownian bridge and )(cW is the standard
Brownian motion.
2.3 Tests of long memory
Long memory is an important empirical feature of any financial variables because its presence
reveals the existence of nonlinear forms of dependence between the first and the second
moments, and thus the potential of time-series predictability. As pointed out by Elder and
Serletis (2008), the evidence of predictability in oil markets would imply the invalidity of
weak-form informational efficiency and offer market operators the possibility to exploit any
deviations of oil prices from their fundamental value in order to consistently earn abnormal
profits.
In this paper we also test for the long memory property of the oil-return data. This is an
essential task permitting the determination of the value for the long memory parameter d in
the FIGARCH model. Concretely, the potential long memory component in the oil returns is
examined by using the Geweke and Porter-Hudak (1983)’s GPH, the Robinson and Hendry

11
(1999)’s Gaussian Semiparametric (GSP), and the Sowell (1992)’s Exact Maximum
Likelihood (EML) test statistics2.
i) GPH estimator
The GPH estimate of the long memory parameter, d, is based on the following periodogram:
jjj ewwI 2/sin4ln)(ln 10
where njTjw j ,...2,1,/2 . je is the residual term. jw represents the Tn Fourier
frequencies and )( jwI denotes the sample periodogram defined as follows:
2
12
1)(
T
t
twtj
jeT
wI
The estimate of d, say GPHd̂ , is 1̂ .
ii) GSP Estimator
Robinson and Hendry (1999) investigate the long memory in a covariance stationary series
by using a semiparametric approach as:
0)( 21 wasGwwf H
where 12
1 H and G0 , )(wf being the spectral density of t . As in the GPH
estimation procedure, we define the periodogram with respect to the observations t ,
Tt ,...,1 such as:
2
12
1)(
T
t
itteT
I
Accordingly, the estimate of the long memory parameter H is given by:
)(minarg21
hRHh
2 Interested readers are invited to see the corresponding papers for more details on the asymptotic properties and sensitivities of the test statistics.

12
where 10 21 ,
m
jj
m
jh
j
j
mh
I
mhR
1121
log1
12)(1
log)(
, 2/,0 nm , and Tjj /2 .
It is important to note that under several assumptions presented in Robinson and Hendry
(1999), the semiparametric estimator of the long memory parameter is consistent and
asymptotically normal.
iii) EML estimator
Sowell (1992) proposes to estimate the long memory parameter d in the ARFIMA(p,d,q)
model using the exact maximum likelihood method according to which the log-likelihood
function is given by:
1
2
1)(ln
2
12ln
2),(log t
TT
L
where is the vector of t , its covariance-variance matrix, and the EML estimator of
the unknown parameter vector is such as:
,maxargˆTL .
2.4 Predictive model selection
In the out-of-sample analysis, volatility forecasts are generated for 1-day, 20-day and 60-day
ahead horizons, which correspond to 1-day, 1-month and 3-month ahead predictions when
daily data are examined. The estimation of the above GARCH volatility models is carried out
using quasi-maximum likelihood. More precisely, each sample of T observations is split in
two parts. The first one is reserved to estimate the model parameters to be used to generate the
forecasts. The second part is left for the out-of-sample comparisons. When using the rolling
forecasts the parameters are updated before each new prediction. These predictions are then
used to select the best model based on out-of-sample forecast error comparison. We assess the
13
predictive accuracy of the forecasts given by the competing models relative to those of the
simple GARCH(1,1) model on the basis of two loss functions3.
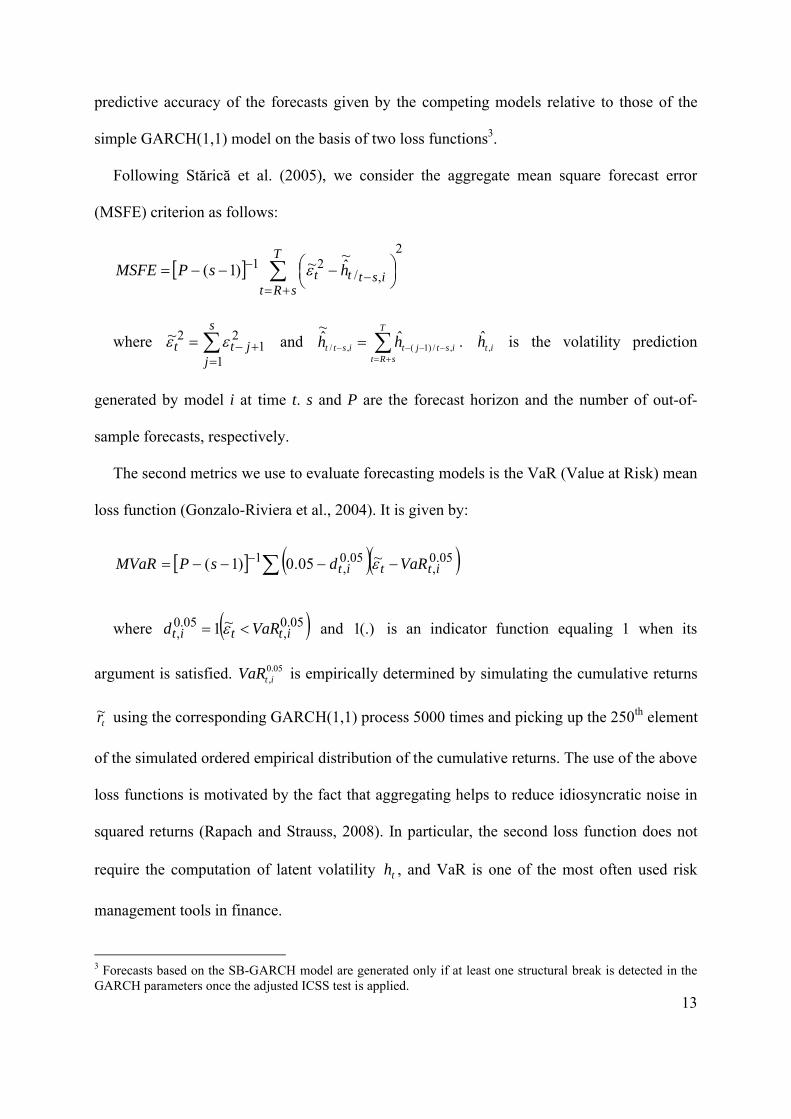
Following Stărică et al. (2005), we consider the aggregate mean square forecast error
(MSFE) criterion as follows:
2
,/21
~ˆ~)1(
T
sRtisttt hsPMSFE
where
s
jjtt
1
21
2~ and
T
sRtistjtistt hh ,/)1(,/
ˆ~ˆ . ith ,
ˆ is the volatility prediction
generated by model i at time t. s and P are the forecast horizon and the number of out-of-
sample forecasts, respectively.
The second metrics we use to evaluate forecasting models is the VaR (Value at Risk) mean
loss function (Gonzalo-Riviera et al., 2004). It is given by:
05.0,
05.0,
1 ~05.0)1( ittit VaRdsPMVaR
where 05.0,
05.0,
~1 ittit VaRd and (.)1 is an indicator function equaling 1 when its
argument is satisfied. 05.0,itVaR is empirically determined by simulating the cumulative returns
tr~ using the corresponding GARCH(1,1) process 5000 times and picking up the 250th element
of the simulated ordered empirical distribution of the cumulative returns. The use of the above
loss functions is motivated by the fact that aggregating helps to reduce idiosyncratic noise in
squared returns (Rapach and Strauss, 2008). In particular, the second loss function does not
require the computation of latent volatility th , and VaR is one of the most often used risk
management tools in finance.
3 Forecasts based on the SB-GARCH model are generated only if at least one structural break is detected in the GARCH parameters once the adjusted ICSS test is applied.

14
3. Data and results
3.1 Data
The data we use in this paper consist of time series of daily spot and futures prices for
maturities of one, two, and three months of WTI crude, gasoline, and heating oil, which are
obtained from Datastream database. All prices are expressed in US dollars and collected over
the period from January 2, 1986 to October 20, 2009. The in-sample period ranges from
January 2, 1986 to December 31, 2008, while the period from January 1, 2009 to October 20,
2009.
Table 1 presents the descriptive statistics for the return series of spot and futures oil prices
as well as their stochastic properties. The results indicate that the daily average return of all
the series, ranging from 0.015% (1-month and 3-month gasoline futures contracts) to 0.042%
(2-month gasoline futures contracts), is positive and almost quite similar. The unconditional
volatility of the return series on the daily basis is substantial as indicated by their standard
deviations with values ranging from 1.965% (3-month gasoline) to 2.719% (spot gasoline).
All the series are negatively skewed, and display significant excess kurtosis, except for 2-
month heating oil and gasoline. These findings suggest that our oil return series have fatter
tails and longer left tail (extreme negative returns) than a normal distribution, which confirms
the results of the Jacque-Bera test for normality, not reported here to conserve spaces.
We plot in Figures from 1 to 3 the synchronous time-paths followed by the different oil
price series, oil returns and oil volatility as measured by squared returns in order to apprehend
their joint dynamics. As it can be observed, we visualize some signs of volatility clustering
(i.e., alternatives between periods of high return instability and periods of stability) and
persistence (i.e., return volatility tends to remain in the same regime for a long time span).
Further, the presence of several sudden changes in the time series may indicate the occurrence
of structural breaks.

15
Figure 1Dynamics of crude oil, gasoline and heating oil spot and futures prices
Figure 2Dynamics of crude oil, gasoline and heating oil spot and futures returns

16
Figure 3Dynamics of crude oil, gasoline and heating oil spot and futures squared returns
We also perform the Ljung-Box and Engle (1982) LM ARCH tests to further analyze the
distributional characteristics of oil return series and report the results in Table 1. These tests
provide clear indication of autocorrelation and ARCH effects in the series considered. In
contrast, the West and Cho (1995) modified Ljung-Box test which is robust to conditional
heteroscedasticity shows that there is significant autocorrelation at conventional levels, except
for heating oil spot returns, 2-month crude-oil returns, 2-month gasoline and heating oil
returns. Overall, the stylized facts of oil returns reported in Table 1 justify our choice of using
GARCH processes to model their conditional volatility.

17
Table 1Descriptive statistics of sample data
SpotCrude
Spot Gasoline
SpotHeating
1mCrude
1mGasoline
1mHeating
2mCrude
2mGasoline
2mHeating
3mCrude
3mGasoline
3mHeating
Mean (%) 0.019 (0.034)
0.024(0.035)
0.028(0.034)
0.018(0.033)
0.015(0.034)
0.016(0.032)
0.019(0.029)
0.042(0.038)
0.360(0.035)
0.020(0.027)
0.015(0.027)
0.019(0.026)
Std. Dev. (%) 2.651(0.069)
2.719(0.051)
2.643(0.077)
2.586(0.067)
2.527(0.060)
2.541(0.072)
2.250(0.063)
2.194(0.045)
2.198(0.036)
2.090(0.052)
1.965(0.044)
2.058(0.046)
Skewness -0.787(0.571)
-0.172(0.278)
-0.988(0.657)
-0.823(0.582)
-0.647(0.393)
-1.424(0.570)
-0.948(0.764)
-0.052(0.191)
-0.193(0.114)
-0.800(0.600)
-0.472(0.435)
-0.742(0.521)
Kurtosis 14.500(7.870)
6.441(2.370)
18.100(8.457)
14.321(8.273)
9.963(3.900)
17.432(7.981)
17.162(12.289)
3.543(0.900)
2.224(0.505)
12.987(8.888)
8.679(5.197)
10.324(7.486)
Minimum (%) -40.640 -30.139 -40.463 -40.047 -30.986 -39.094 -38.407 -15.151 -14.348 -32.820 -26.094 -30.864
Maximum (%) 19.151 23.529 25.392 16.409 19.486 13.994 13.788 14.861 10.297 12.115 14.246 9.387
Modified Ljung-Box
32.312[0.040]
47.090[0.000]
20.451[0.430]
32.794[0.035]
30.060[0.068]
33.848[0.027]
25.372[0.187]
18.996[0.522]
22.221[0.328]
28.650[0.094]
31.587[0.047]
29.654[0.075]
Ljung-Box 680.224[0.000]
1062.00[0.000]
505.089[0.000]
366.465[0.000]
235.812[0.000]
393.536[0.000]
447.031[0.000]
77.412[0.000]
513.755[0.000]
562.712[0.000]
192.156[0.000]
434.421[0.000]
LM ARCH(q=2)
106.430[0.000]
369.112[0.000]
215.955[0.000]
159.163 [0.000]
43.714[0.000]
45.529[0.000]
66.477[0.000]
10.060[0.006]
41.057[0.000]
90.846[0.000]
41.896[0.000]
40.162[0.000]
LM ARCH(q=10)
299.235[0.000]
579.520[0.000]
324.890[0.000]
366.465[0.000]
125.961[0.000]
162.433[0.000]
233.647[0.000]
36.214[0.000]
171.141[0.000]
213.648[0.000]
107.903[0.000]
120.192[0.000]
Notes: This table reports the basic statistics of sample data and their stochastic properties over the period from January 2, 1986 to October 20, 2009. Data contain the spot and futures prices of the West Texas Intermediate crude oil benchmark, Gasoline and Heating oil. For futures prices, we gather data on one-month, two-month and three-month NYMEX futures contracts. Daily returns are computed as the difference between the logarithms of two successive prices. Numbers in parenthesis are the standard deviations. Modified Ljung-Box and Ljung-Box refer to the empirical statistics of modified and Ljung-Box tests for serial correlation with k lags, while LM ARCH refers to the empirical statistics of the Lagrange Multiplier test for conditional heteroscedasticity applied to residuals. The associated probabilities are reported in brackets.

18
3.2 In-sample analysis
We first investigate whether structural breaks are present in the temporal dynamics of the
twelve oil squared return series over the period considered by applying the modified ICSS
algorithm4. The test results regarding the number and the exact dates of breaks, reported in
Table 2, indicate that five out of the twelve series exhibit structural breaks in their
unconditional variance dynamics. Indeed, the ICSS algorithm selects one break for gasoline
spot price, 1-month heating oil futures price, and 2-month gasoline futures price; three breaks
for 1-month gasoline futures price; and four breaks for 2-month heating oil futures price. We
thus observe that structural breaks often occur in the volatility process of gasoline and heating
oil price data, whereas crude oil prices are not exposed to such abrupt behavior. These
indentified breaks are a priori associated with some significant economic events in the world
oil markets as shown in Table 2.
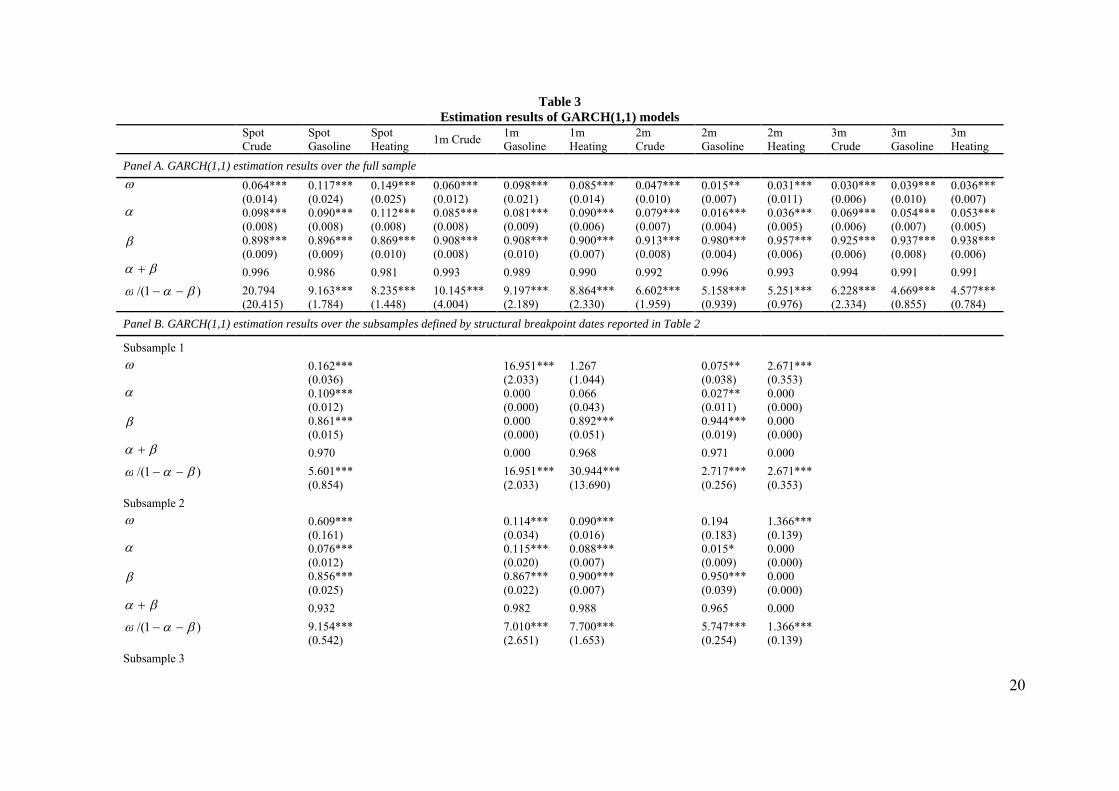
We then proceed to estimate the conditional volatility of the twelve oil squared return
series considered using a standard GARCH(1,1) model both over the full sample period and
subsample periods defined by the previously identified structural break dates. The obtained
results for GARCH parameters are fully reported in Table 3. A careful inspection of the Panel
A indicates that GARCH(1,1) model successfully captures the time-varying patterns of
conditional volatility well-documented in the finance literature, since the estimates are all
significant at the conventional levels. It is shown in particular that conditional volatility of all
the oil returns are quite persistent over time in view of the sum )( which ranges from
0.981 for heating oil spot returns to 0.996 for crude oil spot returns and 2-month gasoline
returns. This finding implies that periods of high volatility tend to be followed by those of
high volatility, and periods of low volatility by those of low volatility. It is also indicative of
the presence of a long memory component in the volatility dynamics.
4 Very similar results were obtained using absolute returns.

19
Table 2Structural break tests
Oil return series Number of breaks Breakpoint dates Main corresponding events
Spot Crude 0
Spot Gasoline 1 04/03/1997 Asian economic and financial crisis
Spot Heating 0
1m Crude 0
1m Gasoline 308/04/198608/11/199308/13/1997
First Gulf war between Iran and IraqOPEC overproduction and weak demand
Asian economic and financial crisis
1m Heating 1 07/28/1986 First Gulf war between Iran and Iraq
2m Crude 0
2m Gasoline 1 11/27/1997 Asian economic and financial crisis
2m Heating 4
11/21/199412/12/199502/19/200808/18/2008
Oil workers’ strike in NigeriaLatin American crisis
Subprime and international financial crisisSubprime and international financial crisis
3m Crude 0
3m Gasoline 0
3m Heating 0
Notes: this table reports the results of the structural break tests based on the application of the modified ICSS algorithm to the twelve returns series on oil spot and futures prices for the period from January 2, 1986 to December 31, 2008.
By comparing the estimation results in Panel B to those in Panel A, one should note at least
the two following stylized facts for the series exposed to structural breaks. First, both the size
and significance of the estimated parameters are not stable over time and display significant
differences across subsamples. These differences can be merely learnt from the changes in the
unconditional variance measure )1/( s and signify that conditional volatility of
interested series is effectively characterized by different dynamic processes depending on
subsample periods. In particular, there is evidence to suggest that several subsamples are
characterized by conditional homoscedasticity in variance because the estimates of both
and are equal to zero: first subsample of 1-month gasoline, as well as the first, second,
fourth and fifth subsamples of the second subsample of 2-month heating oil.
20
Table 3Estimation results of GARCH(1,1) models
Spot Crude
Spot Gasoline
Spot Heating
1m Crude1m Gasoline
1m Heating
2m Crude
2m Gasoline
2m Heating
3m Crude
3m Gasoline
3m Heating
Panel A. GARCH(1,1) estimation results over the full sample
0.064***(0.014)
0.117***(0.024)
0.149***(0.025)
0.060***(0.012)
0.098***(0.021)
0.085***(0.014)
0.047***(0.010)
0.015**(0.007)
0.031***(0.011)
0.030***(0.006)
0.039***(0.010)
0.036***(0.007)
0.098***(0.008)
0.090***(0.008)
0.112***(0.008)
0.085***(0.008)
0.081***(0.009)
0.090***(0.006)
0.079***(0.007)
0.016***(0.004)
0.036***(0.005)
0.069***(0.006)
0.054***(0.007)
0.053***(0.005)
0.898***(0.009)
0.896***(0.009)
0.869***(0.010)
0.908***(0.008)
0.908***(0.010)
0.900***(0.007)
0.913***(0.008)
0.980***(0.004)
0.957***(0.006)
0.925***(0.006)
0.937***(0.008)
0.938***(0.006)
0.996 0.986 0.981 0.993 0.989 0.990 0.992 0.996 0.993 0.994 0.991 0.991
)1/( 20.794(20.415)
9.163***(1.784)
8.235***(1.448)
10.145***(4.004)
9.197***(2.189)
8.864***(2.330)
6.602***(1.959)
5.158***(0.939)
5.251***(0.976)
6.228***(2.334)
4.669***(0.855)
4.577***(0.784)
Panel B. GARCH(1,1) estimation results over the subsamples defined by structural breakpoint dates reported in Table 2
Subsample 1
0.162***(0.036)
16.951***(2.033)
1.267(1.044)
0.075**(0.038)
2.671***(0.353)
0.109***(0.012)
0.000(0.000)
0.066(0.043)
0.027**(0.011)
0.000(0.000)
0.861***(0.015)
0.000(0.000)
0.892***(0.051)
0.944***(0.019)
0.000(0.000)
0.970 0.000 0.968 0.971 0.000
)1/( 5.601***(0.854)
16.951***(2.033)
30.944***(13.690)
2.717***(0.256)
2.671***(0.353)
Subsample 2
0.609***(0.161)
0.114***(0.034)
0.090***(0.016)
0.194(0.183)
1.366***(0.139)
0.076***(0.012)
0.115***(0.020)
0.088***(0.007)
0.015*(0.009)
0.000(0.000)
0.856***(0.025)
0.867***(0.022)
0.900***(0.007)
0.950***(0.039)
0.000(0.000)
0.932 0.982 0.988 0.965 0.000
)1/( 9.154***(0.542)
7.010***(2.651)
7.700***(1.653)
5.747***(0.254)
1.366***(0.139)
Subsample 3

21
0.721*(0.345)
0.104**(0.042)
0.081***(0.031)
0.037***(0.008)
0.733***(0.107)
0.940***(0.015)
0.814 0.977
)1/( 3.879***(0.255)
4.823***(0.350)
Subsample 4
1.153***(0.507)
16.417***(1.834)
0.060***(0.021)
0.000(0.000)
0.791***(0.080)
0.000(0.000)
0.851 0.000
)1/( 7.795***(0.344)
16.417***(1.834)
Subsample 5
5.751***(0.752)
0.000(0.000)
0.000(0.000)
0.000
)1/( 5.751***(0.752)
Notes: this table reports the estimation results of GARCH(1,1) models for all the squared return series we study over the full sample as well as those of GARCH(1,1) models over different subsamples defined by the structural breakpoints. Standard deviations are in parenthesis. *, ** and *** denote significance at the 10%, 5% and 1% respectively.

22
Second, it is observed that none of the sum )( has the value above the lowest degree
of persistence we find in Panel A (i.e., 0.981 for heating oil spot returns), which clearly
evidences that GARCH estimates without controlling for structural change issues overstate
the persistence degree in the conditional volatility. However, the volatility persistence still
remains high across subsamples, apart some regimes where 0)( . According to these
signs of long memory, shocks to conditional volatility tend to disappear at a hyperbolic rate
which is slower than the exponential rate of decay of shocks in the GARCH model setting
(Baillie, 1996).
Before moving to the out-of-sample forecast evaluation, it is convenient to further examine
the long memory property in the volatility of oil return series. In the literature, some studies
have analyzed the persistence of long memory in crude oil and refined products markets
(Tabak and Cajueiro, 2007; Choi and Hammoudeh, 2009; Kang et al., 2009) using
econometric techniques such as modified R/S statistics, and GARCH-type models suitable for
capturing long memory. Following these studies, we also perform several long memory tests.
Table 4Diagnostic tests for long memory
Spot Crude
Spot Gasoline
Spot Heating
1m Crude
1m Gasoline
1m Heating
2m Crude
2m Gasoline
2m Heating
3m Crude
3m Gasoline
3m Heating
GPH 0.112(0.000)
0.174(0.000)
0.145(0.000)
0.131(0.000)
0.127(0.000)
0.112(0.000)
0.089(0.000)
0.057(0.001)
0.082(0.000)
0.082(0.000)
0.088(0.000)
0.070(0.000)
GSP 0.134(0.000)
0.184(0.000)
(0.142)(0.000)
0.143(0.000)
0.126(0.000)
0.106(0.000)
0.117(0.000)
0.097(0.000)
(0.100)(0.000)
0.129(0.000)
0.125(0.000)
0.112(0.000)
EML 0.122(0.000)
0.194(0.000)
0.155(0.000)
0.140(0.000)
0.093(0 .000)
0.092(0.000)
0.107(0.000)
0.064(0.000)
0.102(0.000)
0.115(0.000)
0.093(0.000)
0.090(0.000)
Notes: this table reports the results from three long memory tests applied to squared return series: GPH, GSP and EML. The p-values are given in parenthesis.
Table 4 provides the results of three long memory tests applied to squared oil return series
(GPH, GSP, and EML). Obviously, these tests show that all the oil spot and futures squared
returns exhibit strong evidence of long memory patterns as the null hypothesis of no
persistence is always rejected at the 1% level. This implies that oil price volatility would tend
to be range-dependent, persist and decay slowly. As suggested by Baillie (1996), a FIGARCH

23
model seems to be better equipped to reproduce the volatility persistence of the oil return
series under consideration. We then fit a FIGARCH(1,d,1) to the twelve oil returns series and
report the results in Table 5. All the estimates of the long memory parameters, d, are
statistically significant at the 1% level, and they are also very different from unity, which thus
confirm effectively the findings of the long memory tests on squared returns. It is also worth
noting that the conditional volatility of crude oil spot and futures returns have generally
stronger long memory than gasoline and heating oil. Without loss of generality, these results
have important implications for derivatives trading relying on the persistence of oil price
tendencies (increasing or decreasing).
Table 5Estimates of FIGARCH(1,d,1) model for daily oil spot and futures return volatility
Spot Crude
Spot Gasoline
Spot Heating
1m Crude
1m Gasoline
1m Heating
2m Crude
2m Gasoline
2m Heating
3m Crude
3m Gasoline
3m Heating
0.198***(0.038)
0.256***(0.060)
0.216***(0.044)
0.140***(0.025)
0.307***(0.068)
28.210***(7.373)
0.123***(0.024)
0.461***(0.104)
0.309***(0.092)
0.126***(0.027)
0.135***(0.031)
0.128***(0.033)
0.133***(0.037)
0.182***(0.037)
0.120***(0.035)
0.149***(0.037)
0.213***(0.053)
-0.447***(0.066)
0.099***(0.031)
0.377***(0.018)
0.200***(0.053)
0.096***(0.042)
0.222***(0.040)
0.234***(0.037)
0.617***(0.056)
0.552***(0.061)
0.649***(0.075)
0.723***(0.046)
0.536***(0.067)
-0.663***(0.051)
0.572***(0.025)
0.511***(0.072)
0.594***(0.061)
0.631***(0.054)
0.622***(0.059)
d 0.620***(0.053)
0.463***(0.054)
0.649***(0.087)
0.700***(0.074)
0.449***(0.050)
0.609***(0.044)
0.632***(0.060)
0.245***(0.036)
0.329***(0.042)
0.578***(0.054)
0.470***(0.055)
0.448***(0.053)
Notes: this table reports the results of the QML (quasi-maximum likelihood) estimation of FIGARCH model for daily oil return series. , )( , and d refer to the long-term unconditional variance, the measure of volatility persistence and the long memory parameter. Robust standard errors are given in parenthesis. *, ** and *** denote significance at the 10%, 5% and 1% respectively.
Summarizing all, our in-sample analysis shows that structural breaks are indeed present in
the dynamics of several oil price volatility series. The variation in the standard GARCH(1,1)
estimates across different subsamples separated by the breakpoint dates identified by the ICSS
further suggests that structural breaks are a relevant empirical feature of the volatility of
several oil-return series and accounting for them in ex-post volatility estimation permits to
avoid spurious persistence level. Finally, long memory also appears to be an important
property characterizing the volatility process of oil returns as indicated by the results of the
FIGARCH estimates.

24
3.3 Out-of-sample analysis and forecasting performance
This subsection examines the forecasting performance of five competing models for oil spot
and futures return volatility: RiskMetrtics, GARCH 0.5 rolling window, GARCH 0.25 rolling
window, FIGARCH and SB-GARCH. The predictive performance of these competing models
is compared to the most used volatility model: the GARCH(1,1) expanding window model
which is a standard GARCH(1,1) model estimated on an expanding window as compared to
the in-sample period. To evaluate and compare the out-of-sample forecasting performance
across models, we consider our two loss functions: the mean square forecast error (MSFE)
and the mean Value-at-Risk (MVaR). A model with lowest loss function is said to provide
best volatility forecasts.
The out-of-sample period, which is used for forecasting purpose, covers the period from
January 1, 2009 to October 20, 2009 with a total of 202 daily observations. To generate
volatility forecasts, we use recursive forecasting technique that consists of fixing the initial
date and adding each new observation one at a time to the out-of-sample period. The results
for horizons of 1-, 20-, and 60-day ahead forecasting over the expanding window of data are
reported in Tables 6, 7 and 8.
When looking at the results of the 1-day ahead forecast horizon in Table 6, we observe that
the GARCH(1,1) expanding window model has the smallest mean loss only for gasoline 2-
month futures returns, and for spot crude oil returns and heating oil 2-month futures returns,
according to the MSFE and MVaR loss functions, respectively. Thus in most cases it provides
less accurate forecasts than RiskMetrics and other volatility models. The RiskMetrics model
has the lowest mean loss in five out of twelve cases (spot crude oil, spot gasoline, and 1-
month, 2-month and 3-month crude oil) according to the MSFE criterion, but only two out of
twelve cases according to the MVaR criterion. As for the other competing models, they
generally lead to improve the predictive ability relative to the benchmark model for gasoline

25
and heating oil return series. The evidence of superior forecasting performance of competing
models is clearly significant with respect to the MVaR criterion.
Table 6Out-of-sample predictive accuracy of competing models: 1-day horizon
Spot Crude
Spot Gasoline
Spot Heating
1m Crude
1m Gasoline
1m Heating
2m Crude
2m Gasoline
2m Heating
3m Crude
3m Gasoline
3m Heating
MSFE criterion
GARCH(1,1)Ex. window
1.000 1.000 1.000 1.000 1.000 1.000 1.000 1.000 1.000 1.000 1.000 1.000
RiskMetrics 0.985 0.992 1.009 0.997 0.982 0.993 0.992 1.026 1.019 0.999 1.009 1.005
FIGARCH 1.008 1.028 1.031 1.019 1.007 1.005 1.006 1.006 1.001 1.006 0.997 1.009
GARCH(1,1) 0.5 RW
0.998 0.992 0.973 1.015 0.991 0.973 1.018 1.009 0.999 1.021 0.986 1.002
GARCH(1,1) 0.25 RW
1.014 1.007 0.986 1.006 0.978 0.955 0.996 1.012 1.011 1.000 0.979 0.998
SB-GARCH(1,1)
No break 0.992
No break
No break
0.998 0.956No break
1.001 1.068No break
No break
No break
5% MVaR criterion
GARCH(1,1)Ex. window
1.000 1.000 1.000 1.000 1.000 1.000 1.000 1.000 1.000 1.000 1.000 1.000
RiskMetrics 1.007 0.992 0.943 0.994 0.964 1.008 0.968 1.010 1.022 0.996 1.009 0.989
FIGARCH 1.024 0.997 0.998 1.010 0.996 1.026 0.971 0.983 1.035 0.985 0.984 1.004
GARCH(1,1) 0.5 RW
1.019 0.994 0.963 1.014 0.985 0.986 1.024 0.965 1.012 1.026 0.988 0.977
GARCH(1,1) 0.25 RW
1.048 0.989 0.948 1.005 0.955 0.902 0.977 0.966 1.013 0.996 0.973 0.972
SB-GARCH(1,1)
No break 0.983
No break
No break
1.001 0.947No break
0.987 1.023No break
No break
No break
Notes: this table reports the results of 1-day forecasting horizon for competing volatility models: GARCH(1,1) expanding window, RiskMetrics, FIGARCH(1,d,1), GARCH(1,1) 0.50 rolling window, GARCH(1,1) 0.25 rolling window, and GARCH(1,1) with breaks. We compute the ratio of the mean loss to the mean loss of the GARCH(1,1) expanding window model is given. The GARCH(1,1) with breaks is estimated for the return series for which we detect structural changes by using the ICSS algorithm. A bold entry denotes the model with the lowest mean loss among the competing models.
One should however note that the models accommodating explicitly for long memory and
structural breaks, FIGARCH(1,d,1) and GARCH(1,1) with breaks, outperform other models
in only few cases over the out-of-sample forecasting period, namely 1-month gasoline
(MSFE) and 1-month gasoline and 2-month crude and 3-month crude (MVaR). Indeed, the
MSFE does not select the FIGARCH model, while it is chosen only twice for the 2-month and
3-month crude oil futures returns by the MVaR. The GARCH(1,1) with breaks shows superior
predictive ability relative to the remaining models only for gasoline spot returns.
Nevertheless, on the one hand, when structural breaks are found, SB-GARCH outperforms
the standard GARCH(1,1) in most cases, on the other hand, the FIGARCH model gives better

26
forecasts than the benchmark in seven cases according the MVaR criterion. Finally, the
competing models that allow for instabilities and accommodate for changes in the estimates
lead to significant reduction of the loss function compared to the benchmark.
Table 7Out-of-sample predictive accuracy of competing models: 20-day horizon
Spot Crude
Spot Gasoline
Spot Heating
1m Crude
1m Gasoline
1m Heating
2m Crude
2m Gasoline
2m Heating
3m Crude
3m Gasoline
3m Heating
MSFE criterion
GARCH(1,1)Ex. window
1.000 1.000 1.000 1.000 1.000 1.000 1.000 1.000 1.000 1.000 1.000 1.000
RiskMetrics 0.915 1.350 1.842 1.056 0.976 0.970 1.183 1.885 1.266 1.180 1.164 1.136
FIGARCH 0.977 2.176 2.125 1.102 1.276 0.936 1.359 0.979 0.998 1.275 0.992 1.113
GARCH(1,1) 0.5 RW
1.147 0.903 0.782 1.196 1.050 0.591 1.524 1.051 0.935 1.354 0.775 1.191
GARCH(1,1) 0.25 RW
1.548 1.026 1.167 1.103 1.025 0.342 1.194 1.080 1.231 1.083 0.754 1.129
SB-GARCH(1,1)
No break
0.904No break
No break
0.980 0.357No break 0.870 2.302
No break
No break
No break
5% MVaR criterion
GARCH(1,1)Ex. window
1.000 1.000 1.000 1.000 1.000 1.000 1.000 1.000 1.000 1.000 1.000 1.000
RiskMetrics 1.027 1.008 1.020 1.026 1.021 1.176 1.053 1.298 1.017 1.030 1.052 1.018
FIGARCH 1.049 0.967 1.048 1.039 1.046 0.845 1.043 0.963 0.963 1.033 0.956 1.027
GARCH(1,1) 0.5 RW
1.150 0.946 0.983 0.964 0.996 0.926 0.907 0.655 0.972 0.873 0.957 0.997
GARCH(1,1) 0.25 RW
1.625 0.944 1.006 1.021 1.052 0.571 0.999 0.647 1.032 0.985 0.864 1.036
SB-GARCH(1,1)
No break 0.940
No break
No break
1.004 0.782No break
0.806 1.030No break
No break
No break
Notes: this table reports the results of 20-day forecasting horizon for competing volatility models: GARCH(1,1) expanding window, RiskMetrics, FIGARCH(1,d,1), GARCH(1,1) 0.50 rolling window, GARCH(1,1) 0.25 rolling window, and GARCH(1,1) with breaks. We compute the ratio of the mean loss to the mean loss of the GARCH(1,1) expanding window model is given. The GARCH(1,1) with breaks is estimated for the return series for which we detect structural changes by using the ICSS algorithm. A bold entry denotes the model with the lowest mean loss among the competing models.
For the 20-day ahead forecast horizon in Table 7, it is shown that the benchmark model has
the highest mean loss in all cases according to MVaR and in eight cases according to MSFE
criterion. The GARCH(1,1) 0.5 and 0.25 rolling window models outperform the GARCH(1,1)
expanding window model and RiskMetrics model for five cases according to the MSFE loss
function. The GARCH(1,1) with structural breaks gives better forecast than the GARCH(1,1)
expanding window model for four cases while it is the best model for only one case. With
respect to the MVaR loss function, the models accommodating for instabilities in the volatility
process give better forecasts than the benchmark in eleven (seven) cases according the MVaR

27
(MSFE). The FIGARCH forecasts are better than those of other models in only one case (2-
month heating) according to the MVaR criterion but it gives better forecasts than the
benchmark GARCH(1,1) model in five cases according to both criteria. We also remark that
the mean losses of the competing models selected by evaluation criteria are substantially
reduced in comparison to those reported in Table 6.
Table 8Out-of-sample predictive accuracy of competing models: 60-day horizon
Spot Crude
Spot Gasoline
Spot Heating
1m Crude
1m Gasoline
1m Heating
2m Crude
2m Gasoline
2m Heating
3m Crude
3m Gasoline
3m Heating
MSFE criterion
GARCH(1,1)Ex. window
1.000 1.000 1.000 1.000 1.000 1.000 1.000 1.000 1.000 1.000 1.000 1.000
RiskMetrics 1.021 2.286 3.203 1.481 1.352 0.301 2.214 0.972 1.948 1.806 1.638 1.790
FIGARCH 0.988 5.222 5.571 1.430 2.585 0.936 2.710 0.907 0.724 2.202 1.102 1.300
GARCH(1,1) 0.5 RW
1.254 1.126 0.637 0.964 1.100 0.001 1.608 7.829 0.716 1.083 0.628 1.485
GARCH(1,1) 0.25 RW
1.967 1.371 1.392 1.074 1.287 2.761 1.451 7.286 1.878 0.937 0.693 1.607
SB-GARCH(1,1)
No break
1.151No break
No break 0.909 0.880
No break
2.468 3.146No break
No break
No break
5% MVaR criterion
GARCH(1,1)Ex. window
1.000 1.000 1.000 1.000 1.000 1.000 1.000 1.000 1.000 1.000 1.000 1.000
RiskMetrics 1.074 1.024 1.051 1.073 1.054 0.736 1.091 1.445 1.037 1.060 1.102 1.084
FIGARCH 1.150 1.147 1.108 1.042 1.095 0.516 1.083 0.916 0.951 1.062 0.879 1.045
GARCH(1,1) 0.5 RW
1.375 1.056 0.996 0.852 0.928 0.605 0.852 0.617 0.960 0.822 0.903 0.983
GARCH(1,1) 0.25 RW
1.847 1.054 1.013 0.976 1.013 0.094 1.012 0.615 1.039 0.984 0.732 1.064
SB-GARCH(1,1)
No break
1.051No break
No break
1.173 0.007No break
0.776 1.024No break
No break
No break
Notes: this table reports the results of 60-day forecasting horizon for competing volatility models: GARCH(1,1) expanding window, RiskMetrics, FIGARCH(1,d,1), GARCH(1,1) 0.50 rolling window, GARCH(1,1) 0.25 rolling window, and GARCH(1,1) with breaks. We compute the ratio of the mean loss to the mean loss of the GARCH(1,1) expanding window model is given. The GARCH(1,1) with breaks is estimated for the return series for which we detect structural changes by using the ICSS algorithm. A bold entry denotes the model with the lowest mean loss among the competing models.
Results of the 60-day ahead forecasting horizon (Table 8) almost confirm those we
reported in Table 7. First, there are only four (two) cases where the GARCH(1,1) expanding
window model has the lowest mean loss with respect to the MSFE (MVaR) criterion, thus
gives the superiority of out-of-sample volatility forecasts relative to the other models. Second,
GARCH models incorporating instable structures continue to generate lower mean losses than
the benchmark model in ten (seven) cases according to the MSFE (MVaR). Similarly, the

28
results provide little evidence of superior predictive power of the FIGARCH(1,d,1) compared
to other competing models. However it outperforms the benchmark in four cases according to
the two criteria. It should be finally noted that RiskMetrics model is no longer relevant for
out-of-sample volatility forecasts according to neither MSFE nor MVaR loss functions. The
best performing model in case of 1-month heating oil futures returns (GARCH with structural
breaks) attains a mean loss reduction of 99.993%.
Table 9Out-of-sample predictive accuracy: loss function based on the MSFE and MVaR
Spot Crude
Spot Gasoline
Spot Heating
1m Crude
1m Gasoline
1m Heating
2m Crude
2m Gasoline
2m Heating
3m Crude
3m Gasoline
3m Heating
MSFE loss function
H=1 Mean 1.001 1.038 1.002 1.010 0.985 0.960 1.000 1.003 1.095 1.002 0.986 1.000
T mean 0.994 1.001 0.989 1.002 0.989 0.966 0.999 1.005 1.013 1.000 0.987 0.999
H=20 Mean 1.052 1.953 1.394 1.079 0.966 0.500 1.093 0.966 1.274 1.005 0.804 1.066
T mean 1.015 1.129 1.078 1.025 0.984 0.478 1.057 0.989 1.210 0.999 0.804 1.065
H=60 Mean 1.209 3.308 1.964 2.202 1.039 0.811 1.155 4.711 1.659 0.943 0.716 1.252
T mean 1.077 1.832 1.243 1.142 1.025 0.694 1.047 4.655 1.392 0.790 0.714 1.242
5% MVaR loss function
H=1 mean 1.042 0.981 0.964 1.016 0.968 0.945 0.992 0.978 1.003 1.005 0.986 0.977
T mean 1.022 0.989 0.964 0.998 0.980 0.953 0.987 0.978 1.009 0.999 0.986 0.986
H=20 mean 1.158 0.975 1.016 1.025 1.030 0.716 1.007 0.730 1.031 1.029 0.916 1.031
T Mean 1.122 0.963 1.005 0.998 1.018 0.744 0.985 0.733 1.011 0.971 0.923 1.014
H=60 Mean 1.302 1.110 1.049 1.000 1.009 0.367 1.016 0.718 1.028 0.999 0.850 1.041
T mean 1.287 1.070 1.021 0.971 0.991 0.335 0.987 0.715 1.009 0.976 0.854 1.023
Notes: this table reports the ratio of the mean loss for the mean and the trimmed mean combination forecasts to the mean lossfor the GARCH(1,1) model.
Table 9 reports the ratio of the mean loss for the mean and the trimmed mean combinations
forecasts to those of the benchmark, i.e. the GARCH(1,1) model. The upper part shows that,
based on the MSFE loss function, the mean and trimmed mean are lower than those of the
GARCH(1,1) model for the 1-month gasoline, 1-month heating, and 3-month gasoline. Better
forecasting ability of the competing models can be seen in the lower part of Table 9 in view of
numerous ratios with values lower than unity. In addition, all the series are concerned with the

29
improvement of their forecast accuracy since the associated ratios reveal a decreasing trend,
even those remaining above unity.
Overall, the results of our out-of-sample analysis from Table 6 to Table 9 indicate that
accommodating for instabilities and structural breaks often leads to improve the quality of
volatility forecasts of oil spot and futures returns, regardless of the evaluation criteria having
been used to select the best performing models. We find that GARCH(1,1) rolling window
models and GARCH with breaks have the lowest loss function for the majority of the cases,
whereas the benchmark model, GARCH(1,1) expanding window, tends to have inferior
predictive power relative to competing models at the longer forecast horizons. As for
FIGARCH model that explicitly allows for the persistence of long memory in oil return
volatility, it is relevant at most in two cases (60-day horizon), which is not consistent with the
strong evidence of long memory revealed by the GPH, GSP, and EML tests. These findings
lead us to conclude that structural breaks are a relevant feature of oil return volatility, and that
long memory evidence may be spurious. For future research, it is therefore important to
discriminate between long memory and nonlinearity.
4. Conclusion
In this paper we examined competing GARCH-type models in order to model and forecast oil
price volatility over the last turbulent decades. We particularly extended the previous works
by investigating the relevance of structural breaks and long memory in modeling and
forecasting the conditional volatility of oil spot and futures prices. Empirical findings from in-
sample analysis suggests that structural breaks are indeed present in the dynamics of several
oil price volatility series and that SB-GARCH models appear to be relevant to better describe
the behavior of time-varying oil-return volatility. Long memory equally seems to characterize
the volatility process of oil returns as indicated by the results of the FIGARCH estimates.

30
Results of the out-of-sample analysis indicate that taking into account the instabilities and
structural breaks in the volatility dynamics of oil spot and futures returns often leads to
improve the quality of volatility forecasts. Accommodating for long memory in oil return
volatility also helps to improve forecasting results in some cases. In particular, we provide
evidence that long-horizon forecasts of spot and futures oil price volatility generated by short
memory stable volatility models, namely RiskMetrics and GARCH(1,1), are often inferior to
forecasts obtained from GARCH(1,1) rolling windows, BS-GARCH and FIGARCH models
allowing respectively for instabilities and long memory in the unconditional variance.
There are several avenues for future research. First, the evidence of long memory in the in-
sample period is not strongly supported by the out-of-sample forecasting exercise. The
persistence detected in the returns dynamic may be spurious and due to other forms of
nonlinearities. Further investigation of this point would be informative. Second, in this paper
we considered as a benchmark a standard linear GARCH(1,1) model. However, recent works
on stock returns suggest that taking into account asymmetric effects helps to improve in-
sample and out-of-sample model performances. Thus, it would be interesting in future
empirical investigations to consider asymmetric volatility models such as exponential
GARCH and GJR-GARCH models. Finally, further research could examine shock
transmission and the links of causality between oil and oil-related products using multivariate
volatility models.

31
References
Agnolucci, P., 2009. Volatility in crude oil futures: A comparison of the predictive ability of GARCH and implied volatility models. Energy Economics 31, 316-321.
Baillie, R., Bollerslev, T., Mikkelsen, H., 1996. Fractionally integrated generalized autoregressive conditional heteroskedasticity. Journal of Econometrics 74, 3-30.
Basher, S.A., Sadorsky, P., 2006. Oil price risk and emerging stock markets. Global Finance Journal 17, 224-251.
Bollerslev, T., 1986. Generalized autoregressive conditional heteroskedasticity. Journal of Econometrics 31, 307-327.
Bollerslev, T., Mikkelsen, H.O., 1996. Modeling and pricing long-memory in stock market volatility. Journal of Econometrics 73, 151-184.
Boyer, M.M., Filion, D., 2007. Common and fundamental factors in stock returns of Canadian oil and gas companies. Energy Economics 29, 428-453.
Charles, A., Darné, O., 2009. The efficiency of the crude oil markets: Evidence from variance ratio tests. Energy Policy 37, 4267-4272.
Cheong, C.W., 2009. Modeling and forecasting crude oil markets using ARCH-type models. Energy Policy 37, 2346-2355.
Choi, K., Hammoudeh, S., 2009. Long memory in oil and refined products markets. Energy Journal 30, 57-76.
Choi, K., Hammoudeh, S., 2009. Long memory in oil and refined products markets. Energy Journal30, 57-76.
Choi, K., Yu, W-C., Zivot, E., 2010. Long memory versus structural breaks in modeling and forecasting realized volatility. Journal of International Money and Finance, forthcoming.
Choi, K., Zivot, E., 2007. Long memory and structural changes in the forward discount: An empirical investigation. Journal of International Money and Finance 26, 342-363.
Ciner, C., 2001. Energy shock and financial market nonlinear linkages. Studies in Nonlinear Dynamics and Econometrics 5, 203-212.
Cologni, A., Manera, M., 2008. Oil prices, inflation and interest rates in a structural cointegrated VAR model for the G-7 countries. Energy Economics 30, 856-888.
Ding, Z., Granger, C.W.J., Engle, R.F., 1993. A long memory property of stock market returns and a new model. Journal of Empirical Finance 1, 83-106.
Driesprong, G., Jacobsen, B., Maat, B., 2008. Striking oil: another puzzle?. Journal of Financial Economics 89, 307-327.
Elder, J., Serletis, A., 2008. Long memory in energy futures prices. Review of Financial Economics 17, 146-155.
Engle, R.F., 1982. Autoregressive conditional heteroscedasticity with estimates of the variance of United Kingdom inflation. Econometrica 50, 987-1007.
Fong, W.M., See, K.H., 2002. A Markov switching model of the conditional volatility of crude oil futures prices. Energy Economics 24, 71-95.
Geweke, J.P., Porter-Hudack, S. 1983. The estimation and application of long memory time series models. Journal of Time Series Analysis 4, 221-238.
Granger, C.W.J., Hyung, N., 2004. Occasional structural breaks and long memory with an application to the S&P 500 absolute stock returns. Journal of Empirical Finance 11, 399-421.

32
Hamilton, J.D., 1983. Oil and the macroeconomy since World War II. Journal of Political Economy 91, 228-248.
Hammoudeh, S., Li, H., 2004. Risk-return relationships in oil-sensitive stock markets. Finance Letters 2, 10-15.
Hillebrand, E., 2005. Neglecting parameter changes in GARCH models. Journal of Econometrics 129, 121-138.
Horsnell, P., Mabro, R., 1993. Oil markets and prices: the Brent market and the formation of world oil prices. Oxford University Press, Oxford.
Inclán, C., Tiao, G.C., 1994. Use of cumulative sums of squares for retrospective detection of changes in variance. Journal of the American Statistic Association 89, 913-923.
Jones, C.M., Kaul, G., 1996. Oil and the stock markets. Journal of Finance 51, 463-491.
Kang, S.H., Kang, S.M., Yoon, S.M., 2009. Forecasting volatility of crude oil markets. Energy Economics. Energy Economics 31, 119-125.
Kroner, K.F., Kneafsey, K.P., Claessens, S., 1995. Forecasting volatility in commodity markets. Journal of Forecasting 14, 77-95.
Lardic, S., Mignon, V., 2008. Oil prices and economic activity: an asymmetric cointegration approach. Energy Economics 30, 847-855.
Lee, C., Lee, J., 2009. Energy prices, multiple structural breaks, and efficient market hypothesis. Applied Energy 86, 466-479.
Lee, Y-H., Hu, H-N., Chiou, J-S., 2010. Jump dynamics with structural breaks for crude oil prices. Energy Economics 32, 343-350.
Maghyereh, A., Al-Kandari, A., 2007. Oil prices and stock markets in GCC countries: new evidence from nonlinear cointegration analysis. Managerial Finance 33, 449-460.
Mikosch, T., Stărică, C., 2004. Nonstationarities in financial time series, the long-range dependence, and the IGARCH effects. Review of Economics and Statistics 86, 378-390.
Nandha, M., Faff, R., 2008. Does oil move equity prices? A global view. Energy Economics 30, 986-997.
Narayan, P.K., Narayan, S., 2007. Modelling oil price volatility. Energy Policy 35, 6549-6553.
Newey, W.K., West, K.D., 1994. Automatic lag selection in covariance matrix estimation. Review of Economic Studies 61, 631-654.
Pindyck, R.S., 2004. Volatility and commodity price dynamics. Journal of Futures Markets 24, 1029-1047.
Plourde, A., Watkins, G.C., 1998. Crude oil prices between 1985 and 1994: how volatile in relation to other commodities?. Resource and Energy Economics 20, 245-262.
Poon, S.H., Granger, C.W.J., 2003. Forecasting volatility in financial markets: a review. Journal of Economic Literature 41, 478-539.
Rapach, D.E., Strauss, J.K., 2008. Structural breaks and GARCH models of exchange rate volatility. Journal of Applied Econometrics 23, 65-90.
Regnier, E., 2006. Oil and energy price volatility. Energy Economics 29, 405-427.
RiskMetrics Group (1996). RiskMetrics-Technical Document (New York: J.P. Morgan/Reuters).
Robinson, P.M, Hendry, D., 1999. Long and short memory conditional heteroscedasticity in estimating the memory parameter of levels. Econometric Theory 15, 299-336.

33
Sadorsky, P., 2006. Modeling and forecasting petroleum futures volatility. Energy Economics 28, 467-488.
Sowell, F., 1992. Maximum likelihood estimation of stationary univariate fractionally integrated time series models. Journal of Econometrics 53, 165-188.
Stărică, C., Herzel, S., Nord, T., 2005. Why does the GARCH(1,1) model fail to provide sensible longer-horizon volatility forecasts?. Working Paper, Chalmers University of Technology.
Tabak, B.M., Cajueiro, D.O., 2007. Are the crude oil markets becoming weakly efficient over time? A test for time-varying long-range dependence in prices and volatility. Energy Economics 29, 28-36.
Tse, Y., 1998. The conditional heteroscedasticity of the yen-dollar exchange rate. Journal of Applied Econometrics 193, 49-55.
West, K.D., Cho, D., 1995. The predictive ability of several models of exchange rate volatility. Journal of Econometrics 69, 367-391.
Zhang, D., 2008. Oil shock and economic growth in Japan: a nonlinear approach. Energy Economics 30, 2374-2390.