Embed Size (px)
Citation preview

CommitmentRestaurant Brands New Zealand LimitedAnnual Report 2016

Contents
02 Financial highlights03 Year in review04 Chairman’s and Chief Executive
Officer’s report to shareholders10 Committed to our customers18 Pizza Hut operations20 KFC operations22 Starbucks Coffee operations24 Carl’s Jr. operations26 Board of directors
28 Corporate social responsibility31 Consolidated income statement32 Non-GAAP financial measures33 Financial statements60 Independent auditors’ report61 Shareholder information63 Statutory information66 Statement of corporate governance70 Corporate directory71 Financial calendar
For Louis and Ashleigh Davis, KFC just had to be there for their special day. Louis’ love for KFC goes as far back as he can remember and he thought it would be a ‘crack up’ to mark the occasion with a shot of the wedding party outside his favourite fast food brand. We loved that. So much that we flew the happy couple to Kentucky – the home of Colonel Sanders – now that’s a ‘crack up.’
Photo credit: Marie Waring / One Eighty Photography

Deep and lasting relationshipsPeople love our brands and show their commitment to them every day in ordinary and extraordinary ways. In many ways they are a reflection of our own continuous commitment to creating brand experiences that delight and endure.
Restaurant Brands New Zealand Limited operates the New Zealand outlets of KFC, Pizza Hut, Carl’s Jr. and Starbucks Coffee. These brands – four of the world’s most famous – are distinguished for their product, look, style and ambience, service and for the total experience they deliver to their customers in New Zealand and around the world.
ANNUAL REPORT 2016 1
All figures in $NZ millions unless stated 2011 2012 2013 2014 2015 2016
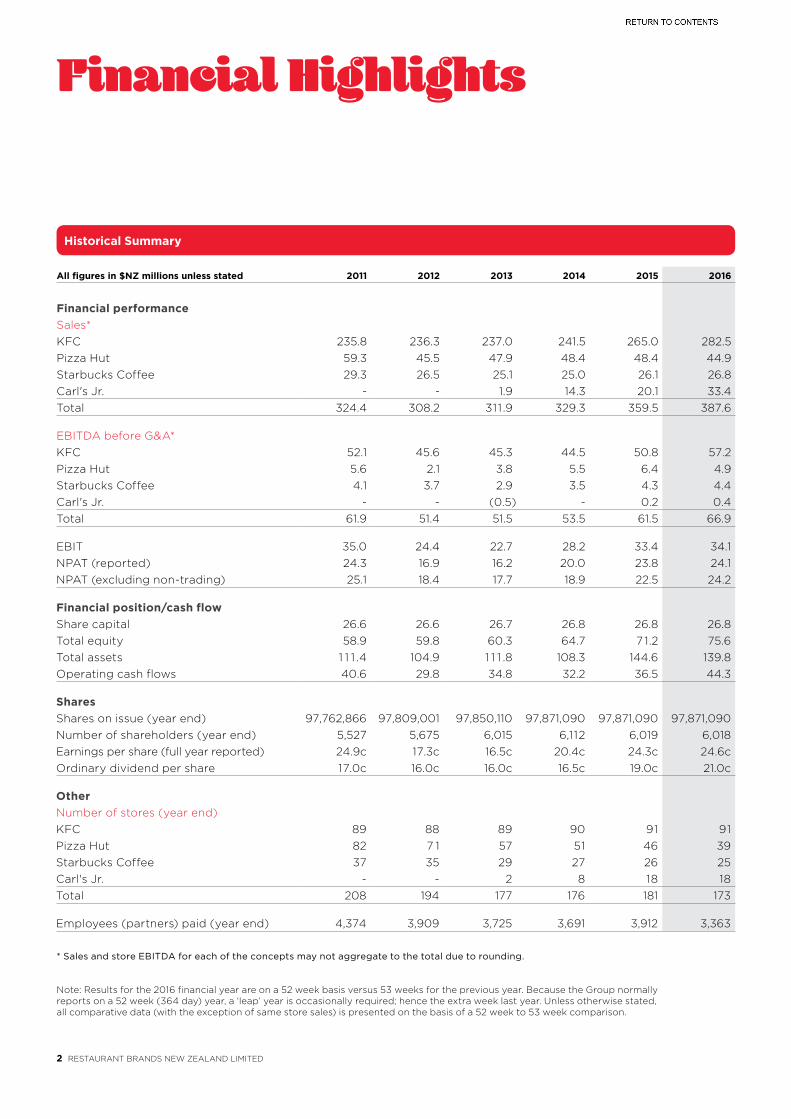
Financial performance Sales*KFC 235.8 236.3 237.0 241.5 265.0 282.5Pizza Hut 59.3 45.5 47.9 48.4 48.4 44.9Starbucks Coffee 29.3 26.5 25.1 25.0 26.1 26.8Carl's Jr. - - 1.9 14.3 20.1 33.4Total 324.4 308.2 311 .9 329.3 359.5 387.6
EBITDA before G&A*KFC 52.1 45.6 45.3 44.5 50.8 57.2Pizza Hut 5.6 2.1 3.8 5.5 6.4 4.9Starbucks Coffee 4.1 3.7 2.9 3.5 4.3 4.4Carl's Jr. - - (0.5) - 0.2 0.4Total 61.9 51.4 51.5 53.5 61.5 66.9
EBIT 35.0 24.4 22.7 28.2 33.4 34.1NPAT (reported) 24.3 16.9 16.2 20.0 23.8 24.1NPAT (excluding non-trading) 25.1 18.4 17.7 18.9 22.5 24.2
Financial position/cash flowShare capital 26.6 26.6 26.7 26.8 26.8 26.8Total equity 58.9 59.8 60.3 64.7 7 1.2 75.6Total assets 1 1 1 .4 104.9 1 1 1 .8 108.3 144.6 139.8Operating cash flows 40.6 29.8 34.8 32.2 36.5 44.3
SharesShares on issue (year end) 97,762,866 97,809,001 97,850,110 97,871,090 97,871,090 97,871,090Number of shareholders (year end) 5,527 5,675 6,015 6,112 6,019 6,018Earnings per share (full year reported) 24.9c 17.3c 16.5c 20.4c 24.3c 24.6cOrdinary dividend per share 17.0c 16.0c 16.0c 16.5c 19.0c 21.0c
OtherNumber of stores (year end)KFC 89 88 89 90 91 91Pizza Hut 82 7 1 57 51 46 39Starbucks Coffee 37 35 29 27 26 25Carl's Jr. - - 2 8 18 18Total 208 194 177 176 181 173
Employees (partners) paid (year end) 4,374 3,909 3,725 3,691 3,912 3,363
* Sales and store EBITDA for each of the concepts may not aggregate to the total due to rounding.
Note: Results for the 2016 financial year are on a 52 week basis versus 53 weeks for the previous year. Because the Group normally reports on a 52 week (364 day) year, a ‘leap’ year is occasionally required; hence the extra week last year. Unless otherwise stated, all comparative data (with the exception of same store sales) is presented on the basis of a 52 week to 53 week comparison.
Financial Highlights
Historical Summary
2 RESTAURANT BRANDS NEW ZEALAND LIMITED

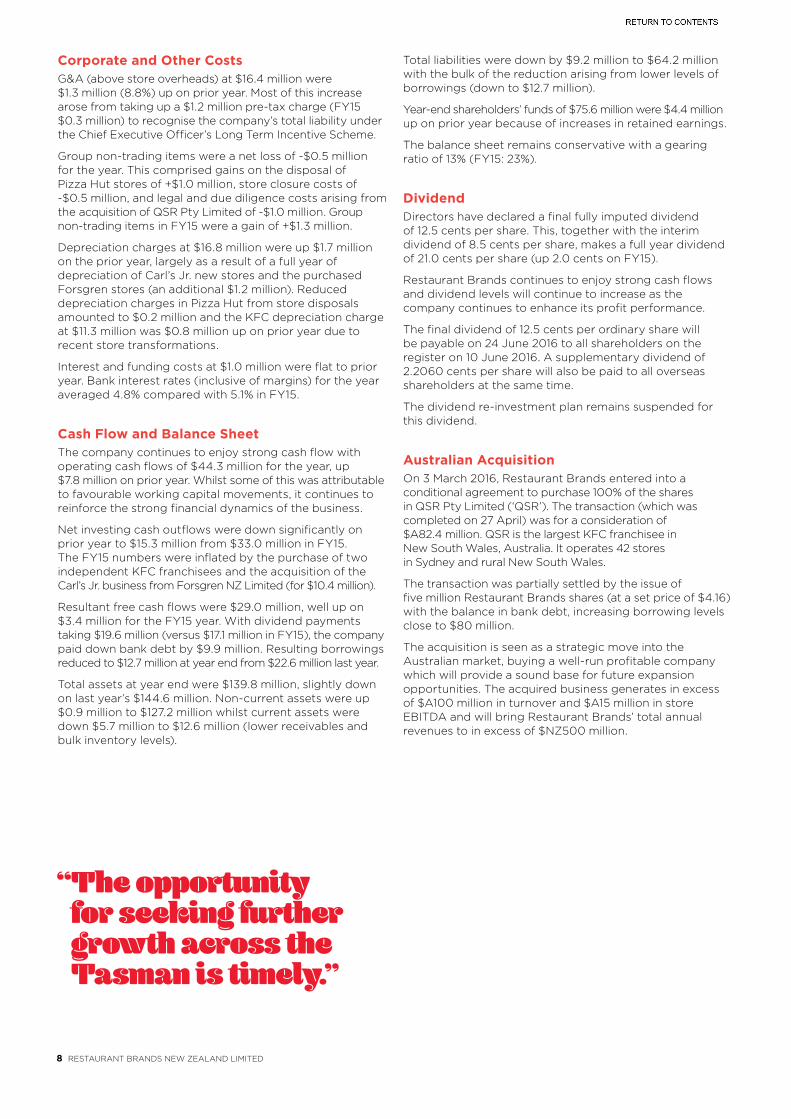
• Group Net Profit after Tax was $24.1 million (24.6 cents per share), up $0.2 million (+1.0%), on prior year. Net Profit after Tax (excluding non-trading items) was $24.2 million (24.7 cents per share), up 7.5% on prior year.
• Net Profit After Tax (excluding non-trading items) was up $2.8 million or 12.6%, on a like-for-like basis adjusting for the impact of the 52 versus 53 week comparison and the LTI scheme.
• Total Group Store Sales were $387.6 million, up $28.0 million (+7.8%) on prior year with continued strong growth from KFC and the impact of acquisitions in the Carl’s Jr. brand.
• KFC continued to dominate performance with sales continuing to grow to a new high of $282.5 million.
• Total store EBITDA of $66.9 million was up $5.4 million (+8.7%) on the prior year, again driven by a very strong performance by KFC.
• Operating cash flows were $44.3 million, up $7.8 million and debt was reduced to $12.7 million.
• The acquisition of QSR Pty Limited was completed after balance date. QSR Pty Limited is the largest KFC franchisee in New South Wales, Australia. The acquisition will result in an additional $A100 million in annual revenues and $A15 million in store EBITDA.
• A final fully imputed dividend of 12.5 cents per share will be paid on 24 June, making a full year dividend of 21.0 cents (up 10.5% on the previous year).
Year in Review
Total Sales ($NZm)
Total Store EBITDA ($NZm)
Total NPAT ($NZm)
Total Assets ($NZm)
11 12 13 14 15 16
387.6359.5
329.3311.9308.2324.4
Total Sales
EBITA
Total Assets
Total NPAT
11 12 13 14 15 16
66.9
61.5
53.551.551.4
61.9
11 12 13 14 15 16
24.123.820.0
16.216.9
24.3
11 12 13 14 15 16
139.8144.6
108.3111.8104.9111.4
11 12 13 14 15 16
387.6359.5
329.3311.9308.2324.4
Total Sales
EBITA
Total Assets
Total NPAT
11 12 13 14 15 16
66.9
61.5
53.551.551.4
61.9
11 12 13 14 15 16
24.123.820.0
16.216.9
24.3
11 12 13 14 15 16
139.8144.6
108.3111.8104.9111.4
11 12 13 14 15 16
387.6359.5
329.3311.9308.2324.4
Total Sales
EBITA
Total Assets
Total NPAT
11 12 13 14 15 16
66.9
61.5
53.551.551.4
61.9
11 12 13 14 15 16
24.123.820.0
16.216.9
24.3
11 12 13 14 15 16
139.8144.6
108.3111.8104.9111.4
11 12 13 14 15 16
387.6359.5
329.3311.9308.2324.4
Total Sales
EBITA
Total Assets
Total NPAT
11 12 13 14 15 16
66.9
61.5
53.551.551.4
61.9
11 12 13 14 15 16
24.123.820.0
16.216.9
24.3
11 12 13 14 15 16
139.8144.6
108.3111.8104.9111.4
ANNUAL REPORT 2016 3

Committed to growth
Russel CreedyChief Executive Officer
Ted van ArkelChairman
4 RESTAURANT BRANDS NEW ZEALAND LIMITED

CHAIRMAN’S AND CHIEF EXECUTIVE OFFICER’S REPORT TO SHAREHOLDERS
Group Operating Results Restaurant Brands Net Profit after Tax for the 52 weeks to 29 February 2016 (FY16) was $24.1 million (24.6 cents per share), up 1.0% on last year’s profit of $23.8 million (24.3 cents per share).
Net Profit after Tax (excluding non-trading items) was $24.2 million (24.7 cps), up 7.5% on the $22.5 million (23.0 cps) result in FY15.
Non-trading costs were $0.5 million for the year (compared with $1.3 million in non-trading gains for FY15).
Total store sales of $387.6 million were up $28.1 million (+7.8%) on the previous year’s sales. Adjusted for the extra trading week in the prior year, the real increase was closer to $34.9 million or +9.9%. KFC and Carl’s Jr. drove most of the growth with Pizza Hut showing a small decline in sales because of the sale of company stores. Same store sales for the group were up 5.3% (up 5.7% in FY15).
Group revenues for the year were $404.1 million with the inclusion of sales of ingredients and packaging materials to independent franchisees. This was up 26.4% on prior year with higher volumes and an increased number of independent franchisees.
Store EBITDA (before G&A costs) was up by $5.4 million (+8.7%) to $66.9 million, with KFC contributing $6.4 million of the improved earnings.
Year end store numbers at 173 were eight down on February 2015 with continuing sales of regional Pizza Hut stores to independent franchisees and the closure of one Pizza Hut and one Starbucks Coffee store at lease end.
2016(52 weeks)
$m
2015 (53 weeks)
$m
Change
%
Total Group Store Sales 387.6 359.5 +7.8%
Group Net Profit after Tax 24.1 23.8 +1.0%
Dividend (cps) 21.0 19.0 +10.5%
We are pleased to report to our shareholders that Restaurant Brands has enjoyed another year of strong sales and profit performance.
Our KFC business in particular saw outstanding growth, underpinning our major new foray into Australia with the acquisition of a major KFC franchise in New South Wales, Australia.
+7.5%
+5.3%
Net Profit After Tax (Excluding Non-Trading Items) Up
Same Store Sales Up
Note: Results for the 2016 financial year are on a 52 week basis versus 53 weeks for the previous year. Because the Group normally reports on a 52 week (364 day) year, a ‘leap’ year is occasionally required; hence the extra week last year. Unless otherwise stated, all comparative data (with the exception of same store sales) is presented on the basis of a 52 week to 53 week comparison.
ANNUAL REPORT 2016 5

Pizza Hut
2016 $m
2015 $m
Change $m
Change %
Sales 44.9 48.4 -3.5 -7.2%
EBITDA 4.9 6.4 -1.5 -23.0%
EBITDA as % of Sales 10.9% 13.2% - -2.3%
Total sales of stores operated by Restaurant Brands were down 7.2% over the year to $44.9 million, due to lower store numbers as the company sold a further six stores to independent franchisees and closed its Red Roof dine-in store in Rotorua.
Same store sales for company stores grew 2.6% over the year with particularly strong sales growth in the fourth quarter – increasing by 8.8% with the benefit of the launch of a new mobile-friendly Pizza Hut website and a revised menu.
Earnings from company stores were adversely impacted by both sales of profitable stores to independent franchisees and some increases in labour and ingredient costs. EBITDA for the year was $4.9 million, down $1.5 million on FY15. This represented 10.9% of sales versus 13.2% last year, but still within the company’s expected margin range.
By year end Restaurant Brands still retained a total of 39 stores and independent franchisees had 50 stores. Sales from the 89 store Pizza Hut network increased by 7.2% on the equivalent period.
Demand from independent franchisees remains strong for both purchases of Restaurant Brands’ stores and new store construction in green-fields locations.
KFC
2016 $m
2015 $m
Change $m
Change %
Sales 282.5 265.0 +17.5 +6.6%
EBITDA 57.2 50.8 +6.4 +12.6%
EBITDA as % of Sales 20.2% 19.2% - +1.0%
KFC enjoyed another year of strong sales and margin growth, achieving record annual sales of $282.5 million, an increase of $17.5 million or +6.6% on the prior year. Adjusting for the extra week’s trading last year, sales growth was +8.6%.
Same store sales started very strongly with the first half delivering a +8.8% increase and finishing the full year at +6.3% (compared with +7.7% last year).
The strong sales continue to be driven by the store transformation programme, increased marketing spend and successful promotions.
Margins continued to improve with an EBITDA of $57.2 million, another new record for the brand. This represents an increase of $6.4 million or +12.6% on FY15. As a percentage of sales, brand EBITDA improved from 19.2% in FY15 to 20.2% this year.
Store transformations continued with four more major transformations being undertaken, together with 14 minor upgrades. The major transformation process is now nearly complete with 86 out of the company’s 91 stores now either new or fully transformed. A further two to three are scheduled for transformation in the new financial year.
Store numbers remained at 91 with the opening of a new store at Albany and the closure of an under-performing store in Kaikohe.
“ Our KFC business in particular saw outstanding growth.”
+$17.5m
+$13.3m
KFC increased sales by
Carl’s Jr. increased sales by
6 RESTAURANT BRANDS NEW ZEALAND LIMITED

Carl’s Jr.
2016 $m
2015 $m
Change $m
Change %
Sales 33.4 20.1 +13.3 +66.3%
EBITDA 0.4 0.2 +0.3 +186.9%
EBITDA as % of Sales 1.3% 0.8% - +0.5%
The newest brand in the Restaurant Brands stable continued to make progress.
Sales were up 66.3% to $33.4 million, with the full year impact of the stores acquired from Forsgren NZ Limited in FY15 and last year’s new store openings. Same store sales for the brand were -5.1% with continued roll-over of last year’s openings.
Carl’s Jr. introduced the 1/3 pound and the 1/2 pound burger options in the New Zealand market during the year as part of a refresh of the menu.
High beef prices together with the residual effects of the US West Coast port strike, some labour inefficiencies and a conscious strategy to accelerate advertising expenditure to try and build brand presence all adversely impacted margins over the year. The Carl’s Jr. brand produced an EBITDA of $0.4 million (1.3% of sales).
The company has introduced a number of initiatives to improve margins and a more robust profit result is forecast for FY17.
Store numbers remained constant at 18 as store rollouts slowed pending a return to more solid profitability. One new store incorporating a trial of the new Carl’s Jr. livery opened in Christchurch in the first month of the new financial year and a second store opened at the end of April.
Starbucks Coffee
2016 $m
2015 $m
Change $m
Change %
Sales 26.8 26.1 +0.7 +2.9%
EBITDA 4.4 4.3 +0.2 +3.7%
EBITDA as % of Sales 16.4% 16.3% - +0.1%
As the Group’s smallest brand, Starbucks Coffee continues to make a reliable and sustainable contribution to the overall group result.
Sales enjoyed a solid total increase of +2.9% and same store growth of +6.9% to total $26.8 million for the year. Same stores sales growth remains very consistent for this brand, delivering +5.1% in FY15 and +5.7% for FY14.
Despite some weakening of the NZD/USD exchange rate, increased volumes and continuing operating efficiencies delivered a further increase in earnings to a new high of $4.4 million (16.4% of sales).
Store numbers reduced to 25 with the closure at lease end of the Courtenay Place store in Wellington. Two of the brand’s South Island stores in Riccarton and Queenstown received major upgrades over the year.
#iheartstarbucks
65 Likes 7 Comments
FollowingAmy2 October
Like Comment Share
ANNUAL REPORT 2016 7
Corporate and Other Costs G&A (above store overheads) at $16.4 million were $1.3 million (8.8%) up on prior year. Most of this increase arose from taking up a $1.2 million pre-tax charge (FY15 $0.3 million) to recognise the company’s total liability under the Chief Executive Officer’s Long Term Incentive Scheme.
Group non-trading items were a net loss of -$0.5 million for the year. This comprised gains on the disposal of Pizza Hut stores of +$1.0 million, store closure costs of -$0.5 million, and legal and due diligence costs arising from the acquisition of QSR Pty Limited of -$1.0 million. Group non-trading items in FY15 were a gain of +$1.3 million.
Depreciation charges at $16.8 million were up $1.7 million on the prior year, largely as a result of a full year of depreciation of Carl’s Jr. new stores and the purchased Forsgren stores (an additional $1.2 million). Reduced depreciation charges in Pizza Hut from store disposals amounted to $0.2 million and the KFC depreciation charge at $11.3 million was $0.8 million up on prior year due to recent store transformations.
Interest and funding costs at $1.0 million were flat to prior year. Bank interest rates (inclusive of margins) for the year averaged 4.8% compared with 5.1% in FY15.
Cash Flow and Balance SheetThe company continues to enjoy strong cash flow with operating cash flows of $44.3 million for the year, up $7.8 million on prior year. Whilst some of this was attributable to favourable working capital movements, it continues to reinforce the strong financial dynamics of the business.
Net investing cash outflows were down significantly on prior year to $15.3 million from $33.0 million in FY15. The FY15 numbers were inflated by the purchase of two independent KFC franchisees and the acquisition of the Carl’s Jr. business from Forsgren NZ Limited (for $10.4 million).
Resultant free cash flows were $29.0 million, well up on $3.4 million for the FY15 year. With dividend payments taking $19.6 million (versus $17.1 million in FY15), the company paid down bank debt by $9.9 million. Resulting borrowings reduced to $12.7 million at year end from $22.6 million last year.
Total assets at year end were $139.8 million, slightly down on last year’s $144.6 million. Non-current assets were up $0.9 million to $127.2 million whilst current assets were down $5.7 million to $12.6 million (lower receivables and bulk inventory levels).
Total liabilities were down by $9.2 million to $64.2 million with the bulk of the reduction arising from lower levels of borrowings (down to $12.7 million).
Year-end shareholders’ funds of $75.6 million were $4.4 million up on prior year because of increases in retained earnings.
The balance sheet remains conservative with a gearing ratio of 13% (FY15: 23%).
DividendDirectors have declared a final fully imputed dividend of 12.5 cents per share. This, together with the interim dividend of 8.5 cents per share, makes a full year dividend of 21.0 cents per share (up 2.0 cents on FY15).
Restaurant Brands continues to enjoy strong cash flows and dividend levels will continue to increase as the company continues to enhance its profit performance.
The final dividend of 12.5 cents per ordinary share will be payable on 24 June 2016 to all shareholders on the register on 10 June 2016. A supplementary dividend of 2.2060 cents per share will also be paid to all overseas shareholders at the same time.
The dividend re-investment plan remains suspended for this dividend.
Australian AcquisitionOn 3 March 2016, Restaurant Brands entered into a conditional agreement to purchase 100% of the shares in QSR Pty Limited (‘QSR’). The transaction (which was completed on 27 April) was for a consideration of $A82.4 million. QSR is the largest KFC franchisee in New South Wales, Australia. It operates 42 stores in Sydney and rural New South Wales.
The transaction was partially settled by the issue of five million Restaurant Brands shares (at a set price of $4.16) with the balance in bank debt, increasing borrowing levels close to $80 million.
The acquisition is seen as a strategic move into the Australian market, buying a well-run profitable company which will provide a sound base for future expansion opportunities. The acquired business generates in excess of $A100 million in turnover and $A15 million in store EBITDA and will bring Restaurant Brands’ total annual revenues to in excess of $NZ500 million.
“ The opportunity for seeking further growth across the Tasman is timely.”
8 RESTAURANT BRANDS NEW ZEALAND LIMITED

Board We continue to be well served by our small, but stable and experienced board of four directors.
Our longest serving director (since 2002), Danny Diab has indicated that he will not be seeking re-election at the Annual Shareholders’ Meeting this year. Danny (who is also a major shareholder) has been an active and valued contributor around the board table and we sincerely thank him for his contribution and insights into the restaurant industry.
Stephen Copulos, the previous owner of QSR Pty Limited, our recent Australian acquisition, has joined the board following completion of the acquisition. Steve has a wealth of experience with the KFC brand and the Australian marketplace and will be able to contribute strongly to the growth of the KFC business in Australia.
With Sue Suckling’s pending retirement in the coming year we have been actively looking for a replacement and expect to be in a position to make an announcement by the time of the Annual Shareholders’ Meeting.
From the Notice of Meeting, shareholders will see that your board is seeking approval for an increase in the pool of directors’ fees. Your directors believe that the size and complexity of the company has grown considerably in recent times and it is appropriate to recognise this and maintain relativity to the market. The recommended increase is in accord with an independent report tabled with the Notice of Meeting.
Staff Our staff remain fundamental to the ongoing success of our business. We continue to actively address the challenges of recruitment, retention, staff development and training of our people and continue to reward good work habits and outcomes.
Health and safety remains a vital part of our organisational performance and whilst most of our injuries are minor we take each and every one seriously and are constantly striving to reduce these. We have increased the resource dedicated to reducing workplace health and safety incidents and improving the work environment in our stores.
We thank our people working at all levels in Restaurant Brands from the front-line and back-of-house staff in our stores all the way up to our senior leadership team. Everyone has stepped up and put in considerable extra effort to grow our business.
Our Community Restaurant Brands is an active and responsible member of the community within which we operate. We employ over 3,000 staff in New Zealand and another 2,000 in Australia and are often a first employer for many young people, introducing them to new skill sets and work ethics.
We continue to make improvements in the nutritional composition of our food and provide nutritional information to our customers.
We also continue to actively sponsor Surf Life Saving New Zealand and a number of other community causes.
Outlook Whilst the reported profit for the year at $24.1 million was only 1.0% up on prior year, the underlying result was considerably higher after taking into account the impact of the cost of the Long Term Incentive Scheme ($0.9 million after tax) and the due diligence and legal costs of the QSR acquisition ($1.0 million after tax).
The new financial year has seen a continuation of the trading performance of the last quarter of the FY16 year.
KFC’s strong promotional calendar and continued levels of marketing expenditure will see continued same store sales growth for the coming year and margins will be maintained at similar levels. KFC will see a tapering off of investment in store transformation as the brand reaches its target of having all 91 stores at the new high standard.
Pizza Hut is expected to deliver same store sales growth in both its company stores and across the network of independent franchisees. The store sell down programme and construction of new independent franchisee stores will see company stores at close to 30% of a 90 store network by year end. The residual stores will continue to remain profitable and royalty and services income from independent franchisee stores will grow.
Starbucks Coffee will continue to enjoy stable same store sales. Margins will remain solid, but there will be some pressure from ingredient costs with exchange rate movements.
The Carl’s Jr. business in the new year will see the benefits of the appointment of a new General Manager, a heightened focus on store labour and ingredient costs, some menu rationalisation and the opening of new stores to assist in building critical mass all of which will help to improve both sales and margin.
The new Australian acquisition is expected to contribute to increased profitability from late in the first quarter, but there will be some further one off transaction costs in settling the transaction.
Absent any significant changes in the economic and competitive environment or unusual costs, with both an improved domestic performance and the contribution from the QSR business in Australia from the end of the first quarter, directors expect that the company will deliver a profit result in the new financial year of $28-30 million.
Conclusion With our key New Zealand KFC business in strong heart and the three smaller domestic businesses all on track or gaining traction, the opportunity for seeking further growth across the Tasman is timely. The purchase of a well-established, well-run franchise means that the QSR acquisition is earnings-positive even on a base-case, no growth scenario. However it is our intent to grow the KFC business in Australia through new store development and acquisition and there is considerable opportunity in this large KFC market for both. In the meantime we will continue to see a strong underlying performance from our New Zealand operations for FY17.
Ted van Arkel Chairman
Russel CreedyCEO
ANNUAL REPORT 2016 9

We say “hi” to 71,000 customers every day. That’s 71,000 discrete customer experiences throughout all of our 173 restaurants up and down the country. And tomorrow we will do it again. And again the day after.
Our customers tell us they enjoy their experience, and for all sorts of reasons; the food, the ambience, the service. It’s often a whole group of factors that keeps them coming back quite simply because, for our customers, it feels right.
None of this is by chance.
Committed to our customers
10 RESTAURANT BRANDS NEW ZEALAND LIMITED

Feeding 1,200 hungry high school students could easily have caused Khayt Hanara and her team at plenty of angst. Khayt shared her experience with us.
We looked at catering companies, getting in barbecues and doing the sausage sizzle thing with all of its labour, cost, tools and logistical dramas and thought there has to be a better way. We thought if you can order a pizza or two, surely you can order 200. All the pizzas arrived on time, hot and delicious and the open day event was a HUGE success. Khayt Hanara, Wintec
Food for a thousand?No drama.
Khayt Hanara, Wintec
“ We’ll definitely be having pizza at our next event. ”
ANNUAL REPORT 2016 11

Creating and delivering brand experiences is what Restaurant Brands has been doing for nearly 20 years. We’re a lot better at it now than we were back then.
Staying relevant means holding continuous conversations with customers, and with four brands covering the length and breadth of the country appealing to multiple demographics that’s a lot of talking. It’s also a lot of listening.
Digital earsIn one month alone our customers reach out to us with 75,000 posts on Facebook. The numbers go up when we add Instagram, Twitter and other channels. ‘Listening’ to social media is a full time occupation. Simon Billings is Restaurant Brands’ Digital and Customer Marketing Director and heads up two teams that reflect the different sides of healthy customer dialogue. He sums it up:
“One team speaks to customers via multiple digital channels on behalf of our brands promoting news about deals, new products and sponsorship initiatives; while the other listens to customer issues and suggestions for improvements.”
Adopting the right brand voice in the right social channel is key to mastering healthy dialogue with so many different customers. Explains Simon, “Facebook is typically right for more sales driven, retail oriented communication, while Instagram is very visual and less selling. The messages will be similar but the context is different.” Being and staying relevant means getting this context right. It is key to achieving a strong and dynamic social media following complete with optimum levels of ‘likes’ and ‘shares’.
Rough with the smooth Keeping and encouraging open lines of communication with customers means being prepared to listen and respond to their complaints. With 71,000 transactions every day unfortunately there are a few that don’t go according to plan. But it’s how we deal with customer complaints that defines how good we are at creating and building positive customer experiences overall.
“You have to genuinely care and hear them out for a start. But making a wrong right, in the right way can turn a disgruntled customer into one of your most enthusiastic and loyal advocates,”
A swift response is critical and the business is currently achieving an 80% in 48 hours’ response rate. But true to Restaurant Brands’ culture there is always room to do better. A big initiative undertaking right now is Restaurant Brands’ Guest Experience Management programme or ‘GEM’. Feedback is compiled from all social media and other channels like telephone, blogs, surveys, as well as in person comments made in our stores. Collating and assigning various issues and suggestion opportunities to the right people will allow us to effect a response to the customer as swiftly as possible.
“�Not�impressed�and�upset,�jalapeǹo�poppers now off the menu entirely.”
“ Outstanding customer service! You guys have just made this pregnant lady’s day!”
JESSICA H.from Pakuranga
JESSICA H.from Pakuranga
Our Answer:
Hi Jessica, we have found a way of getting Poppers to you, on us of course. PM us your contact details if you’re keen!
17 Feb 2016 Sourcing
12 RESTAURANT BRANDS NEW ZEALAND LIMITED

All together nowRelationships work both ways and we welcome our customers’ participation in coming up with terrific ideas about how we can make a great brand restaurant experience even better. Geraldine Oldham, Restaurant Brand’s GM Marketing explains how ongoing customer conversations provides valuable learning.
“In-store surveys, website feedback, focus groups and social media channels all help us to discover valuable insights on matters such as how our brands are perceived and how they could be better presented, as well as new product ideas.”
Working with a consistent menu ensures customers get to know and love their favourite tastes, but occasionally it helps to ‘spice up the relationship’ to introduce a new limited time only flavour. And the more we involve the customer in that the better.
KFC’s Build Your Own Burger app a few years back was a prime example of customers having a say in what they wanted.
“We built an interactive app and invited customers to submit their ideas,” explains Geraldine. “We got around 10,000 entries for some extraordinary product ideas from people who love KFC. Our successful Bacon Aioli and Colonel Stack burgers came from this.”
Customers also voted their support for the Double Down experience that made the news back in 2011. So much so that Double Down enjoys regular comebacks onto the menu.
“Maintaining the sort of customer relationships
that create brand loyalty, repeat visits and most importantly sales is about staying relevant through good discipline and processes.” Russel Creedy, Chief Executive Officer
“ It’s like a tradition. Mary-Jane and me and a bucket of original recipe KFC. Chilling out and indulging”
“ It’s funny but once one of us mentions KFC, you know it’s just going to happen.”
Jonathon B.from Wellington
Jonathon B.from Wellington
ANNUAL REPORT 2016 13

Getting it rightBesides product ideas from enthusiastic die-hards, Restaurant Brands invites customers to help redefine and reshape a particular brand experience to make it as meaningful as possible for them.
“The customer was involved when we reinvented and embarked on a transformation of KFC back in 2004, and with Carl’s Jr. beginning to reach critical mass we’ve been applying those principles again,” says Geraldine.
As Carl’s Jr. undergoes its own process of brand definition (see panel for the story so far), Deidre Gourlay, Restaurant Brands’ GM Property recalls the success of the KFC transformation as an indication of what’s to come for Carl’s Jr:
“We had to overhaul the whole KFC brand experience. The US brand owner encouraged
us to adopt their store design but it was clear that it wouldn’t work with Kiwi customers, so we set about developing our own. We needed something to leapfrog the competition and seize the initiative.”
Deidre described it as a wholesale philosophical change. It involved research around the brand’s positioning, 3D imaging, prototype testing and generally asking customers how they felt about the changes being made. KFC, Pizza Hut, Starbucks Coffee and Carl’s Jr. operate in a busy market and it’s critical we deliver an authentic experience that engages all of the senses through the best food, service, store environment and the ambience we create overall.
“Customers can’t necessarily tell you what they want, but they can respond to concepts and share their views about what feels right,” says Deidre. She expands further on the importance of feeling. “We are extremely passionate, which is important because if we don’t feel it ourselves then there’s no way we’ll ever get it right for customers. It means that we, our architects and designers are constantly in a state of ‘creative angst’; we care deeply and balancing authenticity with brand economics is a constantly evolving process – some things work and some don’t.”
But do customers really care about the store environment?
“The fact that KFC sales have increased substantially since is a pretty good indication of the customer’s vote,” says Deidre. “And the US brand owners rolling out our design philosophy around the rest of the world just backs it up. Something we’re all pretty proud of here.”
“ I’ve been looking forward to the opening for ages. The wait was worth it - my burger was amazing and the place looked awesome!” Jill Allen, Christchurch
14 RESTAURANT BRANDS NEW ZEALAND LIMITED
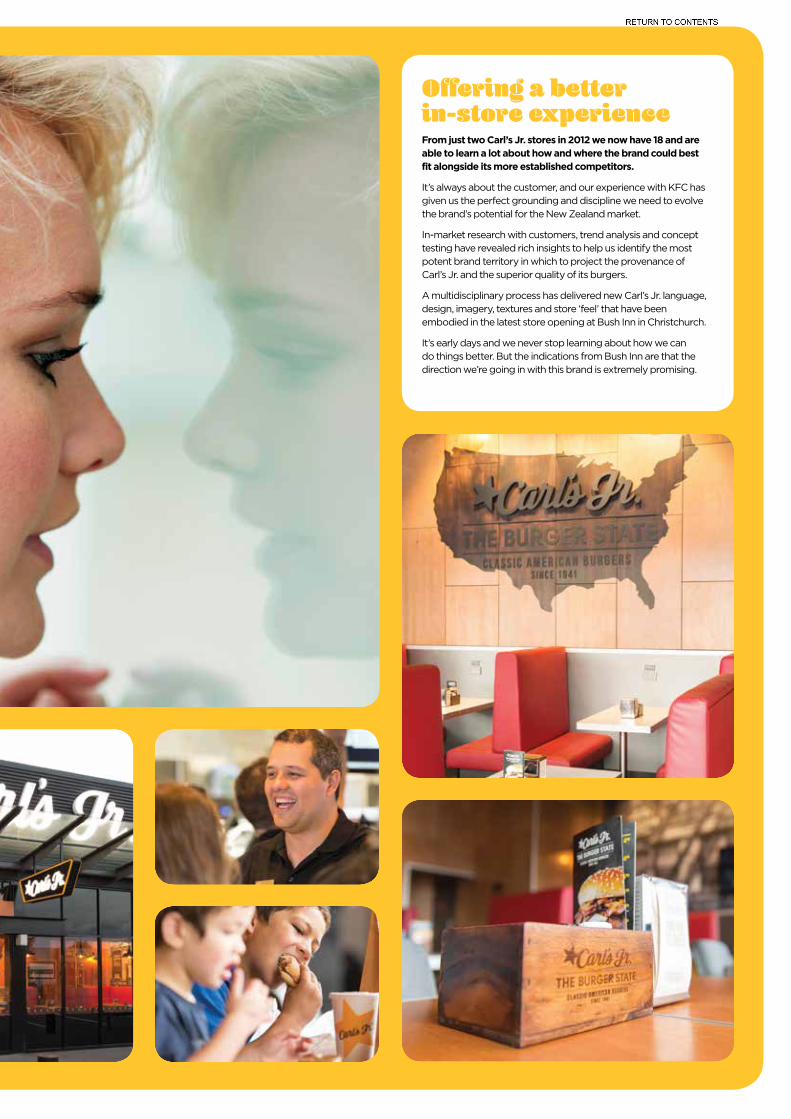
Offering a better in-store experienceFrom just two Carl’s Jr. stores in 2012 we now have 18 and are able to learn a lot about how and where the brand could best fit alongside its more established competitors.
It’s always about the customer, and our experience with KFC has given us the perfect grounding and discipline we need to evolve the brand’s potential for the New Zealand market.
In-market research with customers, trend analysis and concept testing have revealed rich insights to help us identify the most potent brand territory in which to project the provenance of Carl’s Jr. and the superior quality of its burgers.
A multidisciplinary process has delivered new Carl’s Jr. language, design, imagery, textures and store ‘feel’ that have been embodied in the latest store opening at Bush Inn in Christchurch.
It’s early days and we never stop learning about how we can do things better. But the indications from Bush Inn are that the direction we’re going in with this brand is extremely promising.

Where the smiles areGeraldine, Simon and Deidre all agree that building and maintaining positive brand experiences depends on a collective ability to spot and seize the opportunities to surprise and delight the customer. Everyone is responsible, but perhaps none more so than the people who meet and greet our 71 ,000 customers every day – our front line operational staff.
Attitude is all important when recruiting for our stores. Technical skills can be taught but the ability to empathise and connect with people is more difficult to find. It’s an essential character trait in all our successful operations managers because it’s not just about the connection with the customer; it’s about how our regional and area managers personally relate to store managers and restaurant crew.
Jason McMenamin is Restaurant Brands’ GM of Operations. “Recognising people for the work they put in and thanking them is all important. The cook out the back is as important to the customer’s experience as someone front of house”, says Jason.
Store Managers are running big businesses by New Zealand standards and with it comes all of the usual headaches and challenges. Late nights, early mornings, staff rostering issues as well as delivering on performance targets takes a lot of emotional energy.
“You either enjoy it or you don’t. You have to want to be here, to be in this business. It’s full on every day,” says Jason. And he knows all about full on days in retail having earned his stripes at the top end of the retail grocery trade.
“We talk a lot about being ‘Always original.’ Looking at our customers, greeting them with a smile and being authentic every time. But if you enjoy it, it comes naturally. Our managers like people. They are intuitive, able to be out front with customers and read situations and anticipate customer needs. That’s how you surprise and delight.”
Jason is quick to agree with Simon about how dealing with customer problems is just as important, if not more so, as enjoying the upside of happy customers.
“We’re really happy with the 99% of customer visits that go well, but we know that what defines us is how we resolve the 1% that don’t.”
The data emerging from the GEM initiative will help to speed up how we fix anything that’s gone wrong because it will loop specific customer issues back to the respective stores to deal with locally. And there’s nothing more satisfying than turning an unhappy customer around.
Jason’s team are under the pump every day.
“The adrenalin, the challenges that come with managing the peaks and the troughs of demand and always having the customer’s experience front of mind – it’s all part of the job. Customers love it when they come in the door for their regular flat white and breakfast order and it’s ready and waiting for them on the counter.
It’s tough but it’s all good. And for an inspired, happening customer-oriented store crew, it’s a lot of fun. Let’s not forget that.”
Now, apparently we have an order for 7 1,000 people to prepare for.
Jason McMenamin is Restaurant Brands’ GM of Operations
“ Always having the customer’s experience front of mind – it’s all part of the job. ”
16 RESTAURANT BRANDS NEW ZEALAND LIMITED

The best service ever Daniel didn’t expect much from Starbucks. He doesn’t even like coffee. But when a visiting friend raved about Starbucks he thought he’d surprise his wife and grab her a coffee from his local Starbucks in Rotorua.
“I was blown away by Cathi’s (Starbucks Store Manager) welcoming smile and personality. She was so engaging and genuinely interested in helping me to surprise my wife with a great coffee. And that’s all fine. But then when I popped back in over the weekend there was Cathi again, big smile – and she remembered my name, asked how I was and how my wife found the coffee I’d bought earlier in the week. Truly outstanding when someone takes time to make you feel special and valued.
Now my wife and I are Starbucks regulars. I walk the extra block, past several coffee shops to get my chocolate and my wife’s coffee. Great service, great experience – that’s all it takes. Well done Cathi and the Starbucks Rotorua team.”
ANNUAL REPORT 2016 17

“ My slice of heaven!”Katie 3 January 2016
58 28 318 RESTAURANT BRANDS NEW ZEALAND LIMITED

Total sales of stores operated by Restaurant Brands were down 7.2% over the year to $44.9 million, due to lower store numbers as the company sold a further six stores to independent franchisees. Same store sales for company stores grew 2.6% over the year with particularly strong sales growth in the fourth quarter – increasing by 8.8% with the benefit of the launch of a new mobile-friendly Pizza Hut website and a revised menu. Sales from the 89 store Pizza Hut network increased in total by 7.2% over an equivalent period.
Earnings from company stores were adversely impacted by both sales of profitable stores to independent franchisees and some increases in labour and ingredient costs, principally cheese. EBITDA for the year was $4.9 million, down $1.5 million on FY15. This represented 10.9% of sales versus 13.2% last year, but still within the company’s expected margin range.
Customer service levels as measured by the Guest Experience Survey (GES) slipped slightly to 88% (versus 89% in the prior year), but remain very high.
Staff turnover was 71%, well up on the prior year’s 59%, principally a reflection of the level of store sell down in the year.
Pizza Hut saw a small increase in total accident claims from 20 to 22 for the year despite a continued focus on staff safety. Lost time injuries per million hours remained constant at five.
During the year six more stores were sold to independent franchisees as part of the strategy of selling regional and lower volume stores. In addition two new-built independent franchisee stores were added to the network through the year. The pace of selling will continue at the current rate with high levels of interest from potential buyers as well as opportunities to develop new sites. Company owned stores had reduced to 39, out of a total of 89 in the market by the end of the year.
Pizza Hut is expected to deliver another year of positive same store growth. There will be continued sales of stores to independent franchisees as and when opportunities present which is likely to decrease Restaurant Brands’ overall sales versus the 2016 year. However network sales will continue to increase. The margin percentage is expected to remain constant and within the company’s expected 10-12% range with the USD continuing to be stronger versus the NZD.
PIZZA HUT OPERATIONS
A topping experience
426 39+50 Franchised
Total Sales ($NZm)
Total Store EBITDA ($NZm)
Total Assets ($NZm)
Staff Stores
44.948.448.447.945.559.3
6.45.53.8
5.6
131211 14 15 16
4.9
131211 14 15 16
14.8
131211 14 15 16
2.1
16.514.817.222.927.3
ANNUAL REPORT 2016 19

KFC enjoyed another strong year in terms of sales and profit performance. Innovative new product development, the ongoing programme of significant store upgrades, better customer experience and higher levels of marketing and promotion activity, all contributed to driving sales to an all-time high of $282.5 million. Same store sales growth started very strongly with the first half delivering same store sales growth of +8.8% and finishing the full year at +6.3% (compared with +7.7% last year).
New burgers were very much a part of the growth with such innovations as Aioli Bacon Burger, Sour Cream & Sweet Chilli Burger and Bacon & Avocado Burger all proving successful launches. However the base chicken business delivered solid sales growth as well. Sponsorship of the New Zealand Super Rugby franchises as well as the Cricket World Cup also contributed strongly to brand awareness.
Earnings also increased strongly, with EBITDA up $6.4 million or 12.6% on prior year to $57.2 million. Good sales leverage and low levels of raw material price increases all assisted in driving better margins. These benefits were somewhat offset by higher labour costs as KFC reinvested in store labour to improve customer experience and higher levels of marketing expenditure. As a percentage of sales, EBITDA was 20.1% in the first half, climbing to 20.2% for the full year, up on last year’s 19.2%.
Store transformations continued during the year with a total of four stores receiving major upgrades. In addition a further fourteen stores undertook five and ten year minor upgrades. The major transformation process is now nearly complete with 86 out of the company’s 91 stores now either new or fully transformed.
The total stores in the network remained at 91 over the year with the opening of a new store at Albany in the first quarter and the closure of an under-performing store in Kaikohe in the third quarter.
Staff turnover was 56.2%, up on the previous year’s 47.4% with an overall reduction in headcount the main driver.
The number of accidents in our KFC stores increased slightly to 169 from 151 in the previous year. The actual lost time injuries per million hours increased to twelve, compared with six per million in the prior year. There is a continued focus in the business to reduce injuries in store.
KFC has seen a continuation of the strong sales and margin performance into the FY17 financial year and is expected to deliver another solid result (although not at the incremental levels seen in the past two years). The brand will continue to actively pursue its store upgrade programme to completion with two to three major upgrades planned for the new financial year. KFC is Restaurant Brands’ largest and most profitable brand and it continues to deliver excellent results for the company and its shareholders.
KFC OPERATIONS
Delicious results
2,032 91Total Sales ($NZm)
Total Store EBITDA ($NZm)
Total Assets ($NZm)
Staff Stores
282.5
131211 14 15 16
57.2
131211 14 15 16
76.3
131211 14 15 16
265.0
50.8
75.8
241.5
44.5
64.0
237.0
45.3
74.3
236.3
45.6
70.5
235.8
52.1
71.5
+6 Franchised
20 RESTAURANT BRANDS NEW ZEALAND LIMITED

TattoodevotionUce Bigalow 28 September 2015 "this how much i love you @kfcnz"
2,047 641 67ANNUAL REPORT 2016 21
“ Coffee Queen!”Gemma 20 April 2015
45 36 8
22 RESTAURANT BRANDS NEW ZEALAND LIMITED

FY16 brought improved profit performance over the FY15 year resulting in another record result. Earnings increased 3.7% for the year to $4.4 million driven by further strong sales growth and continuing store efficiencies. These factors were somewhat hampered by a weakening of the exchange rate during the year, driving input costs higher. The net result was a slight increase in EBITDA margin, rising from 16.3% of sales to 16.4%.
Total sales were up 2.9% to $26.8 million and same store sales were up 6.9% (5.1% in FY15) with increases across the board and strong sales of popular limited time offerings like the Espresso Confections and Christmas selection.
Capital expenditure increased on the back of continued investment in the store refurbishment programme. However decreases in inventory held at year end resulted in a net decrease in total assets. This lifted the already high return on investment maintained by the brand.
Store numbers at year end were 25, one fewer than last year with the closure of the Courtenay Place store in Wellington at lease end.
Staff (or partner) turnover saw a small increase this year to 57.7% (52% in FY15), following three years of reductions from a high of 70% in FY13.
The continued focus on workplace safety led to an improved safety record on the previous year. While the total number of accidents in our Starbucks stores remained steady at 15, the actual lost time injuries per million hours halved this year to three, compared with six per million in the prior year.
With its niche position among branded chains in the New Zealand coffee marketplace and following strong momentum built in the previous two years, the Starbucks Coffee brand continues to deliver steady growth and excellent returns for shareholders. Same store sales growth is expected to remain stable this year with a slightly lower EBITDA margin due to the continuing impact of the lower NZD. There will be further capital reinvestment in store refurbishment over the new year.
STARBUCKS COFFEE OPERATIONS
It must be love
288 25Total Sales ($NZm)
Total Store EBITDA ($NZm)
Total Assets ($NZm)
Staff Stores
26.8
131211 14 15 16
4.4
131211 14 15 16
4.5
131211 14 15 16
26.1
5.0
4.3
25.0
4.0
3.5
25.1
4.9
2.9
26.5
5.8
3.7
29.3
6.7
4.1
ANNUAL REPORT 2016 23

CARL’S JR. OPERATIONS
Committed courtship
FY16 saw an improvement in the profit performance for the Carl’s Jr. brand with the integration of the seven acquired stores giving increased scale. New menu rollout and localising the source of a number of inventory items towards the end of FY16 also assisted in improving margin. However, increased marketing investment together with higher labour costs detracted from margin growth.
Sales grew by 66.3% from $20.1 million to $33.4 million with the impact of stores opened and acquired in the Forsgren acquisition in FY15 being open for a full year. Same store sales continued to remain negative with Carl’s Jr. having to roll over often significant new store opening sales volumes in prior periods. As the brand begins to mature sales will move to more consistent levels.
Store numbers remained constant at 18 throughout the year with no new store openings. The brand is yet to realise the growth opportunities available in the Wellington and South Island markets. However, the construction of two new stores in Christchurch which opened at the start of the FY17 year will build brand awareness in the South Island.
Profitability continues to be a challenge but the brand saw an improvement in the second half of the year. Marketing expenditure was increased to drive brand awareness off a small base. The brand saw an improvement in cost of sales after the major industrial action in the West Coast US ports led to alternative sources of supply in the latter half of the previous year together with a greater focus on inventory management.
The resulting EBITDA margin was up marginally on prior year’s $0.2 million to $0.4 million (1.3% of sales).
Staff turnover was 64%, down on the prior year’s 70%, and remained in part a reflection of the integration of the seven acquired stores and centralised recruitment.
Carl’s Jr. total accident claims in the year of 21 were up slightly from the prior year of 20 despite a continued focus on staff safety. Lost time injuries per million hours were three compared with no claims in the previous year.
The Carl’s Jr. brand is positioned to make an improvement in profitability in FY17. An experienced management team is in place and a number of new product initiatives are in the pipeline, supported by increased marketing investment. These, combined with further planned store roll outs in Christchurch and other locations, will produce sales and margin growth over FY17.
359 18Total Sales ($NZm)
Total Store EBITDA ($NZm)
Total Assets ($NZm)
Staff Stores
33.4
13 14 15 16
13 14 15 16
28.2
13 14 15 16
20.1
29.1
14.3
14.4
1.9
0.40.2
-(0.5)
8.1
24 RESTAURANT BRANDS NEW ZEALAND LIMITED

“ My kinda cake!”Jake 6 October 2015
71 16 12
ANNUAL REPORT 2016 25

Board of Directors
Ted van Arkelfnzim Chairman and Independent Non-Executive Director
Term of Office Appointed Director 24 September 2004 and appointed Chairman 21 July 2006, last re-elected 2015 Annual Meeting.
Board Committees Member of the Audit and Risk Committee and Appointments and Remuneration Committee.
Mr van Arkel has been a professional director since retiring from the position of Managing Director of Progressive Enterprises Limited in November 2004. Mr van Arkel currently serves as Chairman of The Warehouse Group Limited. Other NZX listed company directorships are AWF Madison Group Limited and Abano Healthcare Group Limited. He is also a director of the Auckland Regional Chamber of Commerce & Industry Limited. Mr van Arkel also serves as a director of a number of private companies including Philip Yates Family Holdings Limited, Danske Mobler Limited and his family-owned companies Lang Properties Limited and Van Arkel & Co Limited.
Sue Sucklingb.tech (hons), m.tech (hons), obe Independent Non-Executive Director
Term of Office Appointed Director 9 June 2006, last re-elected 2014 Annual Meeting.
Board Committees Chairman of the Appointments and Remuneration Committee and Member of Audit and Risk Committee.
Ms Suckling is a professional director with over 20 years governance experience with public and private companies. She is currently Chairman of the New Zealand Qualifications Authority, ECL Group Limited, Jacobsen Holdings Limited, Callaghan Innovation and Lincoln Hub. She is a director of SKYCITY Entertainment Group Limited and a trustee of Ministry of Awesome.
Danny Diab dip cd, pgdip cm, ficm, faicd
Non-Executive Director
Term of Office Appointed Director 17 October 2002, last re-elected 2012 Annual Meeting.
Board Committees Member of the Audit and Risk Committee and Appointments and Remuneration Committee.
Mr Diab is based in Australia where he owns a number of investment companies in addition to other business interests. He has more than 29 years’ experience in the food industry and 15 years in manufacturing and supply chain. He has worked as a consultant specialising in the areas of business improvement and restructure, mergers and acquisitions.
26 RESTAURANT BRANDS NEW ZEALAND LIMITED

Hamish Stevensm.com (hons), mba, ca Independent Non-Executive Director
Term of Office Appointed Director 8 May 2014, last re-elected 2014 Annual Meeting.
Board Committees Chairman of the Audit and Risk Committee and Member of Appointments and Remuneration Committee.
After considerable experience in a number of senior corporate roles including both operational and financial management in such large companies as DB Breweries Limited and Heinz-Watties Limited, Hamish became a professional director in 2010. He is currently Chairman of The Kennedys Limited and East Health Services Limited and is a director of Counties Power Limited, Asure Quality Limited, Smart Environmental Limited, Dairy Technical Services Limited and Botany Health Hub Limited. He is a director and shareholder of Governance & Advisory Limited. A qualified chartered accountant, Hamish also chairs the audit committees for a number of these companies and is the independent chairman of the Audit and Risk Committee of the Waikato Regional Council.
Stephen Copulos Non-Executive Director
Term of Office Appointed Director 27 April 2016.
Board Committees Member of Appointments and Remuneration Committee and Audit and Risk Committee.
Mr Copulos joins Restaurant Brands as a Non-Executive Director following the acquisition of QSR Pty Ltd in NSW, Australia. He has over thirty five years’ experience in a variety of businesses and investments across a wide range of industries including fast food and hospitality, manufacturing, property development and mining and has extensive experience as a company director of both listed and unlisted public companies in Australia, UK and USA. He is Managing Director of the Copulos Group of companies as well as a director of over 50 private companies and trusts within the Copulos Group. He is executive Chairman of MC Pipes Pty Ltd and Icon Septech (VIC) Pty Ltd and Chairman of a portfolio of regional motels and apartments in Victoria, under the Quest and Choice Hotels Brands. He is president of various USA LLC’s.
He is also chairman of and a major shareholder in ASX listed companies Crusader Resources Limited, Blackrock Mining Limited and Consolidated Zinc Limited.
ANNUAL REPORT 2016 27

Committed also means being community spirited
Our vision is to be the leading operator of enduring and innovative QSR brands in New Zealand. That’s why we’re committed to doing business guided by principles of sustainability. These principles help form our menus and management practices; our people and the way we contribute to the communities we serve.Four interdependent elements; People, Food, Planet and Progress comprise the core aspects of our Corporate Social Responsibility ethos and sustain the health and vitality of our company. We set out below our Corporate Social Responsibility KPIs and progress for the new financial year in relation to each of these elements.
People Restaurant Brands depends on the support of Kiwi consumers and partnerships with employees,suppliers, franchisees and investors. We employ 3,363 people aged from 16-70 nationwide and serve over 71,000 customers every day. We:
• Provide guaranteed minimum hours of work. We offer a consistent framework around working hours that improves the certainty of work and allows for the company and our employees to plan ahead.
• Offer competitive remuneration to attract and retain skilled employees and regularly refresh our remuneration model to ensure market parity across the business.
• Invest in our people through training and education programmes across all our brands and provide a clear career path for talented employees. E-learning programmes are now in place for a large proportion of our staff to build their competencies and skills in the field.
CORPORATE SOCIAL RESPONSIBILITY
28 RESTAURANT BRANDS NEW ZEALAND LIMITED

• Place the health and safety of our employees as our top priority. We are proud of the excellent record for workplace health and safety and we will not stop until we achieve our target; zero loss of workdays from injury across all our brands.
• Are an equal opportunity employer and embrace and reflect the diversity of the communities that we operate in. We provide employment for many new New Zealanders and opportunities to make a first start in the workforce. With more than half of our workforce being female (together with a significant proportion of senior management) we are committed to true gender balance.
• Continue our involvement with charitable and community organisations and review our efforts on an ongoing basis to ensure they remain relevant and valuable to the communities we serve.
Our significant partnership with Surf Life Saving New Zealand underscores our commitment to community causes. We have been a charity partner since 2012 and in addition to raising funds for charity we are committed to assisting Surf Life Saving New Zealand with educating people how to stay safe at the beach through a multi-lingual water safety education campaign.
FoodRestaurant Brands serves great tasting, safe food with seasonally and locally sourced ingredients. We:
• Constantly make improvements to the nutritional composition of our food with a focus on sodium, sugar and saturated fat reduction.
• Provide detailed nutritional information about our products online to enable our customers to make informed choices.
• Ensure food safety through continuous external and internal review programmes.
• Support our trusted local suppliers and responsible industry practices as part of our ethical purchasing and procurement.
Paul Dalton (CEO Surf Life Saving New Zealand) and Clark Wilson (KFC Marketing Director) enjoy a bucket of chicken at the Mairangi Bay Surf Club Partner meeting. The KFC Surf Life Saving bucket promotion ran for 6 weeks last October/November and raised more than $140,000.
ANNUAL REPORT 2016 29

CSR Performance Measures
Category MeasureOutcome
FY2016Outcome
FY2015
Workplace Safety Number of lost time incidents per million hours worked 23 17
Staff Turnover As a % of average total staff on a rolling annual basis 60% 51%
Gender Diversity % of women employed at all levels 54% 53%
Community Total funds raised for charitable and community organisations $180,000 $222,000
Recycling % of cardboard and paper waste from back of house operations recycled 100% 100%
% of oil from back of house operations recycled 100% 100%
Energy Conservation Kilowatts of energy used in electricity and gas per $million of sales (excluding Restaurant Brands support centre) 137,000kw 140,000kw
More InformationA full copy of our CSR Statement can be found on our website: www.restaurantbrands.co.nz
PlanetRestaurants Brands is conscious of the impact its operations has on the environment and we are always working to minimise waste, maximise energy efficiency and use resources carefully. We:
• Continue to source all packaging from sustainable timbers.
• Continue with initiatives that see all cardboard and paper collected for recycling and cooking oil reprocessed for bio-diesel and soap.
• Are a member of the Public Place Recycling Scheme (PPRS), a programme which helps New Zealanders to recycle and reduce litter away from home.
• Actively participate in energy saving initiatives including monitoring live power usage in our stores to reduce peak load.
ProgressRestaurant Brands continues to proactively and fairly reward all its stakeholders. We have:
• Since 2004, invested $116 million in the KFC and Carl’s Jr. store network including building 22 new stores.
• Created up to 40 new jobs per new KFC store and Carl’s Jr. store, a total of 160 over the past two years.
• Paid our staff $104 million in salaries and wages this year, up from $95 million in the prior year.
• Paid $20 million in dividends to our investors this year.
• As a responsible corporate citizen, paid $11 million in income tax and $23 million in goods and services tax this year.
30 RESTAURANT BRANDS NEW ZEALAND LIMITED

Consolidated income statement for the 52 week period ended 29 February 2016
$NZ000’s
29 February 2016
52 weeksvs Prior
%
2 March 2015
53 weeks
SalesKFC 282,531 6.6 265,038Pizza Hut 44,871 (7.2) 48,364Starbucks Coffee 26,811 2.9 26,067
Carl's Jr. 33,351 66.3 20,059Total sales 387,564 7.8 359,528
Other revenue 16,531 26.4 13,075Total operating revenue 404,095 8.5 372,603
Cost of goods sold (329,983) (8.5) (304,190)Gross margin 74,112 8.3 68,413
Distribution expenses (2,505) (7.9) (2,321)Marketing expenses (20,654) (9.3) (18,892)General and administration expenses* (16,434) (8.8) (15,105)
EBIT before non-trading 34,519 7.6 32,095
Non-trading (452) (134.0) 1,328EBIT 34,067 1.9 33,423
Interest expense (991) (3.1) (961)Net profit before taxation 33,076 1.9 32,462
Taxation expense (9,006) (4.3) (8,632)Total profit after taxation (NPAT) 24,070 1.0 23,830
Total NPAT excluding non-trading 24,207 7.5 22,523
% Sales % Sales
EBITDA before G&AKFC 57,150 20.2 12.6 50,777 19.2
Pizza Hut 4,902 10.9 (23.0) 6,365 13.2
Starbucks Coffee 4,409 16.4 3.7 4,253 16.3
Carl's Jr. 439 1.3 186.9 153 0.8
Total 66,900 17.3 8.7 61,548 17.1
RatiosNet tangible assets per security (net tangible assets divided by number of shares) in cents 56.3c 51.2c
Cost of goods sold are direct costs of operating stores: food, paper, freight, labour and store overheads.
Distribution expenses are costs of distributing product from store.
Marketing expenses are advertising and local store marketing expenses.
General and administration expenses (G&A) are non-store related overheads.
* Included in general and administration expenses is a $1.2 million charge (2015: $0.3 million) relating to the long term incentive scheme
(“LTI Scheme”) the Group entered into with the Chief Executive Officer. Refer to Note 19 of the financial statements for further details.
ANNUAL REPORT 2016 31

Non-GAAP Financial Measuresfor the 52 week period ended 29 February 2016
The Group results are prepared in accordance with New Zealand Generally Accepted Accounting Practice (“GAAP”) and comply with International Financial Reporting Standards (“IFRS”). These financial statements include non-GAAP financial measures that are not prepared in accordance with IFRS. The non-GAAP financial measures used in this presentation are as follows:
1. EBITDA before G&A. The Group calculates Earnings Before Interest, Tax, Depreciation and Amortisation (“EBITDA”) before G&A (general and administration expenses) by taking net profit before taxation and adding back (or deducting) net financing expenses, non-trading items, depreciation, amortisation and G&A. The Group also refers to this measure as Concept EBITDA before G&A. The term Concept refers to the Group’s four operating segments comprising KFC, Pizza Hut, Starbucks Coffee and Carl’s Jr. The term G&A represents non-store related overheads.
2. EBIT before non-trading. Earnings before interest and taxation (“EBIT”) before non-trading is calculated by taking net profit before taxation and adding back (or deducting) net financing expenses and non-trading items.
3. Non-trading items. Non-trading items represent amounts the Group considers unrelated to the day to day operational performance of the Group. Excluding non-trading items enables the Group to measure underlying trends of the business and monitor performance on a consistent basis.
4. EBIT after non-trading items. The Group calculates EBIT after non-trading items by taking net profit before taxation and adding back net financing expenses.
5. Total NPAT excluding non-trading. Total Net Profit After Taxation (“NPAT”) excluding non-trading items is calculated by taking profit after taxation attributable to shareholders and adding back (or deducting) non-trading items whilst also allowing for any tax impact of those items.
6. Capital expenditure including intangibles. Capital expenditure including intangibles represents additions to property, plant and equipment and intangible assets.
The Group believes that these non-GAAP measures provide useful information to readers to assist in the understanding of the financial performance and position of the Group but that they should not be viewed in isolation, nor considered as a substitute for measures reported in accordance with IFRS. Non-GAAP measures as reported by the Group may not be comparable to similarly titled amounts reported by other companies.
The following is a reconciliation between these non-GAAP measures and net profit after taxation:
$NZ000’s Note* 2016 2015
EBITDA before G&A 1 66,900 61,548Depreciation (16,512) (15,008)Loss on sale of property, plant and equipment (included in depreciation) (243) -Amortisation (included in cost of sales) (1,797) (1,628)General and administration – area managers, general managers and support centre (13,829) (12,817)EBIT before non-trading 2 34,519 32,095Non-trading items** 3 (452) 1,328EBIT after non-trading items 4 34,067 33,423Net financing costs (991) (961)Net profit before taxation 33,076 32,462Income tax expense (9,006) (8,632)Net profit after taxation 24,070 23,830Add back / (deduct) non-trading items 452 (1,328)Income tax on non-trading items (315) 21Net profit after taxation excluding non-trading items 5 24,207 22,523
* Refers to the list of non-GAAP measures as listed above.** Refer to Note 2 of the financial statements for an analysis of non-trading items.
32 RESTAURANT BRANDS NEW ZEALAND LIMITED

Financial Statements2016
Restaurant Brands is pleased to present a new structure for our financial statements. The new structure is designed to improve the clarity and usefulness of this report.
Note disclosures are now grouped into five sections which the Directors consider most relevant when evaluating the financial performance of Restaurant Brands.
The sections are:Performance Notes 1-5Funding and equity Notes 6-9Working capital Notes 10-12Long term assets Notes 13-14Other notes Notes 15-25
Significant accounting policies which are relevant to an understanding of the financial statements and summarise the measurement basis used are provided throughout the notes and are denoted by the highlighted text surrounding them.
There has also been a rationalisation of disclosures. Disclosures have been removed where they are considered to be duplicated, immaterial, or in the case of some accounting policies, merely a repeat of a mandatory accounting standard.
Contents34 Directors’ statement35 Consolidated statement of
comprehensive income36 Consolidated statement of changes in equity37 Consolidated statement of financial position38 Consolidated statement of cash flows40 Basis of preparation41 Notes to and forming part of the
financial statements
#onlyeyesforpizza
ANNUAL REPORT 2016 33
Directors’ statementfor the 52 week period ended 29 February 2016
For and on behalf of the Board of Directors:
E K van ArkelChairman
14 April 2016
H W Stevens Director
14 April 2016
The Directors of Restaurant Brands New Zealand Limited (Restaurant Brands) are pleased to present the financial statements for Restaurant Brands and its subsidiaries (together the Group) for the 52 week period ended 29 February 2016 contained on pages 35 to 59.Financial statements for each financial year fairly present the financial position of the Group and its financial performance and cash flows for that period and have been prepared using appropriate accounting policies, consistently applied and supported by reasonable judgments and estimates and all relevant financial reporting and accounting standards have been followed.
Proper accounting records have been kept that enable, with reasonable accuracy, the determination of the financial position of the Group and facilitate compliance of the financial statements with the Financial Markets Conduct Act 2013.
Adequate steps have been taken to safeguard the assets of the Group to prevent and detect fraud and other irregularities.
The Directors hereby approve and authorise for issue the financial statements for the 52 week period ended 29 February 2016.
34 RESTAURANT BRANDS NEW ZEALAND LIMITED

Consolidated statement of comprehensive incomefor the 52 week period ended 29 February 2016
$NZ000’s Note 2016 2015
Store sales revenue 1 387,564 359,528Other revenue 1 16,531 13,075Total operating revenue 404,095 372,603Cost of goods sold (329,983) (304,190)Gross profit 74,112 68,413Distribution expenses (2,505) (2,321)Marketing expenses (20,654) (18,892)General and administration expenses (16,434) (15,105)EBIT before non-trading 34,519 32,095Non-trading 2 (452) 1,328 Earnings before interest and taxation (EBIT) 1 34,067 33,423Net financing expenses 6 (991) (961)Profit before taxation 33,076 32,462Taxation expense 15 (9,006) (8,632)Profit after taxation attributable to shareholders 24,070 23,830
Items that may be reclassified subsequently to the statement of comprehensive incomeDerivative hedging reserve (124) (207)Income tax relating to components of other comprehensive income 35 58Other comprehensive income net of tax (89) (149)Total comprehensive income attributable to shareholders 23,981 23,681
Basic earnings per share from total operations (cents) 4 24.59 24.35Diluted earnings per share from total operations (cents) 4 24.59 24.35
The accompanying accounting policies and notes form an integral part of the financial statements.
Because Jono drives like a maniac gotta protect the babies!
49 Likes 17 Comments
FollowingJess.J.14 April
Like Comment Share
ANNUAL REPORT 2016 35

Consolidated statement of changes in equityfor the 52 week period ended 29 February 2016
$NZ000’s NoteShare
capital
Foreigncurrency
translationreserve
Derivativehedgingreserve
Retainedearnings Total
For the 53 week period ended 2 March 2015
Balance at the beginning of the period 26,756 53 - 37,847 64,656
Comprehensive incomeTotal profit after taxation attributable to shareholders - - - 23,830 23,830
Other comprehensive incomeMovement in derivative hedging reserve - - (149) - (149)Total other comprehensive income - - (149) - (149)
Total comprehensive income - - (149) 23,830 23,681
Transactions with ownersNet dividends distributed 5 - - - (17,127) (17,127)Total transactions with owners - - - (17,127) (17,127)
Balance at the end of the period 9 26,756 53 (149) 44,550 71,210
For the 52 week period ended 29 February 2016
Balance at the beginning of the period 26,756 53 (149) 44,550 71,210
Comprehensive incomeTotal profit after taxation attributable to shareholders - - - 24,070 24,070
Other comprehensive incomeMovement in derivative hedging reserve - - (89) - (89)Total other comprehensive income - - (89) - (89)
Total comprehensive income - - (89) 24,070 23,981
Transactions with ownersNet dividends distributed 5 - - - (19,574) (19,574)Total transactions with owners - - - (19,574) (19,574)
Balance at the end of the period 9 26,756 53 (238) 49,046 75,617
The accompanying accounting policies and notes form an integral part of the financial statements.
36 RESTAURANT BRANDS NEW ZEALAND LIMITED

Consolidated statement of financial positionas at 29 February 2016
$NZ000’s Note 2016 2015
Non-current assetsProperty, plant and equipment 13 100,641 100,300Intangible assets 14 20,549 21,060Deferred tax asset 15 5,994 4,933Total non-current assets 127,184 126,293Current assetsInventories 10 8,565 9,475Trade and other receivables 11 2,955 7,262Cash and cash equivalents 1,093 1,575Total current assets 12,613 18,312Total assets 139,797 144,605Equity attributable to shareholdersShare capital 9 26,756 26,756Reserves (185) (96)Retained earnings 49,046 44,550Total equity attributable to shareholders 75,617 71,210Non-current liabilitiesProvision for employee entitlements 16 470 429Deferred income 17 5,267 5,345Loans 6 12,675 22,550Total non-current liabilities 18,412 28,324Current liabilitiesIncome tax payable 2,836 3,422Creditors and accruals 12 41,285 39,955Provision for employee entitlements 16 317 268Deferred income 17 999 1,219Derivative financial instruments 7 331 207Total current liabilities 45,768 45,071Total liabilities 64,180 73,395Total equity and liabilities 139,797 144,605
The accompanying accounting policies and notes form an integral part of the financial statements.
Shout out to $5 Wicked Wings lunch meals for getting me through the past 6 years
105 Likes 36 Comments
FollowingYasmin Dela Cruz17 May
Like Comment ShareANNUAL REPORT 2016 37

Consolidated statement of cash flowsfor the 52 week period ended 29 February 2016
The accompanying accounting policies and notes form an integral part of the financial statements.
$NZ000’s Note 2016 2015
Cash flows from operating activitiesCash was provided by / (applied to): Receipts from customers 403,960 372,230 Payments to suppliers and employees (348,044) (325,561) Interest paid (net) (986) (1,044) Payment of income tax (10,618) (9,159)Net cash from operating activities 44,312 36,466
Cash flows from investing activitiesCash was (applied to) / provided by: Acquisition of business - (10,388) Payment for intangibles (1,663) (2,836) Purchase of property, plant and equipment (19,157) (28,184) Proceeds from disposal of property, plant and equipment 2,667 8,384 Landlord contributions received 2,808 -Net cash used in investing activities (15,345) (33,024)
Cash flows from financing activitiesCash was provided by / (applied to): (Decrease) / increase in loans (9,875) 14,490 Dividends paid to shareholders 5 (19,574) (17,127)Net cash used in financing activities (29,449) (2,637)
Net (decrease) / increase in cash and cash equivalents (482) 805
Reconciliation of cash and cash equivalentsCash and cash equivalents at the beginning of the period: 1,575 770
Cash and cash equivalents at the end of the period: Cash on hand 218 222 Cash at bank 875 1,353
1,093 1,575
Net (decrease) / increase in cash and cash equivalents (482) 805
38 RESTAURANT BRANDS NEW ZEALAND LIMITED
Consolidated statement of cash flows (continued)for the 52 week period ended 29 February 2016
$NZ000’s 2016 2015
Reconciliation of profit after taxation with net cash from operating activitiesTotal profit after taxation attributable to shareholders 24,070 23,830Add items classified as investing / financing activities:Gain on disposal of property, plant and equipment (1,718) (2,598)
(1,718) (2,598)Add / (less) non-cash items:Depreciation 16,512 15,008Disposal of goodwill 489 283(Decrease) / increase in provisions (213) 225Amortisation of intangible assets 1,797 1,628Write-off of franchise fees 39 23Impairment on property, plant and equipment (101) 94Net increase in deferred tax asset (1,026) (1,223)Change in fair value of derivative financial instruments - (6)
17,497 16,032Add / (less) movement in working capital:Decrease / (increase) in inventories 910 (7,888)Increase in trade receivables (135) (373)Decrease / (increase) in other debtors and prepayments 2,142 (4,992)Increase in trade creditors and other payables 2,132 11,759(Decrease) / increase in income tax payable (586) 696
4,463 (798)Net cash from operating activities 44,312 36,466
The accompanying accounting policies and notes form an integral part of the financial statements.
It’s a Wicked Wings crown @kfcnz#KRCkween
93 Likes 16 Comments
FollowingLucy Zee3 hrs - Instagram
Like Comment Share
ANNUAL REPORT 2016 39

Basis of preparationfor the 52 week period ended 29 February 2016
1. Reporting entityThe reporting entity is the consolidated group (the “Group”) comprising the economic entity Restaurant Brands New Zealand Limited (the “Company”) and its subsidiaries. Restaurant Brands New Zealand is a limited liability company incorporated and domiciled in New Zealand. The principal activity of the Group is the operation of quick service and takeaway restaurant concepts in New Zealand.
Restaurant Brands New Zealand Limited is registered under the Companies Act 1993 and is a FMC reporting entity under Part 7 of the Financial Markets Conduct Act 2013. The address of its registered office is Level 3, Building 7, Central Park, 666 Great South Road, Penrose, Auckland.
The Company is listed on the New Zealand Stock Exchange (“NZX”) and is an issuer in terms of the Financial Reporting Act 1993.
The Group is designated as a profit oriented entity for financial reporting purposes.
The following subsidiary companies are all wholly owned and incorporated in New Zealand, have a 29 February balance date and have been owned for the full financial year:
Restaurant operating companies
Investment holding companies
Property holding company
Employee share option plan trust company
Non-trading subsidiary company
Restaurant Brands Limited Restaurant Brands Australia Pty Limited (incorporated in Victoria, Australia)
RB Holdings Limited RBP Holdings Limited RBDNZ Holdings Limited RBN Holdings Limited
Restaurant Brands Properties Limited
Restaurant Brands Nominees Limited
Restaurant Brands Pizza Limited
2. Basis of preparationThe financial statements of the Group have been prepared in accordance with:— New Zealand Generally Accepted Accounting Practice (“NZ GAAP”)— Part 7 of the Financial Markets Conduct Act 2013— NZX Main Board Listing Rules
They comply with New Zealand equivalents to International Financial Reporting Standards (“NZ IFRS”), NZ IFRIC interpretations, and other applicable Financial Reporting Standards, as appropriate for profit oriented entities. The financial statements comply with International Financial Reporting Standards (“IFRS”) as issued by IASB.
In accordance with the Financial Markets Conduct Act 2013 because group financial statements are prepared for Restaurant Brands New Zealand and its subsidiaries, separate financial statements for Restaurant Brands New Zealand Limited are no longer required to be prepared and presented.
The measurement basis adopted in the preparation of these financial statements is historical cost, modified by the revaluation of certain investments and financial instruments as identified in the accompanying notes. The financial statements are presented in New Zealand dollars, rounded where necessary to the nearest thousand dollars. The Group divides its financial year into 13 four-week periods. The 2016 full year results are for 52 weeks (2015: 53 weeks).
The principal accounting policies applied in the preparation of these financial statements are set out in the accompanying notes where an accounting policy choice is provided by NZ IFRS, is new or has changed, is specific to the Group’s operations or is significant or material. Where NZ IFRS does not provide an accounting policy choice, the Group has applied the requirements of NZ IFRS but a detailed accounting policy has not been specifically included.
These policies have been consistently applied to all the years presented, unless otherwise stated.
Where necessary, comparative information has been reclassified in order to provide a more appropriate basis for comparison.
These audited consolidated financial statements were authorised for issue on 14 April 2016 by the Board of Directors who do not have the power to amend after issue.
40 RESTAURANT BRANDS NEW ZEALAND LIMITED

Note PagePerformance 421. Segmental reporting 422. Non-trading items 443. Revenue and expenses 444. Earnings per share 455. Dividend distributions 45
Funding and equity 466. Loans 467. Derivatives and hedge accounting 468. Financial risk management 489. Equity and reserves 50
Working capital 5010. Inventories 5011. Trade and other receivables 5012. Creditors and accruals 50
Long term assets 5113. Property, plant and equipment 5114. Intangibles 52
Other Notes 5415. Taxation 5416. Provision for employee entitlements 5617. Deferred income 56 18. Leases 5619. Related party transactions 5720. Commitments 5821. Contingent liabilities 5822. Subsequent events 5823. New standards and interpretations 5924. Fees paid to auditor 5925. Donations 59
for the 52 week period ended 29 February 2016
Notes to and forming part of the financial statements
Hey Carl’s Jr. a reply to ur commenthere u guys go my cool as tattoo.
Thanks guys here is a pic feel free to share around. Could u put it up on your Facebook page please and tag me into it? Very happy with the prize pack!
ANNUAL REPORT 2016 41

PERFORMANCE
1. Segmental reporting
2016 $NZ000’s KFC Pizza Hut
Starbucks Coffee Carl's Jr.
All other segments Full year
Store sales revenue 282,531 44,871 26,811 33,351 - 387,564Other revenue - - - - 16,531 16,531Total operating revenue 282,531 44,871 26,811 33,351 16,531 404,095
Concept EBITDA before general and administration expenses 57,150 4,902 4,409 439 - 66,900
Depreciation (11,178) (945) (796) (2,970) (623) (16,512)Gain / (loss) on sale of property, plant and equipment (included in depreciation) (146) (33) (28) (34) (2) (243)Amortisation (included in cost of sales) (738) (270) (119) (203) (467) (1,797)G&A – area managers, general managers and support centre (1,565) (670) (381) (578) (10,635) (13,829)EBIT before non-trading 43,523 2,984 3,085 (3,346) (11,727) 34,519
Impairment on property, plant and equipment 32 69 - - - 101 Other non-trading (211) 811 (79) (67) (1,007) (553)EBIT after non-trading 43,344 3,864 3,006 (3,413) (12,734) 34,067
Segment assets 76,317 14,802 4,488 28,238 5,910 129,755Unallocated assets 10,042Total assets 139,797
Capital expenditure including intangibles 13,780 515 947 2,881 1,411 19,534
Notes to and forming part of the financial statements (continued)for the 52 week period ended 29 February 2016
#HappyHalloween
352 Likes 28 Comments
Followingstreet_jewelInstagram
Like Comment Share
42 RESTAURANT BRANDS NEW ZEALAND LIMITED

2015 $NZ000’s KFC Pizza Hut
Starbucks Coffee Carl's Jr.
All other segments Full year
Store sales revenue 265,038 48,364 26,067 20,059 - 359,528Other revenue - - - - 13,075 13,075Total operating revenue 265,038 48,364 26,067 20,059 13,075 372,603
Concept EBITDA before general and administration expenses 50,777 6,365 4,253 153 - 61,548
Depreciation (10,499) (1,226) (887) (1,797) (599) (15,008)Amortisation (included in cost of sales) (723) (304) (66) (155) (380) (1,628)G&A - area managers, general managers and support centre (1,877) (836) (239) (450) (9,415) (12,817)EBIT before non-trading 37,678 3,999 3,061 (2,249) (10,394) 32,095
Impairment on property, plant and equipment (27) 124 3 (194) - (94)Other non-trading 872 659 (96) (13) - 1,422 EBIT after non-trading 38,523 4,782 2,968 (2,456) (10,394) 33,423
Segment assets 75,782 16,482 4,955 29,139 4,477 130,835Unallocated assets 13,770Total assets 144,605
Capital expenditure including intangibles 22,520 854 583 16,724 2,631 43,312
The Group evaluates performance and allocates resources to its operating segments on the basis of segment assets, segment revenues, concept EBITDA before general and administration expenses and EBIT before non-trading.
EBITDA refers to earnings before interest, taxation, depreciation and amortisation. EBIT refers to earnings before interest and taxation.
All operating revenue is from external customers.
Operating segments are reported in a manner consistent with the internal reporting provided to the chief operating decision maker. The chief operating decision maker, responsible for allocating resources and assessing performance of the operating segments, has been identified as the Senior Leadership Team (“SLT”).
The Group has four operating segments: KFC, Pizza Hut, Starbucks Coffee and Carl’s Jr. All segments operate quick service and takeaway restaurant concepts. No operating segments have been aggregated.
The segments were determined primarily because the Group manages and reports each business separately to the SLT. The Group operates in New Zealand.
All other segments represents general and administration support centre costs (“G&A”) and other revenue. G&A support centre costs are not an operating segment as the costs incurred are incidental to the Group’s activities.
Segment assets include items directly attributable to the segment (i.e. property, plant and equipment, intangible assets and inventories). Unallocated items comprise other receivables, cash and cash equivalents, deferred tax and derivative financial instruments as they are all managed on a central basis. These are part of the reconciliation to total assets in the statement of financial position. Segment capital expenditure is the total cost incurred during the period to acquire property, plant and equipment and intangible assets other than goodwill.
The Group has not disclosed segment liabilities as the SLT evaluates performance and allocates resources purely on the basis of aggregated Group liabilities.
ANNUAL REPORT 2016 43

Notes to and forming part of the financial statements (continued)for the 52 week period ended 29 February 2016
1.1 Reconciliation between EBIT after non-trading and net profit after tax$NZ000’s 2016 2015
EBIT after non-trading 34,067 33,423Net financing costs (991) (961)Net profit before taxation 33,076 32,462Income tax expense (9,006) (8,632)Net profit after taxation 24,070 23,830Add back / (deduct) non-trading items 452 (1,328)Income tax on non-trading items (315) 21Net profit after taxation excluding non-trading 24,207 22,523
2. Non-trading items$NZ000’s 2016 2015
Non-trading itemsGain on sale of stores Net sale proceeds (1,649) (1,155) Property, plant and equipment disposed of 251 156 Goodwill disposed of 439 283
(959) (716)Acquisition costs 1,007 -Store closure costs 445 329Store relocation and refurbishment (including insurance proceeds) (44) (25)Loss / (gain) on store sale and leaseback 3 (916)Total non-trading items 452 (1,328)
The Group seeks to present a measure of comparable underlying performance on a consistent basis. In order to do so, the Group separately discloses items considered to be unrelated to the day to day operational performance of the Group. Such items are classified as non-trading items and are separately disclosed in the statement of comprehensive income and notes to the financial statements.
3. Revenue and expenses
Operating revenue
Store sales revenue
Revenue from store sales of goods is measured at the fair value of the consideration received, net of returns, discounts and excluding GST. Retail sales of goods are recognised at point of sale.
Other revenue
Other revenue represents sales of goods and services to independent franchisees. Services revenue is recognised in the accounting period in which the services are rendered, by reference to completion of the specific transaction assessed on the basis of the actual service provided as a proportion of the total services to be provided. Sales of goods are measured and recognised on a consistent basis with store sales revenue as already noted.
44 RESTAURANT BRANDS NEW ZEALAND LIMITED
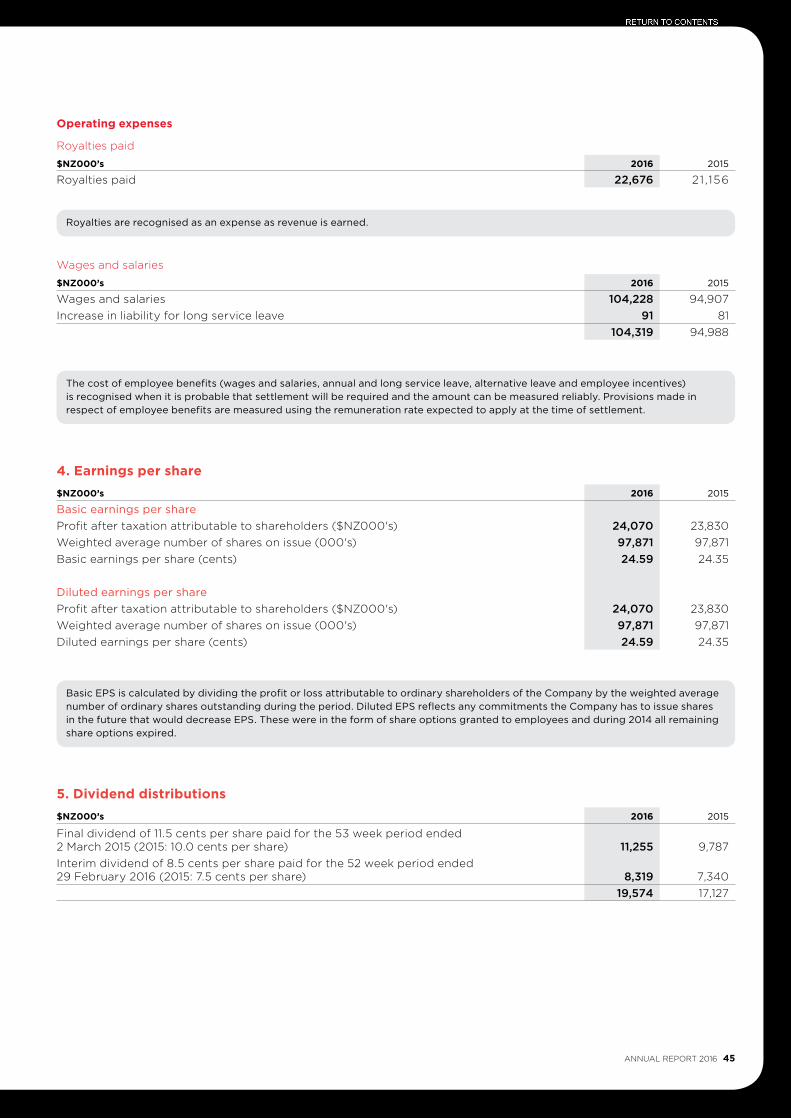
Operating expenses
Royalties paid
$NZ000’s 2016 2015
Royalties paid 22,676 21 ,156
Royalties are recognised as an expense as revenue is earned.
Wages and salaries
$NZ000’s 2016 2015
Wages and salaries 104,228 94,907Increase in liability for long service leave 91 81
104,319 94,988
The cost of employee benefits (wages and salaries, annual and long service leave, alternative leave and employee incentives) is recognised when it is probable that settlement will be required and the amount can be measured reliably. Provisions made in respect of employee benefits are measured using the remuneration rate expected to apply at the time of settlement.
4. Earnings per share$NZ000’s 2016 2015
Basic earnings per shareProfit after taxation attributable to shareholders ($NZ000's) 24,070 23,830Weighted average number of shares on issue (000's) 97,871 97,871Basic earnings per share (cents) 24.59 24.35
Diluted earnings per share Profit after taxation attributable to shareholders ($NZ000's) 24,070 23,830Weighted average number of shares on issue (000's) 97,871 97,871Diluted earnings per share (cents) 24.59 24.35
Basic EPS is calculated by dividing the profit or loss attributable to ordinary shareholders of the Company by the weighted average number of ordinary shares outstanding during the period. Diluted EPS reflects any commitments the Company has to issue shares in the future that would decrease EPS. These were in the form of share options granted to employees and during 2014 all remaining share options expired.
5. Dividend distributions$NZ000’s 2016 2015
Final dividend of 11.5 cents per share paid for the 53 week period ended 2 March 2015 (2015: 10.0 cents per share) 11,255 9,787Interim dividend of 8.5 cents per share paid for the 52 week period ended 29 February 2016 (2015: 7.5 cents per share) 8,319 7,340
19,574 17,127
ANNUAL REPORT 2016 45

Notes to and forming part of the financial statements (continued)for the 52 week period ended 29 February 2016
FUNDING AND EQUITY
6. Loans $NZ000’s 2016 2015
Non-current liabilitiesSecured bank loans 12,675 22,550
The secured bank facility was renewed in October 2014 and the bank loans expire in October 2017.
On 16 April 2014 the Group entered into an interest rate swap to fix the interest rate on $5.0 million of bank loans for five years. At balance date the interest rate applicable was 5.50% (2015: 5.50%) inclusive of bank margin. The swap matures on 16 April 2019.
As security over the loan and bank overdraft, the bank holds a negative pledge deed between Restaurant Brands New Zealand Limited and all its subsidiary companies. The negative pledge deed includes all obligations and cross guarantees between the guaranteeing subsidiaries.
The carrying value equates to fair value.
All existing bank loans are denominated in New Zealand dollars (2015: all denominated in New Zealand dollars). For more information about the Group’s exposure to interest rate and foreign currency risk see Note 8.
Borrowings are recognised initially at fair value, net of transaction costs incurred. Borrowings are subsequently stated at amortised cost; any difference between the proceeds (net of transaction costs) and the redemption value is recognised in the statement of comprehensive income over the period of the borrowings using the effective interest method.
Net financing costs$NZ000’s 2016 2015
Interest expense (net) 991 961
Net financing costs comprise: interest payable on borrowings calculated using the effective interest rate method; interest received on funds invested calculated using the effective interest rate method; foreign exchange gains and losses; gains and losses on certain financial instruments that are recognised in the statement of comprehensive income; unwinding of the discount on provisions and impairment losses on financial assets.
7. Derivatives and hedge accounting
2016 2015
$NZ000’s Liabilities Liabilities
CurrentFair value of interest rate swap 331 204Fair value of forward exchange contract - 3
331 207
The above table shows the Group’s financial derivative holdings at period end.
There were no transfers between fair value measurements during the period (2015: nil).
Fair values at balance date have been assessed using a range of market interest rates between 2.43% to 3.07% (2015: 3.57% to 3.65%).
46 RESTAURANT BRANDS NEW ZEALAND LIMITED

Financial assetsThe Group classifies its financial assets as loans and receivables. Management determines the classification of its financial assets at initial recognition.
Loans and receivablesLoans and receivables are non-derivative financial assets with fixed or determinable payments that are not quoted in an active market. They are included in current assets, except for maturities greater than 12 months after the balance sheet date. These are classified as non-current assets. The Group’s loans and receivables comprise trade receivables, other debtors and cash and cash equivalents in the statement of financial position.
Financial assets that are stated at cost or amortised cost are reviewed individually at balance date to determine whether there is objective evidence of impairment. Any impairment loses are recognised in the statement of comprehensive income.
Financial instrumentsA financial instrument is recognised when the Group becomes a party to the contractual provisions of the instrument. Financial assets are derecognised when the Group’s contractual rights to the cash flows from the financial assets expire or when the Group transfers the financial asset to another party without retaining control or substantially all risks and rewards of the asset. Regular way purchases and sales of financial assets are accounted for at trade date, i.e. the date that the Group commits itself to purchase or sell the asset. Financial liabilities are derecognised when the Group’s obligations specified in the contract expire or are discharged or cancelled.
Non-derivative financial instrumentsNon-derivative financial instruments comprise trade receivables and other debtors, which are initially recognised at fair value plus transaction costs and subsequently measured at amortised cost, cash and cash equivalents, loans and borrowings (initially recognised at fair value plus transaction costs and subsequently measured at amortised cost), and creditors and accruals which are initially recognised at fair value and subsequently measured at amortised cost.
Financial assets and financial liabilities by category$NZ000’s 2016 2015
Loans and receivablesTrade receivables 508 373Other debtors 1,244 4,236Cash and cash equivalents 1,093 1,575
2,845 6,184
Derivatives used for hedgingDerivative financial instruments – liabilities 331 207
331 207
Financial liabilities at amortised costLoans – non current 12,675 22,550Creditors and accruals (excluding indirect and other taxes and employee benefits) 29,998 30,539
42,673 53,089
ANNUAL REPORT 2016 47

Notes to and forming part of the financial statements (continued)for the 52 week period ended 29 February 2016
8. Financial risk managementExposure to credit, interest rate and foreign currency risks arises in the normal course of the Group’s business. Derivative financial instruments may be used to hedge exposure to fluctuations in foreign currency exchange rates and interest rates.
(a) Foreign currency riskThe Group is exposed to foreign currency risk on purchases that are denominated in a currency other than the New Zealand dollar. The currencies giving rise to this risk are primarily U.S. dollars and Australian dollars.
The direct exposure to foreign currency risk is small and is primarily confined to raw material purchases, some items of capital equipment and some franchise fee payments. Where any one item is significant, the Group will specifically hedge its exposure.
The Group has an indirect exposure to foreign currency risk on some of its locally sourced ingredients, where those ingredients in turn have a high imported component. Where this is significant the Group contracts to a known purchase price with its domestic supplier based on a forward cover position taken by that supplier on its imported components.
The Group has a residual foreign currency risk on its assets and liabilities that are denominated in Australian dollars as part of its remaining Australian investment.
(b) Interest rate riskThe Group’s main interest rate risk arises from bank loans. The Group analyses its interest rate exposure on a dynamic basis. Based on a number of scenarios, the Group calculates the impact on profit or loss of a defined interest rate shift. Based on these scenarios the maximum loss potential is assessed by management as to whether it is within acceptable limits.
Where necessary the Group hedges its exposure to changes in interest rates primarily through the use of interest rate swaps. There are no minimum prescribed guidelines as to the level of hedging.
Note 7 discusses in detail the Group’s accounting treatment for derivative financial instruments.
As discussed in Note 6, the Group has an interest rate swap in place to fix the interest rate on $5.0 million of bank loans to April 2019 (2015: $5.0 million to April 2019). The Group will continue to monitor interest rate movements to ensure it maintains an appropriate mix of fixed and floating rate exposure within the Group’s policy.
(c) Liquidity riskIn respect of the Group’s cash balances, non-derivative financial liabilities and derivative financial liabilities the following table analyses the amounts into relevant maturity groupings based on the remaining period at balance date to the contractual maturity date, along with their effective interest rates at balance date. The amounts disclosed in the table are the contractual undiscounted cash flows.
$NZ000’s Effective
interest rate Total12 months
or less12 months
or more
2016Cash 218 218 -Bank balance 2.00% 875 875 -Bank loan – principal 4.79% (12,675) - (12,675)
Bank loan – expected interest 4.49% (951) (569) (382)Derivative financial instruments - (331) (331) -Creditors and accruals (excluding indirect and other taxes and employee benefits) - (29,998) (29,998) -
(42,862) (29,805) (13,057)2015Cash 222 222 -Bank balance 3.00% 1,353 1,353 -Bank term loan – principal 5.15% (22,550) - (22,550)Bank term loan – expected interest 4.99% (3,002) (1,125) (1,877)
Derivative financial instruments - (207) (207) -Creditors and accruals (excluding indirect and other taxes and employee benefits) - (30,539) (30,539) -
(54,723) (30,296) (24,427)
48 RESTAURANT BRANDS NEW ZEALAND LIMITED

Prudent liquidity risk management implies the availability of funding through adequate amount of committed credit facilities. The Group aims to maintain flexibility in funding by keeping committed credit lines available.
The Group has bank funding facilities, excluding overdraft facilities, of $35.0 million (2015: $35.0 million) available at variable rates. The amount undrawn at balance date was $22.3 million (2015: $12.5 million).
The Group has fixed the interest rate on $5.0 million of bank loans with the balance at a floating interest rate. The bank loan is structured as a revolving wholesale advance facility with portions of the facility renewing on a regular basis. This leads to the loans being sensitive to interest rate movement in 12 months or less.
(d) Credit riskCredit risk arises from cash deposits with banks and financial institutions and outstanding receivables.
No collateral is required in respect of financial assets. Management has a credit policy in place and the exposure to credit risk is monitored on an ongoing basis. The nature of the business results in most sales being conducted on a cash basis that significantly reduces the risk that the Group is exposed to. Reputable financial institutions are used for investing and cash handling purposes.
There were no financial assets neither past due nor impaired at balance date (2015: nil).
At balance date there were no significant concentrations of credit risk and the maximum exposure to credit risk is represented by the carrying value of each financial asset in the statement of financial position.
(e) Fair valuesThe carrying value of bank loans is the fair value of this liability. A Group set-off arrangement is in place between certain bank accounts operated by the Group.
Sensitivity analysis In managing interest rate and currency risks the Group aims to reduce the impact of short-term fluctuations on the Group’s earnings. Over the longer term, however, permanent changes in foreign exchange and interest rates on a weighted average balance will have an impact on profit.
At 29 February 2016 it is estimated that a general increase of one percentage point in interest rates would decrease the Group profit before income tax and equity by approximately $0.1 million (2015: $0.2 million). A one percentage point decrease in interest rates would increase the Group profit before income tax and equity by approximately $0.1 million (2015: $0.2 million).
A general increase of one percentage point in the value of the New Zealand dollar against other foreign currencies would have minimal impact on the cost of the Group’s directly imported ingredients denominated in foreign currencies.
Capital risk managementThe Group’s capital comprises share capital, reserves, retained earnings and debt.
The Group’s objectives when managing capital are to safeguard the Group’s ability to continue to operate as a going concern, to maintain an optimal capital structure commensurate with risk and return and reduce the cost of capital.
In order to maintain or adjust the capital structure, the Group may adjust the amount of dividends paid to shareholders, return capital to shareholders, issue new shares or sell assets to reduce debt or draw down more debt.
The Group is subject to a number of externally imposed bank covenants as part of the terms of its secured bank loan facility.
The most significant covenants relating directly to capital management are the ratio of total debt to earnings before interest, tax and amortisation (EBITA) and restrictions relating to acquiring its own shares.
The specific covenants relating to financial ratios the Group is required to meet are:
— debt coverage ratio (i.e. net borrowings to EBITA), and
— fixed charges coverage ratio (i.e. EBITL to total fixed charges), with EBITL being EBIT before lease costs. Fixed charges comprise interest and lease costs.
The covenants are monitored and reported to the bank on a six monthly basis. These are reviewed by the Board on a monthly basis.
There have been no breaches of the covenants during the period (2015: no breaches).
ANNUAL REPORT 2016 49
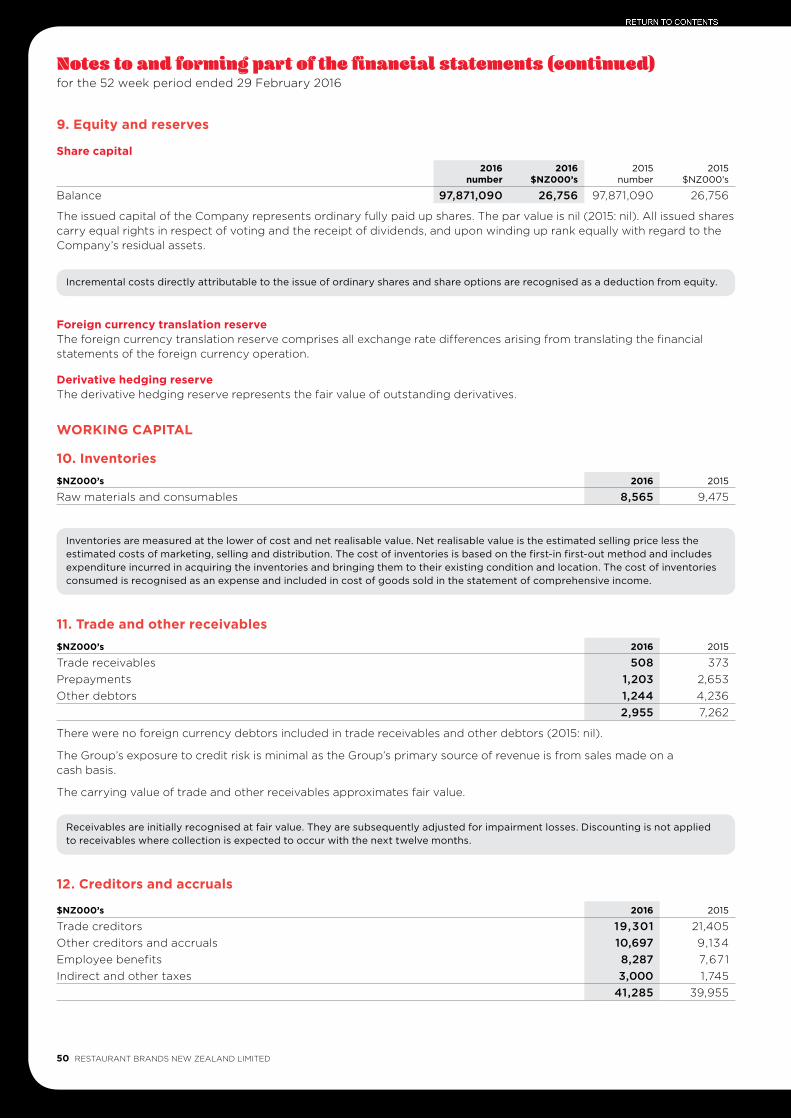
Notes to and forming part of the financial statements (continued)for the 52 week period ended 29 February 2016
9. Equity and reserves
Share capital
2016
number2016
$NZ000’s2015
number2015
$NZ000’s
Balance 97,871,090 26,756 97,871,090 26,756
The issued capital of the Company represents ordinary fully paid up shares. The par value is nil (2015: nil). All issued shares carry equal rights in respect of voting and the receipt of dividends, and upon winding up rank equally with regard to the Company’s residual assets.
Incremental costs directly attributable to the issue of ordinary shares and share options are recognised as a deduction from equity.
Foreign currency translation reserveThe foreign currency translation reserve comprises all exchange rate differences arising from translating the financial statements of the foreign currency operation.
Derivative hedging reserveThe derivative hedging reserve represents the fair value of outstanding derivatives.
WORKING CAPITAL
10. Inventories$NZ000’s 2016 2015
Raw materials and consumables 8,565 9,475
Inventories are measured at the lower of cost and net realisable value. Net realisable value is the estimated selling price less the estimated costs of marketing, selling and distribution. The cost of inventories is based on the first-in first-out method and includes expenditure incurred in acquiring the inventories and bringing them to their existing condition and location. The cost of inventories consumed is recognised as an expense and included in cost of goods sold in the statement of comprehensive income.
11. Trade and other receivables$NZ000’s 2016 2015
Trade receivables 508 373Prepayments 1,203 2,653Other debtors 1,244 4,236
2,955 7,262
There were no foreign currency debtors included in trade receivables and other debtors (2015: nil).
The Group’s exposure to credit risk is minimal as the Group’s primary source of revenue is from sales made on a cash basis.
The carrying value of trade and other receivables approximates fair value.
Receivables are initially recognised at fair value. They are subsequently adjusted for impairment losses. Discounting is not applied to receivables where collection is expected to occur with the next twelve months.
12. Creditors and accruals
$NZ000’s 2016 2015
Trade creditors 19,301 21,405Other creditors and accruals 10,697 9,134Employee benefits 8,287 7,671Indirect and other taxes 3,000 1,745
41,285 39,955
50 RESTAURANT BRANDS NEW ZEALAND LIMITED

Included in trade creditors are foreign currency creditors of $NZ1.3 million ($AU0.7 million, $US0.4 million), (2015: $NZ1.0 million ($AU0.3 million, $US0.5 million), which are not hedged.
The carrying value of creditors and accruals approximates fair value.
Trade payables are recognised initially at fair value and subsequently measured at amortised cost using the effective interest method.
LONG TERM ASSETS
13. Property, Plant and Equipment
$NZ000’s Land
Leasehold improvements
Plant, equipment
and fittingsMotor
vehicles
Leased plant and
equipment
Capital work in
progress Total
CostBalance as at 24 February 2014 1,358 108,085 59,010 935 793 4,282 174,463Additions 1,265 - 1,788 136 - 27,134 30,323Transfer from work in progress - 15,563 3,541 - - (19,104) -Acquisition of business - 5,561 2,803 - - - 8,364
Disposals (780) (5,419) (3,393) (171) (119) - (9,882)Balance as at 2 March 2015 1,843 123,790 63,749 900 674 12,312 203,268Additions - - 1,598 127 - 15,953 17,678Transfer from work in progress - 13,438 6,166 - - (19,604) -Disposals - (3,622) (4,321) (73) (416) - (8,432)Balance as at 29 February 2016 1,843 133,606 67,192 954 258 8,661 212,514
Accumulated DepreciationBalance as at 24 February 2014 - (52,818) (39,646) (715) (524) - (93,703)Charge - (9,270) (5,496) (98) (144) - (15,008)Disposals - 3,234 3,202 165 116 - 6,717Balance as at 2 March 2015 - (58,854) (41,940) (648) (552) - (101,994)Charge - (10,178) (6,101) (120) (113) - (16,512)Disposals - 3,172 4,024 68 414 - 7,678Balance as at 29 February 2016 - (65,860) (44,017) (700) (251) - (110,828)
Impairment ProvisionBalance as at 24 February 2014 - (476) (53) - - - (529)Charge - (85) (9) - - - (94)Utilised/disposed - (316) (35) - - - (351)Balance as at 2 March 2015 - (877) (97) - - - (974)Charge - (155) (17) - - - (172)Utilised/disposed - 91 10 - - - 101 Balance as at 29 February 2016 - (941) (104) - - - (1,045)
The impairment charge recognised during the period relates to accelerated depreciation on leasehold improvements and plant, equipment and fittings on stores expected to be transformed or closed. Impairment charges incurred and utilised/disposed are recognised in non-trading in the statement of comprehensive income.
Carrying AmountsBalance as at 24 February 2014 1,358 54,791 19,311 220 269 4,282 80,231Balance as at 2 March 2015 1,843 64,059 21,712 252 122 12,312 100,300Balance as at 29 February 2016 1,843 66,805 23,071 254 7 8,661 100,641
ANNUAL REPORT 2016 51

Notes to and forming part of the financial statements (continued)for the 52 week period ended 29 February 2016
Depreciation expense$NZ000’s 2016 2015
Depreciation expense 16,512 15,008
Sale of property, plant and equipment$NZ000’s 2016 2015
Net loss on disposal of property, plant and equipment (included in depreciation expense) 243 -Net gain on disposal of property, plant and equipment (included in non-trading costs) (1,961) (2,598)
Property, plant and equipment are measured at cost less accumulated depreciation and impairment losses.
Depreciation is calculated on a straight line basis to allocate the cost of an asset, less any residual value, over its estimated useful life. Leased assets are depreciated over the shorter of the lease term and their useful lives. The estimated useful lives of fixed assets are as follows:
Leasehold improvements 5 – 20 yearsPlant and equipment 3 – 12.5 yearsMotor vehicles 4 yearsFurniture and fittings 3 – 10 yearsComputer equipment 3 – 5 years
Depreciation methods, useful lives and residual values are reassessed at the reporting date.
Depreciation expense is included in the statement of comprehensive income.
Gains and losses on disposals are determined by comparing proceeds with carrying amount. These are included in the statement of comprehensive income.
14. Intangibles
$NZ000’s GoodwillFranchise
fees
Conceptdevelopment
costsSoftware
costs Total
CostBalance as at 24 February 2014 13,037 8,761 1,650 4,337 27,785Additions 1,629 278 - 929 2,836Acquisition of business 1,507 282 - - 1,789Disposals (283) (233) - (754) (1,270)Balance as at 2 March 2015 15,890 9,088 1,650 4,512 31,140Additions - 312 - 1,544 1,856Disposals (489) (375) - (10) (874)Balance as at 29 February 2016 15,401 9,025 1,650 6,046 32,122
Accumulated AmortisationBalance as at 24 February 2014 (831) (4,979) (855) (2,696) (9,361)Charge - (791) (86) (751) (1,628)Disposals - 210 - 699 909 Balance as at 2 March 2015 (831) (5,560) (941) (2,748) (10,080)Charge - (802) (86) (909) (1,797)Disposals - 297 - 7 304 Balance as at 29 February 2016 (831) (6,065) (1,027) (3,650) (11,573)Impairment charges and disposals are recognised in non-trading in the statement of comprehensive income.
Carrying AmountsBalance as at 24 February 2014 12,206 3,782 795 1,641 18,424Balance as at 2 March 2015 15,059 3,528 709 1,764 21,060
Balance as at 29 February 2016 14,570 2,960 623 2,396 20,549
52 RESTAURANT BRANDS NEW ZEALAND LIMITED

GoodwillGoodwill arises on the acquisition of subsidiaries and business combinations. Goodwill is measured at cost less accumulated impairment losses. Goodwill is allocated to cash generating units and is tested annually for impairment. Where the Group disposes of an operation within a cash generating unit, the goodwill associated with the operation disposed of is part of the gain or loss on disposal. Goodwill disposed of in this manner is measured based on the relative values of the operation disposed of and the portion of the cash generating unit retained.
Franchise costsFranchise costs are those incurred in obtaining franchise rights or licences to operate quick service and take-away restaurant concepts. They include for example, the initial fee paid to a system franchisor when a new store is opened. These are measured at cost less accumulated amortisation and accumulated impairment costs. Amortisation is on a straight line basis over the life of the applicable franchise or licence agreement.
Concept development costs and fees Concept development costs and fees include certain costs, other than the direct cost of obtaining the franchise, associated with the establishment of quick service and takeaway restaurant concepts. These include, for example, professional fees and consulting costs associated with the establishment of a new brand or business acquisition.
These costs are capitalised where the concept is proven to be commercially feasible and the related future economic benefits are expected to exceed those costs with reasonable certainty. These are subsequently measured at cost less accumulated amortisation and accumulated impairment losses. Amortisation is recognised on a straight line basis over the period which future economic benefits are reasonably expected to be derived.
Acquired software costsSoftware costs have a finite useful life. Software costs are capitalised and amortised on a straight line basis over the estimated economic life of 3-8 years.
AmortisationAmortisation charge is recognised in cost of sales in the statement of comprehensive income.
$NZ000’s 2016 2015
Amortisation of intangibles 1,797 1 ,628
Impairment testing for cash-generating units containing goodwillFor the purpose of impairment testing, goodwill is allocated to the Group’s operating divisions which represent the lowest level within the Group at which the goodwill is monitored for internal management purposes.
The aggregate carrying amounts of goodwill allocated to each unit are as follows:
$NZ000’s 2016 2015
KFC 3,799 3,799Pizza Hut 9,264 9,753Carl's Jr. 1,507 1,507
14,570 15,059
The recoverable amount of each cash-generating unit was based on its value in use.
Value in use was determined by discounting the future cash flows generated from the continuing use of the unit. Cash flows were projected based on a three year strategic business plan as approved by the Board of Directors.
The key assumptions used for the value in use calculation are as follows:
Brand 2016 2016 2015 2015
Sales growth 2017-2019
%
EBITDA margin2017-2019
%
Sales growth2016-2018
%
EBITDA margin2016-2018
%
KFC 2.4 – 3.1 20.3 – 20.5 2.7 – 6.1 19.6 – 19.7Pizza Hut (6.2) – 2.5 10.0 – 12.9 (9.0) – 2.7 13.0 – 13.9Carl's Jr. 2.0 – 2.9 4.0 – 8.5 2016 75.5
2017-2018 2.3 – 3.26.4 – 11.0
The terminal year was calculated based on the 2019 year and assumes a continuous growth of a minimum of projected inflation estimates of 2.5% (2015: 2.5%).
As a result of the review and based on the key assumptions described above, no impairment of goodwill was necessary (2015: nil).
ANNUAL REPORT 2016 53

Notes to and forming part of the financial statements (continued)for the 52 week period ended 29 February 2016
The discount rate applied, across all three concepts, to future cash flows is based on an 8.2% weighted average post-tax cost of capital (2015: 8.2%) applicable to Restaurant Brands.
The weighted average cost of capital calculation was reviewed in 2012 based on CAPM methodology using current market inputs. Changes in the market inputs have been considered and are not deemed material enough to change the weighted average cost of capital calculation.
The values assigned to the key assumptions represent management’s assessment of future trends in the industry and are based on both external sources and internal sources (historical data).
Impact of possible changes in key assumptionsSet out below are reasonably possible changes in key assumptions as applied to goodwill balances for KFC, Pizza Hut and Carl’s Jr.
Key Assumptions
Variation%
(absolute terms)
Pizza Hutimpairment charge
($m)
KFCimpairment charge
($m)
Carl’s Jr.impairment charge
($m)
Terminal year sales growth (1.25) no impairment necessary
no impairment necessary
carrying value equals recoverable
amountDiscount rate 1.0 no impairment
necessaryno impairment
necessaryno impairment
necessaryEBITDA ratio as a % of sales per annum
(1.0) no impairment necessary
no impairment necessary
no impairment necessary
Sales growth (0.9) no impairment necessary
no impairment necessary
carrying value equals recoverable
amount
OTHER NOTES
15. Taxation
Taxation – statement of comprehensive incomeThe total taxation charge is analysed as follows:
$NZ000’s Note 2016 2015
Total profit before income tax for the period 1 33,076 32,462Total income tax expense 1 (9,006) (8,632)Net profit after income tax 24,070 23,830
Income tax using the Group’s domestic tax rate (28.0%) (9,261) (28.0%) (9,089)(Non-deductible expenses) and non-assessable income 0.8% 255 1.4% 457
(27.2%) (9,006) (26.6%) (8,632)Income tax expense comprises:Current tax expense (10,032) (9,855)Deferred tax credit 1,026 1,223Net tax expense (9,006) (8,632)
54 RESTAURANT BRANDS NEW ZEALAND LIMITED
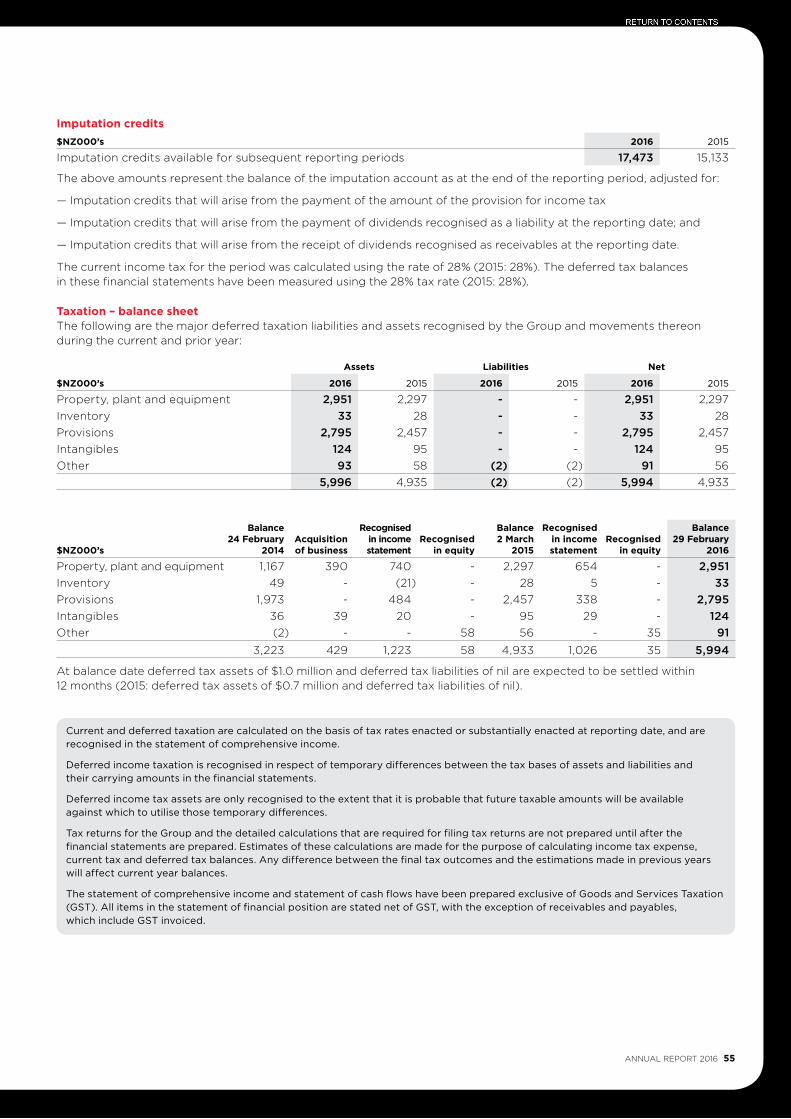
Imputation credits$NZ000’s 2016 2015
Imputation credits available for subsequent reporting periods 17,473 15,133
The above amounts represent the balance of the imputation account as at the end of the reporting period, adjusted for:
— Imputation credits that will arise from the payment of the amount of the provision for income tax
— Imputation credits that will arise from the payment of dividends recognised as a liability at the reporting date; and
— Imputation credits that will arise from the receipt of dividends recognised as receivables at the reporting date.
The current income tax for the period was calculated using the rate of 28% (2015: 28%). The deferred tax balances in these financial statements have been measured using the 28% tax rate (2015: 28%).
Taxation – balance sheetThe following are the major deferred taxation liabilities and assets recognised by the Group and movements thereon during the current and prior year:
Assets Liabilities Net
$NZ000’s 2016 2015 2016 2015 2016 2015
Property, plant and equipment 2,951 2,297 - - 2,951 2,297Inventory 33 28 - - 33 28Provisions 2,795 2,457 - - 2,795 2,457Intangibles 124 95 - - 124 95Other 93 58 (2) (2) 91 56
5,996 4,935 (2) (2) 5,994 4,933
$NZ000’s
Balance 24 February
2014Acquisition of business
Recognised in income statement
Recognised in equity
Balance 2 March
2015
Recognised in income statement
Recognised in equity
Balance 29 February
2016
Property, plant and equipment 1,167 390 740 - 2,297 654 - 2,951Inventory 49 - (21) - 28 5 - 33Provisions 1,973 - 484 - 2,457 338 - 2,795Intangibles 36 39 20 - 95 29 - 124Other (2) - - 58 56 - 35 91
3,223 429 1,223 58 4,933 1,026 35 5,994
At balance date deferred tax assets of $1.0 million and deferred tax liabilities of nil are expected to be settled within 12 months (2015: deferred tax assets of $0.7 million and deferred tax liabilities of nil).
Current and deferred taxation are calculated on the basis of tax rates enacted or substantially enacted at reporting date, and are recognised in the statement of comprehensive income.
Deferred income taxation is recognised in respect of temporary differences between the tax bases of assets and liabilities and their carrying amounts in the financial statements.
Deferred income tax assets are only recognised to the extent that it is probable that future taxable amounts will be available against which to utilise those temporary differences.
Tax returns for the Group and the detailed calculations that are required for filing tax returns are not prepared until after the financial statements are prepared. Estimates of these calculations are made for the purpose of calculating income tax expense, current tax and deferred tax balances. Any difference between the final tax outcomes and the estimations made in previous years will affect current year balances.
The statement of comprehensive income and statement of cash flows have been prepared exclusive of Goods and Services Taxation (GST). All items in the statement of financial position are stated net of GST, with the exception of receivables and payables, which include GST invoiced.
ANNUAL REPORT 2016 55

Notes to and forming part of the financial statements (continued)for the 52 week period ended 29 February 2016
16. Provision for employee entitlements$NZ000’s
Balance at 2 March 2015 697Created during the period 285Used during the period (92)Released during the period (103)Balance at 29 February 2016 787
2016Non-current 470Current 317Total 787
The provision for employee entitlements is long service leave. The provision is affected by a number of estimates, including the expected length of service of employees and the timing of benefits being taken. Once an employee attains the required length of service, the employee has a period of five years in which to take this leave.
17. Deferred income$NZ000’s
Balance at 2 March 2015 6,564Created during the period 1,053Used during the period (1,351)Balance at 29 February 2016 6,266
2016Non-current 5,267Current 999Total 6,266
Deferred income relates to non-routine revenue from suppliers and landlords and is recognised in the statement of comprehensive income on a systematic basis over the life of the associated contract.
18. Leases
Lease payments$NZ000’s 2016 2015
Operating rental expenses 20,549 19,476
Rent expenses reported in these financial statements relates to non-cancellable operating lease rentals. The future commitments on these leases are as follows:
$NZ000’s 2016 2015
Not later than one year 19,781 18,972Later than one year but not later than two years 18,544 17,683Later than two years but not later than five years 38,365 41,681Later than five years 30,121 33,360
106,811 111,696
The lease periods vary and many have an option to renew. Lease payments are increased in accordance with the lease agreements to reflect market rentals. The following table summarises the Group’s lease portfolio.
56 RESTAURANT BRANDS NEW ZEALAND LIMITED
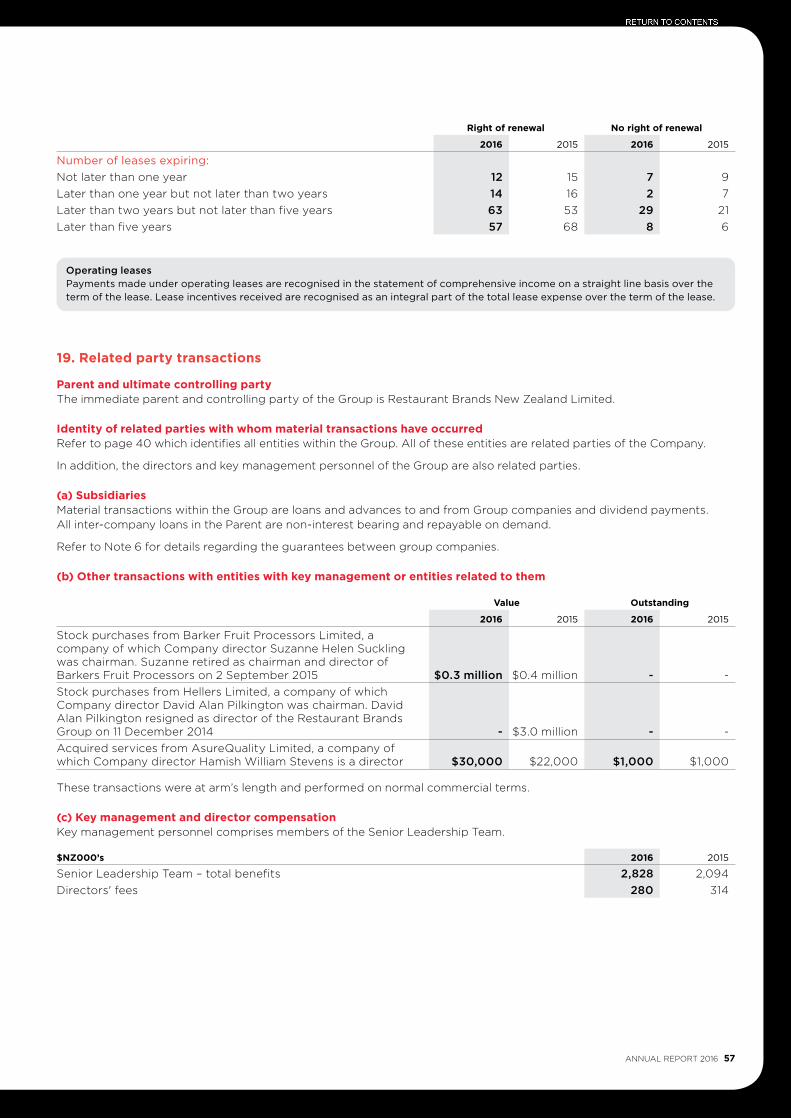
Right of renewal No right of renewal
2016 2015 2016 2015
Number of leases expiring:Not later than one year 12 15 7 9Later than one year but not later than two years 14 16 2 7Later than two years but not later than five years 63 53 29 21Later than five years 57 68 8 6
Operating leasesPayments made under operating leases are recognised in the statement of comprehensive income on a straight line basis over the term of the lease. Lease incentives received are recognised as an integral part of the total lease expense over the term of the lease.
19. Related party transactions
Parent and ultimate controlling partyThe immediate parent and controlling party of the Group is Restaurant Brands New Zealand Limited.
Identity of related parties with whom material transactions have occurredRefer to page 40 which identifies all entities within the Group. All of these entities are related parties of the Company.
In addition, the directors and key management personnel of the Group are also related parties.
(a) SubsidiariesMaterial transactions within the Group are loans and advances to and from Group companies and dividend payments. All inter-company loans in the Parent are non-interest bearing and repayable on demand.
Refer to Note 6 for details regarding the guarantees between group companies.
(b) Other transactions with entities with key management or entities related to them
Value Outstanding
2016 2015 2016 2015
Stock purchases from Barker Fruit Processors Limited, a company of which Company director Suzanne Helen Suckling was chairman. Suzanne retired as chairman and director of Barkers Fruit Processors on 2 September 2015 $0.3 million $0.4 million - -Stock purchases from Hellers Limited, a company of which Company director David Alan Pilkington was chairman. David Alan Pilkington resigned as director of the Restaurant Brands Group on 11 December 2014 - $3.0 million - -Acquired services from AsureQuality Limited, a company of which Company director Hamish William Stevens is a director $30,000 $22,000 $1,000 $1,000
These transactions were at arm’s length and performed on normal commercial terms.
(c) Key management and director compensationKey management personnel comprises members of the Senior Leadership Team.
$NZ000’s 2016 2015
Senior Leadership Team – total benefits 2,828 2,094Directors' fees 280 314
ANNUAL REPORT 2016 57

Notes to and forming part of the financial statements (continued)for the 52 week period ended 29 February 2016
(d) Long term incentive scheme On 28 July 2014 the Group entered into a long term incentive scheme (“LTI Scheme”) with the Chief Executive Officer (“CEO”). The scheme provides that if in the two year period starting 25 July 2015:
1. the Group’s share price is at $4 or above for a continuous period of 40 trading days or;
2. the Group is subject to a successful takeover at or above $4 share price
then the CEO will be paid a one-off $1 million bonus net of tax. A condition of the payment is that the CEO must remain employed for a period of at least 6 months immediately following the eligibility criteria being met.
The fair value of the liability at balance date was assessed at $1.5 million and a further $1.2 million has been taken up as a charge to general and administration expenses in the statement of comprehensive income (2015: $0.3 million).
20. Commitments
(a) Capital commitmentsThe Group has capital commitments which are not provided for in these financial statements, as follows:
$NZ000’s 2016 2015
Store development 2,164 1,366
21. Contingent liabilitiesThere are no contingent liabilities that the directors consider will have a significant impact on the financial position of the Group (2015: nil).
22. Subsequent events
DividendsThe directors have declared a fully imputed final dividend of 12.5 cents per share for the 52 week period ended 29 February 2016 (2015: 11.5 cents).
Business AcquisitionOn 3 March 2016 the Group entered into a conditional agreement to purchase 100% of the shares in QSR Pty Limited (“QSR”) for AUD$82.4 million. QSR is an Australian company which owns and operates 42 KFC stores in New South Wales, Australia. The transaction is subject to a number of conditions, including the approval from the franchisor, Yum! Restaurants International. The Group expects the transaction to be completed by the start of the second quarter of the 2017 financial year. The acquisition allows the group to expand its geographical footprint of KFC stores in a market with considerable further expansion opportunities.
The AUD$82.4 million purchase will be partly settled with Restaurant Brands New Zealand Limited scrip of 5 million ordinary shares and the balance will be funded through debt. As a result of the transaction, the Group is expected to have total outstanding debt of approximately NZ$80 million.
Following the acquisition and allowing for corporate costs for QSR, the Group expects to generate annual turnover in excess of NZ$500 million and EBITDA of NZ$70 million (assuming a NZD/AUD exchange rate of 0.93). One off transaction costs of approximately NZ$1 million have been incurred during the 2016 financial year and these costs have been included in non-trading costs in the statement of comprehensive income. There will also be stamp duty and other charges on settlement which will similarly impact on the 2017 financial year.
58 RESTAURANT BRANDS NEW ZEALAND LIMITED

23. New standards and interpretations Relevant standards, amendments and interpretations to existing standards that are not yet effective and have not been early adopted by the Group
— NZ IFRS 16 Leases (effective date: periods beginning on or after 1 January 2019) replaces the current guidance in NZ IAS 17. Under NZ IFRS 16, a contract is, or contains, a lease if the contract conveys the right to control the use of an identified asset for a period of time in exchange for consideration. Under NZ IAS 17, a lessee was required to make a distinction between a finance lease (on balance sheet) and an operating lease (off balance sheet). NZ IFRS 16 now requires a lessee to recognise a lease liability reflecting future lease payments and a ‘right-of-use asset’ for virtually all lease contracts. Included is an optional exemption for certain short-term leases and leases of low-value assets; however, this exemption can only be applied by lessees. The Group intends to adopt NZ IFRS 16 on its effective date and has yet to assess its full impact.
— NZ IFRS 15 Revenue from contracts with customers (effective for periods beginning on or after 1 January 2018) deals with revenue recognition and establishes principles for reporting useful information to users of financial statements about the nature, amount, timing and uncertainty of revenue and cash flows arising from an entity’s contracts with customers. Revenue is recognised when a customer obtains control of a good or service and thus has the ability to direct the use and obtain the benefits from the good or service. The standard replaces NZ IAS 18 ‘Revenue’ and NZ IAS 11 ‘Construction contracts’ and related interpretations. The Group intends to adopt NZ IFRS 15 on its effective date and is not expected to significantly impact the Group.
— NZ IFRS 9 Financial Instruments (effective for periods beginning on or after 1 January 2018) addresses the classification, measurement and recognition of financial assets and financial liabilities. The complete version of NZ IFRS 9 was issued in September 2014. It replaces the guidance in NZ IAS 39 that relates to the classification and measurement of financial instruments. The Group intends to adopt NZ IFRS 9 on its effective date and has yet to assess its full impact.
There are various other standards, amendments and interpretations which were assessed as having an immaterial impact on the Group. There are no NZ IFRS, NZ IFRIC interpretations or other applicable IFRS that are effective for the first time for the financial year beginning on or after 2 March 2015 that had a material impact on the financial statements.
24. Fees paid to auditor$NZ000’s 2016 2015
Audit of financial statementsAudit and review of financial statements – PwC 120 120Other services Performed by PwCOther assurance services 13 12Executive benchmarking assistance - 30Total other services 13 42
Total fees paid to auditor 133 162
Other assurance services comprise the audit of Company share registry and certain compliance certificates for third parties.
25. Donations
$NZ000’s 2016 2015
Donations 148 120
ANNUAL REPORT 2016 59

Report on the Consolidated Financial StatementsWe have audited the consolidated statement of financial position as at 29 February 2016, the consolidated statement of comprehensive income, the consolidated statement of changes in equity and the consolidated statement of cash flows for the year then ending, and the notes to the financial statements that include a summary of significant accounting policies and other explanatory information for the Group. The Group comprises the Company and the entities it controlled at 29 February 2016 or from time to time during the financial year.
Directors’ Responsibility for the Consolidated Financial StatementsThe Directors are responsible on behalf of the Company for the preparation and fair presentation of these consolidated financial statements in accordance with New Zealand Equivalents to International Financial Reporting Standards and for such internal controls as the Directors determine are necessary to enable the preparation of consolidated financial statements that are free from material misstatement, whether due to fraud or error.
Auditors’ ResponsibilityOur responsibility is to express an opinion on these consolidated financial statements based on our audit. We conducted our audit in accordance with International Standards on Auditing (New Zealand). These standards require that we comply with relevant ethical requirements and plan and perform the audit to obtain reasonable assurance about whether the consolidated financial statements are free from material misstatement.
An audit involves performing procedures to obtain audit evidence about the amounts and disclosures in the consolidated financial statements. The procedures selected depend on the auditors’ judgement, including the assessment of the risks of material misstatement of the consolidated financial statements, whether due to fraud or error. In making those risk assessments, the auditors consider the internal controls relevant to the Company’s preparation and fair presentation of the consolidated financial statements in order to design audit procedures that are appropriate in the circumstances, but not for the purpose of expressing an opinion on the effectiveness of the Company’s internal control. An audit also includes evaluating the appropriateness of accounting policies used and the reasonableness of accounting estimates, as well as evaluating the overall presentation of the consolidated financial statements.
We believe that the audit evidence we have obtained is sufficient and appropriate to provide a basis for our audit opinion.
We are independent of the Group. Our firm carries out other services for the Group in the area of assurance services. The provision of these other services has not impaired our independence.
OpinionIn our opinion, the consolidated financial statements on pages 35 to 59 present fairly, in all material respects, the financial position of the Group as at 29 February 2016, and its financial performance and cash flows for the year then ended in accordance with New Zealand Equivalents to International Financial Reporting Standards.
Restriction on Use of our ReportThis report is made solely to the Company’s shareholders, as a body, in accordance with the Companies Act 1993. Our audit work has been undertaken so that we might state those matters which we are required to state to them in an auditors’ report and for no other purpose. To the fullest extent permitted by law, we do not accept or assume responsibility to anyone other than the Company and the Company’s shareholders, as a body, for our audit work, for this report or for the opinions we have formed.
Chartered Accountants 14 April 2016, Auckland
Independent auditors’ reportto the shareholders of Restaurant Brands New Zealand Limited
60 RESTAURANT BRANDS NEW ZEALAND LIMITED

1. NZX listingThe Company’s ordinary shares are listed on the main board equity securities market operated by NZX Limited (NZX Main Board).
2. Distribution of security holders and security holdings Size of holding Number of security holders Number of securities
1 to 999 1,153 19.17% 582,552 0.57%1,000 to 4,999 3,093 51.43% 6,409,532 6.23%5,000 to 9,999 898 14.93% 5,873,153 5.71%10,000 to 49,999 786 13.07% 13,565,329 13.18%50,000 to 99,999 45 0.75% 2,916,672 2.84%100,000 to 499,999 31 0.52% 5,525,283 5.37%500,000+ 8 0.13% 67,998,569 66.10%
6,014 100.00% 102,871,090 100.00%
Geographic distribution Number of security holders Number of securities
New Zealand 5,814 96.68% 91,885,642 89.33%Australia 109 1.81% 10,322,584 10.03%Rest of world 91 1.51% 662,864 0.64%
6,014 100.00% 102,871,090 100.00%
3. 20 largest registered holders of quoted equity securitiesNumber of
ordinary shares
Percentage of ordinary
shares
New Zealand Central Securities Depository Limited 50,991,849 49.57%Diab Investments NZ Limited 5,000,000 4.86%Eyeon QSR Pty Limited (Eyeon QSR Unit A/C) 5,000,000 4.86%FNZ Custodians Limited 2,570,846 2.50%Investment Custodial Services Limited (account C) 1,826,919 1.78%Forsyth Barr Custodians Limited (1-Custody) 1,042,718 1.01%JA Hong Koo & Pyung Keum Koo 911,000 0.89%NZPT Custodians (Grosvenor) Limited 655,237 0.64%Matthew Charles Goodson & Dianna Dawn Perron & Goodson & Perron Independent Trustee Limited 496,666 0.48%New Zealand Depository Nominee Limited (account 1) cash account 487,929 0.47%FNZ Custodians Limited (DTA non resident account) 402,727 0.38%Russel Ernest George Creedy 252,229 0.25%Custodial Services Limited (account 3) 246,399 0.24%David Mitchell Odlin 236,500 0.23%David George Harper & Karen Elizabeth Harper 193,248 0.19%Nina Agnes Limmer 193,143 0.19%Ja Seo Koo & Young Ran Koo 190,000 0.18%Marcia Lynn Hane & William Lee Hane 187,198 0.18%ASB Nominees Limited (569086 ML account) 172,969 0.17%Te Iwi Carving Limited 160,000 0.16%
71,217,577 69.23%
Shareholder informationas at 4 May 2016
ANNUAL REPORT 2016 61

3. 20 largest registered holders of quoted equity securities (continued)New Zealand Central Securities Depository Limited (NZCSD) is a depository system which allows electronic trading of securities to its members. As at 4 May 2016, the NZCSD holdings in Restaurant Brands were:
Number of ordinary shares
Percentage of ordinary
shares
National Nominees New Zealand Limited 9,597,822 9.33%Citibank Nominees (New Zealand) Limited 8,499,886 8.26%Tea Custodians Limited Client Property Trust Account 6,675,777 6.49%New Zealand Superannuation Fund Nominees Limited 5,037,599 4.90%Accident Compensation Corporation 4,126,654 4.02%HSBC Nominees (New Zealand) Limited A/C State Street 3,344,104 3.25%HSBC Nominees (New Zealand) Limited 3,201,148 3.11%Guardian Nominees No2 A/C 3,057,813 2.97%BNP Paribas Nominees (NZ) Limited 2,853,169 2.77%JPMorgan Chase Bank NA NZ Branch 1,552,633 1.51%BT NZ Unit Trust Nominees Limited 1,156,514 1.12%New Zealand Permanent Trustees Limited 722,000 0.70%BNP Paribas Nominees (NZ) Limited 707,021 0.69%Mint Nominees Limited 285,353 0.28%ANZ Custodial Services New Zealand Limited 127,198 0.12%Public Trust Class 10 Nominees Limited 35,550 0.04%BNP Paribas Nominess (NZ) Limited 11,608 0.01%
50,991,849 49.57%
4. Substantial product holdersThe following persons have given notices as at 4 May 2016, in accordance with subpart 5 of Part 5 of the New Zealand Financial Markets Conduct Act 2013, that they were substantial product holders in the Company and held a relevant interest in the number of ordinary shares shown below.
Number of ordinary
shares
Percentage of voting securities
Milford Asset Management Limited 8,278,515 8.46%Stephen Copulos 7,000,000 6.80%Fisher Funds Management Limited 6,046,427 6.18%Salt Funds Management Limited 5,282,910 5.14%Diab Investments NZ Limited (Danny Diab) 5,000,000 5.14%
5. Shares on issueAs at 4 May 2016, the total number of ordinary shares on issue was 102,871,090.
6. Directors’ security holdings Equity securities held
2016 2015
E K van Arkel 50,000 50,000D Diab 5,000,000 5,000,000S Copulos 7,000,000 -
7. NZX waiversNo waivers were sought or relied on from NZX during the period.
Shareholder information (continued)as at 4 May 2016
62 RESTAURANT BRANDS NEW ZEALAND LIMITED

1. DirectorshipsThe names of the directors of the Company as at 29 February 2016 are set out in the Corporate Directory on page 70 of this annual report.
The following are directors of all subsidiary companies of the Group: E K van Arkel and H W Stevens.
The following are directors of Restaurant Brands Australia Pty Limited: E K van Arkel, D Diab and G R Ellis.
2. Directors and remunerationThe following persons held office as directors during the 52 week period ended 29 February 2016 and received the following remuneration and other benefits:
$NZ Directors’ fees
E K van Arkel 100,000 D Diab 60,000 S H Suckling 60,000 H W Stevens 60,000
280,000
3. Entries recorded in the interests registerThe following entries were recorded in the interests register of the Company and its subsidiaries during the year:
a) Share dealings of DirectorsNo shares were purchased or sold by directors of the Company during the 52 week period ended 29 February 2016.
b) Loans to DirectorsThere were no loans to directors during the 52 week period ended 29 February 2016.
Statutory informationfor the 52 week period ended 29 February 2016
Tom’s dare for me this weekend. Didn’t quite finish it you’ll be glad to know. Sic
6 Likes 3 Comments
FollowingJazzee8 hrs
Like Comment Share
ANNUAL REPORT 2016 63

c) General disclosure of interestIn accordance with section 140(2) of the Companies Act 1993, directors of the Company have made general disclosures of interest in writing to the board of positions held in other named companies or parties as follows:
Name Position Party
E K van Arkel Chairman The Warehouse Group LimitedDirector and Shareholder Lang Properties LimitedDirector and Shareholder Van Arkel & Co LimitedDirector AWF Madison Group Limited Director Danske Mobler LimitedDirector Auckland Regional Chamber of Commerce & Industry LimitedDirector Abano Healthcare Group LimitedDirector Philip Yates Family Holdings Limited (and subsidiaries)
S H Suckling Chairman New Zealand Qualifications AuthorityChairman ECL Group LimitedChairman Jacobsen Holdings LimitedChairman Callaghan InnovationChairman Lincoln HubDirector and Shareholder Sue Suckling Holdings LimitedDirector SKYCITY Entertainment Group LimitedTrustee Ministry of Awesome
D Diab Director Diab Investments NZ LimitedDirector and Shareholder Diab Pty LimitedDirector Mainplay Investments Pty LimitedDirector and Shareholder Diab Investments II Pty Limited
H W Stevens Chairman The Kennedys LimitedChairman East Health Services LimitedIndependent Chairman Audit & Risk Sub-Committee, Waikato Regional CouncilDirector Counties Power LimitedDirector AsureQuality LimitedDirector Smart Environmental LimitedDirector Dairy Technical Services LimitedDirector and Shareholder Governance & Advisory LimitedDirector Botany Health Hub Limited
S Copulos Managing Director Copulos Group of CompaniesDirector Citywest Corp Pty Ltd Director Eyeon No 2 Pty LimitedDirector Eyeon QSR Pty LimitedDirector Over 50 private companies and trusts within the Copulos GroupChairman and Major Shareholder Crusader Resources LimitedChairman and Major Shareholder Blackrock Mining LimitedChairman and Major Shareholder Consolidated Zinc LimitedDirector Shepparton Art Museum FoundationDirector Copulos Foundation Private Ancillary Fund
d) Directors’ indemnity and insuranceThe Company has insured all its directors and the directors of its subsidiaries against liabilities to other parties (except the Company or a related party of the Company) that may arise from their position as directors. The insurance does not cover liabilities arising from criminal actions.
The Company has executed a deed of indemnity indemnifying all directors to the extent permitted by section 162 of the Companies Act 1993.
Statutory information (continued)for the 52 week period ended 29 February 2016
64 RESTAURANT BRANDS NEW ZEALAND LIMITED

4. Employees’ remuneration During the period the following number of employees or former employees received remuneration of at least $100,000:
Number of employees
2016 2015
$100,000 – $109,999 4 3$110,000 – $119,999 3 3$120,000 – $129,999 4 3$130,000 – $139,999 6 4$140,000 – $149,999 3 1$150,000 – $159,999 2 3$160,000 – $169,999 - 2$170,000 – $179,999 1 2$180,000 – $189,999 2 -$190,000 – $199,999 1 1$200,000 – $209,999 1 -$210,000 – $219,999 1 -$220,000 – $229,999 2 -$240,000 – $249,999 1 -$270,000 – $279,999 - 1$330,000 – $339,999 - 1$410,000 – $419,999 1 -$730,000 – $739,999 - 1$1,010,000 – $1,019,999 1 -
33 25
5. Subsidiary company directorsNo employee of Restaurant Brands New Zealand Limited appointed as a director of Restaurant Brands New Zealand Limited or its subsidiaries receives, or retains any remuneration or other benefits, as a director. The remuneration and other benefits of such employees, received as employees, are included in the relevant bandings for remuneration disclosed under Note 4 above.
Check out my nails! Took ages but I love them!!!
20 Likes 9 Comments
FollowingNatalie 21 July
Like Comment Share
ANNUAL REPORT 2016 65

OverviewThe board of Restaurant Brands New Zealand Limited is committed to the guiding values of the Company: integrity, respect, continuous improvement and service. Whilst not formally constituted into a code of ethics, it expects that management and staff ultimately subscribe to these values and use them as a guide to making decisions. These values are reflected in a series of formal policies covering such matters as:
• Conflicts of interest• Use of company property• Use of company information• Compliance with applicable laws
ResponsibilityThe board is responsible for the proper direction and control of the Company’s activities and is the ultimate decision-making body of the Company. Its responsibilities include setting strategic direction, approval of significant expenditures, policy determination, stewardship of the Company’s assets, identification of significant business risks, legal compliance and monitoring management performance.
DelegationThe board has delegated responsibility for the day-to-day leadership and management of the Company to the Chief Executive Officer (CEO) who is required to do so in accordance with board direction. The CEO’s performance is reviewed each year by the board. The review includes a formal performance appraisal against measured objectives together with a qualitative review.
The board has approved a schedule of delegated authorities affecting all aspects of the Company’s operation. This is reviewed from time to time as to appropriateness and levels of delegation.
Composition and focusAs at 1 May 2016, the board comprised five non-executive directors (including the Chairman). In addition to committee responsibilities (below), individual board members work directly with management in major initiatives such as acquisitions and asset rationalisations.
Ted van Arkel, Hamish Stevens and Sue Suckling are considered by the board to be independent under the NZX Main Board Listing Rules. Danny Diab and Stephen Copulos are considered not to be independent as they both represent significant shareholdings.
The board does not have a policy on a minimum number of independent directors.
CommitteesFrom amongst its own members, the board has appointed the following permanent committees:
• Audit and Risk Committee. The members of the Audit and Risk Committee are Hamish Stevens (chairman), Ted van Arkel, Sue Suckling, Danny Diab and Stephen Copulos. This committee is constituted to monitor the veracity of the financial data produced by the Company and ensure controls are in place to minimise the opportunities for fraud or for material error in the accounts. A majority of the committee’s members must be independent directors.
• The Audit and Risk Committee meets two to three times a year, with external auditors of the Company and executives performing internal audit management from within the Company in attendance. The external auditors also meet separately with the Audit and Risk Committee with no company executives present.
• The Audit and Risk Committee has adopted an audit charter setting out the parameters of its relationship with internal and external audit functions. The charter which is posted on the Company’s website requires five yearly reviews of the external audit relationship and audit partner rotation.
• Appointments and Remuneration Committee. The members of the Appointments and Remuneration Committee are Sue Suckling (chairman), Ted van Arkel, Danny Diab, Stephen Copulos and Hamish Stevens. This committee is constituted to approve appointments and terms of remuneration for senior executives of the Company; principally the CEO and those reporting directly to the CEO. It also reviews any company-wide incentive and share option schemes as required and recommends remuneration packages for directors to the shareholders.
The Appointments and Remuneration Committee has adopted a written charter which is posted on the Company’s website.
Statement of corporate governanceas at 4 May 2016
66 RESTAURANT BRANDS NEW ZEALAND LIMITED
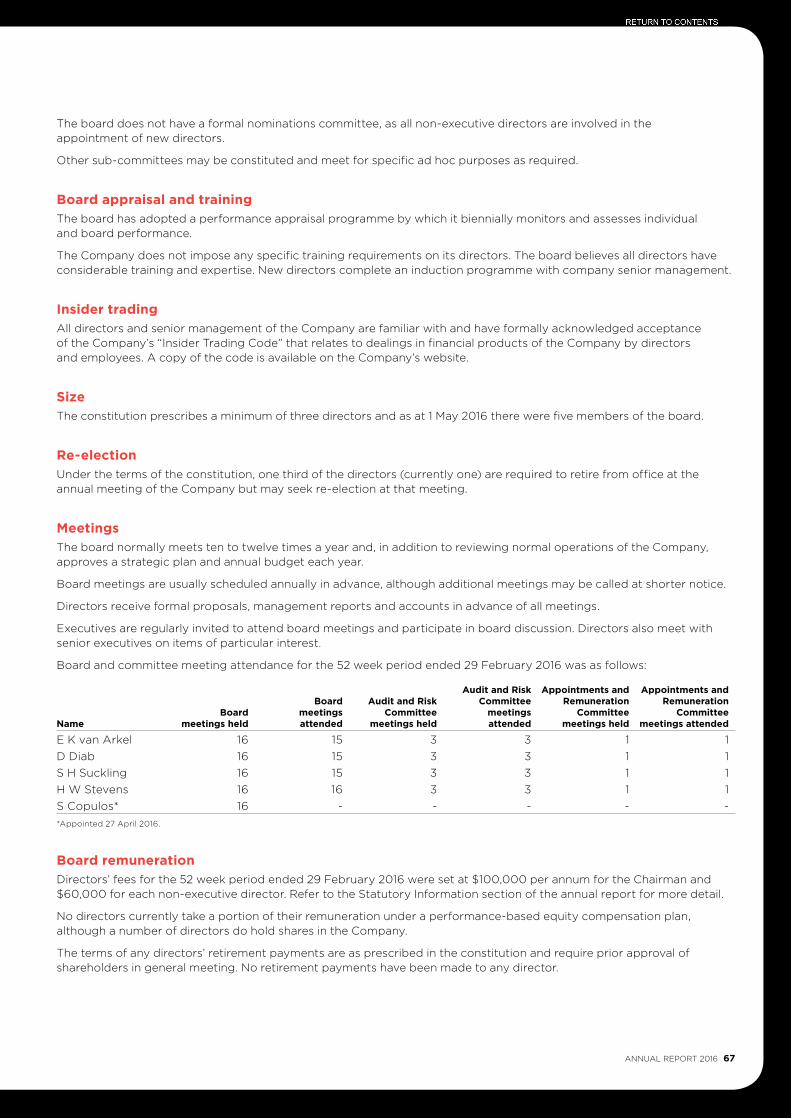
The board does not have a formal nominations committee, as all non-executive directors are involved in the appointment of new directors.
Other sub-committees may be constituted and meet for specific ad hoc purposes as required.
Board appraisal and trainingThe board has adopted a performance appraisal programme by which it biennially monitors and assesses individual and board performance.
The Company does not impose any specific training requirements on its directors. The board believes all directors have considerable training and expertise. New directors complete an induction programme with company senior management.
Insider tradingAll directors and senior management of the Company are familiar with and have formally acknowledged acceptance of the Company’s “Insider Trading Code” that relates to dealings in financial products of the Company by directors and employees. A copy of the code is available on the Company’s website.
SizeThe constitution prescribes a minimum of three directors and as at 1 May 2016 there were five members of the board.
Re-electionUnder the terms of the constitution, one third of the directors (currently one) are required to retire from office at the annual meeting of the Company but may seek re-election at that meeting.
MeetingsThe board normally meets ten to twelve times a year and, in addition to reviewing normal operations of the Company, approves a strategic plan and annual budget each year.
Board meetings are usually scheduled annually in advance, although additional meetings may be called at shorter notice.
Directors receive formal proposals, management reports and accounts in advance of all meetings.
Executives are regularly invited to attend board meetings and participate in board discussion. Directors also meet with senior executives on items of particular interest.
Board and committee meeting attendance for the 52 week period ended 29 February 2016 was as follows:
NameBoard
meetings held
Board meetings attended
Audit and Risk Committee
meetings held
Audit and Risk Committee
meetings attended
Appointments and Remuneration
Committee meetings held
Appointments and Remuneration
Committee meetings attended
E K van Arkel 16 15 3 3 1 1D Diab 16 15 3 3 1 1S H Suckling 16 15 3 3 1 1H W Stevens 16 16 3 3 1 1S Copulos* 16 - - - - -*Appointed 27 April 2016.
Board remunerationDirectors’ fees for the 52 week period ended 29 February 2016 were set at $100,000 per annum for the Chairman and $60,000 for each non-executive director. Refer to the Statutory Information section of the annual report for more detail.
No directors currently take a portion of their remuneration under a performance-based equity compensation plan, although a number of directors do hold shares in the Company.
The terms of any directors’ retirement payments are as prescribed in the constitution and require prior approval of shareholders in general meeting. No retirement payments have been made to any director.
ANNUAL REPORT 2016 67
Directors’ indemnity and insuranceThe Company has insured all its directors and the directors of its subsidiaries against liabilities to other parties (except the Company or a related party of the Company) that may arise from their position as directors. The insurance does not cover liabilities arising from criminal actions.
The Company has executed a Deed of Indemnity, indemnifying all directors to the extent permitted by section 162 of the Companies Act 1993.
Risk managementIn managing the Company’s business risks, the board approves and monitors policy and process in such areas as:
• Internal audit – Regular checks are conducted by operations and financial staff on all aspects of store operations.
• Treasury management – Exposure to interest rate and foreign exchange risks is managed in accordance with the Company’s treasury policy.
• Financial performance – Full sets of management accounts are presented to the board at every meeting. Performance is measured against an annual budget with periodic forecast updates.
• Capital expenditure – All capital expenditure is subject to relevant approval levels with significant items approved by the board. The board also monitors expenditure against approved projects and approves the capital plan.
• Insurance – The Company has insurance policies in place covering most areas of risk to its assets and business. These include material damage and business interruption cover at all of its sites. Policies are reviewed and renewed annually with reputable insurers.
External AdviceDirectors may seek their own independent professional advice to assist with their responsibilities. During the 2016 financial year no director sought their own independent professional advice, but the board sought advice with respect to market levels of director remuneration.
ShareholdingThere is no prescribed minimum shareholding for directors, although some do hold shares in the Company (refer to the Statutory Information section of the report for more detail).
Directors may purchase shares upon providing proper notice of their intention to do so and in compliance with the operation of the Company’s “Insider Trading Code” (see above).
Interests registerThe board maintains an interests register. In considering matters affecting the Company, directors are required to disclose any actual or potential conflicts. Where a conflict or potential conflict has been disclosed, the director takes no further part in receipt of information or participation in discussions on that matter.
Shareholder communicationThe board places importance on effective shareholder communication. Half year and annual reports are published each year and posted on the Company’s website, together with quarterly sales releases. From time to time the board may communicate with shareholders outside this regular reporting regime.
Consistent with best practice and the Company’s continuous disclosure obligations under the NZX Main Board Listing Rules, external communications that may contain market sensitive data are released through NZX in the first instance. Further communication is encouraged with press releases through mainstream media. The board formally reviews its proceedings at the conclusion of each meeting to determine whether there may be a requirement for a disclosure announcement.
Shareholder attendance at annual meetings is encouraged and the board allows extensive shareholder debate on all matters affecting the Company.
Statement of corporate governance (continued)as at 4 May 2016
68 RESTAURANT BRANDS NEW ZEALAND LIMITED
Auditor independenceThe board manages the relationship with its auditors through the Audit and Risk Committee. The Company’s external auditors are currently permitted to provide non-audit services to the Company with the approval of the Audit and Risk Committee. The board utilised the external auditors to provide advice on streamlining of annual accounts in the current year.
Auditors’ remuneration is disclosed in Note 24 to the financial statements.
Diversity PolicyThe Company does not have a formal diversity policy. However it recognises the wide-ranging benefits that diversity brings to an organisation and its workplaces. Restaurant Brands endeavours to ensure diversity at all levels of the organisation to ensure a balance of skills and perspectives are available in the service of our shareholders and customers.
As at 29 February 2016, the gender balance of the Company’s directors, officers and all employees is as follows:
Directors Officers Employees
2016 2015 2016 2015 2016 2015
Female 1 25% 1 25% 4 44% 4 50% 1,816 54% 2,073 53%Male 3 75% 3 75% 5 56% 4 50% 1,547 46% 1,839 47%Total 4 100% 4 100% 9 100% 8 100% 3,363 100% 3,912 100%
NZX Corporate Governance Best Practice CodeIn almost all respects, the Company’s corporate governance practices conform with the NZX Corporate Governance Best Practice Code (the “Code”). The only areas in which the Company’s practices vary from the Code are: it has not adopted a formal code of ethics, does not remunerate directors under a performance based equity compensation plan, does not impose specific training requirements on its directors and does not have a nominations committee.
97 Likes 16 Comments
Followingadd_water31 December
Like Comment Share
ANNUAL REPORT 2016 69

Directors:E K (Ted) van Arkel (Chairman)Sue Helen SucklingDanny DiabHamish William StevensStephen Copulos
Registered office:Level 3Building 7Central Park666 Great South RoadPenroseAuckland 1061New Zealand
Share registrar:Computershare Investor Services LimitedLevel 2159 Hurstmere RoadTakapuna
Private Bag 92 119Auckland 1142New Zealand
Telephone: 64 9 488 8700
Auditors:PricewaterhouseCoopers
Solicitors:Bell GullyHarmos Horton LuskMeredith Connell
Bankers:Westpac Banking Corporation
Contact details:Postal Address:PO Box 22 749OtahuhuAuckland 1640New Zealand
Telephone: 64 9 525 8700Fax: 64 9 525 8711Email: [email protected]
Corporate Directory
70 RESTAURANT BRANDS NEW ZEALAND LIMITED

Annual meeting:22 July 2016
Close of register for final dividend:10 June 2016
Final dividend paid:24 June 2016
Financial year end:27 February 2017
Annual profit announcement:April 2017
Financial Calendar
All social media references in this document are based on real posts by our customers. However, some posts have been recreated and names have been changed to preserve anonymity.
KFC Super Rugby Fanzone #ForTheFans
ANNUAL REPORT 2016 71

Notes
72 RESTAURANT BRANDS NEW ZEALAND LIMITED


Eternal...www.restaurantbrands.co.nz
10,597 5,240
13 February 2016
1,128