Embed Size (px)
Citation preview

Restaurant Brands New Zealand LimitedAnnual Report 31 December 2020
WEDeliver

In New Zealand, COVID-19 and the resulting lockdown forced a five-week full store closure and saw lost sales in excess of $40 million. In Australia and Hawaii restaurant dining areas were also closed. Some remain so.
But, despite this unforeseen and yes, unprecedented curve ball, Restaurant Brands has more than just survived. It is in good health; surging ahead with its plans, delivering on its strategy.
Profit is up by 2.8%. Sales, by 7.0% on an annualised basis. In September, the purchase of 69 new KFC and Taco Bell stores in Southern California was successfully completed. Refurbishments in Hawaii continued with subsequent sales out-performing expectations. New store builds in New Zealand and Australia also continued and 10 stores were opened to the delight of expectant customers.
Restaurant Brands remains strong and resilient; fortified by the diversity of our geographies and brands, the experience and passion of our people, a business structure that works, and an unwavering appetite for growth.
And that billion-dollar target? Bring on 2021!
2020.WHAT A YEAR!
It promises to be a good one!
04
40
18
86
100
California dreaming
Financial statements December 2020
Statement of corporate governance
Year in review
Financialhighlights
Environment, social and governance report
Operations reports
Independent auditor’s report
Corporate directory
Chairman and CEO’s report
Consolidated income statement
Board of Directors
Shareholder information
Financial calendar
Resilience through adversity
Non-GAAP financial measures
Statutory information
05
42
22
88
06
43
28
91
16
80
38
100
03Annual Report 31 December 202002Restaurant Brands New Zealand Limited
About Restaurant Brands:
Restaurant Brands New Zealand Limited operates the KFC, Pizza Hut, Taco Bell and Carl’s Jr. brands in New Zealand, the KFC and Taco Bell brands in Australia, the KFC and Taco Bell brands in California, and the Taco Bell and Pizza Hut brands in Hawaii and Guam. These brands - four of the world’s most famous - are distinguished for their product, look, style, ambience and service and for the total experience they deliver to their customers around the world.
MENUThe

05Annual Report 31 December 202004Restaurant Brands New Zealand Limited
FINANCIAL HIGHLIGHTS YEAR IN REVIEW
Net profit after taxReported net profit after tax of $30.9 million for the year was up $0.8 million on the 44 week reporting period last year, despite being adversely impacted by COVID-19.
Taco Bell launchedThe Taco Bell brand launched in New Zealand and Australia (New South Wales) in late 2019 and has continued to grow with eight stores now successfully operating in these two markets.
Acquisition of California businessThe company acquired 69 KFC and Taco Bell stores in California on 2 September 2020, generating an additional $51.9 million in sales and $8.5 million in EBITDA in the last four months of the financial year.
New balance dateThese trading results for the December 2020 period are for 52 weeks (full year) vs 44 weeks (10 months) for the December 2019 period previously reported.
Total salesTotal sales for the year were $892.4 million, up against the previous 44 week period, with full year positive same store sales growth across all three operating divisions. On an equivalent 12 month basis total sales were up by 7.0% or $58.5 million.
Total EBITDA1
Combined store EBITDA1 (pre NZ IFRS 16) for the period was $147.3 million, up 27.0% on the previous 44 week period. On an equivalent 12 month basis, EBITDA was up over 7.5% or $10.3 million.
TOTAL SALES ($NZ m) TOTAL EBITDA ($NZ m)HISTORICAL SUMMARY
All figures in $NZ millions unless stated52 weeks
27 Feb 2017 52 weeks
26 Feb 201852 weeks
25 Feb 201944 weeks
31 Dec 201952 weeks
31 Dec 2020
Financial performance Sales*New Zealand 400.0 421.4 419.8 367.5 410.4 Australia 97.2 151.8 191.5 169.1 214.9 Hawaii – 167.5 182.7 168.9 215.1 California – – – – 51.9 Total sales 497.2 740.8 794.0 705.5 892.4
EBITDA before G&A*New Zealand 71.2 76.5 76.4 67.9 75.9 Australia 15.0 22.0 29.1 25.2 29.4 Hawaii – 24.1 23.7 22.9 33.5 California – – – – 8.5 Total EBITDA 86.2 122.6 129.2 116.0 147.3
EBIT 39.4 57.8 56.2 64.4 75.2 NPAT (reported) 26.0 35.5 35.7 30.1 30.9
Financial position/cash flowShare capital 143.4 148.5 154.6 154.6 154.6 Total equity 192.1 201.6 224.7 208.0 230.5 Total assets 302.4 453.0 460.3 879.9 1,173.0 Operating cash flows 47.9 67.8 71.3 87.6 111.9
SharesShares on issue (year end) 122,843,191 123,629,343 124,758,523 124,758,523 124,758,523Number of shareholders (year end) 6,294 7,005 7,127 6,026 5,428Basic earnings per share (full year reported) 24.1c 28.8c 28.8c 24.1c 24.8cOrdinary dividend per share 23.0c 28.0c 0c 0c 0c
OtherNumber of stores (year end)New Zealand 170 171 142 148 137Australia 42 61 61 65 70Hawaii – 82 80 74 72California – – – – 69Total stores 212 314 283 287 348
Number of employeesNew Zealand 3,422 3,596 3,484 3,777 4,582Australia 2,354 3,275 3,360 3,887 4,055Hawaii – 2,185 2,007 1,935 2,055California – – – – 1,381Total employees 5,776 9,056 8,851 9,599 12,073
* Sales and EBITDA before G&A for each of the division may not aggregate to the total due to rounding.
1 EBITDA is earnings before interest, tax, depreciation and amortisation. It is a non-GAAP financial measure and is not prepared in accordance with NZ IFRS.
20
892.4
20
147.3
1817 19 19DecFeb
705.5
794.0740.8
497.2
1817 19 19DecFeb
116.0129.2
122.6
86.2
TOTAL ASSETS ($NZ m)
20
1,173.0
1817 19 19
DecFeb
879.9
460.3453.0
302.4
NPAT (REPORTED) ($NZ m)
20
30.9
1817 19 19
DecFeb
30.1
35.735.5
26.0

The financial results for the California division have been significantly above expectations despite the challenges of COVID-19.
$30.9M
07Annual Report 31 December 202006Restaurant Brands New Zealand Limited
The acquisition of 69 stores in California (58 KFC and 11 joint KFC/Taco Bell) was successfully completed on 2 September 2020. The financial results for the California division have been significantly above expectations despite the challenges of COVID-19. The division added $51.9 million in total sales and $8.5 million in store EBITDA over the four months of ownership.
The resulting reported FY20 NPAT of $30.9 million is up 2.8% or $0.8 million on the prior 44 week period.
OverviewDuring the year ended 31 December 2019 Restaurant Brands changed its balance date from February to December. Hence the comparative financial results for the reporting period to December 2019 (FY19) are for 44 weeks compared to 52 weeks for the current reporting period (FY20). Two other significant factors have impacted the FY20 results compared with prior year: the adverse effect of COVID-19 and the positive impact of the California acquisition.
COVID-19, whilst creating considerable disruption across all four operating divisions, was particularly testing for the New Zealand operations with the entire business being closed for nearly five weeks in March-April 2020. The Australian, Hawaiian and Californian operations, whilst adversely affected, have generally continued to trade through the crisis (with some limitations) and consequently have sustained much less of an adverse profit impact.
NET PROFIT AFTER TAXREPORTChairman
and CEO’s
06Restaurant Brands New Zealand Limited
$NZm52 weeks Dec 2020
44 weeksDec 2019 Change ($) Change (%)
Total sales 892.4 705.5 +186.8 +26.5Net profit after tax (NPAT) 30.9 30.1 +0.8 +2.8
Note: With the change in balance date last year, the comparative reported results are for the 44 weeks ended 31 December 2019 (Dec 2019) whereas the current year comparisons are for the 52 weeks ended 31 December 2020 (Dec 2020). A comparable unaudited ‘gross up’ summary is included on page 41 of this report.

Annual Report 31 December 2020 09Annual Report 31 December 202008Restaurant Brands New Zealand Limited
In addition to the change of balance date, two other factors distort the prior year comparison: the continuing negative impact of NZ IFRS 16, and other income and expenses.
The table above sets out a like-for-like comparison of the current year’s 12 month result versus the prior year 10 months’ normalised trading (detail of which is included on page 41 of this report). After adjusting for the negative impact of the NZ IFRS 16 accounting lease standard and the shorter trading period (estimated at $7.1 million), together with the impact of higher The New Zealand business was
completely closed for nearly five weeks in March-April 2020 as part of the COVID-19 lockdown, losing an estimated $40 million in sales over the period. However upon re-opening the business recovered well, with same store sales for the full year up +5.3%. The underlying sales growth has been driven by another good performance by KFC combined with Carl’s Jr., both brands sales have remained strong throughout the year with growth through both the delivery and in-store channels. The accelerated expansion of delivery channels as part of the COVID-19 response has also helped. Taco Bell remains only a small portion of the New Zealand business sales with three stores opened during the year and sales from the four existing stores continuing to track above expectations.
net expenses unrelated to normal trading, the underlying trading profit is estimated at $46.7 million (up 2.2% on the prior equivalent year).
Total brand sales for the Company were $892.4 million, up $186.8 million when compared with the 44 week prior period. On a like-for-like annualised footing they are up approximately 7.0%, primarily because of the inclusion of $51.9 million of sales for the four months following the California acquisition. All three existing divisions produced positive same store sales.
EBITDA was up $8.0 million reflecting the higher sales; however the underlying EBITDA as a percentage of sales has remained constant on 18.5%.
As part of the COVID-19 response the New Zealand business received a government wage subsidy of $22.0 million, which was fully passed on to all staff. This number has been included in the statement of comprehensive income. Restaurant Brands elected to retain all staff at 100% of their wages and salaries throughout the lockdown period. Although the wage subsidy helped to offset the cost to the business, there was a shortfall of approximately $0.5 million per week. There were also other fixed costs incurred during the mandated lockdown which contributed to an estimated $4.4 million drop in EBITDA before G&A costs over the closure period.
Restaurant Brands New Zealand Limited
Group operating results
New Zealand operations
Combined store EBITDA (pre-NZ IFRS 16 and other items) of $147.3 million was up $31.4 million or +27.0% on the prior period. On an annualised basis the results were up 7.5%, due to strong performance in Hawaii and the acquisition of the California operations. EBITDA margins (as a % of sales) improved from 16.4% to 16.5% due to the strength of the Pizza Hut Hawaii performance.
Restaurant Brands’ store numbers at the end of the financial year totalled 348, comprising 137 in New Zealand, 72 in Hawaii, 70 stores in Australia and 69 stores in California.
The Pizza Hut sub-franchising process continues, with 16 stores sold to franchisees during the year. This included two turnkey stores. The company now operates 13 stores with independent franchisees operating 90 stores.
Overall store numbers decreased by 11 during the year with the 16 Pizza Hut stores sold offset with one new KFC store being opened in Central Christchurch and the continued roll out of Taco Bell with three new stores opened in the greater Auckland region. KFC Kapiti was also acquired from an independent franchisee during the period. All five of the new stores are trading well.
Directors are pleased to report that Restaurant Brands has produced a net profit after tax (NPAT) for the year ended 31 December 2020 (FY20) of $30.9 million, up 2.8% on the reported NPAT of $30.1 million for the prior period. As previously noted, the prior period reported NPAT is for 44 weeks compared to 52 weeks in this year.
Total store sales in New Zealand were $410.4 million, up $42.9 million or +11.7% on the 44 week period ending December 2019. This is a result of the additional eight weeks trading in the December 2020 year, partially offset by the five weeks full store lockdown due to COVID-19 with lost sales of approximately $40 million.
$892.4MTOTAL SALES
The underlying sales growth has been driven by another good performance by KFC, combined with Carl’s Jr.
Strong sales
$NZm after tax52 weeks Dec 2020
44 weeks Dec 2019 Change ($) Change (%)
Reported NPAT 30.9 30.1 0.8 +2.8Impact of NZ IFRS 16 7.0 4.5 2.5 +55.6Other income and expenses 8.8 4.0 4.8 +120.0Change of balance date* – 7.1 (7.1) –Comparable trading NPAT 46.7 45.7 1.0 +2.2
*Estimated (unaudited) NPAT over the eight weeks to February 2020, prorated from the 44 weeks to December 2019.
Actual 52 weeks
31 Dec 2020
Actual 44 weeks
31 Dec 2019
Proportioned 52 weeks
31 Dec 2019 Change ($) Change (%)
Store sales ($NZm) 410.4 367.5 434.3 +42.9 +11.7EBITDA ($NZm) 75.9 67.9 80.3 +8.0 +11.7EBITDA as a % of sales 18.5 18.5 18.5Store numbers 137 148
The proportioned 52 weeks in the table above is an arithmetical calculation factoring up the 44 weeks ending Dec 2019 (26 February 2019 to 31 December 2019) to a 52 week equivalent. This is for illustrative purposes only.

11Annual Report 31 December 202010Restaurant Brands New Zealand Limited
Total sales in Australia were $A202.4 million, up $A42.2 million (or +26.3%) on last year, and on a proportioned 52 week basis sales were up $A13.1 million primarily due to the effect of additional store openings. Same stores sales were also up 2.0%.
There was significant disruption to stores due to COVID-19 with the temporary closure of all mall stores and the extended closure of all dine-in restaurants. The business has focused on ensuring a continued safe work environment for all members of staff and the highest hygiene standards
In $NZ terms the Hawaiian operations contributed $NZ215.1 million in revenues and $NZ33.5 million in EBITDA for the year. These results were all up (particularly Pizza Hut) on the equivalent December 2019 year despite the operational challenges created by COVID-19.
Reported sales are up $US28.5 million to $US139.3 million primarily due to the comparison with last year’s reporting period of 44 weeks. On an equivalent year comparison sales were up $US8.5 million for the period which is reflected in same store sales growth of 7.7% for the year.
for customers, whilst providing continued emphasis on providing efficient delivery services.
Investment in KFC store upgrades continued, together with new store openings. Two new drive-thru Taco Bell sites and four additional KFC stores opened during the year, bringing total store numbers to 70.
With the extended closure of the dine-in facilities due to COVID-19 the home delivery service was expanded-into New South Wales regional locations, which generated further growth in the KFC delivery channel.
Pizza Hut saw a significant increase in both sales and profitability. The excellent response by the Pizza Hut brand to the challenges created by COVID-19 was a major driver of the strong sales performance. With Pizza Hut USA emphasising food safety, no-touch contactless delivery as well as the roll out of curbside delivery, customers reacted favourably, particularly with the continued influence of COVID-19 in Hawaii. Online ordering grew significantly and now accounts for 60% of sales. The closure of seven old format stores at the end of last year, and a further three stores this year, with a move towards smaller and more efficient delivery and carry-out (delco) style stores also helped drive profitability.
Australian operations Hawaiian operations
This has helped maintain same store sales growth over the past 12 months, but has added to the cost pressures of the business which, together with initial Taco Bell set up costs, is reflected in a drop in EBITDA as a percentage of sales to 13.7%.
Store EBITDA margins of $A27.7 million (13.7% of sales) were up $A4.3 million or +18.4% on last year. This reflects the additional eight weeks trading. On an equivalent 52 week basis store EBITDA has remained flat with additional sales offset by higher cost pressures.
Although Taco Bell was harder hit by the closure of dine-in options, the promotions around family size meals and affordable pricing was successful with drive through average customer spend increasing significantly. Uber Eats and DoorDash also came on board as additional food aggregators (in addition to Grubhub) which has also helped to drive delivery sales.
Store numbers are down by net two from December 2019 following the closure of three Pizza Hut stores as part of the strategy to close some very old dine-in restaurants. During this period one new Pizza Hut store has opened and is performing strongly.
The Australian business contributed total sales of $NZ214.9 million (up 27.1%), and a store EBITDA (excluding the effect of NZ IFRS 16) of $NZ29.4 million (up 16.7%).
Total sales in Hawaii for the period were $US139.3 million with store level EBITDA of $US21.5 million (15.6% as a percentage of sales vs 13.5% in the prior period).
+26.3%STORE SALES ($A m)
The excellent response by the Pizza Hut brand to the challenges created by COVID-19 was a major driver of the strong sales performance.
Actual 52 weeks
31 Dec 2020
Actual 44 weeks
31 Dec 2019
Proportioned 52 weeks
31 Dec 2019 Change ($) Change (%)
Store sales ($Am) 202.4 160.2 189.3 +42.2 +26.3EBITDA ($Am) 27.7 23.4 27.7 +4.3 +18.4EBITDA as a % of sales 13.7 15.4 15.4Store numbers 70 65
The proportioned 52 weeks in the table above is an arithmetical calculation factoring up the 44 weeks ending Dec 2019 (26 February 2019 to 31 December 2019) to a 52 week equivalent. This is for illustrative purposes only.
Actual 52 weeks
31 Dec 2020
Actual 44 weeks
31 Dec 2019
Proportioned 52 weeks
31 Dec 2019 Change ($) Change (%)
Store sales ($USm) 139.3 110.7 130.8 +28.6 +25.8EBITDA ($USm) 21.5 15.0 17.7 6.5 43.3EBITDA as a % of sales 15.6 13.5 13.5Store numbers 72 74
The proportioned 52 weeks in the table above is an arithmetical calculation factoring up the 44 weeks ending Dec 2019 (26 February 2019 to 31 December 2019) to a 52 week equivalent. This is for illustrative purposes only.

13Annual Report 31 December 202012Restaurant Brands New Zealand Limited
The California division made a solid contribution to the Group results over the four months since acquisition. Despite the dine-in channels being closed due to COVID-19 for the majority of the four months, drive through sales have remained strong and, like the other divisions, delivery sales are well above expectations. The strong sales have driven a higher than expected EBITDA margin percentage to sales of 16.4%, producing store earnings well above expectations.
The business saw an extensive reinvestment programme prior to settlement. However in line with the strategy to further reinvest in the stores, more capital expenditure is planned for this market, including new store builds of which two are already underway.
Californian operationsFollowing Yum! and landlord approval, the acquisition of 69 stores in California was settled on 2 September 2020. With most of the existing management team in place, the completion was executed smoothly. Even with the impact of COVID-19 on the business effectively closing the dine-in channel, management continuity and the benefit of recently upgraded stores ensured that Restaurant Brands’ most recent acquisition delivered initial financial results well ahead of expectations.
Total sales in California for the period were $US35.6 million with store level EBITDA of $US5.8 million (16.4% as a percentage of sales).
In $NZ terms the California operations contributed $NZ51.9 million in revenues and $NZ8.5 million in EBITDA for the four month period from 2 September 2020.
Corporate & otherGeneral and administration (G&A) costs were $45.6 million, up $12.3 million from last year due to the longer current reporting period, but also up $6.2 million on a normalised annual basis. Most of the increase came from long term incentive remuneration and additional G&A charges in California as that acquisition came on stream. G&A as a % of total revenue was 4.9% which is up from 4.5% for the period ended 31 December 2019. This was largely due to the effect of the full closure of the New Zealand stores and the lost sales during that period.
Depreciation charges of $65.0 million for the year ended 31 December 2020 were $17.2 million higher than the prior year primarily due to the impact of the additional reporting weeks. It also included $5.7 million from the newly acquired California division. Of the $65.0 million, $30.9 million related to right of use asset depreciation incurred under NZ IFRS 16.
Financing costs of $30.2 million were up $8.8 million on prior year, once again reflecting the impact of the additional reporting weeks. Interest on bank debt for the period ended 31 December 2020 was $6.5 million, up $1.4 million on last year due to the longer reporting period and the additional debt taken on to acquire the California business.
This was partially off-set by a lower effective interest rates following the restructure of the Group’s debt facilities which was activated in May 2020.
Tax expense was $14.0 million, up $1.2 million on the prior year. The effective tax rate was 31.2% (29.9% for FY19) with a higher level of non-deductible expenses in the current year.
Other itemsOther net income and expense of $8.8 million is up from $4.6 million for the prior period. This primarily relates to acquisition costs associated with the California acquisition of $4.3 million.
Cash flow & balance sheetThe total assets of the Group are $1,173.0 million, up $293.1 million primarily due to the inclusion of $263.2 million of new assets in California. Equally there has been an increase of $270.6 million in liabilities, primarily reflecting the future discounted lease liability on leases acquired and an increase in debt drawdowns arising from that transaction.
Included in the Group’s debt is a $11.3 million Paycheck Protection Program loan (PPP loan) in Hawaii from the US federal government. Application has been made for the loan to be forgiven with a decision expected by mid-2021.
Operating cash flows were up $24.2 million to $111.9 million, reflecting the additional weeks being reported, along with the strong trading performance. The inclusion of the California business has also had a positive impact on operating cash flows.
Net investing cash outflows were $178.0 million (versus $59.7 million last year) including the acquisition of the California business for $119.2 million ($US80.7 million). Payments for fixed assets and intangibles of $60.5 million was up from $59.7 million with five new KFC, and five new Taco Bell stores in New Zealand and Australia and significant KFC refurbishment expenditure in both those markets. In addition there were several major Taco Bell refurbishments in Hawaii. This year’s net investing cash flows also included inflows of $4.5 million received, primarily from the sale of Pizza Hut stores in New Zealand.
The strong sales have driven a higher than expected EBITDA margin percentage to sales of 16.4%.
Actual 52 weeks
31 Dec 2020
Actual 44 weeks
31 Dec 2019 Change ($) Change (%)
Store sales ($USm) 35.6 n/a n/a n/aEBITDA ($USm) 5.8 n/a n/a n/aEBITDA as a % of sales 16.4 n/aStore numbers 69 n/a
Acquisition accomplished

15Annual Report 31 December 202014Restaurant Brands New Zealand Limited
Ongoing investment in both new store builds and acquisitions will continue to be undertaken within a disciplined and structured framework and only embarked upon where clearly shareholder value accretive.
Annual Shareholders’ MeetingThe Annual Shareholders’ Meeting of the company will be held on Thursday 27 May 2021. Given the COVID-19 uncertainty, it will be a virtual meeting.
José Parés Chairman of the Board
Russel Creedy Group CEO
25 February 2021
OutlookThe focus for Taco Bell in New Zealand and Australia remains on investing to build brand presence with more than ten stores expected to open by December 2021. The Taco Bell brand’s sales will continue to grow in significance as additional stores are opened. However overall the financial impact of the brand on the Group will remain slight for the coming year.
The inclusion of 58 KFC and 11 joint KFC/Taco Bell stores in California will have a positive impact on earnings profile in the 2021 year.
Current trading for the new year remains strong across all divisions; however with the current uncertainties that remain with COVID-19 it is difficult to provide firm guidance. Further updates will be provided at the annual meeting.
Board of Directors We would also like to thank our dedicated Directors for their encouragement as the company has navigated what has been an ever changing and challenging trading environment over the past twelve months. This support and guidance has been invaluable keeping the business on track through these difficult times.
Whilst we do have a strong board with a range of skills, we this year have taken the opportunity to recruit a new Director. We welcome Maria Elena (Malena) Pato-Castel as an independent Non-Executive Director of the company with effect from 1 April 2021.
Malena, who is based in Spain, brings to the Board of Restaurant Brands over 30 years of experience in the consumer goods and restaurant industries, most recently spending nine years at AmRest Holdings SE. She has also served on the board of various Yum! Brands subsidiaries that operated Pizza Hut and KFC stores in Spain.
Future strategiesWith the settlement of the California acquisition in September this year, Restaurant Brands has now established a firm presence in each of its four key operating markets. This has significantly diversified our earnings stream from the 100% New Zealand base of five years’ ago to a position where the New Zealand business now only slightly more 40% of total sales and earnings.
We have a growth strategy for each market.
We will continue to deliver organic same-store sales and profit growth through: operational improvements, store refurbishments, channel enhancements, innovative marketing, new product development, and staff attraction and retention initiatives.
However significant additional growth opportunities exist by expanding our networks in each location through either new store builds or acquisitions. New store builds in the KFC and Taco Bell brands is a prime focus for the Australian and New Zealand markets. California also has significant KFC new store opportunities and we expect to be opening our first KFC store in Hawaii in the next 1-2 years. Acquisitions remain opportunistic in nature, but the Californian and Australian markets in particular have significant opportunities.
Staff appreciationThis has been an extremely challenging year for the 12,100 staff members of Restaurant Brands, particularly with the continued uncertainty brought about by COVID-19. The entire team has done an outstanding job reacting to the ever changing environment we have been working in to ensure we continue to deliver top quality products to our customers whilst maintaining the highest levels of health and safety for both our employees and customers. We also acknowledge that for many of our employees the wider impact of COVID-19 on them and their families has been particularly difficult with some team members directly impacted by the virus.
With the completion of the California acquisition we welcome Raziel Valiente (CEO RBD California Restaurants) and her 1,500 strong California team to Restaurant Brands.
Continued growth
The Taco Bell brand’s sales will continue to grow in significance as additional stores are opened.

17Annual Report 31 December 202016Restaurant Brands New Zealand Limited
RESILIENCEGeographyGeographically, our business now operates in four different countries or states (six if we include Guam and Saipan). This geographical diversity means our business is not over-exposed to any local physical or socio-economic events beyond our control – should they arise.
Hurricanes in Hawaii, droughts in Australia and earthquakes in New Zealand – we’ve had them all. Each time, the local operation may take a hit but the overall group business has remained steady on an even keel.
Throughout this pandemic, while some markets went into total lockdown resulting in local stores closing, stores in other markets were able to remain open. We may not have been firing on all cylinders all of the time, but we kept firing.
A strategy built for resilience also meant we were able to adapt our existing channels to fulfil customers’ needs throughout the COVID-19 crisis.
Store closures during lockdown effectively took in-store dining off the table. But by innovating and reorganising our channel operations we were able to offer improved online ordering together with no-touch, contactless ‘click and collect’. Digital orders went through the roof and, of course, drive through surged as an available option for our customers to get the food they love.
Last but by no means least – our peoplePassionate, hardworking, resourceful – our people are our business. Throughout the ins and outs of lockdown, they’ve shown an ability to innovate, work our systems in another gear, and stick steadfastly to the hygiene disciplines that keep both our employees and customers safe. Overall they’ve shown a resilience of which we can all be proud. And thankful.
No one part of our business works in isolation. It all works together to make the most of the highs and diffuse the impact of the lows. But it starts with strategy – the planning that always looks for opportunities to grow the business without ever taking its eye off those rogue events that could knock you off your course.
BrandsAs a multi-brand franchisee we enjoy brand-led relationships with many different audience segments right across the fast food market. It’s an incredible breadth of market appeal.
From KFC die-hards who love the taste of fried chicken, to the discerning lovers of authentic American-style burgers who won’t pass a Carl’s Jr., to Pizza Hut afficionados who know they can rely on us to deliver their favourite pizza – we have a brand that appeals to almost everyone. And now with Taco Bell we can reach even further by meeting the demands of an increasingly brand savvy generation hungry for a taste of this brand’s international cult following.
It’s tough to appeal to all of the people all of the time and like any good relationship we have to work at it. We keep close to our customers constantly monitoring the pulse of their changing tastes, responding to their shifting values and their demands for new experiences. Taco Bell is a perfect example; fifteen years ago there was little demand in Australia and New Zealand for Mexican-inspired food. But now the time is ripe and customers can’t get enough of it.
This all-singing, all-dancing brand portfolio means we can take the best learnings from working with each brand across a multitude of stores and apply them to the benefit of all stores and the company as a whole.
Contactless
Sure COVID-19 hit hard, like a rogue wave hits a ship. But our superstructure – forged from strategy, operations and passion – is built for it.
Strategy’s purpose is to set direction and provide a coherent framework for decision-making. It defines how we use our resources so we create value – and grow. It unifies our businesses, so everyone understands what we’re doing, where we’re heading and why; and as many folk like to say in New Zealand, so we paddle our ‘waka’ together in time.
But strategy at Restaurant Brands goes further, deeper, broader than that. It’s not only about growth, it’s also about resilience. It considers how we minimise the negative impacts from challenges that could come from anywhere at any time. Like a global pandemic.
Our strong performance over the last year in the face of COVID-19 has nothing to do with good fortune. It owes much to a strategy that gives us the framework to innovate and turn adversity into advantage.
You see this on many fronts: geographic, brand, store format, consumer tastes, lifestyle preference. All aspects of our business that encourage growth as well as provide for resilience in uncertain times.
Thanks!
With many customers confined to their homes, delivery becomes king. By coupling our own delivery driver network with those of third party aggregators like Uber Eats, we quickly mastered the challenges of getting food from the store to the customer – quick and fresh.
Store format and lifestyle
Through AdversityDigital orders went through the roof.
19Annual Report 31 December 202018Restaurant Brands New Zealand Limited
So, you might wonder, ‘what chance does a New Zealand fast food company have entering the US market – the home of fast food since the beginning of time?’ How do naysayers put it? ‘Mate, you’re dreamin’.
This is no dream. Restaurant Brands’ growth and expansion strategy has long considered the opportunity to establish a beachhead in the US, and with the ink on the agreement barely dry, our mainland Stateside ambitions are now a reality.
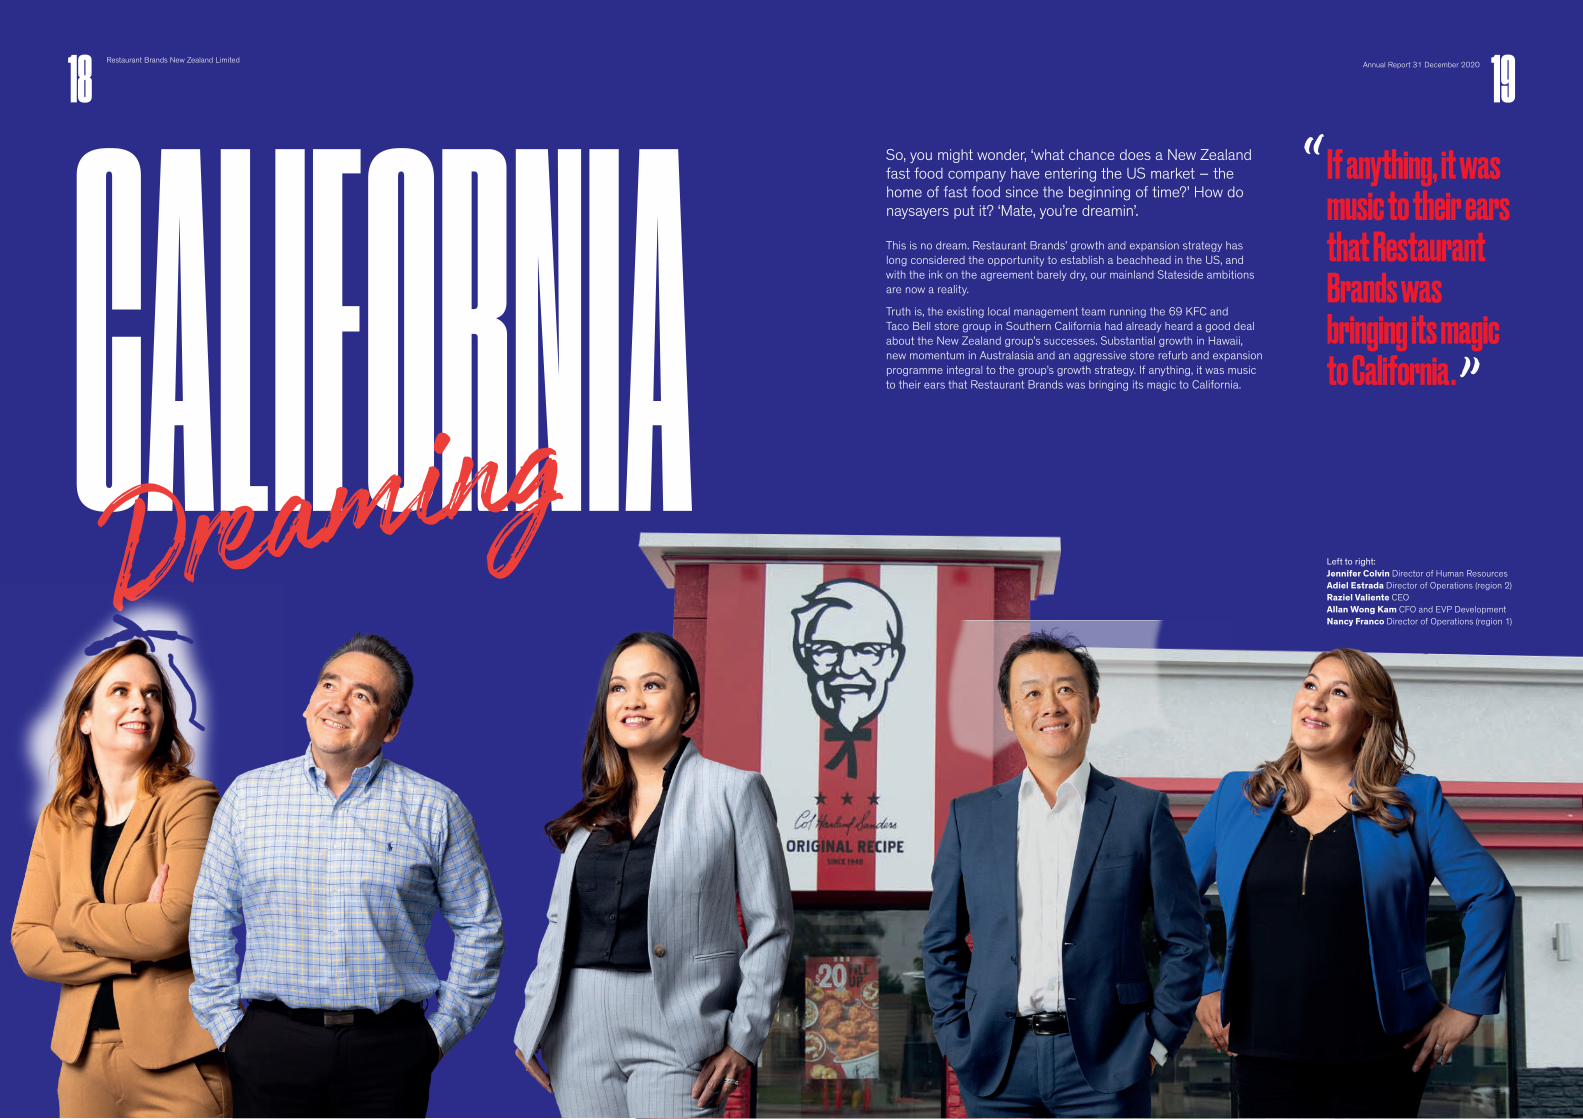
Truth is, the existing local management team running the 69 KFC and Taco Bell store group in Southern California had already heard a good deal about the New Zealand group’s successes. Substantial growth in Hawaii, new momentum in Australasia and an aggressive store refurb and expansion programme integral to the group’s growth strategy. If anything, it was music to their ears that Restaurant Brands was bringing its magic to California.
If anything, it was music to their ears that Restaurant Brands was bringing its magic to California.CALIFORNIADreamingLeft to right: Jennifer Colvin Director of Human Resources Adiel Estrada Director of Operations (region 2) Raziel Valiente CEO Allan Wong Kam CFO and EVP Development Nancy Franco Director of Operations (region 1)

21Annual Report 31 December 202020Restaurant Brands New Zealand Limited
Raziel Valiente, CEO of the newly acquired store group, is particularly enthusiastic.
“There is so much opportunity here with KFC, the business is crying out for Restaurant Brands’ visionary growth mindset”, she says.
Not that the KFC stores in Southern California aren’t already doing extremely well. On the contrary Raziel points out, “There are around 4,000 KFCs in the US and, in spite of Covid, our stores are performing higher than the average because our 69 store group gives us economies of scale – our food and labour cost structures are well managed, the quality of our product is consistent and we run a good operation.”
But it’s the opportunity for growth that excites Raziel and her team the most, and us too for that matter.
Allan Wong Kam, the newly appointed CFO for Southern California knows a thing or two about KFC growth; he was amongst the action during the successful New Zealand store transformation in the early 2000s. And he’s across the numbers now too.
“There is a much lower level of penetration in Southern California compared with what we enjoy in New Zealand. There’s so much scope for a denser store footprint especially when considering people in California prefer to avoid the congested freeways and stick to their immediate neighbourhoods,” assures Allan.
Besides opening new stores in new neighbourhoods, Restaurant Brands will be on the look out for acquisition opportunities to build critical mass. The KFC franchise community in California seems supportive of the new franchisee in their midst. Indeed the company is seen as the logical acquirer of smaller franchises in the state, many of which are owned by operators fast approaching retirement.
Nancy Franco and Adiel Estrada are both operations directors on Raziel’s team and, with each having around 30 years experience with KFC, they both know the Southern California market back to front and inside out. They share Raziel’s energy and enthusiasm for the future growth of the business.
“We just put an offer in on a new store today,” says Adiel, “I’m so excited about this. We’ve got a great team with same store sales growth but we’ve not had any new restaurants coming on stream to really make a difference. Now we’re planning for three this year.”
There is so much opportunity here with KFC, the business is crying out for Restaurant Brands’ visionary growth mindset.RAZIEL VALIENTE, CEO
We’re going to be the Best in Class 2021 and go full on to double this business over the next few years.ADIEL ESTRADA
Right from the start Restaurant Brands’ New Zealand team of Russel Creedy, Grant Ellis and Chairman, José Parés made their mark on the Southern Californian management. Nancy recalls one of the earlier visits.
“They were so wonderful and warm – they truly care about the business and are family oriented. I learnt so much in one day going around the stores. Russel’s knowledge and ideas of how to appeal to local tastes and to grow our business was inspiring.”
Raziel remembers too how José spent time talking to the frontline managers and crew in Spanish and that made everyone feel very special.
“37% of the population in Southern California is Hispanic, yet marketing has typically been slow to pick up on that. José speaking in Spanish made a big impression. I have no doubt now that Restaurant Brands’ focus on the customer will see us put more focus on the Hispanic consumer. It’s a huge opportunity here,” she says.
Raziel and her team are fired up for sure with a new enthusiasm and hunger for growth. Adiel, with the growth bit between his teeth, went further.
“With Raziel and Restaurant Brands’ leadership, we’re taking this company to the next level. We’re going to be Best in Class in 2021 and go full on to double this business over the next few years.”
Call it irrepressible American enthusiasm or just healthy ambition, either way Restaurant Brands’ growth strategy continues with our South Californian beachhead. We’ve been planning our American expansion for some time and now we’re in a unique position for further acquisitions creating further critical mass. It’s all part of the strategy. It never was a dream.
Finger lickin’ growth

GREATERSustainability
23Annual Report 31 December 202022Restaurant Brands New Zealand Limited
PURP
OSE
PILLA
RSST
RATE
GIC TH
EME
Caring about people and communities Environmental consciousness Leading in food quality
An inclusive and productive team
focused on wellbeingSupporting our communities
Waste management
Resource stewardship
Beyond compliance Ethical sourcing
A thriving business built on brands that our employees and customers love and trust
Each strategic theme has its own programmes, policies and key performance indicators, so we can measure how we’re improving.
Let’s take a closer look.
Our journey to greater sustainability started in 2019, and we started well by developing a new ‘best practice’ sustainability framework for operational and sustainability reporting, following the GRI (Global Reporting Initiative) standards. Over the past year we’ve refined that framework, establishing targets and incorporating better sustainability processes into our day-to-day business practices. We’ve enhanced our ability to measure our key targets, which helps us to continually improve our sustainability. And we’ve built the benefits of that straight back into the business, making it stronger.
Have we made as much progress as we’d like? No. But our response to the business threat COVID-19 presented, had to take precedence. That said, the leadership team remains positive and committed to embedding our sustainability gains and continually making improvements.
Roll on 2021/22.
We established three key pillars to achieve our purpose. Each pillar has two strategic themes:

$35,000
$200,000
25Annual Report 31 December 202024Restaurant Brands New Zealand Limited
We look forward to providing continued support for organisations that break down the barriers to quality education and under privileged youth in New Zealand.
Total donations These have increased from $0.3m to $0.4m from 2019 to 2020. We aim to continue growing this amount.
Food rescue Where local circumstances permit, we participate in food donation programmes, donating dry goods and surplus food waste. We are working with the organisations involved in food rescue to help increase their capacity, as they often lack resources to deal with our volume.
Staff volunteer Each Restaurant Brands division is involved in volunteer work in their communities, however COVID-19 put a stop to this during the 2020 year. Whilst we have no set policy or requirement for volunteer community work, we actively encourage it, and we are proud of the volunteer work our teams do in their communities during the year.
Local procurement Wherever possible, our policy is to purchase from local suppliers. There are some constraints on this as Australia, Hawaii and California are heavily dependent on the Yum! supply chain. However, our aim in the New Zealand market is to purchase at least 80% of our product locally.
How are we doing? For 2020, the New Zealand division purchased 72% from local suppliers based. (*Figures based on % of local based suppliers used, not on volume).
2020 2019
New Zealand 5.2 6.3Australia 11.9 10.0Hawaii 2.5 6.2California 5.2 n/a
STRATEGIC THEME 2
Supporting our communities
KEY PROGRAMMES
Community donationsThe company has a number of key community organisations it supports, these include:
New Zealand Surf Lifesaving Graeme Dingle Foundation St Johns Ambulance
Australia Youth Foundation
Hawaii The Taco Bell Foundation Local work with literacy programmes such as Book it.
TO THE MANAIAKALANI EDUCATION TRUST
TO THE BIRTHRIGHT NEW ZEALAND TRUST
TO FIRST FOUNDATION
$35,000 $20,000
STRATEGIC THEME 1
An inclusive and productive team focused on wellbeing
KEY POLICIES
A diverse and inclusive work force We want our business to embrace diversity – so it includes people from different social and ethnic backgrounds, genders and age. (We report on gender across the business on page 92 of the corporate governance section).
Our target for the executive team and board is a 40:40:20 split. With the recent appointment of Raziel Valiente, our California CEO, three of our nine Group senior executive team is female (33%).
Our Board currently has one female member. This will become two from 1 April 2021 with the appointment of a new independent Director; Maria Elena (Malena) Pato-Castel. Our Board will then be 29% female.
Competitive remunerationOur goal is to keep salary and wage levels on or above market. Right across the business, we benchmark market rates, and use external assessors to make sure we continue to offer competitive remuneration.
Zero tolerance for forced or underage labourOur zero tolerance policy is not only in effect across our organisation, it includes our wider supply chain too. There were no breaches of this policy in the last year that we are aware of. We will remain vigilant to ensure this continues.
Caring about people and
communities
KEY PROGRAMMES
Job startFor many people, a job within Restaurant Brands is their first – and we are proud of that. Perhaps more importantly, we also offer them the ability to develop a career. There are no current targets set in this area as we work towards setting up reporting systems that allow us to better capture the underlying information. Our aim is to always be an employer that gives people a start and an opportunity to grow within the business.
Career progression We support employees to develop skills that allow them to move up a ‘job step’, or move into a managerial role within a store. In the last year, 372 people in New Zealand and 237 people in Australia were able to make a ‘job step’ move. We’re still refining how we can measure ‘job step’ success more accurately – watch this space.
Staff satisfaction and wellbeingWe’ve implemented a net promoter score (NPS) rating within surveys. Our aim is to have > 75% satisfaction rating by 2022.
The company also provides staff welfare grants to help staff through periods of particular hardship.
We aim to keep staff turnover as low as possible, and focus on improving continuously in this area, so our turnover is lower than industry standards.
Staff turnover as a % of average total staff on a rolling annual basis:
2020 2019
New Zealand 55.8% 70.0%Australia 50.5% 42.6%Hawaii 52.7% 60.2%California 61.0% n/a
The impact of COVID-19 made 2020 a difficult year to measure staff turnover, however lower turnover in Hawaii and New Zealand was pleasing.
Australia’s much younger workforce was more heavily impacted by COVID-19, resulting in a higher turnover last year. We want Restaurant Brands to be an employer of choice, and we’ll work hard to reduce our turnover further below industry standards.
Another key indicator of staff wellbeing is the level of time lost to injuries. This is measured in time lost to injuries per million hours worked.
Ideally, we’d have no lost time injuries as the safety of our employees is paramount; so our target is always to reduce our lost time injuries year on year. Here’s the 2019/2020 comparison:
Lost time injuries per million hours worked
It’s disappointing to see an increase in lost time injuries in Australia, and we’ll be looking closely at that, however Hawaii and New Zealand showed significant improvements. We are also pleased to see a low level of hours lost to injury in California over the initial four month period of our ownership.
Restaurant day programmes for ‘above store’ staffThere’s nothing like real time experience to give our support staff a better appreciation of the hard work our front line staff put in, so new support staff spend time in our stores as part of their induction. Whilst this is common practice, we’re currently developing a more formal policy, so ‘time on the front line’ is a mandatory aspect of our on-boarding process.
Beneficiaries this year include:
In 2019, Restaurant Brands established a ‘giving platform’ through The Gift trust, a registered charity in New Zealand. We’ve donated $200,000 to this in the past two years.
donated in the past two years

27Annual Report 31 December 202026Restaurant Brands New Zealand Limited
STRATEGIC THEME 1
Beyond compliance
KEY POLICIES AND PROGRAMMES
Food safety and product quality We are audited internally by Yum! and we must achieve very high results in the Food Control Plan audits. We wouldn’t want it any other way.
Our aim is to exceed an 85% standard rating on the Yum! Standard - significantly above the food safety standards prescribed by local food safety regulations.
Here’s how we performed for the 2020 year:
Supply chain food safetyIn Australia, Hawaii and California, Yum! manages the supply chain, ensuring that our suppliers maintain high levels of compliance for food safety and quality. In New Zealand, we test our own suppliers to ensure they meet our high standards.
66% of our suppliers achieved the 85% standard. The suppliers that didn’t achieve 85% still complied with the relevant New Zealand food standards and we’ll continue to work with them (and those that did) to ensure they continue to improve towards the 85% standard.
Fats / sodium / sugar reportingThe amount of fats, sodium and sugar in our food is currently available on our brand website, but we are looking at how we can better inform our customers of the amounts of these, so the information is more easily accessible.
Active reduction of fats / sodium / sugarOur New Zealand division works actively to reduce the levels of fat, sodium and sugar in our food. Sauce and mayo saw a 20% reduction in 2020 as a result of this ongoing work. Our other divisions continue to work with Yum! to promote ideas to reduce the levels of these ingredients.
Hormone and steroid free All our chicken is hormone and steroid free. Our suppliers must comply with this policy, to ensure our customers enjoy the highest quality product.
Antibiotic use Antibiotics are only used for illness in the flock and only at levels that are not significant in human medicines.
Food safety trainingAll staff must complete our food safety training programme before they enter a store. This is part of the store staff induction programme as well as a requirement for all other staff before they spend time in a store.
Note: there were no food safety audits carried out in California between 2 September and 31 December 2020.
2020
New Zealand 98%Australia 85%Hawaii 93%
STRATEGIC THEME 2
Ethical sourcing
KEY POLICIES AND PROGRAMMES
Supplier audit programmeAll suppliers are audited each year, there are no exceptions and Restaurant Brands requires 100% compliance with this policy. New Zealand suppliers must certify their products are ethically sourced. The other divisions (Australia, Hawaii and California) are part of the Yum! supply chain and are therefore reliant on Yum! initiatives to make sure that this Yum! policy is maintained.
Animal welfare Our policy is 100% compliance with animal welfare standards, and all meat suppliers must comply with this. For New Zealand suppliers, we ensure compliance with direct enquiry and reviews. The other divisions rely on Yum!’s supply chain controls.
Palm oil free Restaurant Brand’s target is for no products to contain palm oil. Over the past few years, we have switched all our cooking oils to soybean and canola in New Zealand, Hawaii and Australia.
We are currently phasing out the last few products that contain palm oil and we expect to complete this by the end of 2021. We will work with our California division to align with Restaurant Brands’ policy, over the upcoming year.
STRATEGIC THEME 2
Resource stewardship
KEY POLICIES AND PROGRAMMES
Solar energy efficient storesWe are working on a pilot store that utilises solar energy, and we hope to have this running in 2021. Once it’s up and running, we’ll measure the kilowatts (kWh) of energy generated and used and compare this to the amount of energy we would have purchased. If that comparison is favourable, we will instigate an energy-efficient new store roll out across the company.
Energy efficiencyWe are currently calculating what percentage of lights are full LED across the Group. The target is to increase the number of LED light fit outs by 25% each year.
A second important energy efficiency metric for the business is kWh of energy used in electricity and gas per $ millions of sales. The target is to reduce this year on year with investment in items such as upgraded fryers.
kWh of energy used per $million sales:
OUR TARGET:
AchievedReduced plasticsRestaurant Brands has a ‘no plastics’ policy including no plastic straws, lids or use of plastic bags. We eliminated plastic bags from the New Zealand business in June 2019, and we are investigating other alternatives in the other divisions.
Waste reductionOur target is to eventually recycle 100% of our ‘back of house’ cardboard across the business, and we have processes to reduce the volume of compacted waste going to landfill year on year. Currently we are recycling 100% of our back of house cardboard in New Zealand and Australia, and 66% in Hawaii. California is currently developing a process to monitor their back of house recycling programme.
We are developing a data capturing process so we can accurately assess the current levels of waste being sent to landfill. Once completed, we’ll establish a target and timeframe to reduce this waste and to ensure that all waste that does go to landfill, is compacted.
Zero air freight Our target is to reduce air freight by 10% each year.
We only use air freight when there is no other supply alternative. This has been more difficult this year, as the impact of with COVID-19 has reduced some of our supply choices.
We are putting processes in place to accurately measure the portion of air freighted inwards goods and these will provide specific targets for the 2022 year, and a benchmark we will aim to lower year on year.
Low impact home delivery Home delivery is becoming a significantly bigger portion of our revenue stream, so this area has taken on more importance. We will continue to explore ways to reduce the environmental impact of our deliveries. Our target is that by 2022, all new pool cars will be electric. We’re also aiming to trial suitable electric delivery vehicles in that year.
Sustainable fibres (paper and cardboard) Our target is to use 100% recycled paper and cardboard in New Zealand, by 2024.
Sustainable uniforms Our target is to have all uniforms made from sustainable resources by 2022. We are currently working through the Yum! supply chain to ensure that this is the case. To date our investigations have revealed that all our uniforms are from sustainable sources – we’re still checking.
Phase out plastic straws and lids by 2025.
2020 2019
New Zealand (NZD) 102,300 109,000Australia (AUD) 95,390 95.690Hawaii (USD) 176,680 177,433
New Zealand, Australia and Hawaii all improved their energy efficiency from 2019, with the largest drop in usage in New Zealand which was particularly pleasing. We will work with California to establish appropriate measures over the coming year.
Environmental consciousness
Leading in food quality
STRATEGIC THEME 1
Waste management
KEY POLICIES AND PROGRAMMES
Cooking oil recyclingWe aim to recycle 100% of expired oil. We have now achieved this target and will ensure this is maintained.

KIWITotal store sales were up $42.9 million to $410.4 million due to the additional eight weeks in the current year’s results, with the prior December 2019 results only being for 44 weeks due to a change in balance date. If normalised for the extended reporting period in FY20, store sales were down approximately 5.5%, reflecting the five week Government mandated full lockdown of stores in March/April due to the COVID-19 pandemic. Estimated lost sales during the five week lockdown were in excess of $40 million.
It was a great achievement for our operations teams to navigate through the COVID-19 Level 4 lockdown and reopen safely and smoothly and then implement three different operational procedures based on alert levels ongoing. The lockdown gave our teams an opportunity to retrain staff with new standards raising the bar in terms of safety and cleanliness and we are seeing the benefit of these through reduction in staff turnover number, much higher training and operational compliance scores through our external restaurant audits.
Throughout the pandemic we have kept our brands front and centre in the community. KFC has continued its association with the nations favourite winter sport with its Super Rugby sponsorship but has also added New Zealand’s favourite summer sport in cricket and the Black Caps. All four brands operating in New Zealand had positive same store sales for the year with New Zealand operations showing overall same store sales growth of 5.3%. This was driven through strong promotions and also the introduction of new ways of making it easier for customers to place orders, including the launch of the new Pizza Hut and KFC websites as well as expanded delivery services.
KFC remains the key contributor to the New Zealand operations. The brand once again delivered a strong result with both sales and profit performance well up on last year’s reported results. This was enhanced by expanding the KFC delivery offer in more towns across the country as well as the launching of a partnership across all brands with Uber Eats. However when compared to an annualised 2019 comparison, sales and EBITDA were down due to the COVID-19 lockdown.
Carl’s Jr. same store sales were also significantly up on last year due to some successful product promotions including the Sticky Pork Belly Big Angus Burger and the Tex Mex Big Angus. There was also continued positive impact from the use of delivery providers such as Uber Eats.
With four Taco Bell stores now opened in New Zealand this brand continues to gain momentum delivering sales above expectations, although margins were still negative because of establishment costs.
Pizza Hut sales from company stores were down on the prior year, reflecting a reduction in company-owned store numbers through the year with 16 stores sold to independent franchisee operations.
EBITDA before G&A costs was $75.9 million, up $8.0 million due to the comparative reported period only covering 44 weeks. However on an annualised basis EBITDA was down by $4.4 million or 5.5%. The drop in EBITDA before G&A on an annualised basis arose from the five week lockdown in New Zealand during March and April.
1374,582
STORESSTAFF
TOTAL SALES ($NZ m)
1917 1918 20
410.4367.5
421.4 419.8400.0
Feb Dec
EBITDA ($NZ m)
1917 1918 20
75.967.9
76.5 76.471.2
Feb Dec
29Annual Report 31 December 202028Restaurant Brands New Zealand Limited
Operations Report
REINVESTMENT FOR FUTURE GROWTH
NEW ZEALAND

The EBITDA margin for New Zealand was 18.5%, which is consistent with last year. This was particularly pleasing given the cost of the various lockdowns, both closing down on short notice and re-opening at different alert levels whilst ensuring we were keeping our people and customers safe. Furthermore the cost of the company’s decision to retain all staff at 100% of their wages throughout the March/April lockdown incurred a net cost of over $500,000 per week above the Government wage subsidy received.
The efforts in the last 12 months haven’t gone unnoticed from our franchisors who this year recognised some of the Pizza Hut team at the APAC YUM! conference and the Carls Jr. Takanini store was awarded the Asia Pacific restaurant of the year.
We also commenced a partnership with St John Ambulance through the Pizza Hut brand, this has helped feed the front line emergency responders throughout 2020 and into 2021.
As part of the continuing reinvestment in the four brands, 11 stores received major upgrades over the year.
Total company owned stores decreased by 11 to 137 stores due to 16 Pizza Hut stores being sold to franchisees during the period. Partially off-setting the sale of company owned Pizza Hut stores was the opening of three new Taco Bell stores in Shortland Street, Auckland, Lunn Ave, Auckland, and Taupiri as well as one new KFC store opened in central Christchurch.
There was also one KFC store in Kapiti acquired from an independent franchisee. The three new Taco Bell stores have added over 90 jobs in those communities.
The New Zealand business has also seen significant store reinvestment with nine stores significantly remodeled over the year and another 14 major store refurbishments planned during FY21. The full year impact of the major refurbishments and the five new stores completed during FY20, together with continued high levels of marketing expenditure will drive sales growth, however increasing costs particularly rising labour costs will continue to put pressure on EBITDA margins.
There remains uncertainty around COVID-19 with continued rolling lockdowns occurring during the first quarter of the new financial year. However absent any COVID-19 impact, sales and margin performance is continuing on or above last year’s levels for year to date and the New Zealand operations are expected to deliver another solid result.
31Annual Report 31 December 202030Restaurant Brands New Zealand Limited
The New Zealand business has also seen significant store reinvestment with nine stores significantly remodeled over the year .

AUSSIEOperations Report70
TOTAL SALES ($NZ m)
1917 1918 20
214.9
169.1151.8
191.5
97.2
Feb
Feb
Dec
Dec
4,055
1917 1918 20
29.4
25.2
22.0
29.1
15.0
EBITDA ($NZ m)
Sales are up by $45.8 million due to last year’s reporting period only being for 44 weeks, sales were also up $15.1 million or 7.5% on an annualised basis. This was driven by the addition of six new stores during the year as well as organic growth from the existing stores and continued roll out of the home delivery network. The impact of the Taco Bell store roll out was also positive, contributing over $6.0 million in additional sales. The sales performance from existing stores resulted in the same store sales growth for the division of 2.0% for the period.
Despite the strong overall sales results the year has been particularly challenging with temporary closure of 15 mall and in-line stores for the majority of April due to a COVID-19 lockdown.
The effects of the pandemic were felt predominantly in the Sydney CBD locations as work from home restrictions came into place along with temporary closure of malls during the initial breakout in April. There were significant changes in consumer behaviour putting greater volume through drive-thru and delivery channels, emphasising the importance of our continued strategy on building an omnichannel platform for both brands. The KFC brand had made significant headway on the home delivery format pre-COVID-19 which allowed the business to double the volume overnight. Further work continues in this space where the brand is developing strong equity in its owned delivery channel format through the KFC App. The Taco Bell brand has got off to an encouraging start with traditional channels as well as the development of order kiosks and aggregator delivery in partnership with DoorDash, Menulog and Deliveroo.
Profitability also remained strong, with EBITDA before G&A costs of $29.4 million up $4.2 million due to the comparative reported period only covering 44 weeks, however on an annualised basis EBITDA was down by $0.4 million or 1.3%. The drop in EBITDA before G&A on an annualised basis reflects the increased costs associated with COVID-19 restrictions with mall stores closed for an extended period, significant downturn in the inner city trading as well as the long term closure of the dine-in option.
As a percentage of sales, store EBITDA was 13.7%, which is down from 15.4% last year. As noted above, this was a direct effect of the various lockdown challenges combined with rising costs through the company’s supply chain. We have secured an industry wage award for Taco Bell and KFC which will help provide certainty on wage costs going forward.
The year was closed out on a high note with the franchisor recognising our very own employee, Stacey McCarthy, as the KFC Restaurant Manager of the Year amongst nearly 700 of her peers. We were also delighted to be recognised with the area coach of the year, and the NSW franchisee with greater than four restaurants of the year.
As part of the continuing reinvestment in the brands, six stores received major upgrades over the year. There has also been significant investment in digital drive-thru menu boards and in-store kiosks.
Despite the challenging trading conditions the division continued to investment in building the portfolio of restaurants with the two new Taco Bell drive-thru formats and four KFCs of which two were drive-thrus. The development of two new concepts were completed in the year with a digital experience facility and an internal drive-thru facility both of which have opened new growth opportunities for future site selection. The pipeline for new restaurants at the end of the year was strong and an important part of the strategy to build a successful Taco Bell brand in NSW/ACT where speed to market is critical.
The investment in new stores and major refurbishments is expected to continue in the FY21 particularly with the Taco Bell brand which expects to open 10 new stores along with two new KFC stores. Major refurbishments are also set to continue for the KFC branded stores. The acquisition of five restaurants has also been completed in February 2021.
Although the ongoing impact of COVID-19 is hard to determine, the positive results from the Australian operations are expected to continue into the new financial year. We will continue to gain the benefits of the new store builds and refurbishments which will help maintain the Groups’ positive performance, although this will be somewhat offset by continued cost pressures.
STORESSTAFF
33Annual Report 31 December 2020
NEW STORES AND REFITS DELIVER
32Restaurant Brands New Zealand Limited
AUSTRALIA
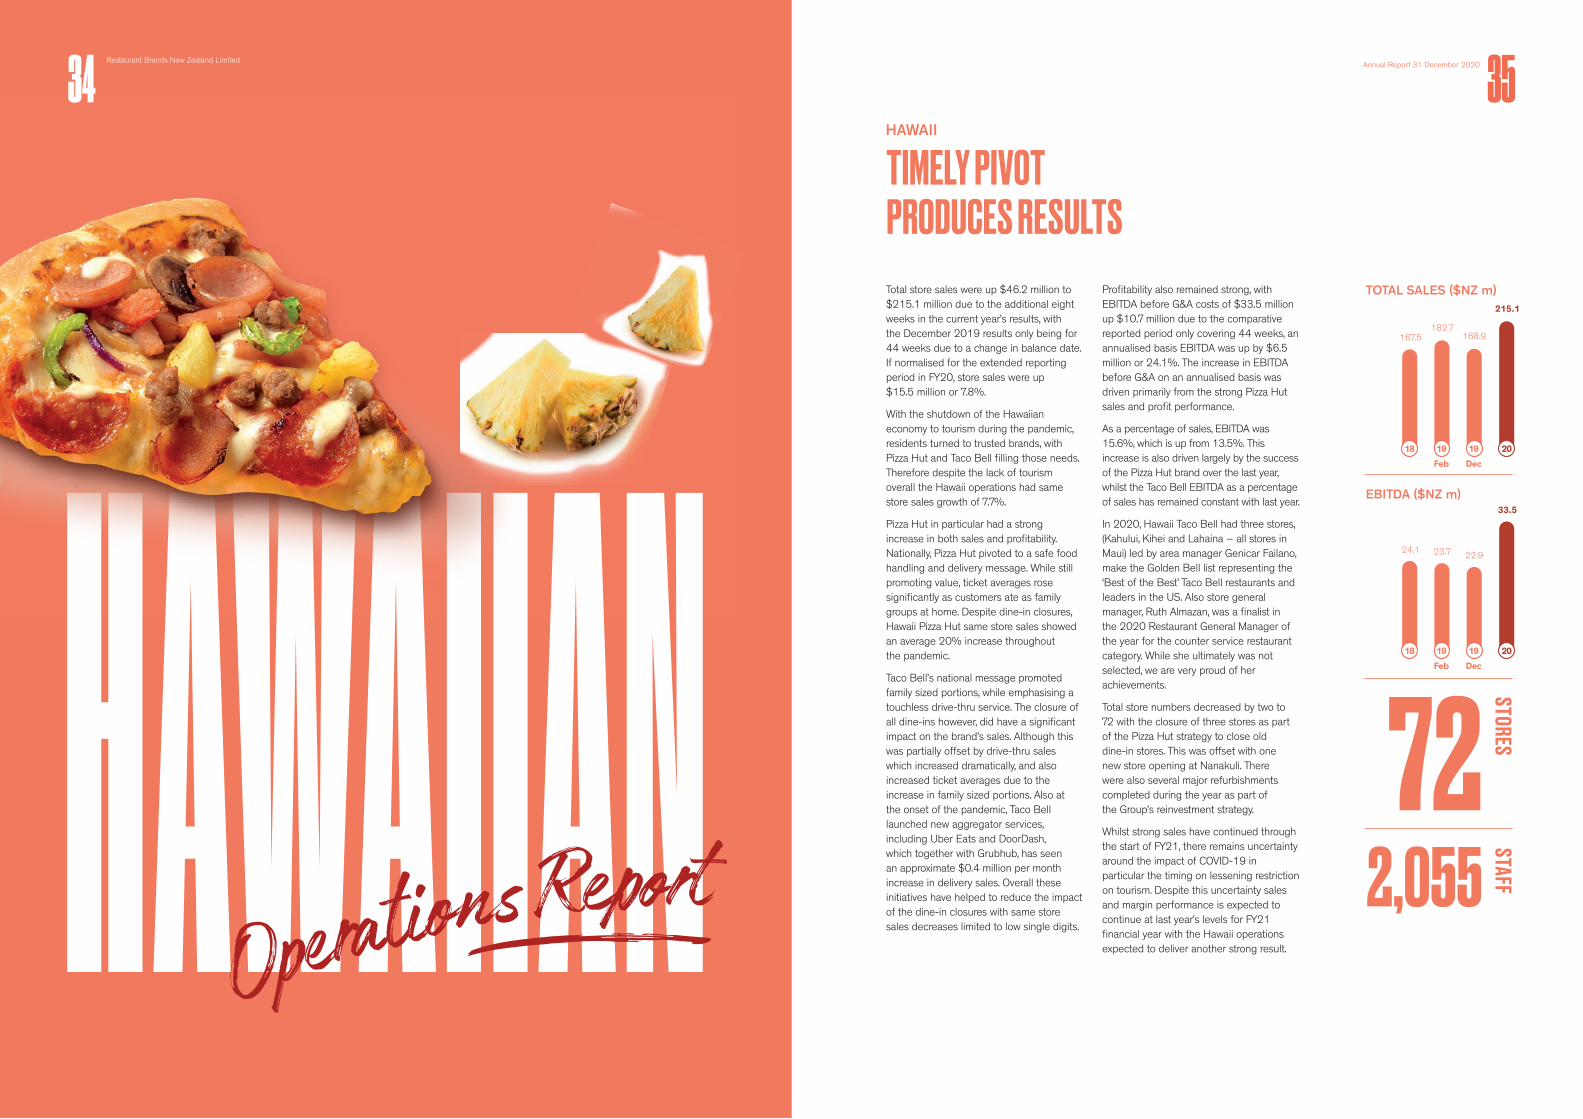
Total store sales were up $46.2 million to $215.1 million due to the additional eight weeks in the current year’s results, with the December 2019 results only being for 44 weeks due to a change in balance date. If normalised for the extended reporting period in FY20, store sales were up $15.5 million or 7.8%.
With the shutdown of the Hawaiian economy to tourism during the pandemic, residents turned to trusted brands, with Pizza Hut and Taco Bell filling those needs. Therefore despite the lack of tourism overall the Hawaii operations had same store sales growth of 7.7%.
Pizza Hut in particular had a strong increase in both sales and profitability. Nationally, Pizza Hut pivoted to a safe food handling and delivery message. While still promoting value, ticket averages rose significantly as customers ate as family groups at home. Despite dine-in closures, Hawaii Pizza Hut same store sales showed an average 20% increase throughout the pandemic.
Taco Bell’s national message promoted family sized portions, while emphasising a touchless drive-thru service. The closure of all dine-ins however, did have a significant impact on the brand’s sales. Although this was partially offset by drive-thru sales which increased dramatically, and also increased ticket averages due to the increase in family sized portions. Also at the onset of the pandemic, Taco Bell launched new aggregator services, including Uber Eats and DoorDash, which together with Grubhub, has seen an approximate $0.4 million per month increase in delivery sales. Overall these initiatives have helped to reduce the impact of the dine-in closures with same store sales decreases limited to low single digits.
Profitability also remained strong, with EBITDA before G&A costs of $33.5 million up $10.7 million due to the comparative reported period only covering 44 weeks, an annualised basis EBITDA was up by $6.5 million or 24.1%. The increase in EBITDA before G&A on an annualised basis was driven primarily from the strong Pizza Hut sales and profit performance.
As a percentage of sales, EBITDA was 15.6%, which is up from 13.5%. This increase is also driven largely by the success of the Pizza Hut brand over the last year, whilst the Taco Bell EBITDA as a percentage of sales has remained constant with last year.
In 2020, Hawaii Taco Bell had three stores, (Kahului, Kihei and Lahaina – all stores in Maui) led by area manager Genicar Failano, make the Golden Bell list representing the ‘Best of the Best’ Taco Bell restaurants and leaders in the US. Also store general manager, Ruth Almazan, was a finalist in the 2020 Restaurant General Manager of the year for the counter service restaurant category. While she ultimately was not selected, we are very proud of her achievements.
Total store numbers decreased by two to 72 with the closure of three stores as part of the Pizza Hut strategy to close old dine-in stores. This was offset with one new store opening at Nanakuli. There were also several major refurbishments completed during the year as part of the Group’s reinvestment strategy.
Whilst strong sales have continued through the start of FY21, there remains uncertainty around the impact of COVID-19 in particular the timing on lessening restriction on tourism. Despite this uncertainty sales and margin performance is expected to continue at last year’s levels for FY21 financial year with the Hawaii operations expected to deliver another strong result.
72
TOTAL SALES ($NZ m)
19 20
215.1
168.9
Dec
EBITDA ($NZ m)
HAWAIIAN 2,055
18 19
182.7167.5
Feb
19 20
33.5
22.9
Dec18 19
23.724.1
Feb
STORESSTAFF
34Restaurant Brands New Zealand Limited
35Annual Report 31 December 2020
Operations Report
TIMELY PIVOT PRODUCES RESULTS
HAWAII

The California business was acquired on 2 September 2020 the purchase of 59 KFC stores and 11 joint KFC / Taco Bell stores. This was an important beach head into the mainland US market.
Total sales for the four months of trading were $51.9 million, significantly up on expectations. This is despite the challenges of COVID-19 which has restricted dine-in for most of the period. The KFC family-oriented menu, including the everyday value of our $20 Fill Up and $30 Fill Up offers, continued to resonate strongly with customers. This together with a strong focus around product and service meant we were able to generate sales significantly above expectations.
Profitability was also above expectation, with EBITDA before G&A costs of $8.5 million. This was driven by the strong sales which also helped deliver an EBITDA before G&A as a percentage of sales of 16.4%.
Three of our Restaurant General Managers (RGM’s) were awarded KFC USA’s Best of the Best Awards at the American KFC Franchise (AKFCF) Convention held in March 2021. The Annual Best of the Best Awards go to the very best 40 RGMs across the entire US and represent the top 1% of stores in the KFC US franchise network.
The AKFCF Convention also saw the KFC Shining Star award for diligence and commitment to the KFC franchisee values awarded to Raziel Valiente, Restaurant Brands California’s Divisional CEO.
As with the other divisions the California operations will look for opportunities to widen the store network with three new store builds planned for the FY21 year.
Whilst the uncertainty also continues in the California market with restrictions still in effect on store dining, the Company will get the benefit of a full 12 months trading in the FY21 year and is expecting the California operations to contribute significantly to sales and profitability in FY21.
69
51.98.5
TOTAL SALES ($NZ m)
EBITDA ($NZ m)
1,381
STORESSTAFF
PERFORMANCE BEYOND EXPECTATIONS
36Restaurant Brands New Zealand Limited
37Annual Report 31 December 2020
CALIFORNIANOperations Report
CALIFORNIA

Board of Directors
José ParésChairman and Non-Executive Director
Term of office Appointed Director 1 April 2019 and appointed Chairman 10 July 2019. Last re-elected 2019 Annual Meeting
Board committees Member of the Audit and Risk Committee
José is the Chief Executive Officer of Finaccess Capital. He is also the Chairman of the Board and an Executive Chairman of AmRest Holdings SE. During his professional career he has been director of the Board of Crown Imports, Chicago, Il, the Vice Chairman of the Board of MMI, Toronto, Canada, director of the Board of DIFA, Mexico and former member of the Beer Chamber of Mexico.
Previously, José worked for 19 years at Grupo Modelo (Mexico), in various positions, including as the Vice President of Marketing and Sales International where he oversaw growth of Grupo Modelo’s annual revenues from USD 1 billion to USD 3 billion.
José graduated from Universidad Panamericana, Mexico (Business and Finance) and completed his MBA at ITAM, Mexico as well as the Business D-1 Program at IPADE, Mexico and Executive Programme at Wharton, San Francisco.
Emilio FullaondoIndependent Non-Executive Director
Term of office Appointed Director 1 April 2019. Last re-elected 2019 Annual Meeting
Board committees Chairman of the Audit and Risk Committee, Member of the Remunerations and Nominations Committee and the Health and Safety Committee
Emilio is a senior executive with over 23 years of experience in the beer industry. Emilio worked in a number of finance roles for Grupo Modelo, including four years as Chief Financial Officer. Following the acquisition of Grupo Modelo by AB InBev in 2013, Emilio oversaw significant cultural and organisational changes at AB InBev (Mexico) as Vice President, Human Resources (to 2017) and Vice President, Projects until his resignation in January 2019.
Emilio is currently a director and Chairman of the Audit and Control Committee of AmRest Holdings SE.
Emilio graduated from ITAM, Mexico (Public Accountant) and completed his MBA at the same institution as well as the Executive Management (AD) Program at IPADE, Mexico.
Carlos FernándezNon-Executive Director
Term of office Elected Director 10 July 2019
Over the last 30 years, Carlos Fernandez has held positions in various business sectors. He was the CEO (1997-2013) and Chairman of the Board of Directors (2005-2013) of Grupo Modelo. From the time he was named CEO, up to 2013, this group consolidated its position as the leading brewing company in Mexico, the seventh biggest worldwide and the world’s biggest beer exporter.
He has also served on the boards of national and international companies, including Anheuser-Busch (US), Emerson Electric Co. (US), Seeger Industrial (Spain), Grupo Televisa (Mexico), Crown Imports Ltd. (US), Inbursa (Mexico) and Mexican Stock Exchange (Bolsa Mexicana de Valores). He has served on the advisory board of Grupo Modelo and has also been a member of the international advisory board at Banco Santander, S.A. and a director of Grupo Financiero Santander Mexico S.A.B de C.V.
Carlos is currently Chairman of the Board of directors of Grupo Finaccess S.A.P.I. de C.V. – a company of which he was founder. As well as New Zealand, the company is also active in Mexico, Europe, Asia and the US. He is also a Proprietary director of AmRest Holdings SE, S.A. and a non-executive director of Inmobiliaria Colonial, S.A.
Carlos is an industrial engineer and has also studied on senior management programmes at the IPADE Business School (Instituto Panamericano de Alta Direccion de Empresa).
Luis Miguel ÁlvarezNon-Executive Director
Term of office Elected Director 10 July 2019
Board committees Member of the Remunerations and Nominations Committee
Luis Miguel is a Board Member, Audit Committee Member and Investment Committee Member of Finaccess, S.A.P.I. de C.V. (since 2013). He is also the Founder & CEO of Compitalia, S.A. de C.V., a family investment company business which primarily invests directly in target companies through equity holdings and real estate investments, primarily in sectors such as: energy, restaurants, real estate projects and financial funds.
For over 25 years Luis Miguel occupied different positions within several Grupo Modelo entities (including the Vertical Companies director of Grupo Modelo, S.A.B. de C.V., President & General Manager of Gmodelo Agriculture, LLC., Idaho Falls, Idaho, Vice President & General Manager of Gmodelo Agriculture, Inc.). During his time at Grupo Modelo, Luis Miguel held various board positions within the group, including: Alternate Board Member and Executive Committee Member of Grupo Modelo, S.A.B. de C.V., Board Member and Executive Committee Member of InteGrow Malt, LLC., as well as Board Member of Impulsora Agricola, S.A. and International CO2 Extraction LLC.
Luis Miguel is currently a Proprietary director of AmRest Holdings SA and a Board member of other private and not for profit organisations.
Stephen WardIndependent Non-Executive Director
Term of office Elected Director 10 July 2019
Board committees Chairman of the Remunerations and Nominations Committee, Member of the Audit and Risk Committee and the Health and Safety Committee
Stephen Ward is a professional director with diverse corporate governance experience in New Zealand and Australia together with extensive expertise as a corporate and commercial lawyer in New Zealand.
Stephen is a non-executive director of Sydney Airport Limited and the Chair of its Safety, Security and Sustainability Committee. Stephen is the non-executive Chair of SecureFuture Wiri Limited. He is the Deputy Chair of the National Provident Fund Trust Board and Chair of its Audit and Risk Committee.
Stephen is also a non-executive director of TCF Commercial Finance New Zealand Limited and Renaissance Holdings (NZ) Limited. Stephen is the Independent Chair of the Advisory Council for the Financial Dispute Resolution Service. He holds voluntary positions on the Boards of Wellington Free Ambulance, and The Life Flight Trust.
Stephen holds an LLB from the University of Canterbury, is a member of the New Zealand Law Society and is a Chartered Member of the New Zealand Institute of directors.
Malena Pato-Castel Independent Non-Executive Director
Term of office Appointed Director 1 April 2021
Malena has over 33 year of experience in the Fast Moving Consumer Goods and Retail Hospitality industries in the US and Europe, including senior regional roles at Unilever and Yum! Brands. Prior to her retirement from the company in 2020, Malena spent nine years in various roles at AmRest Holdings SE (six of which as a member of the AmRest Exec Committee). Her appointments included President for AmRest Spain and, most recently Chief Proprietary Brands Officer with responsibilities extending across markets in Spain, China, France, Portugal and Germany.
Malena served on the board of various Yum! Brands subsidiaries that operated Pizza Hut and KFC stores in Spain and has extensive experience as an owner/operator of KFC branded restaurants in Europe as a co-founder and managing director of a restaurant operating company that grew from 14 to more than 130 restaurants prior to being acquired by AmRest.
Melena is fluent in English, French and Spanish and holds a Business Administration and Management (ADE) degree from the ICADE School of Business and Economics.
Huei Min (Lyn) Lim MNZMIndependent Non-Executive Director
Term of office Elected Director 10 July 2019
Board committees Chairman of the Health and Safety Committee, Member of the Audit and Risk Committee and the Remunerations and Nominations Committee
Lyn Lim has diverse board and committee Chair experience and is culturally competent. She is experienced in investment structures, risk management, HR, HSW, AML, dispute management and compliance.
She is on the Boards of General Capital Limited and Auckland Regional Amenities Funding Board. She is also a trustee of the Asia New Zealand Foundation and Middlemore Foundation.
Lyn has served on the Boards of the AUT, New Zealand Shareholders’ Association, Public Trust (and chaired the Human Resources and Remuneration Committee), the New Zealand China Trade Association, the Hong Kong and New Zealand Business Association, was the Chair of the New Zealand Chinese Youth Trust and held the positions of Trustee, Deputy Chair and Chair of Foundation North (the biggest and leading philanthropic entity in New Zealand). She has been a member of ANZ Private Bank External Advisory Board and has served as a council member of the Auckland District Law Society Inc.
Lyn holds an LLB (Hons) from the University of Canterbury and has 30 years of legal practice specialising in commercial, corporate and governance issues and dispute resolution.
In 2017, Lyn was appointed as a Member of the New Zealand Order of Merit for her services to New Zealand-Asia relations and governance. Lyn is a Chartered Member of the New Zealand Institute of Directors, a member of the New Zealand Law Society and a member and Vice Chair of the Women in Business Committee of the Inter-Pacific Bar Association.
39Annual Report 31 December 202038Restaurant Brands New Zealand Limited
José Emilio Carlos Luis Lyn Stephen Malena

41Annual Report 31 December 202040Restaurant Brands New Zealand Limited
Consolidated income statement for the year ended 31 December 2020
$NZ000’s
31 Dec 202052 weeks
vs Prior %
31 Dec 2019 44 weeks
SalesTotal New Zealand sales 410,399 11.7 367,521 Total Australia sales 214,923 27.1 169,105 Total Hawaii sales 215,113 27.4 168,915 Total California sales 51,924 n/a – Total sales 892,359 26.5 705,541
Other revenue 32,369 15.1 28,125 Total operating revenue 924,728 26.0 733,666
Cost of goods sold (761,695) (29.6) (587,874)Gross margin 163,033 11.8 145,792
Distribution expenses (7,138) (79.5) (3,976)Marketing expenses (48,344) (22.3) (39,524)General and administration expenses (45,595) (36.9) (33,306)Government grants 22,013 n/a – Other items (8,777) (90.2) (4,616)Operating profit 75,192 16.8 64,370
Financing expenses (30,220) (40.8) (21,464)Net profit before taxation 44,972 4.8 42,906
Taxation expense (14,034) (9.5) (12,815)
Net profit after taxation (NPAT) 30,938 2.8 30,091 % sales % sales
EBITDA before G&ATotal New Zealand 75,856 18.5 11.7 67,907 18.5Total Australia 29,408 13.7 16.7 25,202 15.4Total Hawaii 33,547 15.6 46.7 22,865 13.5Total California 8,516 16.4 n/a – n/a
Total EBITDA before G&A 147,327 16.5 27.0 115,974 16.4
RatiosNet tangible assets per security (net tangible assets divided by number of shares) in cents (26.2) 9.9
Cost of goods sold are direct costs of operating stores: food, paper, freight, labour and store overheads. Distribution expenses are costs of distributing product from store. Marketing expenses are order centre, advertising and local store marketing expenses. General and administration expenses (G&A) are non-store related overheads.
Consolidated income statementfor the year ended 31 December 2020annualised unaudited results for 52 weeks - based on audited 44 week period results
$NZ000’s
Reported 31 Dec 2020
Audited 52 weeks
Annualised 31 Dec 2019
Unaudited 52 weeks
Annualised % change
Reported 31 Dec 2019
Audited 44 weeks
SalesTotal New Zealand sales 410,399 434,343 (5.5) 367,521 Total Australia sales 214,923 199,852 7.5 169,105 Total Hawaii sales 215,113 199,626 7.8 168,915 Total California sales 51,924 – n/a – Total sales 892,359 833,821 7.0 705,541
Other revenue 32,369 33,239 (2.6) 28,125 Total operating revenue 924,728 867,060 6.7 733,666
Cost of goods sold (761,695) (694,760) (9.6) (587,874)Gross margin 163,033 172,300 (5.4) 145,792
Distribution expenses (7,138) (4,699) (51.9) (3,976)Marketing expenses (48,344) (46,710) (3.5) (39,524)General and administration expenses (45,595) (39,365) (15.8) (33,309)Government grants 22,013 – n/a – Other items (8,777) (5,455) (60.9) (4,616)Operating profit 75,192 76,072 (1.2) 64,370
Financing expenses (30,220) (25,367) (19.1) (21,464)Net profit before taxation 44,972 50,706 (11.3) 42,906
Taxation expense (14,034) (15,145) 7.3 (12,815)
Net profit after taxation (NPAT) 30,938 35,562 (13.0) 30,091
EBITDA before G&ATotal New Zealand 75,856 80,253 (5.5) 67,907 Total Australia 29,408 29,784 (1.3) 25,202 Total Hawaii 33,547 27,023 24.1 22,865 Total California 8,516 – n/a –
Total EBITDA before G&A 147,327 137,060 7.5 115,974
1 The annualised December 2019 figures are an arithmetic calculation grossing up the 44 week audited results to reflect an equivalent 52 week period. This has been done for illustrative purposes only.
1

43Non-GAAP financial measuresfor the year ended 31 December 2020
The Group results are prepared in accordance with New Zealand Generally Accepted Accounting Practice (“NZ GAAP”) and comply with New Zealand International Financial Reporting Standards (“NZ IFRS”). These financial statements include non-NZ GAAP financial measures that are not prepared in accordance with NZ IFRS. The non-NZ GAAP financial measures used in this document are as follows:
1. EBITDA before G&A, NZ IFRS 16 and other items. The Group calculates Earnings Before Interest, Tax, Depreciation and Amortisation (“EBITDA”) before G&A (general and administration expenses) and other items by taking net profit before taxation and adding back (or deducting) financing expenses, other items, depreciation, amortisation and G&A.
2. Total NPAT excluding the impact of NZ IFRS 16. Total Net Profit After Taxation (“NPAT”) excluding the impact of NZ IFRS 16 is calculated by taking profit after taxation attributable to shareholders and adding back (or deducting) lease items whilst also allowing for any tax impact of those items. This measure reflects the performance of the business, excluding costs associated with the adoption of NZ IFRS 16 and is considered a useful measure to assist with understanding the financial performance of the Group.
3. Capital expenditure including intangibles. Capital expenditure including intangibles represents additions to property, plant and equipment and intangible assets. This measure represents the amount of reinvestment in the business and is therefore a useful measure to assist with understanding the financial position of the Group.
The Group believes that these non-NZ GAAP measures provide useful information to readers to assist in the understanding of the financial performance and position of the Group but that they should not be viewed in isolation, nor considered as a substitute for measures reported in accordance with NZ IFRS. Non-NZ GAAP measures as reported by the Group may not be comparable to similarly titled amounts reported by other companies.
The following is a reconciliation between these non-NZ GAAP measures and net profit after taxation:
$NZ000’s Note* 31 Dec 2020 31 Dec 2019
EBITDA before G&A, NZ IFRS 16 and other items 1 147,327 115,974 Depreciation (33,812) (25,250)
Net loss on sale of property, plant and equipment (included in depreciation) (276) (106)
Lease deprecation (30,908) (22,395)
Lease costs 44,919 32,369
Amortisation (included in cost of sales) (2,740) (2,178)
General and administration costs - area managers, general managers and support centre (40,541) (29,428)
Other income 615 722
Other expenses (9,392) (5,338)
EBIT 75,192 64,370 Financing expenses (30,220) (21,464)
Net profit before taxation 44,972 42,906 Taxation expense (14,034) (12,815)
Net profit after taxation 30,938 30,091 Add back IFRS 16 impact 9,741 6,076
Taxation expense on IFRS 16 impact (2,737) (1,547)
Total NPAT excluding the impact of NZ IFRS 16 2 37,942 34,620
* Refers to the list of non-GAAP measures as listed above.
Financial statements December 2020Contents Page
Directors’ statement 44
Consolidated statement of comprehensive income 45
Consolidated statement of changes in equity 46
Consolidated statement of financial position 47
Consolidated statement of cash flows 48
Notes to and forming part of the financial statements 51
Restaurant Brands New Zealand Limited is pleased to present its financial statements.
The results for the year ended 31 December 2020 as compared to the 44 week period ended 31 December 2019.
Note disclosures are grouped into five sections which the Directors consider most relevant when evaluating the financial performance of the Group.
Section Note Reference
Performance 1-3
Funding and equity 4-7
Working capital 8-12
Long term assets 13-15
Other notes 16-28
Significant accounting policies which are relevant to an understanding of the financial statements and which summarise the measurement basis used are provided throughout the notes and are denoted by the highlighted text surrounding them.
Annual Report 31 December 202042Restaurant Brands New Zealand Limited

Annual Report 31 December 202044Restaurant Brands New Zealand Limited
45Directors’ statementfor the year ended 31 December 2020
The Directors of Restaurant Brands New Zealand Limited (Restaurant Brands) are pleased to present the financial statements for Restaurant Brands and its subsidiaries (together the Group) for the year ended 31 December 2020 contained on pages 45 to 79.
Financial statements for each financial period fairly present the financial position of the Group and its financial performance and cash flows for that period and have been prepared using appropriate accounting policies, consistently applied and supported by reasonable judgments and estimates and all relevant financial reporting and accounting standards have been followed.
Proper accounting records have been kept that enable, with reasonable accuracy, the determination of the financial position of the Group and facilitate compliance of the financial statements with the Financial Markets Conduct Act 2013.
Adequate steps have been taken to safeguard the assets of the Group to prevent and detect fraud and other irregularities.
The Directors hereby approve and authorise for issue the financial statements for the year ended 31 December 2020.
For and on behalf of the Board:
José Parés Emilio FullaondoChairman Director
Date: 25 February 2021 Date: 25 February 2021
Consolidated statement of comprehensive incomefor the year ended 31 December 2020
$NZ000’s Note 31 Dec 2020 31 Dec 2019
Store sales revenue 1,2 892,359 705,541 Other revenue 1,2 32,369 28,125 Total operating revenue 924,728 733,666 Cost of goods sold (761,695) (587,874)Gross profit 163,033 145,792 Distribution expenses (7,138) (3,976)Marketing expenses (48,344) (39,524)General and administration expenses (45,595) (33,306)Government grants 2 22,013 – Other income 2 615 722 Other expenses 2 (9,392) (5,338)Operating profit 1 75,192 64,370 Financing expenses 4 (30,220) (21,464)Profit before taxation 44,972 42,906 Taxation expense 16 (14,034) (12,815)Profit after taxation attributable to shareholders 30,938 30,091 Other comprehensive income:Exchange differences on translating foreign operations (7,874) 1,707 Derivative hedging reserve (596) (1,473)Income tax relating to components of other comprehensive income 10 217 Other comprehensive income for the period, net of tax (8,460) 451 Total comprehensive income for the period attributable to shareholders 22,478 30,542
Basic earnings per share from total operations (cents) 3 24.80 24.12 Diluted earnings per share from total operations (cents) 3 24.80 24.12
The accompanying accounting policies and notes form an integral part of the financial statements.

47Annual Report 31 December 202046Restaurant Brands New Zealand Limited
Consolidated statement of changes in equityfor the year ended 31 December 2020
$NZ000’s Note Share
capital
Foreign currency translation
reserveDerivative
hedging reserveRetained earnings Total
For the 44 week period ended 31 December 2019Balance at the beginning of the period 154,565 (1,871) (480) 72,456 224,670 Adoption of NZ IFRS 16 – – – (47,218) (47,218)Restated balance at the beginning of the period 154,565 (1,871) (480) 25,238 177,452 Profit after taxation attributable to shareholders – – – 30,091 30,091 Other comprehensive incomeMovement in foreign currency translation reserve – 1,707 – – 1,707 Movement in derivative hedging reserve – – (1,256) – (1,256)Total other comprehensive income – 1,707 (1,256) – 451 Total comprehensive income – 1,707 (1,256) 30,091 30,542 Balance at the end of the period 7 154,565 (164) (1,736) 55,329 207,994
For the year ended 31 December 2020Balance at the beginning of the period 154,565 (164) (1,736) 55,329 207,994
Comprehensive incomeProfit after taxation attributable to shareholders – – – 30,938 30,938
Other comprehensive incomeMovement in foreign currency translation reserve – (7,874) – – (7,874) Movement in derivative hedging reserve – – (586) – (586)Total other comprehensive income – (7,874) (586) – (8,460)Total comprehensive income – (7,874) (586) 30,938 22,478 Balance at the end of the period 7 154,565 (8,038) (2,322) 86,267 230,472
The accompanying accounting policies and notes form an integral part of the financial statements.
Consolidated statement of financial positionas at 31 December 2020
$NZ000’s Note 31 Dec 2020 31 Dec 2019
Non-current assets
Property, plant and equipment 13 228,709 175,781
Right of use assets 14 508,508 353,937
Sub-lease receivable 1,144 1,029
Intangible assets 15 321,863 249,140
Deferred tax asset 16 39,658 36,353
Total non-current assets 1,099,882 816,240
Current assets
Inventories 8 16,607 12,415
Trade and other receivables 9 12,153 9,528
Income tax receivable 5,271 1,546
Cash and cash equivalents 10 35,666 34,965
Held for sale – assets 11 551 – Held for sale – assets for stores developed for sale 11 2,833 5,210
Total current assets 73,081 63,664
Total assets 1,172,963 879,904
Equity attributable to shareholders
Share capital 7 154,565 154,565
Reserves 7 (10,360) (1,900)
Retained earnings 86,267 55,329
Total equity attributable to shareholders 230,472 207,994
Non-current liabilities
Provisions 17 3,711 3,687
Deferred income 18 250 328
Loans 4 228,340 52,748
Lease liabilities 14 563,211 404,120
Derivative financial instruments 5 2,698 2,217
Total non-current liabilities 798,210 463,100
Current liabilities
Loans 4 8,058 101,578
Income tax payable 6,681 3,563
Trade and other payables 12 101,589 78,791
Provisions 17 1,608 1,584
Lease liabilities 14 23,826 20,963
Deferred income 18 538 77
Held for sale – liabilities 11 230 – Held for sale – liabilities for stores developed for sale 11 1,751 2,254
Total current liabilities 144,281 208,810
Total liabilities 942,491 671,910
Total equity and liabilities 1,172,963 879,904
The accompanying accounting policies and notes form an integral part of the financial statements.

49Annual Report 31 December 202048Restaurant Brands New Zealand Limited
Consolidated statement of cash flowsfor the year ended 31 December 2020
$NZ000’s Note 31 Dec 2020 31 Dec 2019
Cash flows from operating activities
Cash was provided by/(applied to):Receipts from customers 924,910 734,263
Receipts from Government grants 2 22,013 – Payments to suppliers and employees (786,882) (609,579)
Interest paid (6,525) (5,370)
Interest paid on leases 14 (23,752) (16,351)
Payment of income tax (17,909) (15,338)
Net cash from operating activities 111,855 87,625
Cash flows from investing activities
Cash was (applied to)/provided by:Acquisition of business 26 (122,002) (647)
Payment for intangibles (1,958) (4,911)
Purchase of property, plant and equipment (58,589) (54,772)
Proceeds from disposal of property, plant and equipment 4,451 555
Landlord contributions received 125 105
Net cash used in investing activities (177,973) (59,670)
Cash flows from financing activities
Cash was provided by/(applied to):Proceeds from loans 710,217 265,345
Repayment of loans (615,443) (257,521)
Payments for lease principal 14 (21,167) (16,019)
Net cash from financing activities 73,607 (8,195)
Net increase in cash and cash equivalents 7,489 19,760
Cash and cash equivalents at beginning of the period 34,965 15,034
Opening cash balances acquired on acquisition 147 3
Foreign exchange movements (6,935) 168
Cash and cash equivalents at the end of the period 35,666 34,965
Cash and cash equivalents comprise:Cash on hand 10 612 462
Cash at bank 10 35,054 34,503
35,666 34,965
The accompanying accounting policies and notes form an integral part of the financial statements.
Consolidated statement of cash flows (continued)for the year ended 31 December 2020
$NZ000’s 31 Dec 2020 31 Dec 2019
Reconciliation of profit after taxation with net cash from operating activities
Total profit after taxation attributable to shareholders 30,938 30,091
Add items classified as investing/financing activities:Loss/(gain) on disposal of property, plant and equipment 1,958 3,590
1,958 3,590
Add/(less) non-cash items:Depreciation 64,996 47,646
Lease termination (210) (301)
Increase/(decrease) in provisions 124 (67)
Amortisation of intangible assets 5,800 3,959
Impairment on property, plant and equipment (141) (660)
Net increase in deferred tax asset (4,330) (3,187)
66,239 47,390
Add/(less) movement in working capital:(Increase) in inventories (3,633) (2,166)
(Increase)/decrease in trade and other receivables (74) 645
Increase in trade and other payables 15,972 7,629
Increase in income tax payable 455 446
12,720 6,554
Net cash from operating activities 111,855 87,625
Reconciliation of movement in term loans
Opening balance 154,326 145,853
Net cash flow from financing activities 94,775 7,824
Foreign exchange movement (12,703) 649
Closing balance 236,398 154,326
The accompanying accounting policies and notes form an integral part of the financial statements.

51Annual Report 31 December 202050Restaurant Brands New Zealand Limited
Notes to and forming part of the financial statementsfor the year ended 31 December 2020
Note Page
Basis of preparation 51Performance 531. Segmental reporting 53
2. Revenue and expenses 55
3. Earnings per share 57
Funding and equity 574. Loans 57
5. Derivatives and hedge accounting 59
6. Financial risk management 60
7. Equity and reserves 62
Working capital 638 Inventories 63
9. Trade and other receivables 63
10. Cash and cash equivalents 64
11. Held for sale – assets and liabilities for stores developed for sale 64
12. Trade and other payables 64
Long term assets 6513. Property, plant and equipment 65
14. NZ IFRS 16 – Leases 67
15. Intangibles 68
Other notes 7116. Taxation 71
17. Provisions 73
18. Deferred income 74
19. Related party transactions 74
20. Commitments 74
21. Contingent liabilities 75
22. Subsequent events 75
23. New standards and interpretations 75
24. Fees paid to auditor 75
25. Donations 75
26. Business combinations 76
27. COVID-19 77
28. Deed of Cross Guarantee 78
Basis of preparationfor the year ended 31 December 2020
Reporting entityThe reporting entity is the consolidated group (the “Group”) comprising the economic entity Restaurant Brands New Zealand Limited (the “Company”) and its subsidiaries. Restaurant Brands New Zealand is a limited liability company incorporated and domiciled in New Zealand. The principal activity of the Group is the operation of quick service and takeaway restaurant concepts in New Zealand, Australia, California and Hawaii (including Saipan and Guam).
Restaurant Brands New Zealand Limited is registered under the Companies Act 1993 and is a FMC reporting entity under Part 7 of the Financial Markets Conduct Act 2013. The address of its registered office is Level 3, Building 7, Central Park, 666 Great South Road, Penrose, Auckland.
The Company is listed on the New Zealand Stock Exchange (“NZX”) and the Australian Securities Exchange (“ASX”). The Group is designated as a for-profit entity for financial reporting purposes.
Subsidiaries of the Company are as follows:
Name Nature
Restaurant Brands Limited Restaurant operating
Restaurant Brands Australia Pty Limited Restaurant operating
QSR Pty Limited Restaurant operating
Taco Aloha Inc. Restaurant operating
Hawaii Pizza Hut Inc. Restaurant operating
Pizza Hut of Guam, Inc. Restaurant operating
Pizza Hut of Saipan, Inc. Restaurant operating
TB Guam Inc. Restaurant operating
RBD California Restaurant Limited Restaurant operating
RBD US Holdings Limited Investment holding
Pacific Island Restaurants Inc. Investment holding
TD Food Group Inc. Investment holding
RB Holdings Limited Investment holding
RBP Holdings Limited Investment holding
RBDNZ Holdings Limited Investment holding
RBN Holdings Limited Investment holding
Restaurant Brands Australia Holdings Pty Limited Investment holding
Restaurant Brands Properties Limited Property holding
Restaurant Brands Nominees Limited Employee share option plan trustee
Restaurant Brands Pizza Limited Non-trading
Basis of preparationThe financial statements of the Group have been prepared in accordance with:
• New Zealand Generally Accepted Accounting Practice (“NZ GAAP”)
• Part 7 of the Financial Markets Conduct Act 2013
• NZX Main Board Listing Rules
They comply with New Zealand equivalents to International Financial Reporting Standards (“NZ IFRS”), NZ IFRIC interpretations, and other applicable Financial Reporting Standards, as appropriate for a for-profit entity. The financial statements comply with International Financial Reporting Standards (“IFRS”) as issued by the IASB.
The measurement basis adopted in the preparation of these financial statements is historical cost, modified by the revaluation of certain investments and financial instruments as identified in the accompanying notes. The financial statements are presented in New Zealand dollars, rounded where necessary to the nearest thousand dollars. The 31 December 2019 results are for 44 weeks due to a change in balance date to align with Global Valar S.L. our majority shareholder. Therefore the current period is not directly comparable to the prior period.
The principal accounting policies applied in the preparation of these financial statements are set out in the accompanying notes including where an accounting policy choice is provided by NZ IFRS, is new or has changed (refer note 23), is specific to the Group’s operations or is significant or material.
These policies have been consistently applied to all the periods presented, unless otherwise stated.
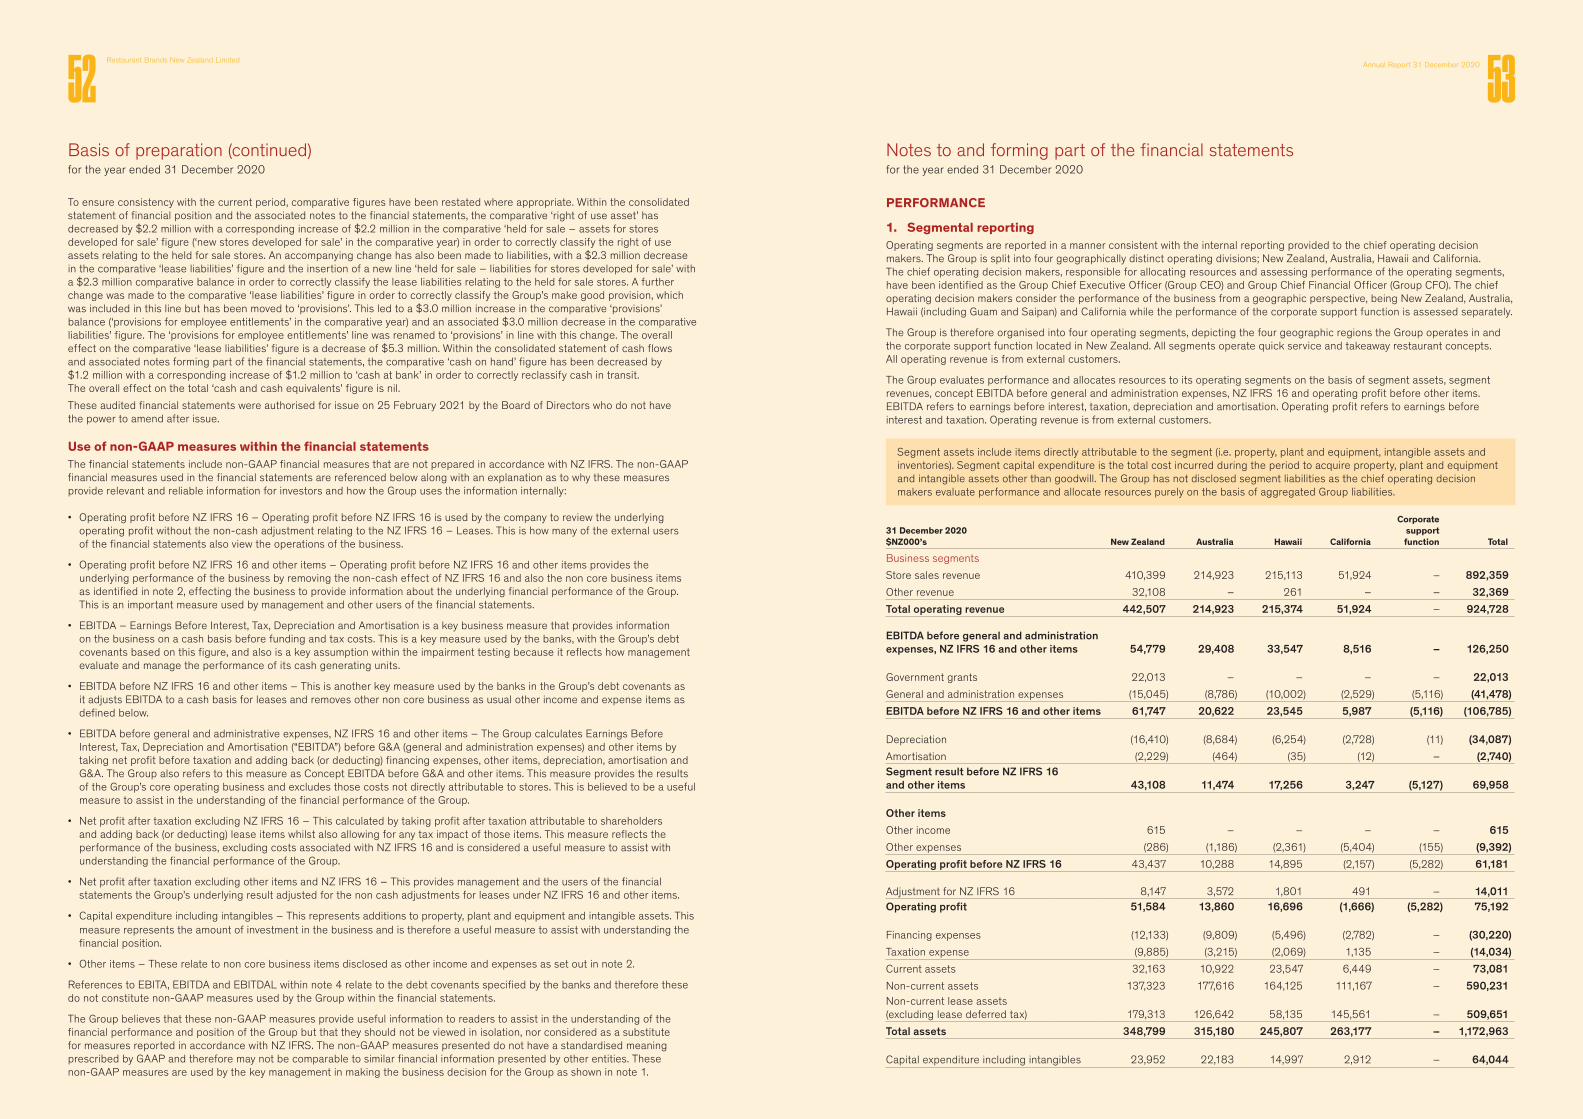
53Annual Report 31 December 202052Restaurant Brands New Zealand Limited
Basis of preparation (continued)for the year ended 31 December 2020
To ensure consistency with the current period, comparative figures have been restated where appropriate. Within the consolidated statement of financial position and the associated notes to the financial statements, the comparative ‘right of use asset’ has decreased by $2.2 million with a corresponding increase of $2.2 million in the comparative ‘held for sale – assets for stores developed for sale’ figure (‘new stores developed for sale’ in the comparative year) in order to correctly classify the right of use assets relating to the held for sale stores. An accompanying change has also been made to liabilities, with a $2.3 million decrease in the comparative ‘lease liabilities’ figure and the insertion of a new line ‘held for sale – liabilities for stores developed for sale’ with a $2.3 million comparative balance in order to correctly classify the lease liabilities relating to the held for sale stores. A further change was made to the comparative ‘lease liabilities’ figure in order to correctly classify the Group’s make good provision, which was included in this line but has been moved to ‘provisions’. This led to a $3.0 million increase in the comparative ‘provisions’ balance (‘provisions for employee entitlements’ in the comparative year) and an associated $3.0 million decrease in the comparative liabilities’ figure. The ‘provisions for employee entitlements’ line was renamed to ‘provisions’ in line with this change. The overall effect on the comparative ‘lease liabilities’ figure is a decrease of $5.3 million. Within the consolidated statement of cash flows and associated notes forming part of the financial statements, the comparative ‘cash on hand’ figure has been decreased by $1.2 million with a corresponding increase of $1.2 million to ‘cash at bank’ in order to correctly reclassify cash in transit. The overall effect on the total ‘cash and cash equivalents’ figure is nil.
These audited financial statements were authorised for issue on 25 February 2021 by the Board of Directors who do not have the power to amend after issue.
Use of non-GAAP measures within the financial statementsThe financial statements include non-GAAP financial measures that are not prepared in accordance with NZ IFRS. The non-GAAP financial measures used in the financial statements are referenced below along with an explanation as to why these measures provide relevant and reliable information for investors and how the Group uses the information internally: • Operating profit before NZ IFRS 16 – Operating profit before NZ IFRS 16 is used by the company to review the underlying
operating profit without the non-cash adjustment relating to the NZ IFRS 16 – Leases. This is how many of the external users of the financial statements also view the operations of the business.
• Operating profit before NZ IFRS 16 and other items – Operating profit before NZ IFRS 16 and other items provides the underlying performance of the business by removing the non-cash effect of NZ IFRS 16 and also the non core business items as identified in note 2, effecting the business to provide information about the underlying financial performance of the Group. This is an important measure used by management and other users of the financial statements.
• EBITDA – Earnings Before Interest, Tax, Depreciation and Amortisation is a key business measure that provides information on the business on a cash basis before funding and tax costs. This is a key measure used by the banks, with the Group’s debt covenants based on this figure, and also is a key assumption within the impairment testing because it reflects how management evaluate and manage the performance of its cash generating units.
• EBITDA before NZ IFRS 16 and other items – This is another key measure used by the banks in the Group’s debt covenants as it adjusts EBITDA to a cash basis for leases and removes other non core business as usual other income and expense items as defined below.
• EBITDA before general and administrative expenses, NZ IFRS 16 and other items – The Group calculates Earnings Before Interest, Tax, Depreciation and Amortisation (“EBITDA”) before G&A (general and administration expenses) and other items by taking net profit before taxation and adding back (or deducting) financing expenses, other items, depreciation, amortisation and G&A. The Group also refers to this measure as Concept EBITDA before G&A and other items. This measure provides the results of the Group’s core operating business and excludes those costs not directly attributable to stores. This is believed to be a useful measure to assist in the understanding of the financial performance of the Group.
• Net profit after taxation excluding NZ IFRS 16 – This calculated by taking profit after taxation attributable to shareholders and adding back (or deducting) lease items whilst also allowing for any tax impact of those items. This measure reflects the performance of the business, excluding costs associated with NZ IFRS 16 and is considered a useful measure to assist with understanding the financial performance of the Group.
• Net profit after taxation excluding other items and NZ IFRS 16 – This provides management and the users of the financial statements the Group’s underlying result adjusted for the non cash adjustments for leases under NZ IFRS 16 and other items.
• Capital expenditure including intangibles – This represents additions to property, plant and equipment and intangible assets. This measure represents the amount of investment in the business and is therefore a useful measure to assist with understanding the financial position.
• Other items – These relate to non core business items disclosed as other income and expenses as set out in note 2.
References to EBITA, EBITDA and EBITDAL within note 4 relate to the debt covenants specified by the banks and therefore these do not constitute non-GAAP measures used by the Group within the financial statements.
The Group believes that these non-GAAP measures provide useful information to readers to assist in the understanding of the financial performance and position of the Group but that they should not be viewed in isolation, nor considered as a substitute for measures reported in accordance with NZ IFRS. The non-GAAP measures presented do not have a standardised meaning prescribed by GAAP and therefore may not be comparable to similar financial information presented by other entities. These non-GAAP measures are used by the key management in making the business decision for the Group as shown in note 1.
Notes to and forming part of the financial statementsfor the year ended 31 December 2020
PERFORMANCE
1. Segmental reportingOperating segments are reported in a manner consistent with the internal reporting provided to the chief operating decision makers. The Group is split into four geographically distinct operating divisions; New Zealand, Australia, Hawaii and California. The chief operating decision makers, responsible for allocating resources and assessing performance of the operating segments, have been identified as the Group Chief Executive Officer (Group CEO) and Group Chief Financial Officer (Group CFO). The chief operating decision makers consider the performance of the business from a geographic perspective, being New Zealand, Australia, Hawaii (including Guam and Saipan) and California while the performance of the corporate support function is assessed separately.
The Group is therefore organised into four operating segments, depicting the four geographic regions the Group operates in and the corporate support function located in New Zealand. All segments operate quick service and takeaway restaurant concepts. All operating revenue is from external customers.
The Group evaluates performance and allocates resources to its operating segments on the basis of segment assets, segment revenues, concept EBITDA before general and administration expenses, NZ IFRS 16 and operating profit before other items. EBITDA refers to earnings before interest, taxation, depreciation and amortisation. Operating profit refers to earnings before interest and taxation. Operating revenue is from external customers.
Segment assets include items directly attributable to the segment (i.e. property, plant and equipment, intangible assets and inventories). Segment capital expenditure is the total cost incurred during the period to acquire property, plant and equipment and intangible assets other than goodwill. The Group has not disclosed segment liabilities as the chief operating decision makers evaluate performance and allocate resources purely on the basis of aggregated Group liabilities.
31 December 2020 $NZ000’s New Zealand Australia Hawaii California
Corporate support function Total
Business segments
Store sales revenue 410,399 214,923 215,113 51,924 – 892,359Other revenue 32,108 – 261 – – 32,369Total operating revenue 442,507 214,923 215,374 51,924 – 924,728
EBITDA before general and administration expenses, NZ IFRS 16 and other items 54,779 29,408 33,547 8,516 – 126,250
Government grants 22,013 – – – – 22,013General and administration expenses (15,045) (8,786) (10,002) (2,529) (5,116) (41,478)EBITDA before NZ IFRS 16 and other items 61,747 20,622 23,545 5,987 (5,116) (106,785)
Depreciation (16,410) (8,684) (6,254) (2,728) (11) (34,087)Amortisation (2,229) (464) (35) (12) – (2,740)Segment result before NZ IFRS 16 and other items 43,108 11,474 17,256 3,247 (5,127) 69,958
Other itemsOther income 615 – – – – 615Other expenses (286) (1,186) (2,361) (5,404) (155) (9,392)Operating profit before NZ IFRS 16 43,437 10,288 14,895 (2,157) (5,282) 61,181
Adjustment for NZ IFRS 16 8,147 3,572 1,801 491 – 14,011Operating profit 51,584 13,860 16,696 (1,666) (5,282) 75,192
Financing expenses (12,133) (9,809) (5,496) (2,782) – (30,220)Taxation expense (9,885) (3,215) (2,069) 1,135 – (14,034)Current assets 32,163 10,922 23,547 6,449 – 73,081Non-current assets 137,323 177,616 164,125 111,167 – 590,231Non-current lease assets (excluding lease deferred tax) 179,313 126,642 58,135 145,561 – 509,651Total assets 348,799 315,180 245,807 263,177 – 1,172,963
Capital expenditure including intangibles 23,952 22,183 14,997 2,912 – 64,044

55Annual Report 31 December 202054Restaurant Brands New Zealand Limited
31 December 2019 $NZ000’s New Zealand Australia Hawaii
Corporate support function Total
Business segments
Store sales revenue 367,521 169,105 168,915 – 705,541 Other revenue 27,976 – 149 – 28,125 Total operating revenue 395,497 169,105 169,064 – 733,666
EBITDA before general and administration expenses, NZ IFRS 16 and other items 67,907 25,202 22,865 – 115,974
General and administration expenses (11,923) (6,786) (7,694) (3,024) (29,427)EBITDA before NZ IFRS 16 and other items 55,984 18,416 15,171 (3,024) 86,547
Depreciation (13,241) (6,849) (5,257) (9) (25,356)Amortisation (included in cost of sales) (1,830) (325) (23) – (2,178)Segment result before NZ IFRS 16 and other items 40,913 11,242 9,891 (3,033) 59,013
Other itemsOther income 100 321 – – 421 Other expenses (62) (2,965) (1,832) (479) (5,338)Operating profit before NZ IFRS 16 40,951 8,598 8,059 (3,512) 54,096
Adjustment for NZ IFRS 16 6,647 2,323 1,304 – 10,274 Operating profit 47,598 10,921 9,363 (3,512) 64,370
Financing expenses (8,871) (7,388) (5,205) – (21,464)Taxation expense (10,092) (1,448) (1,275) – (12,815)Current assets 40,455 10,712 10,302 – 61,469 Non-current assets 114,319 157,763 169,513 – 441,595 Non-current lease assets (excluding lease deferred tax) 195,805 114,607 66,428 – 376,840 Total assets 350,579 283,082 246,243 – 879,904
Capital expenditure including intangibles 23,079 21,749 14,328 – 59,156
1.1 Reconciliation between operating profit and net profit after taxation excluding other items and NZ IFRS 16
$NZ000’s 31 Dec 2020 31 Dec 2019
Operating profit 75,192 64,370
Financing expenses (30,220) (21,464)
Net profit before taxation 44,972 42,906
Taxation expense (14,034) (12,815)
Net profit after taxation 30,938 30,091
Add back net financing impact of NZ IFRS 16 9,741 6,076
Less taxation expense of NZ IFRS 16 (2,737) (1,547)
Net profit after taxation excluding NZ IFRS 16 37,942 34,620
Less other income (615) (421)
Add back other expenses 9,392 5,338
Less income tax on other items (57) (883)
Net profit after taxation excluding other items and NZ IFRS 16 46,662 38,654
Notes to and forming part of the financial statements (continued)for the year ended 31 December 2020
2. Revenue and expensesOPERATING REVENUEStore sales revenue
Revenue from store sale of goods is recognised at point of sale, measured at the fair value of the consideration received, net of returns, discounts, and excluding GST.
Other revenue
Other revenue includes sale of goods and services to independent franchisees. Sale of goods, including cost of freight, are recognised similar to store sales revenue. Sale of services is recognised over time as the independent franchisee simultaneously receives and consumes the benefit provided by the Group. Royalties received are based on the revenue generated by the independent franchisees, recognised over time.
Also included in other revenue is revenue related to the sale of new stores developed and constructed under contract to franchisees. Under the terms of the contracts, the Group is contractually restricted from redirecting the properties to another customer and has an enforceable right to payment for work done. Revenue from construction of stores is therefore recognised over time using a cost-to-cost method i.e. based on the portion of the contracted costs incurred for work performed to date relative to the estimated total cost.
OPERATING EXPENSESRoyalties paid
$NZ000’s 31 Dec 2020 31 Dec 2019
Royalties paid 52,796 42,069
Royalties are recognised as an expense as revenue is earned.
Wages and salaries
$NZ000’s 31 Dec 2020 31 Dec 2019
Wages and salaries 254,840 204,306
Decrease/(increase) in liability for long service leave 16 (89)
254,856 204,217
Liabilities for wages and salaries, including non-monetary benefits and accumulating sick leave, that are expected to be settled wholly within 12 months after the end of the period in which the employees render the related service are recognised in respect of employees’ services up to the end of the reporting period and are measured at the amounts expected to be paid when the liabilities are settled.
Government grants
As part of the New Zealand Government response to COVID-19 the Group received a Government wage subsidy of $22.0 million. This has been included as a separate line item on the consolidated statement of comprehensive income.
The Group views these as a credit against salaries and wage costs, however due to the material nature of the subsidy it is disclosed separately. It has been included as receipts from Government grants in the consolidated statement of cash flows.
Government grants are recognised when there is reasonable assurance that the company will comply with the conditions attached to the grant and the grant will be received. A forgivable loan from government is treated as a government grant when there is reasonable assurance that the company will meet the terms for forgiveness of the loan.
The Group will recognise a grant using the income approach with the grant recognised in profit and loss over the period in which the company recognises as expenses the related costs for which the grant is intended to compensate.

57Annual Report 31 December 202056Restaurant Brands New Zealand Limited
Lease expenses
$NZ000’s 31 Dec 2020 31 Dec 2019
Lease expense 4,877 3,953
This relates to short term and variable lease costs included in the consolidated statement of comprehensive income not included in NZ IFRS 16 costs. Included in the above is rent relief of $1.3 million which has been received during the year and has been included as a negative variable rent within the consolidated statement of comprehensive income. Contracts with abatement clauses total $0.5 million whilst those without abatement clauses total $0.8 million.
$NZ000’s 31 Dec 2020 31 Dec 2019
Other incomeNet gain on sale of stores 405 100
Lease termination 210 301
Lease surrender gain – 321
Total other income 615 722
Other expensesRecurring
Amortisation of franchise rights acquired on acquisition of QSR Pty Limited (QSR), Pacific Island Restaurants Inc. (PIR) and the franchise rights of Great American Chicken Corporation (3,060) (1,781)
Relocation and refurbishment (1,784) (3,209)
Utilisation of depreciation provision 683 660
Non-recurringAcquisition costs (4,332) (631)
Leave remediation (49) (361)
Calendar realignment costs (50) (16)
Impairment of assets (542) –
Yum! GST charges (87) –
Yum! Royalty claim (171) –
Total other expenses (9,392) (5,338)
Lease terminationThis is the gain related to the termination of a lease contract prior to its maturity.
Leave remediationThe Group identified a payroll calculation discrepancy in regards to entitlements under the Holidays Act 2003 which, over time, have resulted in staff receiving incorrect payments. The specific areas that require remediation date back to 2012, and primarily relate to the payment rates for annual leave. The expense in the 31 December 2019 and the 31 December 2020 period relates to costs associated with making the payments to the affected employees.
Utilisation of depreciation provisionThis is the correction of depreciation charged on assets that were impaired in previous periods, refer note 13.
The Group seeks to present a measure of comparable underlying performance on a consistent basis. In order to do so, the Group separately discloses items considered to be unrelated to the day to day operational performance of the Group. Such items are classified as other income and other expenses and are separately disclosed in the consolidated statement of comprehensive income and notes to the financial statements.
Notes to and forming part of the financial statements (continued)for the year ended 31 December 2020
3. Earnings per share
31 Dec 2020 31 Dec 2019
Basic earnings per shareProfit after taxation attributable to the shareholders ($NZ000's) 30,938 30,091
Weighted average number of shares on issue (000's) 124,759 124,759
Basic earnings per share (cents) 24.80 24.12
Diluted earnings per shareProfit after taxation attributable to the shareholders ($NZ000's) 30,938 30,091
Weighted average number of shares on issue (000's) 124,759 124,759
Diluted earnings per share (cents) 24.80 24.12
Basic earnings per share (EPS) is calculated by dividing the profit or loss attributable to ordinary shareholders of the Company by the weighted average number of ordinary shares outstanding during the period. Diluted EPS reflects any commitments the Company has to issue shares in the future that would decrease EPS.
FUNDING AND EQUITY
4. Loans
$NZ000’s 31 Dec 2020 31 Dec 2019
Secured bank loans denominated in:NZD 20,000 10,000
AUD 51,151 87,521
USD 165,247 56,805
Secured bank loans 236,398 154,326
A loan is classified as current if it is due for repayment within 12 months of the Group’s year end.
Current 8,058 101,578
Term 228,340 52,748
Secured bank loans 236,398 154,326
Included within the Group’s loans is $11.3 million ($8.1 million current) relating to the Paycheck Protection Program. In the Group’s half year financial statements this was classified as deferred income. An application for the loans to be forgiven has been filed with the Small Business Association. The loan is with First Hawaiian Bank. This is included within the proceeds from loans within the consolidated statement of cash flows. Refer note 27 for further details.
FacilitiesOn 24 February 2020 the Group entered into new loan facility agreements. The facilities are split between NZD, USD and AUD tranches and replaced the Group’s previous agreements which primarily expired during 2020. Most of the tranches are three year terms with the reminder expiring in four years.
The Group has loan facilities in place totalling $350.6 million with the following financial institutions:
• Westpac Banking Corporation – $NZ20.0 million and $A70.0 million facility expiring on 1 May 2023
• Bank of China – $NZ20.0 million facility expiring on 1 May 2023 and $A40.0 million facility expiring on 1 May 2024
• J P Morgan – $US75.0 million expiring on 1 May 2023
• Rabobank – $NZ20.0 million expiring on 1 May 2023 and $US50.0 million facility expiring on 1 May 2024

59Annual Report 31 December 202058Restaurant Brands New Zealand Limited
Interest rate swapsThe table below summarises the Group’s current interest rate swaps. The effective interest rate is inclusive of the swap margin and the maturity date of the swaps coincides with the maturity date of the drawn down loans.
Date entered Face value Maturity dateInterest rate
paidInterest rate
receivedSwap
fair value
22 January 2017 $NZ10 million 28 January 2022 3.0% 0.28% (345)
25 January 2017 $A15 million 25 January 2022 2.5% 0.06% (496)
14 November 2017 $A20 million 14 November 2022 2.5% 0.02% (1,035)
22 May 2017 $US10 million 1 June 2022 2.1% 0.15% (427)
29 June 2017 $US10 million 1 July 2022 2.0% 0.15% (395)
Total (2,698)
SecurityAs security over the AUD and NZD loans, banks holds a negative pledge deed between Restaurant Brands New Zealand Limited and all its Australasian subsidiary companies. The negative pledge deed includes all obligations and cross guarantees between the guaranteeing subsidiaries.
As security over the USD debt facility, the bank holds guarantees and security over the USA businesses.
The Group also has indemnity guarantees of $2.0 million across various properties leased in New Zealand and Australia and a standby letter of credit in Hawaii of $0.5 million.
The Group is subject to a number of externally imposed bank covenants as part of the terms of its secured bank loan facilities.
The most significant covenants relating directly to capital management are the ratio of total debt to earnings before interest, tax and amortisation (EBITA) and restrictions relating to acquiring its own shares.
The specific covenants relating to financial ratios the Group is required to meet under the new agreements are:
• debt coverage ratio (i.e. net debt to EBITDA), with EBITDA being earnings before interest, taxation, deprecation and amortisation,
• fixed charge coverage ratio (EBITDAL to fixed charges), with EBITDAL being EBITDA before lease costs, fixed charges comprising interest and lease costs,
• guaranteeing group assets ratio (i.e. total guaranteeing group tangible assets to total consolidated group tangible assets), and
• guaranteeing group earnings ratio (i.e. non-guaranteeing group EBITDA to the consolidated group EBITDA).
These ratios exclude the impact of NZ IFRS 16 leases.
The covenants are reported to the bank on a six monthly basis, whilst the Board reviews covenant compliance on a monthly basis.
There have been no breaches of the covenants during the period (Dec 2019: no breaches).
The carrying value equates to fair value. For more information about the Group’s exposure to interest rate and foreign currency risk see Note 6.
Borrowings are recognised initially at fair value, net of transaction costs incurred. Borrowings are subsequently stated at amortised cost; any difference between the proceeds (net of transaction costs) and the redemption value is recognised in the consolidated statement of comprehensive income over the period of the borrowings using the effective interest method.
Financing expense
$NZ000’s 31 Dec 2020 31 Dec 2019
Financing expense – leases 23,752 16,351
Finance expense – bank 6,468 5,113
Financing expenses 30,220 21,464
Included within the period ended 31 December 2020 is $23.8 million of interest relating to leases recognised in accordance with NZ IFRS 16 (Dec 2019: $16.4 million).
Financing expenses comprise: interest payable on borrowings calculated using the effective interest rate method; interest received on funds invested calculated using the effective interest rate method; lease interest (note 14); foreign exchange gains and losses; gains and losses on certain financial instruments that are recognised in profit or loss in the consolidated statement of comprehensive income; unwinding of the discount on provisions and impairment losses on financial assets.
Notes to and forming part of the financial statements (continued)for the year ended 31 December 2020
5. Derivatives and hedge accounting
$NZ000’s31 Dec 2020
Liabilities31 Dec 2019
Liabilities
TermFair value of interest rate swaps 2,698 2,217
2,698 2,217
Change in fair value of interest rate swaps (481) (1,455)
Change in value of hedged item used to determine hedge effectiveness 481 1,455
The above table shows the Group’s financial derivative holdings at period end and the change in fair value of the hedge and the underlying item being hedged. The interest rate swaps hedge ratio was 1:1 for both periods as the change in fair value of the interest rate swap mirrored the change in the fair value of the hedged item used to determine hedge effectiveness.
There were no transfers between fair value levels during the period (Dec 2019: Nil). The fair values are classified as level two.
The fixed interest rates of the swaps used to hedge range between 1.86% and 2.75% (Dec 2019: 2.02% to 3.03%) and the variable rates of the loans are between 0.02% and 0.28% above the applicable bank bill rates. Refer note 4 for the interest rate swaps face values, maturity dates, currencies and interest rate ranges.
The Group’s current hedge relationships are cash flow hedges. Under NZ IFRS 9 the hedged risk is designated as being changes in the variable interest rate, with changes in the full fair value of the interest rate swaps being accounted for through other comprehensive income (to the extent the hedge is effective).
Financial assetsThe Group classifies its financial assets as those to be measured at amortised cost (loans, receivables and non-derivative financial instruments), and those to be measured subsequently at fair value either through OCI or through profit or loss (derivative financial instruments).
Financial assets held at amortised costLoans and receivables are non-derivative financial assets with fixed or determinable payments that are not quoted in an active market. They are included in current assets, except for maturities greater than 12 months after the balance sheet date. These are classified as non-current assets. The Group’s loans and receivables comprise trade receivables, other debtors and cash and cash equivalents in the consolidated statement of financial position.
Financial assets that are stated at cost or amortised cost are reviewed individually at balance date to determine whether there is objective evidence of impairment. Any impairment losses are recognised in profit or loss in the consolidated statement of comprehensive income.
Financial instrumentsA financial instrument is recognised when the Group becomes a party to the contractual provisions of the instrument. Financial assets are derecognised when the Group’s contractual rights to the cash flows from the financial assets expire or when the Group transfers the financial asset to another party without retaining control or substantially all risks and rewards of the asset. Regular way purchases and sales of financial assets are accounted for at trade date, i.e. the date that the Group commits itself to purchase or sell the asset. Financial liabilities are derecognised when the Group’s obligations specified in the contract expire or are discharged or cancelled.
Non-derivative financial instrumentsNon-derivative financial instruments comprise trade receivables and other debtors, which are initially recognised at fair value plus transaction costs and subsequently measured at amortised cost, cash and cash equivalents, loans and borrowings (initially recognised at fair value plus transaction costs and subsequently measured at amortised cost), and trade and other payables which are initially recognised at fair value and subsequently measured at amortised cost.
Derivative financial instrumentsThe Group has various derivative financial instruments to manage the exposures that arise due to movements in foreign currency exchange rates and interest rates arising from operational, financing and investment activities. The Group does not hold derivative financial instruments for trading purposes. However, derivatives that do not qualify for hedge accounting are accounted for at fair value through profit or loss. Embedded derivatives are separated from the host contract and accounted for separately if the economic characteristics and risks of the host contract and the embedded derivative are not closely related, a separate instrument with the same terms as the embedded derivative would meet the definition of a derivative, and the combined instrument is not measured at fair value through profit or loss.

61Annual Report 31 December 202060Restaurant Brands New Zealand Limited
Notes to and forming part of the financial statements (continued)for the year ended 31 December 2020
Financial assets and financial liabilities by category
$NZ000’s 31 Dec 2020 31 Dec 2019
Loans and receivables Trade receivables 3,749 2,454
Other receivables 2,334 2,599
Cash and cash equivalents 35,666 34,965
41,749 40,018
Derivatives used for hedgingDerivative financial instruments – liabilities 2,698 2,217
2,698 2,217
Financial liabilities at amortised costLoans 236,398 154,326
Trade and other payables (excluding indirect and other taxes and employee benefits) 70,223 53,981
306,621 208,307
6. Financial risk managementExposure to credit, interest rate and foreign currency risks arises in the normal course of the Group’s business. Derivative financial instruments may be used to hedge exposure to fluctuations in foreign currency exchange rates and interest rates.
(a) Foreign currency riskThe Group is exposed to foreign currency risk on purchases that are denominated in a currency other than the New Zealand dollar. The currencies giving rise to this risk are primarily Australian dollars and US dollars.
The direct exposure to foreign currency risk is small and is primarily confined to raw material purchases, some items of capital equipment and some franchise fee payments. Where any one item is significant, the Group will specifically hedge its exposure.
The Group has an indirect exposure to foreign currency risk on some of its locally sourced ingredients, where those ingredients in turn have a high imported component. Where this is significant the Group contracts to a known purchase price with its domestic supplier based on a forward cover position taken by that supplier on its imported components.
The Group has a foreign currency risk on its assets and liabilities that are denominated in Australian and US dollars as part of its Australian and US investments.
(b) Interest rate riskThe Group’s main interest rate risk arises from bank loans. Based on a number of scenarios, the Group calculates the impact on profit or loss of a defined interest rate shift. Based on these scenarios the maximum loss potential is assessed by management as to whether it is within acceptable limits.
Where necessary the Group hedges its exposure to changes in interest rates primarily through the use of interest rate swaps. There are guidelines as to the minimum prescribed level of hedging set out by the Board, however the Board reviews all swaps before they are entered into.
Note 5 discusses in detail the Group’s accounting treatment for derivative financial instruments.
As discussed in note 4, the Group has an interest rate swap in place to fix the interest rate on $A35 million of Australian denominated bank loans to 2022 (Dec 2019: $A35 million), $NZ10 million to 2022 (Dec 2019: $NZ10 million to 2022) and $US20 million to 2022 (Dec 2019: $US20 million). The Group will continue to monitor interest rate movements to ensure it maintains an appropriate mix of fixed and floating rate exposure within the Group’s policy.
(c) Liquidity riskIn respect of the Group’s cash balances, non-derivative financial liabilities and derivative financial liabilities the following table analyses the amounts into relevant maturity groupings based on the remaining period at balance date to the contractual maturity date, along with their effective interest rates at balance date. The amounts disclosed in the table are the contractual undiscounted cash flows.
$NZ000’sEffective
interest rate TotalLess than
1 yearBetween
1 and 5 years
31 Dec 2020Cash on hand – 612 612 –
Cash at bank 0.25% 32,054 32,054 –
Money market deposit 0.20% 3,000 3,000 –
Bank term loan – principal (NZD) 4.36% (20,000) – (20,000)
Bank term loan – principal (AUD) 4.66% (51,151) – (51,151)
Bank term loan – principal (USD) 2.43% (165,247) (8,058) (157,189)
Bank term loan – expected interest 3.08% (16,689) (5,378) (11,311)
Derivative financial instruments – (2,466) (1,719) (747)Trade and other payables (excluding indirect and other taxes and employee benefits) – (69,653) (69,653) –
(289,540) (49,142) (240,398)
31 Dec 2019Cash on hand – 462 462 –
Cash at bank 0.50% 18,603 18,603 –
Money market deposit 0.95% 15,900 15,900 –
Bank term loan – principal (NZD) 7.74% (10,000) (10,000) –Bank term loan – principal (AUD) 3.22% (87,521) (87,521) –Bank term loan – principal (USD) 4.31% (56,804) (4,056) (52,748)
Bank term loan – expected interest 3.91% (9,939) (2,180) (7,759)
Derivative financial instruments – (1,940) (751) (1,189)Trade and other payables (excluding indirect and other taxes and employee benefits) – (53,235) (53,235) –
(184,474) (122,778) (61,696)
Prudent liquidity risk management implies the availability of funding through adequate amount of committed credit facilities. The Group aims to maintain flexibility in funding by keeping committed credit lines available.
The Group has a negative working capital balance as the nature of the business results in most sales conducted on a cash basis. The Group has bank funding facilities, excluding overdraft facilities, of $350.6 million (Dec 2019: $253 million) available at variable rates. The amount undrawn at balance date was $125.5 million (Dec 2019: $99 million) and therefore the Group has the ability to fully pay debts as they fall due.
The Group has fixed the interest rate on $NZ10 million of NZD bank loans, $A35 million of AUD bank loans and $US20 million of USD bank loans with the balance at a floating interest rate. The bank loans are structured as a revolving wholesale advance facility with portions of the facility renewing on a regular basis. This leads to the loans being sensitive to interest rate movement in 12 months or less.
The Group has lease liabilities with future cash payments as disclosed in the table below:
$NZ000’s 31 Dec 2020 31 Dec 2019
Within one year 51,831 40,634
One to five years 197,672 149,339
Beyond 5 years 724,669 543,694
974,172 733,667
This includes future options that the Group currently expects to exercise and is not discounted for the future nature of payments. This does not reflect the Group’s future contractual minimum payments.

63Annual Report 31 December 202062Restaurant Brands New Zealand Limited
Notes to and forming part of the financial statements (continued)for the year ended 31 December 2020
(d) Credit riskCredit risk arises from cash deposits with banks and financial institutions and outstanding trade and other receivables.
No collateral is required in respect of financial assets. Management has a credit policy in place and the exposure to credit risk is monitored on an ongoing basis. The nature of the business results in most sales being conducted on a cash basis that significantly reduces the risk that the Group is exposed to. Reputable financial institutions are used for investing and cash handling purposes.
There were no financial assets past due nor impaired at balance date (Dec 2019: nil).
At balance date there were no significant concentrations of credit risk and the maximum exposure to credit risk is represented by the carrying value of each financial asset in the consolidated statement of financial position.
(e) Fair valuesThe carrying values of bank loans are the fair value of these liabilities. A Group set-off arrangement is in place between certain bank accounts operated by the Group.
Sensitivity analysisIn managing interest rate and currency risks the Group aims to reduce the impact of short-term fluctuations on the Group’s earnings. Over the longer term, however, permanent changes in foreign exchange and interest rates on a weighted average balance will have an impact on profit.
At 31 December 2020 it is estimated that a general increase of one percentage point in interest rates would decrease the Group profit before income tax by approximately $1.5 million (Dec 2019: $0.8 million) however equity would increase $0.1 million. A one percentage point decrease in interest rates would increase the Group profit before income tax by approximately $2.2 million (Dec 2019: $0.8 million), however equity would reduce by $1.6 million.
A general increase of one percentage point in the value of the New Zealand dollar against other foreign currencies would have minimal impact on the cost of the Group’s directly imported ingredients denominated in foreign currencies.
Capital risk managementThe Group’s capital comprises share capital, reserves, retained earnings and debt.
The Group’s objectives when managing capital are to safeguard the Group’s ability to continue to operate as a going concern, to maintain an optimal capital structure commensurate with risk and return and reduce the cost of capital.
In order to maintain or adjust the capital structure, the Group may adjust the amount of dividends paid to shareholders, return capital to shareholders, issue new shares or sell assets to reduce debt or draw down more debt.
7. Equity and reservesShare capital
31 Dec 2020 number
31 Dec 2020 $NZ000’s
31 Dec 2019 number
31 Dec 2019 $NZ000’s
124,758,523 154,565 124,758,523 154,565
The issued and authorised capital of the Company represents ordinary fully paid up shares. The par value is nil (Dec 2019: nil). All issued shares carry equal rights in respect of voting and the receipt of dividends, and upon winding up rank equally with regards to the Company’s residual assets.
Incremental costs directly attributable to the issue of ordinary shares are recognised as a deduction from equity.
Foreign currency translation reserve
$NZ000’s 31 Dec 2020 31 Dec 2019
(8,038) (164)
The foreign currency translation reserve comprises all exchange rate differences arising from translating the financial statements of the foreign currency operations.
Derivative hedging reserve
$NZ000’s 31 Dec 2020 31 Dec 2019
(2,322) (1,736)
The derivative hedging reserve represents the fair value of outstanding derivatives.
WORKING CAPITAL
8. Inventories
$NZ000’s 31 Dec 2020 31 Dec 2019
Raw materials and consumables 16,607 12,415
Inventories recognised as an expense during the period ended 31 December 2020 amounted to $222.9 million (Dec 2019: $178.8 million). This is included in cost of sales.
Inventories are measured at the lower of cost and net realisable value. Net realisable value is the estimated selling price less the estimated costs of marketing, selling and distribution. The cost of inventories is based on the first-in first-out method and includes expenditure incurred in acquiring the inventories and bringing them to their existing condition and location. The cost of inventories consumed is recognised as an expense and included in cost of goods sold in the consolidated statement of comprehensive income.
9. Trade and other receivables
$NZ000’s 31 Dec 2020 31 Dec 2019
Trade receivables 3,749 2,454
Prepayments 6,070 4,475
Other receivables 2,334 2,599
12,153 9,528
The carrying amount of the Group’s trade and other receivables are denominated in the following currencies:
NZD 6,981 6,461
AUD 1,962 2,230
USD 3,210 837
12,153 9,528
The Group’s exposure to credit risk is minimal as the Group’s primary source of revenue is from sales made on a cash basis. The carrying value of trade and other receivables approximates fair value.
Receivables are initially recognised at fair value. They are subsequently adjusted for impairment losses. Discounting is not applied to receivables where collection is expected to occur with the next twelve months.

65Annual Report 31 December 202064Restaurant Brands New Zealand Limited
Notes to and forming part of the financial statements (continued)for the year ended 31 December 2020
10. Cash and cash equivalents
$NZ000’s 31 Dec 2020 31 Dec 2019
Cash on hand 612 462
Cash at bank 35,054 34,503
35,666 34,965
The carrying amount of the Group’s cash and cash equivalents are denominated in the following currencies:
NZD 8,218 20,698
AUD 5,855 7,092
USD 21,593 7,175
35,666 34,965
Included in cash and cash equivalents are credit card receipts and delivery receipts that are in transit at balance date.
11. Held for sale – assets and liabilities for stores developed for sale
$NZ000’s 31 Dec 2020 31 Dec 2019
Assets for stores developed for sale 2,833 5,210
Liabilities for stores developed for sale (1,751) (2,254)
This relates to new Pizza Hut stores developed for sale in New Zealand which are being actively marketed for sale and are expected to be sold within the next 12 months. Included as part of the balances are $1.8 million of lease liabilities (2019: $2.3 million) and $1.7 million of right of use assets (2019: $2.2 million) associated with these stores. This differs from ‘held for sale – assets’ and ‘held for sale – liabilities’ which relate to existing stores currently being operated by the Group which are actively being marketed for sale.
12. Trade and other payables
$NZ000’s 31 Dec 2020 31 Dec 2019
Trade payables 41,265 31,404
Other payables and accruals 28,958 22,577
Employee benefits 21,297 16,948
Indirect and other taxes 10,069 7,862
101,589 78,791
The carrying amount of the Group’s trade and other payables are denominated in the following currencies:
NZD 60,736 49,652
AUD 18,621 16,254
USD 22,232 12,885
101,589 78,791
The carrying value of trade payables and accruals approximates fair value.
Trade payables are recognised initially at fair value and subsequently measured at amortised cost using the effective interest method.
LONG TERM ASSETS
13. Property, plant and equipment
$NZ000’s Note Land
Leasehold improvements
Plant, equipment
and fittingsMotor
vehicles
Leased plant and
equipment
Capital work in
progress Total
Cost
Balance as at 25 February 2019 658 207,167 101,887 1,882 196 9,629 321,419 Additions 3,774 3,556 1,571 – – 45,344 54,245
Acquisition of business – 39 113 – – – 152
Transfers from work in progress – 27,532 12,829 181 – (40,542) –
Disposals – (12,513) (6,762) (193) – 320 (19,148)
Movement in exchange rates (57) 60 197 – – (46) 154
Balance as at 31 December 2019 4,375 225,841 109,835 1,870 196 14,705 356,822
Additions – – – – – 62,086 62,086
Acquisition of business 26 – 26,361 7,036 258 – 490 34,145
Transfers from work in progress – 37,507 18,141 164 – (57,993) (2,181)
Disposals – (6,183) (6,554) (191) – – (12,928)
Movement in exchange rates 92 (3,406) (1,455) (2) – (373) (5,144)
Balance as at 31 December 2020 4,467 280,120 127,003 2,099 196 18,915 432,800
Accumulated depreciation
Balance as at 25 February 2019 – (99,923) (62,624) (864) (196) – (163,607)Charge – (15,650) (9,042) (306) – – (24,998)
Disposals – 6,412 4,857 176 – – 11,445
Movement in exchange rates – (8) (64) 2 – – (70)
Balance as at 31 December 2019 – (109,169) (66,873) (992) (196) – (177,230)Charge – (20,943) (12,286) (378) – – (33,607)
Disposals – 3,572 4,850 165 – – 8,587
Movement in exchange rates – 516 859 (3) – – 1,372
Balance as at 31 December 2020 – (126,024) (73,450) (1,208) (196) – (200,878)
Impairment provision
Balance as at 25 February 2019 – (3,993) (419) – – – (4,412)Charge – (40) (212) – – – (252)
Utilised/disposed – 136 717 – – – 853
Balance as at 31 December 2019 – (3,897) 86 – – – (3,811)Charge – (97) (108) – – – (205)
Reclassification – 517 (517) – – – –
Utilised/disposed – 692 111 – – – 803
Balance as at 31 December 2020 – (2,785) (428) – – – (3,213)
Carrying amounts
Balance as at 25 February 2019 658 103,251 38,844 1,018 – 9,629 153,400
Balance as at 31 December 2019 4,375 112,775 43,048 878 – 14,705 175,781
Balance as at 31 December 2020 4,467 151,311 53,125 891 – 18,915 228,709
Note: Included in capital work in progress is software development in progress that is transferred to intangibles (refer note 15). Included in the closing balance of capital work in progress at 31 December 2020 is $0.4 million of software development in progress.

67Annual Report 31 December 202066Restaurant Brands New Zealand Limited
Notes to and forming part of the financial statements (continued)for the year ended 31 December 2020
Depreciation expense
$NZ000’s 31 Dec 2020 31 Dec 2019
Depreciation expense 33,811 25,250
Sale of property, plant and equipment
Net loss on disposal of property, plant and equipment (included in depreciation expense) (276) (106)
Net loss on disposal of property, plant and equipment (included in other expenses) (1,784) (3,209)
Property, plant and equipment is measured at cost less accumulated depreciation and impairment losses.
Depreciation is calculated on a straight line basis to allocate the cost of an asset, less any residual value, over its estimated useful life. Leased assets are depreciated over the shorter of the lease term and their useful lives. The estimated useful lives of fixed assets are as follows:
Leasehold improvements 5 - 25 years
Plant and equipment 3 - 12.5 years
Motor vehicles 4 years
Furniture and fittings 3 - 10 years
Computer equipment 3 - 5 years
Depreciation methods, useful lives and residual values are reassessed at the reporting date.
Depreciation expense is included in the consolidated statement of comprehensive income.
Gains and losses on disposals are determined by comparing proceeds with carrying amount. These are included in profit or loss in the consolidated statement of comprehensive income.
Significant judgments and estimates Impairment testing is an area where estimates and judgments have a significant risk of causing a material adjustment to the carrying amount of the Group’s tangible asset balances. Estimates of future cash flows are highly subjective judgements and can be significantly impacted by changes in the business or economic conditions.
Property, plant and equipment and intangible assets are reviewed for impairment semi-annually, or whenever events or changes in circumstances indicate that the carrying amount may not be recoverable. An impairment loss is recognised in the consolidated statement of comprehensive income for the amount by which the asset’s carrying amount exceeds its recoverable amount. The recoverable amount is the higher of an asset’s fair value less costs to sell and value in use. When assessing impairment, assets are grouped at the lowest levels for which there are separately identifiable cash flows; a restaurant’s assets is the relevant cash generating unit. If, in a subsequent period, the amount of the impairment loss decreases and it can be related objectively to an event occurring after the impairment was recognised, the reversal of the previously recognised impairment loss is recognised in the consolidated statement of comprehensive income.
The value in use calculation evaluates recoverability based on the restaurant’s forecasted discounted cash flows, which incorporate estimated sales growth and margin improvement based upon current plans for the store and actual results at comparable restaurants.
Key assumptions in the determination of recoverable amount are:
• the estimate of future cash flows of the restaurant incorporating reasonable sales growth and margin improvement
• the discount rate incorporating the rates of return based on the risk and uncertainty inherent in the forecast cash flows
• the terminal year sales growth is calculated based on continuous sales growth of a minimum of projected inflation estimated at 1.5%
Following a review of store performance and consideration of other impairment indicators, the Group has determined that no indicators of impairment exist at 31 December 2020 which would require impairment testing to be performed, or a further write down in the associated store assets. A full impairment test was performed as required by IAS 36 for the goodwill balance. Refer to note 15 for further detail over assumptions utilised.
14. NZ IFRS 16 – LeasesKey estimates and judgementsThere are a number of judgements and estimates in calculating the future lease liabilities and right of use asset value. These include:
• incremental borrowing rate. The Group engages an independent valuation expert to establish the incremental borrowing rates applied during the period.
• lease terms, including any rights of renewal expected to be exercised. The Group has assumed that all rights of renewal are expected to be exercised which is consistent with the Group’s strategy and previous leases. This judgement has been applied unless a store closure or a decision to relocate a store is known when valuing the lease.
• foreign exchange conversion rates.
Right of use asset (ROU asset)
$NZ000’s Note 31 Dec 2020 31 Dec 2019
Opening balance 353,937 –
Right of use assets at adoption date 26 February 2019 – 346,487
Right of use assets acquired on acquisition 26 159,310 –
Depreciation (30,908) (22,396)
Adjustments to existing right of use assets 7,134 8,984
Additions 29,764 18,721
FX movement (10,729) 2,141
Closing balance 508,508 353,937
Additions relates to new leases entered into by the Group.
The Group leases relate to land and buildings. Rental contracts are typically made for fixed periods of 1 to 50 years but may have extension options. Lease terms are negotiated on an individual basis and contain a wide range of different terms and conditions. The lease agreements do not impose any covenants, but leased assets may not be used as security for borrowing purposes.
Under NZ IFRS 16, leases are recognised as a right of use asset and a corresponding lease liability. Each lease payment is allocated between the lease liability and the finance cost. The finance cost is charged to the statement of comprehensive income over the lease period so as to produce a constant periodic rate of interest on the remaining balance of the liability for each period. The right of use asset is depreciated over the shorter of the asset’s useful life and the lease term on a straight line basis.
Assets and liabilities arising from a lease are initially measured on a present value basis. Lease liabilities include the net present value of fixed payments and known fixed lease increases, less any lease incentives receivable. Right of use assets are measured at cost comprising the amount of the initial measurement of lease liability and any restoration costs. These assets are subsequently depreciated using the straight line method from the commencement date to the end of the lease term.
The group is exposed to potential future increases in variable lease payments based on an index, rate or market rent review, which are not included in the lease liability or right of use asset until they take effect.
The lease payments are discounted using the interest rate implicit in the lease. If that rate cannot be determined, the lessee’s incremental borrowing rate is used, being the rate that the lessee would have to pay to borrow the funds necessary to obtain an asset of similar value in a similar economic environment with similar terms and conditions.
The Group has applied the recognition exemption allowed by the standard in respect of short-term and low value leases. Payments associated with short term leases and leases of low value assets are recognised on a straight line basis as an expense in the statement of comprehensive income. Short term leases are leases with a lease term of 12 months or less. Low value assets comprise IT equipment and small items of office furniture.

69Annual Report 31 December 202068Restaurant Brands New Zealand Limited
Notes to and forming part of the financial statements (continued)for the year ended 31 December 2020
Lease liabilities
$NZ000’s Note 31 Dec 2020 31 Dec 2019
Opening balance 425,083 –
Lease liabilities at adoption date 26 February 2019 – 411,089
Lease liabilities assumed on acquisition 26 158,244 –
Cash flow (45,843) (32,370)
Interest 23,752 16,351 Adjustments to existing lease liabilities 7,338 8,507
Additions 29,418 18,721
FX movement (10,955) 2,785
Closing balance 587,037 425,083
Current lease liabilities 23,826 20,963
Non-current lease liabilities 563,211 404,120
587,037 425,083
The weighted average incremental borrowing rate applied to lease additions during the year was 4.6%.
15. Intangibles
$NZ000’s Note Goodwill
Franchise fees
Favourable leases
Concept development
costs
Acquired software
costs Total
CostBalance as at 25 February 2019 226,319 26,992 4,546 1,290 10,834 269,981 Additions – 2,903 – – 2,008 4,911 Acquisition of business 26 405 77 – – – 482 Disposals (106) (73) – – (613) (792)Opening balance adjustment NZ IFRS 16 – – (4,546) – – (4,546)Movement in exchange rates 2,054 220 – – (1) 2,273 Balance as at 31 December 2019 228,672 30,119 – 1,290 12,228 272,309 Additions – 1,958 – – – 1,958 Acquisition of business 26 29,187 58,512 – – – 87,699 Transfer from work in progress – – – – 2,181 2,181Disposals (1,332) (3,765) – (489) (2,480) (8,066)Movement in exchange rates (7,249) (4,419) – – – (11,668)Balance as at 31 December 2020 249,278 82,405 – 801 11,929 344,413
Accumulated amortisationBalance as at 25 February 2019 (831) (10,015) (1,566) (1,157) (7,319) (20,888)Charge – (2,668) – (63) (1,228) (3,959)Disposals – 61 – – 62 123 Opening balance adjustment NZ IFRS 16 – – 1,566 – – 1,566 Movement in exchange rates – (11) – – – (11)Balance as at 31 December 2019 (831) (12,633) – (1,220) (8,485) (23,169)Charge – (4,168) – (5) (1,627) (5,800)Disposals – 3,336 – 489 2,190 6,015 Movement in exchange rates – 404 – – – 404 Balance as at 31 December 2020 (831) (13,061) – (736) (7,922) (22,550)
Impairment charges are recognised in other expenses in the consolidated statement of comprehensive income.
Carrying amountsBalance as at 25 February 2019 225,488 16,977 2,980 133 3,515 249,093 Balance as at 31 December 2019 227,841 17,486 – 70 3,743 249,140 Balance as at 31 December 2020 248,447 69,344 – 65 4,007 321,863
During 2019 the Group acquired a KFC store in Australia for $0.6 million giving rise to goodwill on acquisition of $0.4 million.
GoodwillGoodwill arises on the acquisition of subsidiaries and business combinations. Goodwill is measured at cost less accumulated impairment losses and has an indefinite useful life. Goodwill is allocated to cash generating units and is tested annually for impairment. Where the Group disposes of an operation within a cash generating unit, the goodwill associated with the operation disposed of is part of the gain or loss on disposal. Goodwill disposed of in this manner is measured based on the relative values of the operation disposed of and the portion of the cash generating unit retained.
Franchise feesFranchise costs are those incurred in obtaining franchise rights or licences to operate quick service and take-away restaurant concepts. They include for example, the initial fee paid to a system franchisor when a new store is opened. These are measured at cost less accumulated amortisation and accumulated impairment costs. Amortisation is on a straight line basis over the life of the applicable franchise or licence agreement.
Favourable leasesFavourable leases arise on acquisition of subsidiaries and business combinations. The terms of the lease were compared to market prices at the date of acquisition, to determine whether an intangible asset or liability should be recognised. If the terms of an acquired contract are favourable relative to market prices, an intangible asset is recognised. If the terms of the acquired contract are unfavourable relative to market prices, a liability is recognised. This is then amortised over the length of the lease. Following the introduction of NZ IFRS 16 these are now included as part of the right of use asset value.
Concept development costsConcept development costs include certain costs, other than the direct cost of obtaining the franchise, associated with the establishment of quick service and takeaway restaurant concepts. These include, for example, professional fees and consulting costs associated with the establishment of a new brand or business acquisition. These costs are capitalised where the concept is proven to be commercially feasible and the related future economic benefits are expected to exceed those costs with reasonable certainty. These are subsequently measured at cost less accumulated amortisation and accumulated impairment losses. Amortisation is recognised on a straight line basis over the period which future economic benefits are reasonably expected to be derived.
Acquired software costsSoftware costs have a finite useful life. Software costs are capitalised and amortised on a straight line basis over the estimated economic life of 3-8 years.
Amortisation
Amortisation charge is recognised in cost of sales and other expenses in the statement of comprehensive income.
$NZ000’s 31 Dec 2020 31 Dec 2019
Amortisation of intangibles 5,800 3,959
Significant judgments and estimates – impairment testing
Impairment testing is an area where estimates and judgments have a significant risk of causing a material adjustment to the carrying amount of the Group’s goodwill balances.
For the purpose of impairment testing, goodwill is allocated to the Group’s operating brands which represent the lowest level of cash-generating unit within the Group at which the goodwill is monitored for internal management purposes.
Allocation of goodwill by cash-generating unit:
$NZ000’s 31 Dec 2020 31 Dec 2019
KFC Australia 96,896 94,552
KFC New Zealand 6,528 3,818
Pizza Hut New Zealand 7,787 9,119
Pizza Hut and Taco Bell Hawaii 112,374 120,352
KFC and Taco Bell California 24,862 –
248,447 227,841
The recoverable amount of each cash-generating unit was based on its value in use.
Value in use was determined by discounting the future cash flows generated from the continuing use of the brand. Cash flows were projected based on a three year strategic business plan as approved by the Board of Directors.

71Annual Report 31 December 202070Restaurant Brands New Zealand Limited
Notes to and forming part of the financial statements (continued)for the year ended 31 December 2020
The key assumptions used for the value in use calculation are as follows:
31 Dec 2020Sales growth2022-2024
%
31 Dec 2020EBITDA margin
2022-2024%
31 Dec 2020EBITDA marginterminal year
%
31 Dec 2019Sales growth2021-2023
%
31 Dec 2019EBITDA margin
2021-2023%
31 Dec 2019EBITDA marginterminal year
%Brand
KFC New Zealand 4.1 20.1 20.1 4.1 20.8 20.8
Pizza Hut New Zealand 1.1 5.3 5.3 1.1 4.4 4.4KFC Australia 4.3 15.3 15.3 4.3 15.3 15.3
Pizza Hut Hawaii and Taco Bell 3.5 - 6.1 7.7 - 20.0 7.7 - 20.0 0.9 - 4.7 4.3 - 19.8 4.3 - 19.8
KFC and Taco Bell California 2.0 16.5 16.5 n/a n/a n/a
The terminal year sales growth is calculated based on the 2024 year and assumes a continuous sales growth of a minimum of projected inflation estimates of 1.5% (Dec 2019: 2.5%).
The discount rate for New Zealand KFC was 7.8% weighted average post-tax cost of capital (Dec 2019: 8.9%). The discount rate for New Zealand Pizza Hut was 10.9% (Dec 2019: 11.0%). The discount rate applied to future cash flows for the KFC business in Australia is based on a 7.8% weighted average post-tax cost of capital (Dec 2019: 8.7%). The discount rate applied to future cash flows for the Taco Bell and Pizza Hut business in Hawaii is based on an 8.0% (Dec 2019: 8.8%) weighted average post-tax cost of capital. The discount rate applied to future cash flows for the KFC and Taco Bell business in California is based on an 8.0% weighted average post-tax cost of capital.
The weighted average cost of capital calculation was reviewed in 2020 based on capital asset pricing model (CAPM) methodology using current market inputs.
The values assigned to the key assumptions represent management’s assessment of future trends in the industry and are based on both external sources and internal sources including Board approved forecasts (historical data). The key assumptions are detailed below:
• Sales growth – Average annual growth rate over the three-year forecast period based on past performance, management’s expectations of market development, current industry trends and including long-term inflation forecasts for each territory.
• EBITDA margin 2022 - 2024 and EBITDA margin terminal year – Based on post performance and management’s expectation for future EBITDA growth has been disclosed as a key assumption as a number of costs are variable and link directly to revenue levels, such as the cost of labour, and food costs. Other fixed costs of the CGU’s which do not vary significantly with revenue changes, are forecast based on the current structure of the business, adjusted for inflationary increases but not reflecting restructuring or cost-saving measures.
• Terminal year sales growth – This is the growth rate used to extrapolate cash flows beyond the budget period. The rates are consistent with expected long-term inflation.
• The discount rate – The rate used to reflect specific risks relating to the relevant segments and the countries in which they operate.
In respect of the New Zealand KFC brand any reasonably possible change in the key assumptions used in the calculations would not cause the carrying amount to exceed its recoverable amount. Also, due to improved performance, in regard the Pizza Hut brand any reasonably possible change in the key assumptions used in the calculations would not cause the carrying amount to exceed its recoverable amount. For the Pizza Hut New Zealand cash generating unit (CGU), as disclosed the 31 December 2019 financial statements, a reasonably possible change in key assumptions were identified as resulting in impairment. Since then the Pizza Hut New Zealand CGU has returned improved results largely due to the store sales program, delivering an improved EBITDA percentage. In respect of the Hawaii brands of Taco Bell and Pizza Hut, any reasonably possible change in the key assumptions used in the calculations would not cause the carrying amount to exceed its recoverable amount.
In respect of the Australian KFC brand, any reasonably possible change in the key assumptions used in the calculations would not cause the carrying amount to exceed its recoverable amount.
In respect of the California brands of KFC and Taco Bell, the business has been recently acquired and is performing above forecasts prepared on acquisition. Therefore any reasonably possible change in the key assumptions used in the calculations would not cause the carrying amount to exceed its recoverable amount.
OTHER NOTES
16. TaxationTaxation – statement of comprehensive income
The total taxation expense is analysed as follows:
$NZ000’s Note 31 Dec 2020 31 Dec 2019
Total profit before taxation for the period 1 44,972 42,906
Taxation expense 1 (14,034) (12,815)
Net profit after income tax 30,938 30,091
Taxation expense using the Company’s domestic tax rate (28.0%) (12,592) (28.0%) (12,014)
Non-deductible expenses (4.0%) (1,813) (2.4%) (1,020)
Adjustments due to different rate in different jurisdictions 0.8% 371 0.5% 219
(31.2%) (14,034) (29.9%) (12,815)
Taxation expense comprises:Current tax expense (18,364) (16,002)
Deferred tax credit 4,330 3,187
Net tax expense (14,034) (12,815)
Imputation credits
$NZ000’s 31 Dec 2020 31 Dec 2019
Imputation credits available for subsequent reporting periods 21,909 11,790
The above amounts represent the balance of the imputation account as at the end of the reporting period, adjusted for:
• Imputation credits that will arise from the payment of the amount of the provision for income tax
• Imputation credits that will be utilised from the payment of dividends recognised as a liability at the reporting date; and
• Imputation credits that will arise from the receipt of dividends recognised as receivables at the reporting date.
The current and deferred tax rates for the period were calculated using the rate of 28% for New Zealand, 30% for Australia and 21% for USA (Dec 2019: 28% New Zealand, 30% Australia and USA 21%).

73Annual Report 31 December 202072Restaurant Brands New Zealand Limited
Notes to and forming part of the financial statements (continued)for the year ended 31 December 2020
Taxation – balance sheetThe following are the major deferred taxation liabilities and assets recognised by the Group and movements thereon during the current and prior year:
Assets Liabilities Net
$NZ000’s 31 Dec 2020 31 Dec 2019 31 Dec 2020 31 Dec 2019 31 Dec 2020 31 Dec 2019
Property, plant and equipment 9,766 10,766 (174) – 9,592 10,766
Inventory 57 51 – – 57 51
Debtors – – (287) (172) (287) (172)
Provisions 6,830 4,463 – – 6,830 4,463
Intangibles 38 1,889 (2,211) (2,393) (2,173) (504)
Other 3,585 2,070 – – 3,585 2,070
Leases 22,054 19,679 – – 22,054 19,679
42,330 38,918 (2,672) (2,565) 39,658 36,353
$NZ000’s
Balance 25 February
2019
Opening balances
adjustment NZ IFRS 16
Recognised in consolidated
statement of comprehensive
incomeRecognised
in equity
Foreign currency
translation
Balance 31 December
2019
Property, plant and equipment 9,497 – 1,260 – 9 10,766
Inventory 32 – 20 – (1) 51
Debtors (161) – (12) – 1 (172)
Provisions 5,042 (1,286) 705 – 2 4,463
Intangibles (703) – 254 – (55) (504)
Other 2,597 – (587) – 60 2,070
Leases – 18,182 1,547 – (50) 19,679
16,304 16,896 3,187 – (34) 36,353
$NZ000’s
Balance 31 December
2019
Opening balances on acquisitions
Recognised in consolidated
statement of comprehensive
incomeRecognised
in equity
Foreign currency
translation
Balance 31 December
2020
Property, plant and equipment 10,766 – (1,155) – (19) 9,592 Inventory 51 – 6 – – 57 Debtors (172) – (111) – (4) (287)Provisions 4,463 – 2,355 – 12 6,830 Intangibles (504) – (1,877) – 208 (2,173)Other 2,070 – 2,590 (872) (203) 3,585 Leases 19,679 (70) 2,522 – (77) 22,054
36,353 (70) 4,330 (872) (83) 39,658
Current and deferred taxation are calculated on the basis of tax rates enacted or substantially enacted at reporting date, and are recognised in profit or loss except to the extent that it relates to items recognised in other comprehensive income or directly in equity. In this case, tax is also recognised in other comprehensive income or directly in equity, respectively.
Deferred income taxation is recognised in respect of temporary differences between the tax bases of assets and liabilities and their carrying amounts in the financial statements.
Deferred income tax is determined using tax rates (and laws) that have been enacted or substantially enacted by the balance sheet date and are expected to apply when the related deferred income tax asset is realised or the deferred tax liability is settled.
Deferred income tax assets are only recognised to the extent that it is probable that future taxable amounts will be available against which to utilise those temporary differences.
Tax returns for the Group and the detailed calculations that are required for filing tax returns are not prepared until after the financial statements are prepared. Estimates of these calculations are made for the purpose of calculating income tax expense, current tax and deferred tax balances. Any difference between the final tax outcomes and the estimations made in previous years will affect current year balances.
The statement of comprehensive income and statements of cash flows have been prepared exclusive of Goods and Services Taxation (GST). All items in the statement of financial position are stated net of GST, with the exception of receivables and payables, which include GST invoiced.
17. Provisions
$NZ000’s Employee provisions
Make good provisions Total
Balance at 31 December 2019 2,260 3,011 5,271 Created during the period 385 723 1,108 Used during the period (407) (74) (481)Released during the period (39) (614) (653)Foreign exchange movements 44 30 74 Balance at 31 December 2020 2,243 3,076 5,319
31 December 2020Non-current 635 3,076 3,711 Current 1,608 – 1,608 Total 2,243 3,076 5,319
The provision for employee entitlements is long service leave. The provision is affected by a number of estimates, including the expected length of service of employees and the timing of benefits being taken. Once an employee attains the required length of service, the employee has a period of five years in which to take this leave.
The make good provisions represents the contractual obligations for the estimate future store restorations cost at the completion of the property lease term. The make good provision is classified as non-current.

75Annual Report 31 December 202074Restaurant Brands New Zealand Limited
Notes to and forming part of the financial statements (continued)for the year ended 31 December 2020
18. Deferred income$NZ000’s
Balance at 31 December 2019 405 Created during the period 1
Opening balance acquired on acquisition 1,136
Used during the period (747)
Foreign exchange movements (7)
Balance at 31 December 2020 788
31 December 2020Non-current 250
Current 538
Total 788
Deferred income relates to rebates from suppliers and is recognised in profit or loss in the consolidated statement of comprehensive income on a systematic basis over the life of the associated contract.
19. Related party transactionsParent and ultimate controlling partyThe immediate parent of the Group is Global Valar S.L. and the ultimate parent company is Grupo Finaccess S.A.P.I de C.V.
Transactions with entities with key management or entities related to themThere have been no transactions with entities with key management or entities related to them.
Key management and Director compensationKey management personnel comprises the Group CEO and his direct reports, the Group CFO and the four Divisional CEO’s, Group Chief People Officer, Chief Legal and Compliance Officer.
$NZ000’s 31 Dec 2020 31 Dec 2019
Key management – total benefits 5,700 2,679
Directors' fees 420 360
Key management – total benefits relates to short-term employee benefits paid during the year.
Total Group CEO remuneration
$NZ000’s SalaryShort term incentives
Long term incentives
Total remuneration
31 December 2020 1,023 1,279 – 2,302 31 December 2019 806 – – 806
Short term incentive schemeA short term incentive scheme is in place for all support office employees. The incentive is based on achieving in excess of planned results for the specific financial year. Any bonus payment to employees is at the discretion of the Appointments and Remuneration committee. The maximum that can be received by the CEO is 50% of base salary. During the year a payment of $0.9 million was paid in lieu of a share price based incentive scheme. The Board also agreed to pay $0.6 million before May 2021 and $0.4 million in May 2022 conditional on the CEO continuing to be employed by the Group.
Long term incentive schemeThere is currently no other long term incentive plan in place.
20. CommitmentsCapital commitmentsThe Group has capital commitments which are not provided for in these financial statements, as follows:
$NZ000’s 31 Dec 2020 31 Dec 2019
Store development 6,817 9,267
21. Contingent liabilitiesThere are no contingent liabilities that the Directors consider will have a significant impact on the financial position of the Group (Dec 2019: nil).
22. Subsequent eventsOn 23 February 2021 the Group acquired some KFC stores in New South Wales, Australia for $A22.4 million through the purchase of TPH Group Pty Ltd.
There are no other subsequent events that would have a material effect on these financial statements.
23. New standards and interpretationsRelevant standards, amendments and interpretations to existing standards that are not yet effective and have not been early adopted by the GroupThere are various standards, amendments and interpretations which were assessed as having an immaterial impact on the Group. There are no other NZ IFRS, NZ IFRIC interpretations or other applicable IFRS that are effective for the first time for the financial period beginning on 1 January 2020 that had a material impact on the financial statements.
24. Fees paid to auditor
$NZ000’s 31 Dec 2020 31 Dec 2019
Audit of financial statementsAudit and review of financial statements – PwC 714 515
Other services – Performed by PwC
Specified procedures on landlord certificates 3 2
Review of Yum! Advertising Co-operative report 6 6
Total other services 9 8
Total fees paid to auditor 723 523
25. Donations
$NZ000’s 31 Dec 2020 31 Dec 2019
Donations 396 310

77Annual Report 31 December 202076Restaurant Brands New Zealand Limited
Notes to and forming part of the financial statements (continued)for the year ended 31 December 2020
26. Business combinationsCalifornia acquisitionOn 2 September 2020 in New Zealand, which corresponds to 1 September 2020 in the USA, the Group acquired the assets of Great American Chicken Corp, Inc. and Great American Chicken LLC. The assets acquired were in relation to 58 KFC stores and 11 joint KFC / Taco Bell stores, together with a head office facility in Southern California. Control of the stores passed in effect on 2 September 2020 in New Zealand.
The goodwill of $26.5 million arising upon this acquisition is attributable to the business know-how and the premium paid for strategic reasons, including acquiring an entry point into the US mainland market.
Included in the consolidated statement of comprehensive income are sales of $51.9 million and a net loss after tax of $3.3 million. Due to a non-disclosure agreement signed with Great American Chicken Corp, Inc. and Great American Chicken LLC it is impracticable to disclose what the contribution to revenue and profit and loss would have been had the acquisition occurred at the beginning of the annual reporting period.
The following summarises the consideration paid and the fair value of the assets acquired and liabilities assumed on the acquisition date.
$NZ000’s
Cash consideration paid 119,198
Recognised amounts of identifiable assets acquired and liabilities assumedProperty, plant and equipment 33,655
Intangibles – acquired franchise rights 58,512
NZ IFRS 16 initial recognitionRight of use lease assets 158,073
Lease liabilities (157,007)
Deferred tax (70)
Working capital itemsCash 141
Inventory 695
Prepayments 276
Accounts payable (419)
Deferred income (1,136)
Total identified assets and liabilities 92,720
Goodwill 26,478
The valuation of both the tangible and intangible assets are areas where estimates and judgements have a significant risk of causing a material adjustment to the fair value of the recognised amounts of identifiable assets acquired and liabilities assumed. The Group engaged third parties to value the tangible assets, leases and the intangible assets related to franchise agreements.
The valuation of franchise agreements was based on discounted cash flow methodology. Cash flows have been prepared both with and without the existing franchise agreements factored into the model to assess the value attributable to the existing franchise agreements. Goodwill is expected to be deductible for tax purposes over a 15 year period.
The valuation of property, plant and equipment was completed using a cost approach. The cost approach considers the cost to replace existing assets less the amount of depreciation in the asset. A market approach was also used for some assets where a active secondary market was identified.
The fair value of plant and equipment has been determined on a provisional basis due to the acquisition being completed close to the financial year end pending a final review of the fair value of certain items within property, plant and equipment. The fair value of these assets will be finalised within 12 months from the acquisition date.
KFC New Zealand acquisitionIn September 2020 the Group acquired a KFC store in New Zealand for $3.2 million. The store contributed sales of $0.9 million and net profit after tax of $0.1 million in the consolidated statement of comprehensive income. The acquisition gives rise to $2.7 million of goodwill.
Prior year acquisitionDuring the year $0.4 million cash was received as a final cash wash up in relation to the 2014 acquisition of 7 Carl’s Jr. stores from Forsgren NZ Ltd. This amount had previously been held in escrow but final settlement was reached in the current year and the cash was released to the Group.
27. COVID-19On 30 January 2020, the spread of COVID-19 was declared a public health emergency by the World Health Organisation. Following this, on 25 March 2020, the New Zealand Government raised its Alert level to 4 which entailed a full lockdown of non-essential services. During Alert level 4, the Group’s operations in New Zealand were deemed to be a non-essential service, and as a result, all stores were closed. On 28 April stores in New Zealand were re-opened during Alert level 3 for drive through and delivery. In Australia and the USA, there were closures of the dine-in business and a number of in-line and mall stores during the month of April. The closures of these stores and the restrictions to dine-in options has continued for most of the reporting period.
An assessment of the impact of COVID-19 on the Group consolidated financial statements is set out below, based on information available at the time of preparing these consolidated financial statements:
Government grants – New Zealand: The Group has claimed $22.0 million under the New Zealand Wage Subsidy Scheme for the 12 weeks beginning 26 March. This has been recognised and disclosed separately in the consolidated statement of comprehensive income. For further information about the New Zealand Government grant claimed see note 2.
Paycheck Protection Program (PPP) loan: Included within the Group’s loan balance is $11.3 million ($US8.1 million) relating to a PPP loan received by the Hawaii division as part of the USA Government response to COVID-19. An application for this loan to be forgiven has been filed with the USA Federal Government Small Business Association (SBA). The Group believes the companies within the Hawaii division met the criteria to qualify for the loan at the date of the application and that all requirements have been met to qualify for full forgiveness of the loan by the SBA. The eligibility and forgiveness is currently under audit by the SBA, which may conclude the Hawaii division is not deemed eligible and the loan may not be forgiven. If this is the outcome of the audit the companies would be required to start making repayments towards the PPP loan as well as 1% interest on that loan from the period it was received until the date it is repaid. A decision from the SBA is expected in the first quarter of 2021. The portion of the loan due within one year, if forgiveness is not granted on this date, has been included as a current liability and the remainder of the loan is classified as non-current. The loan expires in April 2022. If forgiveness of the loan is approved by the SBA it will be recognised in the consolidated statement of comprehensive income, until that time it is held as a financial liability disclosed as a loan on the statement of financial position.
Reclassification of the PPP loan as previously disclosed in the unaudited consolidated financial statements for the six months ended 30 June 2020: In the unaudited consolidated financial statements for the six months ended 30 June 2020, the PPP loan was classified as a financial liability and disclosed as deferred income. In light of updated guidance from the SBA and US Department of the Treasury, the Group is unable to assess that forgiveness of the loan is reasonably assured in advance of confirmation of forgiveness by the SBA. The loan no longer meets the criteria to be classified as a government grant. Accordingly, the loan has been classified as a financial liability and disclosed as a loan in the 31 December 2020 consolidated financial statements. This reclassification will be disclosed in the unaudited consolidated financial statements of the Group for the six months ending 30 June 2021.
Property, plant and equipment: Property, plant and equipment are stated at historical cost less depreciation and impairment. Following recovery of operations since the April period, COVID-19 and the resulting economic impacts, as assessed at this reporting period, is not an external indicator of impairment. The Group has therefore concluded that no impairment is required due to the impact of COVID-19.
Right-of-use assets and lease liabilities: The Group has engaged with landlords for rent relief as a result of the lock down in New Zealand and the reduced trading in the other divisions. To date, $1.3 million in rent relief has been included as negative variable rental payments in the consolidated statement of comprehensive income.
Goodwill: Following recovery of operations since the April period, COVID-19 and the resulting economic impacts, as assessed at this reporting period, is not an external indicator of impairment. Discount rates have also reduced as a result of decreases in market interest rates. The recoverable amount has increased from the calculation performed at 31 December 2019. For this reporting period, any reasonably possible change in the key assumptions used in the calculations would not cause the carrying amount to exceed its recoverable amount. The key assumptions applied at 31 December 2020 include any long term effects brought about by COVID-19. Refer note 15 for further details.
No other significant measurement impacts were noted. Management are aware that there is a level of uncertainty regarding the future impact of COVID-19, however no impact on the going concern status of the Group has been identified as a result of this.

79Annual Report 31 December 202078Restaurant Brands New Zealand Limited
Notes to and forming part of the financial statements (continued)for the year ended 31 December 2020
28. Deed of Cross GuaranteePursuant to the Australian Securities and Investment Commission (ASIC) Class Order 98/1418, the wholly owned subsidiary, QSR Pty Limited (QSR), is relieved from the Corporations Act 2001 requirement for the preparation, audit and lodgement of financial reports.
It is a condition of that class order that Restaurant Brands New Zealand Limited (RBNZ) and QSR enter into a Deed of Cross Guarantee (Deed). On 9 February 2017 a Deed was executed between RBNZ, QSR, Restaurant Brands Australia Pty Limited and Restaurant Brands Australia Holdings Pty Limited under which each company guarantees the debts of the others.
Set out below is the consolidated information for the year ended 31 December 2020 of the closed group consisting of RBNZ, QSR, Restaurant Brands Australia Holdings Pty Limited and Restaurant Brands Australia Pty Limited.
$NZ000’s 31 Dec 2020 31 Dec 2019
Financial information in relation to:
(i) Statement of profit and loss and other comprehensive income Operating revenue 214,923 169,105
Earnings before interest and taxation (EBIT) 8,576 7,410
Financing expenses (9,863) (7,570)
Profit before taxation (1,287) (160)
Taxation expense (1,721) (415)
Profit after taxation (3,008) (575)
Items that may be reclassified subsequently to the statement of comprehensive income:Exchange differences on translating foreign operations 577 (217)
Derivative hedge reserve (31) (725)
Taxation expense relating to components of other comprehensive income 10 217
Other comprehensive income net of tax 556 (725)
Total comprehensive income (2,452) (1,300)
(ii) Summary of movements in retained earningsRetained earnings at the beginning of the period 122,129 129,241
NZ IFRS opening balance adjustment – (5,812)
Total comprehensive income (2,452) (1,300)
Retained earnings at the end of the year 119,677 122,129
$NZ000’s 31 Dec 2020 31 Dec 2019
(iii) Statement of financial positionNon-current assetsProperty, plant and equipment 67,930 54,884
Right of use assets 126,642 111,226
Intangible assets 100,587 97,291
Deferred tax asset 9,084 9,199
Investment in subsidiaries 239,353 231,790
Total non-current assets 543,596 504,390
Current assetsInventories 1,244 1,082
Trade and other receivables 2,473 2,666
Income tax receivable 3,355 1,119
Amounts receivable from subsidiaries 16,019 16,181
Cash and cash equivalents 9,150 23,068
Total current assets 32,241 44,116
Total assets 575,837 548,506
Equity attributable to shareholdersShare capital 154,565 154,565
Reserves (4,915) (5,472)
Retained earnings (29,973) (26,964)
Total equity attributable to shareholders 119,677 122,129
Non-current liabilitiesProvisions 1,671 1,540
Lease liabilities 133,958 114,886
Loans 71,151 –
Derivative financial instruments 1,876 1,842
Total non-current liabilities 208,656 118,268
Current liabilitiesTrade and other payables 20,596 17,120
Provisions 1,054 1,889 Loans – 97,522
Lease liabilities 7,946 7,920
Amounts payable to subsidiaries 217,908 183,658
Total current liabilities 247,504 308,109
Total liabilities 456,160 426,377
Total equity and liabilities 575,837 548,506

81Annual Report 31 December 202080Restaurant Brands New Zealand Limited
Independent auditor’s reportTo the Shareholders of Restaurant Brands New Zealand Limited
Our opinion
In our opinion, the accompanying financial statements of Restaurant Brands New Zealand Limited (the Company), including its subsidiaries (the Group), present fairly, in all material respects, the financial position of the Group as at 31 December 2020, its financial performance and its cash flows for the year then ended in accordance with New Zealand Equivalents to International Financial Reporting Standards (NZ IFRS) and International Financial Reporting Standards (IFRS).
What we have auditedThe Group’s financial statements comprise:
– the consolidated statement of financial position as at 31 December 2020;
– the consolidated statement of comprehensive income for the year then ended;
– the consolidated statement of changes in equity for the year then ended;
– the consolidated statement of cash flows for the year then ended; and the notes to and forming part of the financial statements, which include significant accounting policies and other explanatory information.
Basis for opinion
We conducted our audit in accordance with International Standards on Auditing (New Zealand) (ISAs (NZ)) and International Standards on Auditing (ISAs). Our responsibilities under those standards are further described in the Auditor’s responsibilities for the audit of the financial statements section of our report.
We believe that the audit evidence we have obtained is sufficient and appropriate to provide a basis for our opinion.
IndependenceWe are independent of the Group in accordance with Professional and Ethical Standard 1 International Code of Ethics for Assurance Practitioners (including International Independence Standards) (New Zealand) (PES 1) issued by the New Zealand Auditing and Assurance Standards Board and the International Code of Ethics for Professional Accountants (including International Independence Standards) issued by the International Ethics Standards Board for Accountants (IESBA Code), and we have fulfilled our other ethical responsibilities in accordance with these requirements.
Our firm carries out other services for the Group in the areas of specified procedures on landlord certificates and review of Yum! Advertising Co-operative report. The provision of these other services has not impaired our independence as auditor of the Group.
Key audit matters
Key audit matters are those matters that, in our professional judgement, were of most significance in our audit of the financial statements of the current year. These matters were addressed in the context of our audit of the financial statements as a whole, and in forming our opinion thereon, and we do not provide a separate opinion on these matters.
Description of the key audit matter How our audit addressed the key audit matter
Accounting for the California acquisition
The Group acquired the assets of Great American Chicken Corp, Inc. and Great American Chicken LLC on 2 September 2020 as disclosed in note 26 for $119.2 million.
Our audit focused on this area because the acquisition has financial significance to the Group. It is a large transaction with significant judgements and assumptions involved in identifying and determining fair value of the acquired assets and liabilities, particularly the identified intangible assets.
Management, with the assistance of their independent valuation experts, have estimated acquisition fair values for the following material assets and liabilities:
– Franchise rights of $58.5 million
– Property, plant and equipment of $33.7 million
– Right of use lease asset of $158.1 million and corresponding lease liabilities of $157.0 million. This includes management’s fair value assessment of favourable and unfavourable leases
– Goodwill of $26.5 million.
Our audit focused on the significant management estimates and judgments used in establishing the fair values of acquired assets and liabilities. Our procedures included:
– Obtaining an understanding of the acquisition, including the key terms and conditions, assets and liabilities acquired, by reading relevant agreements and documents;
– Assessing and agreeing that the assets acquired and liabilities assumed constitute a business and not an asset acquisition;
– Reviewing relevant information such as vendor financial statements, management’s experts’ valuation reports, minutes and significant contracts to assess the completeness of the acquired assets and liabilities. We did not identify any contingent assets or liabilities;
– Gaining an understanding of the valuation approach and methodology undertaken by management and management’s experts to identify separately identifiable intangible assets and fair value the assets and liabilities acquired;
– Considering whether the recognition and measurement of acquired assets (excluding separately identifiable intangible assets noted above) and liabilities was consistent with the requirements of the accounting standards;
– Assessing tax treatment of the acquisition costs and tax implications of the acquisition with the assistance of our PwC tax specialists;
– Testing the completeness, accuracy and valuation of the recognition of right of use assets and lease liabilities for the acquired leases, including assessing the appropriateness of management’s incremental borrowing rates with the assistance of our internal valuation experts;
– Testing the completeness, accuracy, relevance and mathematical accuracy of the source data used within the valuations;
– Engaging our auditor’s valuation experts to:
a) assess the valuation approach and methodology undertaken by management in relation to franchise rights, property, plant and equipment and favourable and unfavourable leases;
b) evaluate management’s assumptions regarding the above valuations;
– Considering the independence and competence of management’s valuation experts; and
– Considering the sufficiency of disclosures in the financial statements.
As a result of our procedures we have no matters to report.

83Annual Report 31 December 202082Restaurant Brands New Zealand Limited
Independent auditor’s report (continued)
Description of the key audit matter (continued) How our audit addressed the key audit matter (continued)
Goodwill impairment tests for Pizza Hut New Zealand and KFC and Taco Bell California
In addressing the estimation and judgements in relation to future performance of the Pizza Hut New Zealand and KFC and Taco Bell California CGUs our audit procedures included:
– Gaining an understanding of the business process applied by management in preparing the impairment assessment;
– Testing the mathematical accuracy of the model used to determine the VIU of the CGU;
– Reviewing historical years’ actual store sales and profitability against the original budgeted performance to determine the reliability of the budgeting process and considering the impact on forecast performance;
– Agreeing forecast future performance included in the impairment assessments to three year budgets approved by the Board of Directors;
– Challenging key assumptions used in the VIU model in relation to sales growth and EBITDA margins, terminal year sales and EBITDA growth, discount rate and, for Pizza Hut New Zealand, challenging the assumption around improved results due to the store sales programme, and assessing whether these are reasonable by understanding strategic and operational initiatives underway, along with reviewing monthly performance trends to assess whether profitability initiatives have been successful to date;
– Evaluating whether corporate costs had been allocated appropriately and included in the cash flows for each CGU;
– With the assistance of our auditor’s valuation expert, assessing the appropriateness of the terminal growth and discount rates as well as considering industry trends and external market forecasts for the industry;
– Testing the calculation of the carrying amounts of the CGU assets;
– Performing a sensitivity analysis over key assumptions to determine whether reasonably possible changes would result in impairment of goodwill; and
– Reviewing the financial statements to ensure appropriate identification and disclosure of key assumptions.
As disclosed in Note 15, the Group has recognised goodwill of $7.8 million relating to Pizza Hut New Zealand and $24.9 million relating to the acquisition of KFC and Taco Bell California.
Management performed an annual impairment assessment using discounted cash flow value in use (VIU) models to determine whether the carrying value of assets held by each of these cash generating units (CGUs) are recoverable.
Our audit focussed on this area as it involves estimation and judgement about future business performance which includes certain key assumptions such as sales growth, EBITDA margin, terminal year sales and EBITDA growth, the discount rate and, for Pizza Hut New Zealand, improved results due to the store sales programme.
For each of the Pizza Hut New Zealand and the KFC and Taco Bell California CGUs, the recoverable amount based on the value in use was higher than the carrying value of the CGU and as a result, no impairment charge was recognised.
For both Pizza Hut New Zealand and KFC and Taco Bell California any reasonably possible change in the key assumptions used in the calculations would not cause the carrying amount to exceed its recoverable amount.
Materiality
Group scoping
Key auditmatters
Our audit approach
OverviewOverall group materiality: $2.2 million, which represents approximately 5% of profit before tax.
We chose profit before tax as the benchmark because, in our view, it is the benchmark against which the performance of the Group is most commonly measured by users and is a generally accepted benchmark.
Following our assessment of the risk of material misstatement, we:
– Performed full scope audits for all the Group’s principal business units in New Zealand, Australia, Hawaii and California based on their financial significance;
– Performed specified audit procedures and analytical review procedures over three of the remaining entities.
As reported above, we have two key audit matters, being:
– Accounting for the California acquisition
– Goodwill impairment tests for Pizza Hut New Zealand and KFC and Taco Bell California
As part of designing our audit, we determined materiality and assessed the risks of material misstatement in the financial statements. In particular, we considered where management made subjective judgements; for example, in respect of significant accounting estimates that involved making assumptions and considering future events that are inherently uncertain. As in all of our audits, we also addressed the risk of management override of internal controls, including among other matters, consideration of whether there was evidence of bias that represented a risk of material misstatement due to fraud.
MaterialityThe scope of our audit was influenced by our application of materiality. An audit is designed to obtain reasonable assurance about whether the financial statements are free from material misstatement. Misstatements may arise due to fraud or error. They are considered material if, individually or in aggregate, they could reasonably be expected to influence the economic decisions of users taken on the basis of the financial statements.
Based on our professional judgement, we determined certain quantitative thresholds for materiality, including the overall Group materiality for the financial statements as a whole as set out above. These, together with qualitative considerations, helped us to determine the scope of our audit, the nature, timing and extent of our audit procedures and to evaluate the effect of misstatements, both individually and in aggregate, on the financial statements as a whole.
How we tailored our group audit scopeWe tailored the scope of our audit in order to perform sufficient work to enable us to provide an opinion on the financial statements as a whole, taking into account the structure of the Group, the accounting processes and controls, and the industry in which the Group operates.
The materiality levels applied in the full scope audits of the principal business units were calculated by reference to a portion of Group materiality appropriate to the relative scale of the business concerned.
Other information
The Directors are responsible for the other information. The other information comprises the information included in the Annual report (but does not include the financial statements and our auditor’s report thereon). The other information we obtained prior to the date of this auditor’s report comprised the Historical Summary, Consolidated Income Statement, Non-GAAP Financial Measures and the Directors’ statement. The remaining other information is expected to be made available to us after that date.
Our opinion on the financial statements does not cover the other information and we do not and will not express any form of audit opinion or assurance conclusion thereon.
In connection with our audit of the financial statements, our responsibility is to read the other information and, in doing so, consider whether the other information is materially inconsistent with the financial statements or our knowledge obtained in the audit, or otherwise appears to be materially misstated.
If, based on the work we have performed on the other information that we obtained prior to the date of this auditor’s report, we conclude that there is a material misstatement of this other information, we are required to report that fact. We have nothing to report in this regard.
When we read the other information not yet received, if we conclude that there is a material misstatement therein, we are required to communicate the matter to the Directors and use our professional judgement to determine the appropriate action to take.

84Restaurant Brands New Zealand Limited
85Annual Report 31 December 2020
Other InformationContents Page
Shareholder information 86
Statutory information 88
Statement of corporate governance 91
Corporate directory 100
Financial calendar 100
Responsibilities of the Directors for the financial statements
The Directors are responsible, on behalf of the Company, for the preparation and fair presentation of the financial statements in accordance with NZ IFRS and IFRS, and for such internal control as the Directors determine is necessary to enable the preparation of financial statements that are free from material misstatement, whether due to fraud or error.
In preparing the financial statements, the Directors are responsible for assessing the Group’s ability to continue as a going concern, disclosing, as applicable, matters related to going concern and using the going concern basis of accounting unless the Directors either intend to liquidate the Group or to cease operations, or have no realistic alternative but to do so.
Auditor’s responsibilities for the audit of the financial statements
Our objectives are to obtain reasonable assurance about whether the financial statements, as a whole, are free from material misstatement, whether due to fraud or error, and to issue an auditor’s report that includes our opinion. Reasonable assurance is a high level of assurance, but is not a guarantee that an audit conducted in accordance with ISAs (NZ) and ISAs will always detect a material misstatement when it exists. Misstatements can arise from fraud or error and are considered material if, individually or in the aggregate, they could reasonably be expected to influence the economic decisions of users taken on the basis of these financial statements.
A further description of our responsibilities for the audit of the financial statements is located at the External Reporting Board’s website at:
https://www.xrb.govt.nz/assurance-standards/auditors-responsibilities/audit-report-1/
This description forms part of our auditor’s report.
Who we report to
This report is made solely to the Company’s Shareholders, as a body. Our audit work has been undertaken so that we might state those matters which we are required to state to them in an auditor’s report and for no other purpose. To the fullest extent permitted by law, we do not accept or assume responsibility to anyone other than the Company and the Company’s Shareholders, as a body, for our audit work, for this report or for the opinions we have formed.
The engagement partner on the audit resulting in this independent auditor’s report is Philippa (Pip) Cameron.
For and on behalf of:
Chartered Accountants Auckland
25 February 2021
Independent auditor’s report (continued)

87Annual Report 31 December 202086Restaurant Brands New Zealand Limited
New Zealand Central Security Depository Limited (NZCSD) is a depository system which allows electronic trading of securities to its members. As at 23 February 2021, the NZCSD holdings in Restaurant Brands were:
Number of ordinary shares
Percentage of ordinary shares
HSBC Nominees (New Zealand) Limited - NZCSD1 97,128,307 77.85%
Citibank Nominees (New Zealand) Limited - NZCSD 4,094,775 3.28%
JPMorgan Chase Bank NA NZ Branch-Segregated Clients Acct - NZCSD 3,130,959 2.51%
National Nominees Limited - NZCSD 2,697,920 2.16%
Accident Compensation Corporation - NZCSD 972,438 0.78%
HSBC Nominees (New Zealand) Limited A/C State Street - NZCSD 961,087 0.77%
BNP Paribas Nominees (NZ) Limited - NZCSD 507,330 0.40%
BNP Paribas Nominees (NZ) Limited - NZCSD 464,153 0.37%
BNP Paribas Nominees (NZ) Limited - NZCSD 356,228 0.29%
Public Trust <NZCSD> 264,247 0.21%
ANZ Custodial Services New Zealand Limited - NZCSD 81,878 0.07%
Queen Street Nominees ACF Hobson Wealth - NZCSD 18,957 0.02%
Public Trust Class 10 Nominees Limited - NZCSD 9,467 0.01%
HSBC Nominees A/C NZ Superannuation Fund Nominees Limited - NZCSD 1,305 0.00%
Queen Street Nominees ACF Koura Wealth Ltd - NZCSD 801 0.00%
110,689,852 88.72%
1 Included in HSBC Nominees (New Zealand) Limited is 93,568,919 shares owned by Global Valar, S.L.
4. Substantial product holdersThe following person had given notices as at 27 March 2019, in accordance with subpart 5 of part 5 of the New Zealand Finance Market Conduct Act 2013 that they were substantial product holders in the Company and held a relevant interest in the number of ordinary shares shown below.
Date of notice
Number of ordinary shares
Percentage of voting
securities
Global Valar, S.L. 27 March 2019 93,568,892 75.00%
5. Shares on issueAs at 31 December 2020, the total number of ordinary shares of the company was 124,758,523.
6. Directors’ security holdings As at 31 December 2020 no Directors held individual shareholdings in the Group.
7. NZX waiversRestaurant Brands New Zealand Limited relied on the Class Waiver from Rule 3.5.1 of the NZX Listing Rules granted by NZX on 3 April 2020 to release its half year results outside the 60 day reporting requirement. No other waivers have been granted by the NZX during the financial year ended 31 December 2020.
Shareholder informationas at 23 February 2021 (unless otherwise stated)
1. Stock exchange listingsThe Company’s ordinary shares are dual listed on the main board equity securities markets operated by the NZX and ASX.
2. Distribution of security holders and security holdings
Size of Holding Number of security holders Number of securities
1 to 999 3,503 64.54% 1,156,657 0.93%
1,000 to 4,999 1,580 29.11% 3,112,279 2.49%
5,000 to 9,999 194 3.57% 1,281,913 1.03%
10,000 to 49,999 127 2.34% 2,348,727 1.88%
50,000 to 99,999 12 0.22% 752,846 0.60%
100,000 to 499,999 8 0.15% 1,953,380 1.57%
500,000+ 4 0.07% 114,152,721 91.50%
5,428 100.00% 124,758,523 100.00%
Geographic distribution
New Zealand 5,216 96.09% 124,380,789 99.70%
Australia 121 2.23% 175,483 0.14%
Rest of World 91 1.68% 202,251 0.16%
5,428 100.00% 124,758,523 100.00%
3. 20 largest registered holders of quoted equity securities Number of
ordinary sharesPercentage of
ordinary shares
New Zealand Central Securities Depository Limited 110,689,852 88.72%
Hobson Wealth Custodians Limited <Resident cash account> 2,004,898 1.61%
Custodial Services Limited <A/C 4> 882,621 0.71%
New Zealand Depository Nominee Limited<A/C 1 Cash account> 575,350 0.46%
Custodial Services Limited <A/C 3> 398,711 0.32%
Custodial Services Limited <A/C 2> 378,570 0.30%
FNZ Custodians Limited 327,436 0.26%
Custodial Services Limited <A/C 18> 218,103 0.17%
Custodial Services Limited <A/C 1> 191,765 0.15%
Custodial Services Limited <A/C 16> 169,749 0.14%
JA Hong Koo & Pyung Keum Koo 162,977 0.13%
Russel Ernest George Creedy 106,069 0.09%
Hobson Wealth Custodians Limited <Non resident cash account> 94,591 0.08%
Antony Richard Kerr & Philp Jack Bexley <The A R Kerr Family A/C> 80,000 0.06%
David Mitchell Odlin 67,041 0.05%
Investment Custodial Services Limited <A/C C> 62,702 0.05%
Margarete Freeland 61,084 0.05%
Barry John Eagle & Verena Turner <S G Turner Family A/C> 59,708 0.05%
Louis Keith Falkner 59,708 0.05%
Hobson Wealth Custodians Limited <Resident DRP account> 58,264 0.05%
116,649,199 93.50%

89Annual Report 31 December 202088Restaurant Brands New Zealand Limited
(c) General disclosure of interest
In accordance with section 140 (2) of the Companies Act 1993, Directors of the Company have made general disclosures of interest in writing to the Board of positions held in other named companies or parties as follows:
Name Position Party
J Parés Executive chairman AmRest Holdings SE
Director Grupo Finaccess S.A.P.I de C.V.
President Finaccess Capital USA
E Fullaondo Director AmRest Holdings SE
C Fernández Chairman Grupo Finaccess S.A.P.I de C.V.
Director AmRest Holdings SE
Director Inmobiliaria Colonial, S.A.
LM Álvarez Chairman Compitalia, S.A. de C.V.
Director Finaccess, S.A.P.I. de C.V.
Director Global Beverage Team
Director AmRest Holdings SA
H M Lim Director Asia New Zealand Foundation
Director Auckland Regional Amenities Funding Board
Director Middlemore Foundation
S Ward Director Sydney Airport Limited
Chairman SecureFuture Wiri Limited
Director TCF Commercial Finance New Zealand Limited
Chairman Advisory Council to the Financial Dispute Resolution Service
Deputy Chair National Provident Fund
Director Windoma Holdings Limited
Deputy chairman Life Flight Trust
Board member Wellington Free Ambulance
Trustee Wellington Free Ambulance Trust
Director Renaissance Holdings (NZ) Limited
Consultant Simpson Grierson
(d) Directors’ indemnity and insurance
The Company has insured all its Directors and the Directors of its subsidiaries against liabilities to other parties (except the Company or a related party of the Company) that may arise from their position as Directors. The insurance does not cover liabilities arising from criminal actions.
The Company has executed a deed of indemnity indemnifying all Directors to the extent permitted by section 162 of the Companies Act 1993.
Statutory informationfor the year ended 31 December 2020
1. DirectorshipsThe names of the Directors of the Company as at 31 December 2020 are set out on pages 38 and 39 of this annual report.
Grant Ellis and Russel Creedy are Directors of all subsidiary companies.
Arif Khan is a Director of Restaurant Brands Limited, RB Holdings Limited, RBDNZ Holdings Limited, Restaurant Brands Properties Limited, RBP Holdings Limited, Restaurant Brands Pizza Limited, RBN Holdings Limited and Restaurant Brands Nominees Limited.
Ashley Jones is a Director of Restaurant Brands Australia Pty Limited, Restaurant Brands Australia Holding Pty Limited and QSR Pty Limited.
Kevin Kurihara is a Director of Restaurant Brands US Holdings Limited, Pacific Island Restaurant Inc., TD Foods Group Inc., Taco Aloha Inc., Hawaii Pizza Hut Inc. Pizza Hut of Guam, Inc., Pizza Hut of Saipan, Inc. and TB Guam, Inc.
2. Directors and remuneration
NZ$000’sTotal
remuneration
J Parés 75
E Fullaondo 90
C Fernández –
LM Álvarez 75
H M Lim 90
S Ward 90
420
3. Entries recorded in the interests registerThe follow entries were recorded in the interest register of the Company and its subsidiaries during the year ended 31 December 2020.
(a) Share dealings of Directors
No shares were bought or sold by Directors during the year ended 31 December 2020.
(b) Loans to Directors
There were no loans to Directors during the year ended 31 December 2020.

91Annual Report 31 December 202090Restaurant Brands New Zealand Limited
OverviewRestaurant Brands New Zealand Limited (the Company) is listed on the NZX Main Board and as a Foreign Exempt Listing on the ASX (both under the ticker code “RBD”).
The Board is committed to having best-practice governance structures and principles and to following the guiding values of the Company: integrity, respect, continuous improvement and service. In this part of the annual report, we provide an overview of the Company’s corporate governance framework. It is structured to follow the recommendations set out in the NZX Corporate Governance Code 2017 (the “NZX Code”) and discloses how the Company is applying these recommendations.
The Board considers that as at 31 December 2020, the corporate governance practices it has adopted are in compliance with the NZX Code other than:
• Recommendation 2.8 (stating that a majority of the Board should be independent Directors); and
• Recommendation 2.9 (stating that an issuer should have an independent chair of the Board).
An explanation as to why these Recommendations have not been adopted is provided under Principle 2 on page 92.
Principle 1 – Code of ethical behaviour“Directors should set high standards of ethical behaviour, model this behaviour and hold management accountable for these standards being followed throughout the organisation.”
Group Ethical Conduct Policy
The Company’s Group Ethical Conduct Policy sets out the ethical standards the Board expects all Directors, officers, employees, contractors and agents to adhere to when they represent the Company and its subsidiaries. The policy covers a wide range of areas including: standards of professional behaviour, compliance with laws and policies, conflicts of interest, gifts and entertainment and proper use of Company assets and information. The policy requires the reporting of breaches (or suspected breaches) of the policy.
In addition, each geographic business unit of the Company (i.e. New Zealand, Australia and United States) (referred to as a Local Operating Division) is empowered to adopt specific policies and/or procedures that complement, enhance or supplement the general standards set out in the Group Ethical Conduct Policy if appropriate for that Local Operating Division.
The Group Ethical Conduct Policy is available on the Company’s website and is subject to biennial reviews.
Interests register
The Board maintains an interests register. In considering matters affecting the Company, Directors are required to disclose any actual or potential conflicts. Where a conflict or potential conflict has been disclosed, the Director takes no further part in receipt of information or participation in discussions on that matter.
Group Securities (Insider Trading) Policy
The Group Securities (Insider Trading) Policy details the Company’s securities trading policy and includes restrictions on and procedures for Directors and employees trading in the Company’s financial products. In particular, the policy:
• prohibits trading by an individual holding non-public material information about the Company;
• requires all Directors, officers, employees and contractors of the Company to obtain permission before trading can occur; and
• prohibits Directors, the Group CEO, Group CFO and direct reports to the Group CEO and Group CFO from trading outside of set 8 week trading windows that follow:
› the release of half and full year results; or
› the issuance of a “cleansing statement” under the Financial Markets Conduct Act 2013.
Statement of corporate governancefor the year ended 31 December 2020
4. Employees’ remunerationDuring the period the following number of employees or former employees received remuneration of at least $100,000:
Number of employees
Dec 2020 Dec 2019
$100,000 – $109,999 22 9$110,000 – $119,999 7 6$120,000 – $129,999 16 4$130,000 – $139,999 10 5$140,000 – $149,999 9 2$150,000 – $159,999 10 3$160,000 – $169,999 1 1$170,000 – $179,999 2 4$180,000 – $189,999 3 1$190,000 – $199,999 2 2$200,000 – $209,999 2 2$210,000 – $219,999 5 1$220,000 – $229,999 – 2$230,000 – $239,999 5 2$240,000 – $249,999 3 – $250,000 – $259,999 2 1$260,000 – $269,999 2 – $290,000 – $299,999 – 1$350,000 – $359,999 1 – $370,000 – $379,999 – 1$390,000 – $399,999 – 2$400,000 – $409,999 – 1$420,000 – $429,999 2 – $450,000 – $459,999 1 – $800,000 – $809,999 – 1$1,260,000 – $1,269,999 1 – $2,300,000 – $2,309,999 1 –
107 51
Note that the December 2019 period is for a 44 week period. The disclosure above therefore represents the amounts employees received during this 44 week period.
5. Subsidiary Company DirectorsNo employee of the Company appointed as a Director of the Company or its subsidiaries receives, or retains any remuneration or benefit, as a Director. The remuneration and other benefits of such employees, received as employees, are included in the relevant bandings for remuneration disclosure under note 4 above.
Statutory information (continued)for the year ended 31 December 2020

93Annual Report 31 December 202092Restaurant Brands New Zealand Limited
Statement of corporate governance (continued)for the year ended 31 December 2020
Nomination and appointment
The Board has adopted a Director Nomination and Appointment Procedure. This procedure is administered by the Remuneration and Nominations Committee and includes guidelines relating to Board composition, considerations for new Director appointments and the process by which potential Directors are nominated and assessed.
Written agreement
The Director Nomination and Appointment Procedure requires the terms of appointment for all new Directors to be set out in a formal letter of appointment and also stipulates that new Directors are to receive induction training regarding the Company’s values and culture, governance framework, the Group Ethical Conduct Policy, Board and Committee policies, processes and key issues, financial management and business operations.
Diversity
The Company and the Board are committed to promoting a diverse and inclusive workplace. This is outlined in the Group Diversity Policy which is available on the Company’s website. The Company endeavours to ensure diversity at all levels of the organisation to ensure a balance of skills and perspectives are available in the service of its shareholders and customers.
As at 31 December 2020, the gender balance of the Company’s Directors, officers and all employees is as follows:
Directors Officers* Employees
Dec 2020 Dec 2019 Dec 2020 Dec 2019 Dec 2020 Dec 2019
Female 1 17% 1 17% 3 33% 1 17% 6,175 51% 5,032 52%
Male 5 83% 5 83% 6 67% 5 83% 5,898 49% 4,567 48%
Total 6 100% 6 100% 9 100% 6 100% 12,073 100% 9,599 100%
* “Officers” is defined in the NZX Listing Rules as only including those members of management who report directly to the Board or report directly to a person who reports to the Board. As at 31 December 2020, the Group CEO is the only direct report to the Board and the Group CFO, CPO, CLCO, CMO and four Local Operating Division CEOs are the only direct reports to the Group CEO.
The Group Diversity Policy requires the Remuneration and Nominations Committee to develop and recommend to the Board a set of measurable goals for the Company to drive achievement of the objectives of the policy. The Board considers that the performance of the Company during the year ended 31 December 2020 in relation to most of the systemic elements of the Group Diversity Policy was satisfactory.
Board appraisal and training
The Board has adopted a performance appraisal programme by which it biennially monitors and assesses individual and Board performance. The most recent review covering the performance of the Board, the Board committees and individual Directors against the relevant charters, corporate governance policies and agreed goals and objectives was carried out with the assistance of an external facilitator.
The Company does not impose any specific training requirements on its Directors but does expect all Directors to carry out appropriate training to enable them to effectively perform their duties. New Directors complete an induction programme with company senior management.
Access to resources and advice
Directors may seek their own independent professional advice to assist with their responsibilities. During the 2020 financial year, no Director sought their own independent professional advice, but the Board sought external advice and/or assistance with respect to:
• potential structures for a senior executive long term incentive scheme; and
• the design and implementation of an enhanced Risk Management Framework.
Principle 2 – Board composition & performance“To ensure an effective Board, there should be a balance of independence, skills, knowledge, experience and perspectives.”
Responsibilities of the Board
The Board is responsible for the proper direction and control of the Company’s activities and is the ultimate decision-making body of the Company. The Board has adopted a formal Board Charter detailing its authority, responsibilities, membership and operation. The Board Charter is available for viewing on the Company’s website.
The key responsibilities of the Board under the Board Charter include setting strategic direction, approval of significant expenditures, policy determination, stewardship of the Company’s assets, identification of significant business risks, legal compliance and monitoring management performance.
Delegation
The Board has delegated responsibility for the day-to-day leadership and management of the Company to the Group Chief Executive Officer (Group CEO) who is required to do so in accordance with Board direction. The Group CEO’s performance is reviewed each year by the Board. The review includes a formal performance appraisal against measured objectives together with a qualitative review.
The Board has approved a schedule of delegated authorities affecting all aspects of the Company’s operation. This is reviewed from time to time as to appropriateness and levels of delegation.
Composition and focus
The Company’s constitution prescribes a minimum of three Directors and, as at 31 December 2020, the Board comprised six non-executive Directors (including the Chairman). As at the date of publication of this annual report, the Board comprises six non-executive Directors (including the Chairman).
Profiles of the current Directors, together with a summary of skill sets, included in the ‘Board of Directors’ section of this annual report and on the Company’s website.
As at 31 December 2020, Emilio Fullaondo, Huei Min (Lyn) Lim and Stephen Ward were considered by the Board to be independent under the NZX Listing Rules as they are not executives of the Company and do not have any direct or indirect interests or relationships that could reasonably influence, in a material way, their decisions in relation to the Company. José Parés, Carlos Fernández and Luis Miguel Álvarez were considered to not be independent as they represent a significant shareholding. Per the Company’s Constitution, in the case of an equality of votes when a resolution of the Board is tabled, the chair of the Board has a casting vote.
The Board does not have a policy on a minimum number of independent Directors.
The Board elected to not adopt Recommendation 2.8 (stating that a majority of the Board should be independent Directors) and Recommendation 2.9 (stating that an issuer should have an independent chair of the Board) of the NZX Corporate Governance Code during 2020 on the basis that it is appropriate for a relatively new shareholder holding 75% of the Company’s shares (i.e. Finaccess) to be represented by a majority of the Board. With the Board comprising of six Directors during 2020, such majority representation is achieved by the chair of the Board being a non-independent Director with the ability to exercise a casting vote. The chairs of all sub-committees of the Board (being the Audit & Risk, Health & Safety and Remuneration & Nominations Committees) are independent Directors.
In February 2021, the Board announced that a fourth independent Director would join the Board from 1 April 2021 and so the composition of the Board will comply with Recommendation 2.8 from that date.
The roles of Chairman and Group Chief Executive Officer are exercised by separate persons. In addition to committee responsibilities (below), individual Board members work directly with management in major initiatives such as acquisitions and asset rationalisations.
Shareholding
There is no prescribed minimum shareholding for Directors, refer to the ‘Shareholder Information’ section of this annual report for more detail.
Directors may purchase shares upon providing proper notice of their intention to do so and in compliance with the operation of the Company’s Group Securities (Insider Trading) Policy (see above).

95Annual Report 31 December 202094Restaurant Brands New Zealand Limited
Statement of corporate governance (continued)for the year ended 31 December 2020
Health and Safety Committee
As at 31 December 2019, the members of the Health and Safety Committee were Huei Min (Lyn) Lim (Chair), Stephen Ward and Emilio Fullaondo. This committee is constituted to assist the Board to provide leadership and policy in discharging its health and safety governance duties. In particular, the Health and Safety Committee is responsible for administering the Company’s Health and Safety Framework, monitoring and assessing the Company’s Health and Safety performance and developing Health and Safety targets/objectives for the business.
The Terms of Reference for the Health and Safety Committee are set out in the Board Health and Safety Charter which is available on the Company’s website.
Other sub-committees may be constituted and meet for specific ad-hoc purposes as required.
Takeover protocols
The Board has adopted a set of Takeover Procedures and Protocols to be followed if there is a takeover offer for the Company. The Takeover Procedures and Protocols provides for the formation of a committee of independent Directors to consider and manage a takeover offer in accordance with the Takeovers Code.
Principle 4 – Reporting and disclosure“The Board should demand integrity in financial and non-financial reporting and in the timeliness and balance of corporate disclosures.”
Continuous Disclosure Policy
The Board and Company are committed to promoting shareholder and market confidence through open, timely and accurate communication in compliance with the Company’s continuous disclosure obligations under the NZX and ASX Listing Rules and the Financial Markets Conduct Act 2013. The Company’s Group Continuous Disclosure Policy contains processes and procedures for ensuring that there is full and timely disclosure of market sensitive information to all shareholders and other market participants and also outlines the responsibilities in relation to the identification, reporting, review and disclosure of material information. The Board has appointed a Disclosure Officer to administer this policy.
Charters and policies
Copies of the Company’s key governance documents (including the Board Charter, Committee Charters, Group Diversity Policy, Group Continuous Disclosure Policy, Group Director and Senior Executive Remuneration Policy, Group Code of Ethical Conduct and Group Securities (Insider Trading) Policy are available in the “Governance” section of the Company’s website.
Financial reporting
The Board is committed to ensuring integrity and timeliness in its financial reporting and providing information to shareholders and the wider market which reflects a considered view on the present and future prospects of the Company.
The Audit and Risk Committee oversees the quality and integrity of the Company’s external financial reporting including the accuracy, completeness, balance and timeliness of financial statements. It reviews the Company’s full and half year financial statements and makes recommendations to the Board concerning the application of accounting policies and practice, areas of judgement, compliance with accounting standards, stock exchange and legal requirements as well as the results of the external audit.
While the Audit and Risk Committee ultimately oversees the quality of the Company’s external financial reporting, the Company’s management also provides confirmation in writing to the Board that the Company’s external financial reports represent a true and fair representation of the financial performance of the Company.
Non-financial reporting
The Company’s Environmental, Social and Governance Report is set out earlier in this annual report. The Company continues to develop its environmental, social and governance reporting framework.
Re-election
Pursuant to the requirements of the NZX Listing Rules, Directors of the Company must not hold office (without re-election) past the third Annual Shareholders’ Meeting following their appointment or three years (whichever is later) but may seek re-election at that meeting.
Meetings
The Board normally meets eight to ten times a year and, in addition to reviewing normal operations of the Company, approves a strategic plan and annual budget each year.
Board meetings are usually scheduled annually in advance, although additional meetings may be called at shorter notice.
Directors receive formal proposals, management reports and accounts in advance of all meetings.
The Group CEO and Group CFO are regularly invited to attend Board meetings and participate in Board discussion. Directors also meet with other senior executives on items of particular interest.
Board and committee meeting attendance for the year ended 31 December 2020 was as follows:
Name
Board meetings
held
Board meetings attended
Audit and Risk
Committee meetings
held
Audit and Risk
Committee meetings attended
Health and Safety Committee
meetings held
Health and Safety Committee
meetings attended
Remuneration and Nominations
Committee meetings attended
Remuneration and Nominations
Committee meetings attended
L M Álvarez 19 19 4 1 3 n/a 2 2
J Parés 19 19 4 3 3 n/a 2 1
E Fullaondo 19 19 4 4 3 3 2 2
C Fernández 19 18 4 1 3 n/a 2 1
S Ward 19 19 4 4 3 3 2 2
H M Lim 19 19 4 4 3 3 2 2
Principle 3 – Board committees“The Board should use committees where this will enhance effectiveness in key areas, while retaining Board responsibility.”
From amongst its own members, the Board has appointed the following permanent committees:
Audit and Risk Committee
As at 31 December 2020, the members of the Audit and Risk Committee were Emilio Fullaondo (Chair), José Parés, Stephen Ward and Huei Min (Lyn) Lim. This committee is constituted to monitor the veracity of the financial data produced by the Company, ensure controls are in place to minimise the opportunities for fraud or for material error in the accounts and to oversee the operation of the Company’s Risk Management Framework (discussed in more detail in the “Risk Management Framework” section under Principle 6). A majority of the committee’s members must be independent Directors and executive Directors may not be members of the committee.
The Audit and Risk Committee meets two to four times a year. External auditors of the Company, senior management and executives performing internal audit management from within the Company attend by invitation. The external auditors also meet separately with the Audit and Risk Committee with no members of management present.
The Audit and Risk Committee has adopted a charter setting out the parameters of its relationship with internal and external audit functions. The charter (which is available on the Company’s website) requires, among other things, five yearly reviews of the external audit relationship and audit partner rotation.
Remuneration and Nominations Committee
As at 31 December 2020, the members of the Remuneration and Nominations Committee were Stephen Ward (Chair), Huei Min (Lyn) Lim, Emilio Fullaondo and Luis Miguel Álvarez. This committee is constituted to administer the Director Nomination and Appointment Procedure, approve appointments of senior executives of the Company (principally the Group CEO and those reporting directly to the Group CEO) and make recommendations to the Board in relation to terms of remuneration for non-executive Directors and senior executives. It also reviews any company-wide incentive and share option schemes as required and recommends remuneration packages for Directors to the shareholders.
The Remuneration and Nominations Committee has adopted a written charter which is available on the Company’s website.

97Annual Report 31 December 202096Restaurant Brands New Zealand Limited
Principle 6 – Risk management“Directors should have a sound understanding of the material risks faced by the issuer and how to manage them. The Board should regularly verify that the issuer has appropriate processes that identify and manage potential and material risks.”
Risk management framework
The Company has a Risk Management Framework for identifying, monitoring, managing and controlling the material risks faced by the business. While the Board is ultimately responsible for the effectiveness of the Company’s Risk Management Framework, the Risk and Audit Committee administers the Risk Management Framework and:
• receives and reviews regular risk reporting from management;
• provides recommendations to the Board in relation to:
› key/material risk identification and appetite levels;
› whether the Company’s processes for managing risks are sufficient; and
› incidents involving serious fraud or other material break-down/failing of the Company’s internal controls;
• periodically reviews:
› key/material risks that have been identified and the controls in place to manage them; and
› the Company’s business activities to identify likely sources of new risks; and
• confirms the robustness of the Risk Management Framework to the Board on an annual basis.
The Committee is required to review the Risk Management framework at least biennially and conducts regular deep dive assessments of each key/material risk to the Company’s business and the associated business controls management have put in place to manage/mitigate these risks.
In managing the Company’s business risks, the Board approves and monitors additional policies and processes in such areas as:
• Internal Audit – regular checks are conducted by operations and financial staff on all aspects of store operations.
• Treasury Management – exposure to interest rate and foreign exchange risks is managed in accordance with the Company’s treasury policy.
• Financial Performance – full sets of management accounts are presented to the Board at every meeting. Performance is measured against an annual budget with periodic forecast updates.
• Capital Expenditure – all capital expenditure is subject to relevant approval levels with significant items approved by the Board. The Board also monitors expenditure against approved projects and approves the capital plan.
Insurance
The Company has insurance policies in place covering most areas of risk to its assets and business. These include material damage and business interruption cover at all of its sites. Policies are reviewed and renewed annually with reputable insurers.
Health and safety
The Company’s Health and Safety Committee is responsible for reviewing and making recommendations to the Board in respect of the Company’s health and safety policies, procedures and performance. The Committee’s primary responsibility is to ensure that the systems used to identify and manage health and safety risks are fit for purpose and are being effectively implemented, reviewed and continuously improved. The Committee is also responsible for developing health and safety targets/objectives for the business.
Management and the Committee receive detailed reporting on lead and lag indicators of health and safety performance including health and safety incidents, injury rates by severity and mechanism, identified hazards and outputs from local, area and regional employee health and safety forum meetings. The Company has dedicated health and safety experts who investigate incidents, analyse hazard/incident trends to identify and mitigate potential health and safety risks and review, develop and monitor compliance with health and safety processes and procedures.
At an individual store level, comprehensive policies and procedures for carrying out tasks in a safe manner are in place and regularly reviewed to ensure they remain fit-for-purpose. Staff are trained in these policies and procedures as part of their induction. Registers are kept of potential hazards at each store and regular reviews/audits of compliance with health and safety processes and procedures are carried out by internal staff and external providers.
Reporting of lag indicators of Health and Safety performance is contained in the Environmental, Social and Governance Section of this annual report. It is expected that more comprehensive reporting on the Company’s health and safety performance will be provided in the future as the Company’s environmental, social and governance framework continues to develop.
Statement of corporate governance (continued)for the year ended 31 December 2020
Principle 5 – Remuneration“The remuneration of Directors and executives should be transparent, fair and reasonable.”
Board remuneration
The Company’s approach to the remuneration of Directors and senior executives is set out in the Company’s Director and Senior Executives Remuneration Policy. The Board’s Remuneration and Nominations Committee reviews Director and senior executive remuneration and makes recommendations to the Board after taking into account the requirements of the policy. The Remuneration and Nominations Committee’s membership and role are set out in more detail under Principle 3 above.
The current total pool of Director fees authorised at the Annual Shareholders’ Meeting on 21 June 2018 is $475,000 per annum.
No Directors currently take a portion of their remuneration under a performance-based equity compensation plan, although a number of Directors do hold shares in the Company. Directors do not receive additional remuneration or benefits in connection with any directorship they may hold of subsidiaries of the Company.
The terms of any retirement payments to Directors are prescribed in the Company’s constitution and require prior approval of shareholders at a general meeting. No retirement payments have been made to any Director.
The Company has insured all of its Directors and the Directors of its subsidiaries against liabilities to other parties (except the Company or a related party of the Company) that may arise from their position as Directors. The insurance does not cover liabilities arising from criminal actions.
The Company has executed a Deed of Indemnity, indemnifying all Directors to the extent permitted by section 162 of the Companies Act 1993.
Group Chief Executive Officer remuneration
The remuneration arrangements in place for the Group CEO consist of a base salary and a short term incentive scheme. Details of the Group CEO remuneration arrangements (including the amounts paid in 2019 and 2020 financial periods) are set out in note 19 to the 31 December 2020 financial statements in this annual report.

99Annual Report 31 December 202098Restaurant Brands New Zealand Limited
Statement of corporate governance (continued)for the year ended 31 December 2020
Principle 8 – Shareholder rights & relations“The Board should respect the rights of shareholders and foster constructive relationships with shareholders that encourage them to engage with the issuer.”
Shareholder communication
The Board places importance on effective shareholder communication. Half year and annual reports are published each year and posted on the Company’s website, together with quarterly sales releases, profiles of Directors and key members of management, key governance documents and copies of investor presentations. From time to time the Board may communicate with shareholders outside this regular reporting regime.
Shareholders are provided with the option of receiving communications from the Company electronically.
Consistent with best practice and of the Company’s continuous disclosure obligations under the NZX Listing Rules, external communications that may contain market sensitive data are released through NZX and ASX in the first instance. Further communication is encouraged with press releases through mainstream media. The Board formally reviews its proceedings at the conclusion of each meeting to determine whether there may be a requirement for a disclosure announcement.
Shareholder meetings
Shareholder attendance at annual meetings is encouraged and the Board allows extensive shareholder debate on all matters affecting the Company. The Company complies with its obligations under the Companies Act 1993 and the NZX Listing Rules in relation to obtaining shareholder approval for major decisions/actions that may change the nature of the company shareholders have invested in.
Notice of the Company’s Annual Shareholders’ Meeting will be available at least 20 working days prior to the date of the meeting.
In accordance with the requirements of Rule 6.1.1 of the NZX Listing Rules, voting at the Annual Shareholders’ Meeting will be carried out by way of a poll on the basis of one share, one vote.
Principle 7 – Auditors“The Board should ensure the quality and independence of the external audit process.”
External auditor
Oversight of the Company’s external audit arrangements is the responsibility of the Audit and Risk Committee. The Committee operates under the Audit and Risk Committee Charter which (among other things) requires the Committee to:
• recommend the appointment of the external auditor;
• set the remuneration and review the performance of the external auditor;
• ensure the relationship with the external auditor is reviewed every five years and that the audit partner is rotated after five years;
• set the scope and work plan of the annual audit and half year review (along with the external auditor and management);
• ensure that no unreasonable restrictions are placed on the external auditor by the Board or management;
• ensure that open lines of communication are maintained between the Board, internal audit, management and the external auditor; and
• ensure the independence of the external auditor by:
› reviewing the nature and scope of professional services outside of the external statutory audit role proposed to be provided by the external auditor and approving or declining their use in light of the requirement for external auditor independence;
› monitoring any approved services outside of the external statutory audit role provided by the external auditors to ensure that the nature and scope of such professional services does not change in a manner that could be perceived as impacting on the external auditor’s independence;
› reviewing the nature and scope of professional audit services proposed to be provided by firms other than the external auditor and approving or declining their use in light of the requirement for external auditor independence; and
› reviewing and approving or declining any proposed employment by the Company or its subsidiaries of any former audit partner or audit manager.
The Audit and Risk Committee receives an annual confirmation from the external auditor as to their independence from the Company. The external auditor regularly meets with the Committee (including meetings without management present) and attends the Company’s Annual Shareholders’ Meeting where the lead audit partner is available to answer questions from shareholders.
Internal audit
The Audit and Risk Committee is responsible for the integrity and effectiveness of the Company’s internal audit function. The Company has an internal audit team that performs assurance and compliance reviews across the Company’s operations as part of an annual programme of work agreed with the Audit and Risk Committee. While the internal audit function has historically focussed on loss-prevention and fraud, it also carries out reviews of the wider control environment within the Company.

101Annual Report 31 December 2020100Restaurant Brands New Zealand Limited
Directors José Parés (Chairman) Emilio Fullaondo Carlos Fernández Luis Miguel Álvarez Stephen Ward Huei Min (Lyn) Lim Malena Pato-Castel (from 1 April 2021)
Registered officeLevel 3 Building 7 Central Park 666 Great South Road Penrose Auckland 1051 New Zealand
Share registrarNew Zealand Computershare Investor Services Limited Level 2 159 Hurstmere Road Takapuna Private Bag 92 119 Auckland 1142 New Zealand T: 64 9 488 8700 E: [email protected]
Australia Computershare Investor Services Limited Yarra Falls 452 Johnston Street Abbotsford, VIC 3067 GPO Box 3329 Melbourne, VIC 3001 Australia T: 1 800 501 366 (within Australia) T: 61 3 9415 4083 F: 61 3 9473 2500 E: [email protected]
AuditorsPricewaterhouseCoopers
SolicitorsBell Gully Harmos Horton Lusk Meredith Connell Squire Patton Boggs Corrs Chambers Westgarth Cades Schutte
BankersWestpac Banking Corporation J.P. Morgan Rabobank Bank of China
Contact details Postal Address: P O Box 22 749 Otahuhu Auckland 1640 New Zealand Telephone: 64 9 525 8700 Fax: 64 9 525 8711 Email: [email protected]
Annual meeting27 May 2021
Financial year end31 December 2021
Annual profit announcementFebruary 2022
Financial calendar
Corporate directory

Restaurant Brands New Zealand Limited102
RESTAURANTBRANDS.CO.NZ