Embed Size (px)
Citation preview

Commissioning and O&M Applications of the Solmetric PV Analyzer
Paul Hernday
Senior Applications Engineer
cell 707-217-3094
January 10, 2013

Topics
• Introduction to I-V curves and the PV Analyzer
• Introducing free Version 2.0 PVA Software Upgrade
• Commissioning PV arrays
• Troubleshooting PV arrays
• Meg testing with the Megger® MIT430

What Is An I-V Curve? Those combinations of I,V at which the module can be loaded
• Load can be resistive, capacitive, or electronic
• Curve can be measured from either direction
Current
(I)
Cu
rre
nt
Voltage
(I, V)
Voltage
(V)
+
-
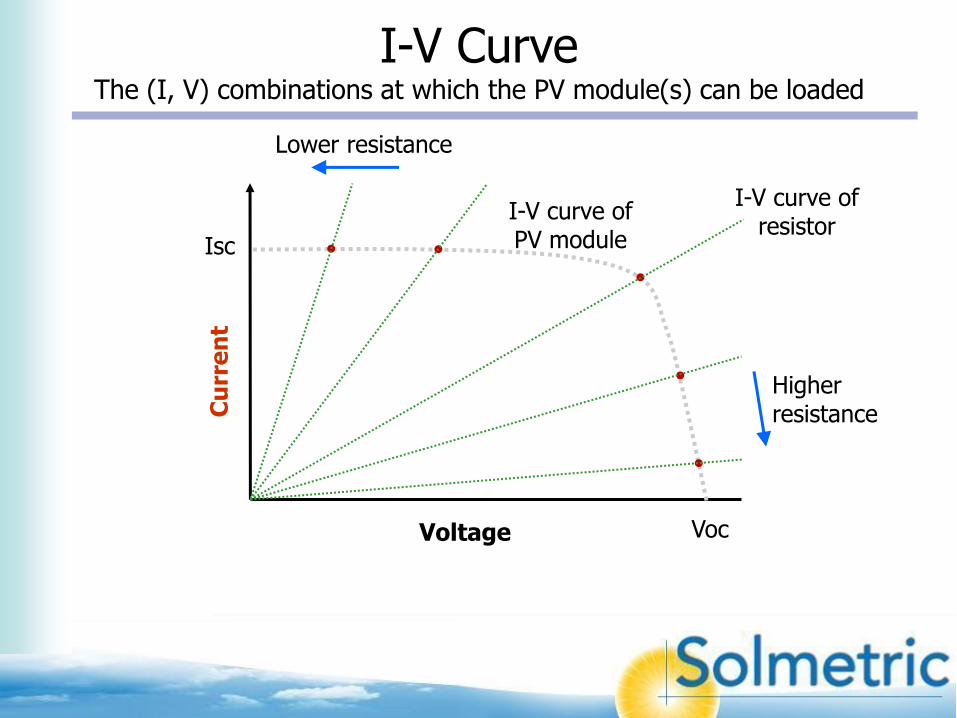
I-V Curve for Resistive Loads The (I, V) combinations at which the PV module(s) can be loaded
Cu
rre
nt
Voltage
Isc
Voc
I-V curve of PV module
I-V curve of resistor
Higher resistance
Lower resistance

How Are I-V Curves Measured? Concept
Current
(I) Voltage
(V)
Cu
rre
nt
Voltage
(I)
(V)
(I, V)
Adjust the
load
1
3 Plot the
point
Read I & V
2

The P-V Curve Calculated from the measured I-V curve
Cu
rre
nt
Voltage
Isc
Voc
I-V curve
Vmp
Imp
Po
we
r
P-V curve
Pmax

Max power point
I-V Curve Abnormalities
Any reduction of the knee of the curve
means reduced output power.
Cu
rre
nt
(A)
Voltage (V)
Isc
Voc
Increased
slope
Reduced
slope Mismatch losses
(incl. shading)
Normal I-V curve
Reduced
current
Reduced
voltage
Conventional Isc and Voc measurements do not reveal many of these effects

Solmetric PV Analyzer Users
EPC organizations
System Integrators
Consulting Engineers
Training Organizations Technical colleges
IBEW
Training Centers
O&M Companies
Electrical contractors
Module Manufacturers
Inverter Manufacturers

Array
Irradiance sensor
Module backside
temperature sensor
Your PC WUSB2
WUSB1
I-V Measurement
Unit
Built-in PV models
Irradiance & temperature
Module, tilt, orientation…
5 dots predict the shape of the curve
Wireless
How Performance Prediction Works
Data analysis and reporting are automated
Screen
shot
Wireless Measurement Network Built-in Analysis

• The five dots indicate the expected curve shape
• The dots appear whenever an advanced performance model (Sandia or 5-Parameter) is selected
• The middle red dot is the predicted max power point
• The yellow dot on the P-V curve marks the peak of that curve, and is not a prediction of the PV model.
Expected I-V Curve Shape determined by the advanced PV models
Dot 1 (Isc, 0)
Dot 2 (I, Voc/2)
Dot 3 (Imp, Vmp)
Dot 4 (I, [Vmp + Voc]/2)
Dot 5 (0, Voc)
1
5
3 2
4

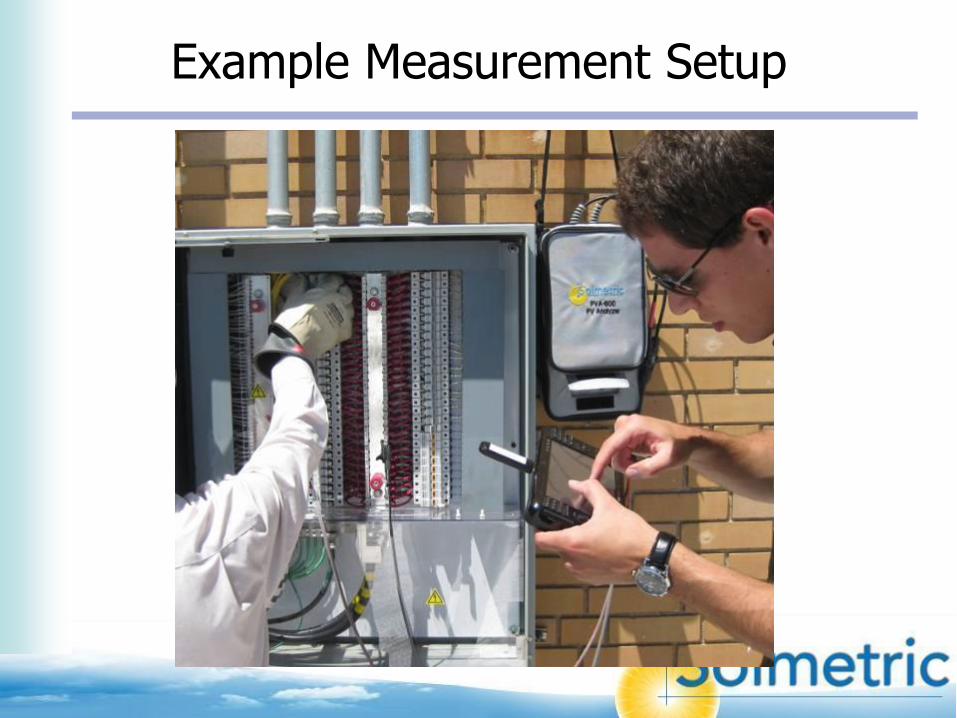
I-V Measurement Setup Example: Measuring strings at a combiner box
Attach the thermocouple well away from module edges,
using polyimide (Kapton) tape for best mechanical
properties at high temperatures.

Example Measurement Setup
Courtesy of Chevron Energy Solutions © 2011

Wireless Sensor Kit Irradiance & temperature sensors
Irradiance
transmitter
Receiver (USB)
Temperature
transmitter
K-type
thermocouple
Omega Part #
5SRTC-GG-K-
30-72
.

Deploying irradiance & temperature sensors
Guarantee that the irradiance sensor
is in the plane of the array by placing it
on a module (that’s not in the string
you are measuring) or mounting it to a
corner of a module.
Mount the thermocouple 2/3 of the way
between the corner and center of a
module. Use high-temperature tape (eg
1-3/4 inch Kapton dots**). Press TC into
contact with backside. ** MOCAP MCD-PE 1.75 poly dot
~$80/roll of 1000 dots

Summary of PV Analyzer benefits
•Single connection at combiner box
•Single measurement for each string
•Don’t need to bring inverter online
•Built-in PV models for instant performance check
•More effective troubleshooting
•Automated data analysis and reporting
•Most complete performance measurement possible
• Independent Pmax measurement for each string
•Teaches us to “think like a PV array”
Testing PV array performance faster and better
Next topic: Insulation resistance testing
Lower cost
Satisfied clients
Topics
• Brief introduction to I-V curves and the PV Analyzer
• Introducing free Version 2.0 PVA Software Upgrade
• Commissioning PV arrays
• Troubleshooting PV arrays
• Meg testing with the Megger® MIT430

Faster setup
-Project Wizard
-Web tool for azimuth, latitude, longitude
Large displays of Irradiance & temperature on every measurement screen
Array Navigator™ for touch-based data save and recall
Translates I-V curves to STC
5000 more module models, and automatic update of equipment databases
History tab shows tabular values for the last 20 measurements
Archiving of Meg Test data
-Saves manually entered meg test data to the new database
(Solmetric now offers the Megger MIT-430 Insulation Tester)
Report generation capability via the updated I-V Data Analysis Tool (optional
accessory for analyzing large quantities of test data)
Features of v2 PVA PC software

Array Navigator™
•Represents the PV system architecture
•Created by the Project Wizard
•Touch a string location to save or recall data
•Also contains information needed by the PV
model (eg wire gauge and lengths)
•Currently limited to sequential labeling
schemes (numbers or letters)
Array Navigator™

The Project File
• Contains array details, performance model, and measurement data
• Easy to share between offices
• Foundation for future advanced analysis and reporting capabilities
Version 2.X Software
(legacy)
(legacy)
Project file

Saving a measurement result with V2.0

v1.2.4440 v2.0.5644
5param: 4,991 8,722
Sandia: 517 554
Simple: 0 11,454
Unique modules: 11,821
Additions to the Module Database
Roughly 2,178 module models
exist with only the simple model
(11,454 - 8,722 - 554).

Live Software Demo • Demo uses saved data
• Screen images are also shown in the following slides
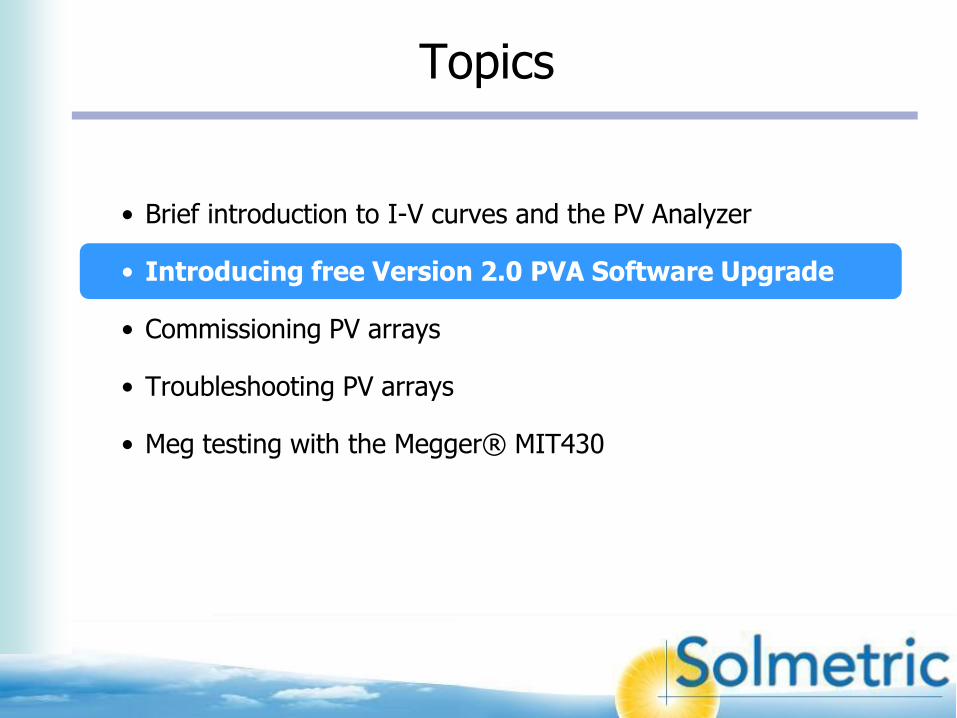
Traces tab

Project Wizard, Step 1 Notes & Info

Project Wizard, Step 2 Performance Model

Project Wizard, Step 3 Site Info
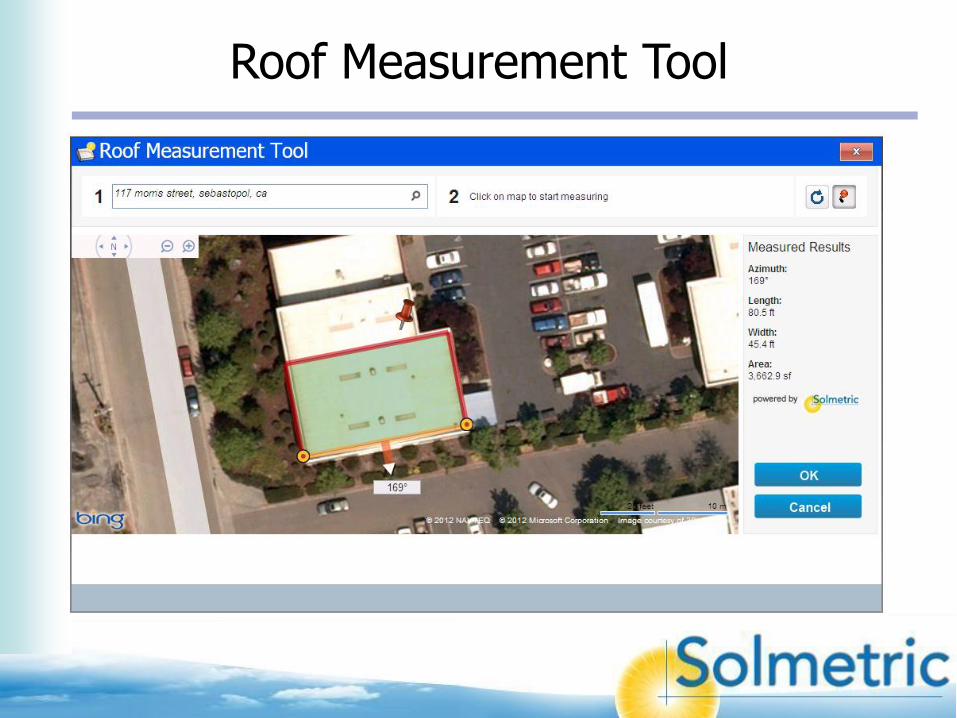
Roof Measurement Tool

Autofill icon
Project Wizard, Step 4 Array Navigator™

Autofill Tool

System Tree

Saving a test result

Traces screen

Environmental Inputs controls

Table screen

Verify screen

History screen

Meg Test tab

Topics
• Brief introduction to I-V curves and the PV Analyzer
• Introducing free Version 2.0 PVA Software Upgrade
• Commissioning PV arrays
• Troubleshooting PV arrays
• Meg testing with the Megger® MIT430

• High irradiance
– I-V curve shape changes significantly at low (<400W/m2) irradiance
– Translation to STC introduces more error if translation is large
• Clear sky
– Stable irradiance means better correspondence between I-V, irradiance, and temperature data, and thus better analysis statistics
• 4 hour window centered on solar noon*
– For high irradiance and low error from spectral and reflective effects
• Low wind
– For stable temperature and thus better analysis statistics
Recommended environmental conditions for performance testing with any type of instrument
http://www.esrl.noaa.gov/gmd/grad/solcalc/
*Solar Noon Calculator:
In practice, sometimes you will need to measure
under less than optimum conditions!!

Unstable sky conditions

Why do we want stable conditions?
• Meaningful analysis of ANY array performance requires that irradiance and temperature
(the sensor data) be measured at the same time as the array output.
• When irradiance and temperature are rapidly changing, a delay between the sensor and
array output measurements translates into sensor error, which introduces random variation
in the PV model’s performance prediction. This affects the consistency of Isc, Pmax, and
Performance Factor.
• The errors are greater when the time delay is greater, and when the conditions are
changing more rapidly. Manual measurement and entry of irradiance or temperature values
suffer most from this issue, because of the time required for measurement and data entry.
• Accuracy & precision cannot be regained by translating measured I-V curves to STC.
• The Solmetric Wireless Sensor Kit keeps this delay minimal, for most accurate performance
analysis.
Example Measurement Setup

I-V Measurement Setup Example: Measuring strings at a combiner box
Attach the thermocouple well away from module edges,
using polyimide (Kapton) tape for best mechanical
properties at high temperatures.

Measurement Process 860kW 7-inverter system
Courtesy of Portland Habilitation Center
and Dynalectric Oregon
1. Open the DC disconnect for the
sub-array you want to test.

Measurement Process
Courtesy of Portland Habilitation Center
and Dynalectric Oregon
2. Locate the
combiner box

Measurement Process
Courtesy of Portland Habilitation Center
and Dynalectric Oregon
3. Lift all of the fuses

Measurement Process
Courtesy of Portland Habilitation Center
and Dynalectric Oregon
5. Push down one fuse
at a time, take the I-V
trace, view and save
results. Takes ~ 10-15
seconds per string.
4. Clip the PV Analyzer
to the buss bars

Displays Generated by the I-V Data Analysis Tool*
1950
2000
2050
2100
7
6
5
4
3
2
1
0
Fre
qu
en
cy
Pmax (Watts)
7
6
5
4
3
2
1
0
Cu
rren
t (A
mp
s)
0 100 200 300 400 500
Voltage (Volts)
7
6
5
4
3
2
1
0
Cu
rren
t (A
mp
s)
0 100 200 300 400 500
Voltage (Volts)
*Optional accessory $95

• A histogram worksheet is created for each performance parameter, revealing patterns in the data
• Each histogram represents the frequency of different values of a measured parameter, across a group of string measurements
• In this example, the spread of Pmax values (upper graph) is largely explained by variation of irradiance (lower graph)
Histograms
Pmax
Irradiance

• Fill Factor is a very useful diagnostic tool (details in the next slides)
• Compared with Pmax or Isc, Fill Factor has a weak dependency on irradiance, making it a useful metric even under conditions of rapidly changing irradiance
• In this example, notice the clean, bell-shape of the fill factor (upper graph), compared with the irradiance distribution (upper graph)
Fill Factor Histogram
FF
Irradiance

Topics
• Brief introduction to I-V curves and the PV Analyzer
• Introducing free Version 2.0 PVA Software Upgrade
• Commissioning PV arrays
• Troubleshooting PV arrays
• Meg testing with the Megger® MIT430

Max power point
I-V Curve Signatures of PV Problems
Any reduction of the knee of the curve
means reduced output power.
Cu
rre
nt
(A)
Voltage (V)
Isc
Voc
Shunt
losses*
Series
losses**
Mismatch losses
(incl. shading)
Normal I-V curve
Reduced
current
Reduced
voltage
Conventional measurements do not reveal many of these effects.

Isc
Voc
Useful diagnostics Fill Factor, Current Ratio, Voltage Ratio
Cu
rre
nt
Voltage
Fill Factor = Imp x Vmp (watts)
Isc x Voc (watts)
aSi: 0.50 – 0.70
xSi: 0.75 – 0.85
GaAs: 0.85 – 0.9
=
Current ratio Imp/Isc
Voltage ratio Vmp/Voc
Imp
Vmp
Max Power Point

String of Field-aged, Early TF Modules Degraded fill factor, lower output power
Array-as-sensor mode for viewing relative changes in curve shape

0
1
2
3
4
5
6
7
8
0 50 100 150 200 250 300 350 400
Voltage - V
Cu
rren
t -
A
String 4B14
String 4B15
Troubleshooting example Anomalous slope in string I-V caused by single high-resistance module

Example of a series resistance failure inside a module J-box
Probably failure mode:
Heat cycling bond degradation resistive heating

Dropped Cell String
• Shorted bypass diode, or
• Mismatch causing diode to turn on
when current starts flowing

I-V Curve of a Partially Shaded String
• Multiple ‘knees’ multiple power peaks
• Peaks evolve as conditions change
• Inverter tries to find and track the highest peak
Cu
rre
nt
Voltage
Isc
Voc
Po
we
r
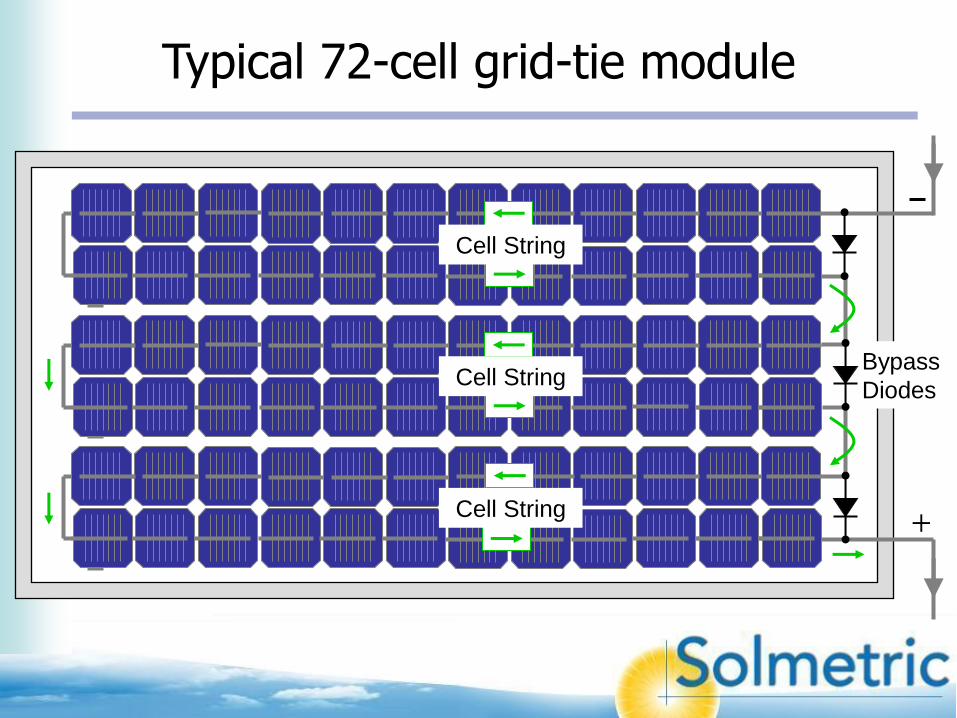
Typical 72-cell grid-tie module
+
Cell String
Cell String
Bypass
Diodes
Cell String

Shade One Cell
+
Cell String
Cell String
Cell String
Bypass
Diodes
Bypass diode turns on when the shaded cell(s) can
no longer pass as much current as the non-shaded
cells.

Shade 2 cells in the same cell-string Single module with 72 cells and 3 bypass diodes
Shading one
cell string
drops 1/3 of
PV module
voltage and
power

Shade 2 cells in adjacent cell-strings Single module with 72 cells and 3 bypass diodes
The same
amount of
shade,
oriented
differently,
drops 2/3 of
PV module
voltage and
power.
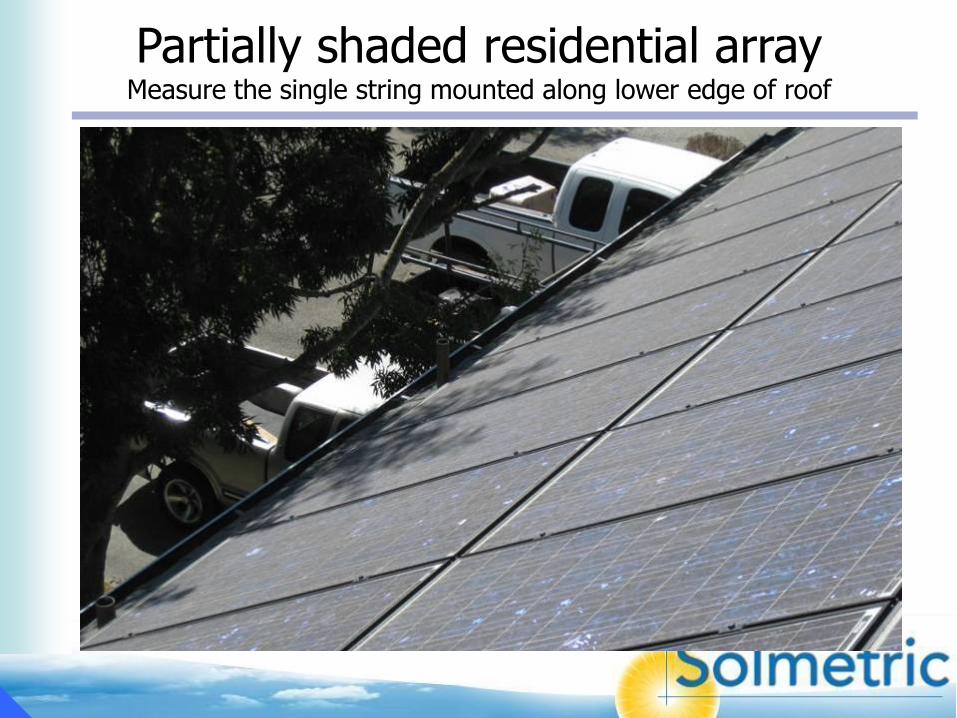
Partially shaded residential array Measure the single string mounted along lower edge of roof

I-V Curve of the partially shaded string Single string mounted along lower edge of roof
Approximately 40% reduction in string’s output power

Selective shading troubleshooting technique
• Traditional troubleshooting techniques can isolate a problem to a given
string, but it is often difficult to identify the failing module
• Selective shading and I-V curve tracing can often identify the failing
module without disconnecting modules from one another
• This greatly reduces the cost of troubleshooting
• Selective shading involves measuring the string repeatedly, with a
different module shaded each time
• Comparing the results leads us to the failed module

Troubleshooting using selective shading to identify a bad module
Photo courtesy of Harmony Farm Supply and Dave Bell
• Selective shading causes the
shaded module to be
bypassed, removing its
influence on the I-V curve
shape
• If there are N modules in a
string, measure the string N
times, with a different module
shaded each time. Go from
one end of the string to the
other to make the analysis
easier.
• All of the traces will look alike,
except for the case where the
failing module was shaded

Cu
rre
nt
Voltage
Isc
Voc
Entire string with no
applied shade (our
starting point)
Any good module shaded
Bad module shaded
Troubleshooting using selective shading to identify a bad module
The method can also be used to identify
a bad cell string in a single module

Summary of PV Analyzer benefits
•Single connection at combiner box
•Single measurement for each string
•Don’t need to bring inverter online
•Built-in PV models for instant performance check
•More effective troubleshooting
•Automated data analysis and reporting
•Most complete performance measurement possible
• Independent Pmax measurement for each string
•Teaches us to “think like a PV array”
Testing PV array performance faster and better
Next topic: Insulation resistance testing
Lower cost
Satisfied clients

Topics
• Brief introduction to I-V curves and the PV Analyzer
• Introducing free Version 2.0 PVA Software Upgrade
• Commissioning PV arrays
• Troubleshooting PV arrays
• Meg testing with the Megger® MIT430

Insulation Resistance Testing of PV Arrays Where are we?
1. The industry is trending toward the best practice of meg testing all
systems during commissioning and at maintenance intervals.
2. Meg testing is not yet being done on all commercial systems, and is
rarely done on residential systems.
3. Source circuits are often tested in aggregate, with string-level testing
if the aggregate resistance is low.
4. Methods for sub-array test are not standardized or widely
understood. Best reference is Bill Brooks’ ‘re-wrenches’ post.
5. In general, string or sub-array resistance values are compared for
consistency rather than held to a specific spec.
6. PV module leakage is usually the dominant effect.
7. Insulation problems will be much more common as PV systems age.

Preparation: Open the DC Disconnect Lift string fuses Lift negative feeder cable(s)
Lift
Meg Testing at the Subarray Level
Lift
Example assumes a
negative-grounded array
Lift
Combiner box

Preparation: Open the DC Disconnect Lift string fuses Lift negative source cable
Lift Lift
Meg Testing at the String Level
Example assumes a
negative-grounded array
Lift

Upcoming Webinars
Tools for Solar Site Assessment and Design January 8, 2013 10am PST
To register:
http://www.solmetric.com/webinar.html

Free I-V Curve Poster http://www.solmetric.com/specialoffers.html

SolarPro Magazine, Aug/Sep 2011

Paul Hernday
Senior Applications Engineer
cell 707-217-3094
January 10, 2013
Commissioning and O&M Applications of the Solmetric PV Analyzer
I-V Curve The (I, V) combinations at which the PV module(s) can be loaded
Cu
rre
nt
Voltage
Isc
Voc
I-V curve of PV module
I-V curve of resistor
Higher resistance
Lower resistance