Embed Size (px)
Citation preview

An Coimisiún um Rialáil Fóntas Commission for Regulation of Utilities
0
Information Paper
Reference: CRU17324 Date Published: 17/11/2017
An Coimisiún um Rialáil Fóntas
Commission for Regulation of Utilities
Smart Metering
Cost Benefit Analysis
www.cru.ie

An Coimisiún um Rialáil Fóntas Commission for Regulation of Utilities
1
Executive Summary Smart meters are the next generation of electricity and gas meter and are being rolled out
across Europe and internationally. This new technology will replace older, mechanical meters
and will make available new products and services to energy consumers. Smart meters will
make the switching process easier and empower consumers to make the right choice for their
energy needs. Smart metering will also enable the development of the smart grid and facilitate
more flexible, reliable and better network planning in the future.
On 21st September 2017, the Commission for the Regulation of Utilities (CRU) published
information on the smart meter upgrade for Ireland (CER/17/279). It detailed a new phased
approach to the upgrade for electricity meters, which was proposed by ESBN. Once completed
in 2024, this upgrade would support the delivery of a smart metering upgrade for gas.
The upgrade spanned three phases with additional functionality being added in each phase:
Phase 1 (2019 – 2020) - 250,000 meters upgraded. Initial smart services being turned on in Q4
2020. This will include services such as time-of-use tariffs, smart bills, access to historical
consumption information, etc.
Phase 2 (2021 – 2022) - 1 million additional meters upgraded and the addition of smart
prepayment (Smart PAYG) in Q4 2022.
Phase 3 (2023 – 2024) – 1 million additional meters upgraded and additional functionality will be
made available by ESBN through a Home Area Network (HAN). This will allow consumers to
access real-time data on their household energy usage via a device in their home. At this stage
the costs and benefits of gas smart meters will be analysed by the CRU to determine their
delivery.
CER/17/279 presented the high level findings of the CRU’s cost benefit analysis (CBA) of the
new phased upgrade for electricity customers. This analysis was important to determine if the
proposed approach represented value for money for energy consumers.
To conduct the CBA for the new electricity smart metering phased approach, the Retail and
Smart Metering Team updated the CBA model that was constructed with the CRU’s consultants
(Element Energy) to ascertain the value of previous roll out proposals. The CBA inputs and
assumptions of that model were a combination of extensive engagement with the key
stakeholders such as the network operators and suppliers in the market place. A call for
evidence (an open consultation) was also conducted to obtain input from wider stakeholders.
The CBA model was updated to capture the core elements of the new phased approach in
terms of timings and staggered delivery of functionality. It was also updated to reflect new
costing information as provided by ESBN.

An Coimisiún um Rialáil Fóntas Commission for Regulation of Utilities
2
The financial analysis showed that delivering the smart upgrade for electricity consumers in a
phased approach proved better value for the Irish energy consumer than previous alternatives;
representing a € 13 million improvement in Net Present Value (NPV). This is due to two main
drivers; namely:
1. Earlier Roll-Out: The functionality (in particular the offering of ToU tariffs) is turned on at an
earlier stage. This brings forward the customer and generation benefits of reduced peak and
overall electricity usage.
2. Staggered investment: The upfront costs of IT system updates/changes are phased over a
longer time scale. This reduced the gap between upfront costs and the realisation of benefits.
The overall NPV for the phased electricity smart meter upgrade is -€36 million.
In the context of the overall expected spend for the electricity smart metering upgrade of €1
billion, this can be considered broadly neutral. Added to this, the CRU recognises that there are
a number of unquantifiable benefits that smart metering could facilitate in the future which will
improve the NPV. These include1:
- Smart grid facilitation and development
- Smart homes and devices
- Development and uptake of electrical storage
- Facilitating the development of energy communities
- Supporting EV penetration
- Enabling prosumers
Furthermore, the recent draft of new European legislation, referred to as the ‘Clean Energy
Package’ is proposing to put in place an obligation such that that regardless of whether a
national smart metering roll out is being pursued or not, customers should be able to request a
electricity smart meter and have one installed. In this context, the IT systems to support smart
metering would have to be in place irrespective of a national smart metering rollout. In light of
such, an alternative CBA run was conducted in which IT system costs were treated as sunk, i.e.,
they would be incurred irrespective of the extent of the rollout of smart meters. This led to a
€142 million improvement resulting in a positive NPV of approximately €106 million.
This report provides in depth details of this analysis.
1 Note this is not an exhaustive list, but gives an indication of the potential benefits smart metering could facilitate in the future.
An Coimisiún um Rialáil Fóntas Commission for Regulation of Utilities
3
Public/ Customer Impact Statement
The smart meter upgrade programme is a national infrastructure project of considerable
scale and capital investment. It will see over 2 million electricity meters upgraded and
the overall costs of the project are estimated at 1 billion.
It is imperative that any decisions upon such a project are based upon robust financial
analysis. This is to ensure that the project delivers for and represents value for money
for the Irish consumer.
ESBN proposed a phased approach to the upgrade. The CRU conducted a cost benefit
analysis (CBA) to determine whether that approach represented value for money for the
Irish consumer.
The CBA encompassed both the direct monetary and wider societal costs and benefits
of the programme to determine its real value for the Irish consumer.
The results of the CBA were published by the CRU in CER/17/279, announcing the
adoption of the phased approach.
The results showed that the phased approach to the smart meter upgrade represented
better value than previous alternatives. It showed that the overall net present value of
the upgrade was, for a € 1 billion project with unquantifiable benefits, broadly neutral.
Where European proposals to provide customers with a right to request an electricity
smart meter are adopted, then the net present value increased to approximately €106
million.
In-depth details of this CBA are provided in this document.

An Coimisiún um Rialáil Fóntas Commission for Regulation of Utilities
4
Important message
The analysis is based largely on working assumptions upon the timings and nature of the smart
meter roll-out, not all of these are the subject of final CRU decisions. Equally, the cost and
benefit assumptions which feed into this analysis are, at this stage best available estimates2.
Certain elements of these could change as the market develops and policies are finalised. The
technology and systems have not been decided at present, therefore they could be subject to
change once they are procured (both in type of technology and cost).
This financial analysis focuses upon the rollout of electricity smart meters. The nature of the gas
smart meter rollout is undecided at present. Gas smart meters are not forecast to be delivered
until 2024. Consequently, it was deemed that the high level of uncertainty around the key
assumption of gas smart metering could affect the validity of the overall CBA if included.
Therefore it has been excluded from this financial analysis.3 4
Inputs from suppliers were provided before the phased approach to the smart metering project
was finalised. Aspects of the delivery could affect the values provided by suppliers which have
been used in this analysis. There is a high level of uncertainty around the actual costs suppliers
will entail in transitioning and operating in a ‘smart’ world. Consequently, the costs and benefits
associated with suppliers are based upon reasonable estimates and are highly caveated.
2 For example the exact costs of the smart metering infrastructure is not yet known as procurement has yet to commence 3 Note. Whilst the gas smart meter rollout has not been included in this analysis it is not precluded from the overall smart meter upgrade programme. Gas is part of the high level design that will be delivered by the end of the smart meter rollout. 4 The Commission for the Regulation of Utilities (CRU) will complete internal analysis upon key decisions regarding the gas smart meter rollout when required.

An Coimisiún um Rialáil Fóntas Commission for Regulation of Utilities
5
Table of Contents
Table of Contents ...................................................................................................... 5
Glossary of Terms and Abbreviations .................................................................... 8
1. Introduction ...................................................................................................... 10
1.1 Background ............................................................................................................. 10
1.1.1 Programme Overview .................................................................................... 11
1.1.2 Related Documents ....................................................................................... 12
2. Key Central Assumptions ............................................................................... 13
2.1 CBA Project Schedule ........................................................................................ 13
2.2 Microeconomic factors ....................................................................................... 13
2.3 Programme Roll-Out ........................................................................................... 14
2.3.1 Programme Elements .................................................................................... 14
2.3.2 Acceptance Rates .......................................................................................... 17
2.3.3 Total Meter Stock ........................................................................................... 19
2.4 Usage Benefits Realisation ................................................................................ 20
2.4.1 Impact of Smart Metering on Energy Consumption Patterns .......................... 20
2.4.2 Impact of ToU tariffs on Energy Consumption Patterns .................................. 21
2.4.3 Electricity Prices ............................................................................................ 22
3. CBA Model Cost and Benefit Categories by Stakeholder ............................ 24
3.1 Cost Benefit Categories by Stakeholder ........................................................... 24
3.2 Networks ............................................................................................................. 25
3.2.1 Network Benefits Overview ............................................................................ 25
3.2.2 Business as Usual Avoided Costs .................................................................. 26
3.2.3 Network Costs Overview ................................................................................ 30
3.2.4 Network Capital Costs ................................................................................... 31
3.2.5 Network Operational Costs ............................................................................ 34
3.3 Suppliers ............................................................................................................. 37
3.3.1 Supplier Benefits Overview ............................................................................ 37
3.3.2 Supplier Costs Overview ................................................................................ 39
3.3.3 Supplier Cost Apportionment ......................................................................... 41
3.3.4 Supplier Services ........................................................................................... 42
3.4 Electricity Generation ......................................................................................... 43
3.4.1 Generation System Benefits Overview ........................................................... 43
3.5 Consumers .......................................................................................................... 45
3.5.1 Consumer Benefits Overview ......................................................................... 45
3.5.2 Consumer Costs Overview ............................................................................ 48

An Coimisiún um Rialáil Fóntas Commission for Regulation of Utilities
6
3.6 Overall Programme Costs .................................................................................. 50
4. Smart Metering Upgrade – Overall Cost Benefit Analysis ........................... 51
4.1 Costs and Benefits Attributable to Networks .................................................. 51
4.2 Costs and Benefits Attributable to Suppliers .................................................. 53
4.3 Benefits Attributable to Generation ................................................................... 55
4.4 Consumer Usage Impacts .................................................................................. 56
4.5 Consumer Non-Usage Impacts .......................................................................... 60
4.6 Full Statement of Impact .................................................................................... 62
4.7 Model Sensitivity................................................................................................. 64
4.8 Counterfactual – The European Commissions ‘Clean Energy for All
Europeans’ legislative proposal ................................................................................... 68
5. Conclusion ....................................................................................................... 70
An Coimisiún um Rialáil Fóntas Commission for Regulation of Utilities
7
List of Tables Table 1 Smart Meter Upgrade Delivery Plan ....................................................................... 11
Table 2 Timings of Smart Meters ........................................................................................ 15
Table 3 Assumptions on IHD & ToU Timing in relation to smart meter installations
(programme elements) ........................................................................................................ 16
Table 4 Acceptance Rates .................................................................................................. 17
Table 5 Total Meter Stock per year ..................................................................................... 19
Table 6 Change in Consumption post Smart Meter ............................................................. 20
Table 7 Impact of ToU tariffs on Energy Consumption Patterns ......................................... 21
Table 8 Baseline Energy Consumption Patterns of Residential Population (proportion of
electricity consumption occurring in each usage band, residential) ..................................... 22
Table 9 Wholesale price of electricity (post-smart meter rollout: standard residential) ......... 22
Table 10 Consumer energy price assumption ..................................................................... 23
Table 11: Main categories of costs and benefits in the CBA for the smart meter rollout ...... 24
Table 12 Networks BAU Avoided Costs .............................................................................. 26
Table 13 BAU Assumptions ................................................................................................ 27
Table 14 ESBN Capital Expenditures .................................................................................. 32
Table 15 ESBN Operational Expenditures .......................................................................... 35
Table 16 Supplier Costs ...................................................................................................... 40
Table 17 Supplier Current Market Share ............................................................................. 42
Table 18 Assumed Uptake of Consumption Feedback Tools .............................................. 42
Table 19 Electricity Generation Assumptions ...................................................................... 44
Table 20: CBA model assumptions on deployment levels for different programme elements
........................................................................................................................................... 46
Table 21: CBA model assumptions on electricity consumption change with smart metering
and other programme elements .......................................................................................... 47
Table 22 Consumer Non Usage Parameters ....................................................................... 48
Table 23 Costs and Benefits Attributable to Networks by year ............................................ 51
Table 24 Total Costs and Benefits Attributable to Networks ................................................ 53
Table 25 Costs and Benefits Attributable to Suppliers by year ........................................... 53
Table 26 Total Costs and Benefits Attributable to Suppliers ................................................ 54
Table 27 Benefits Attributable to Generation by year .......................................................... 55
Table 28 Total Benefits Attributable to Generation .............................................................. 56
Table 29 Forecast Energy Reduction Benefits .................................................................... 57
Table 30 Consumer Usage Impacts by year ....................................................................... 58
Table 31 Total Consumer Usage Impacts ........................................................................... 59
Table 32 Consumer Non-Usage Impacts by year ................................................................ 60
Table 33 Total Consumer Non-Usage Impacts.................................................................... 61
Table 34 Integrated Statement of the CBA Result ............................................................... 62
Table 35 Sensitivity Analysis: NPV change (in millions) ...................................................... 65
Table 36 European Electricity Directive Counterfactual ....................................................... 69
An Coimisiún um Rialáil Fóntas Commission for Regulation of Utilities
8
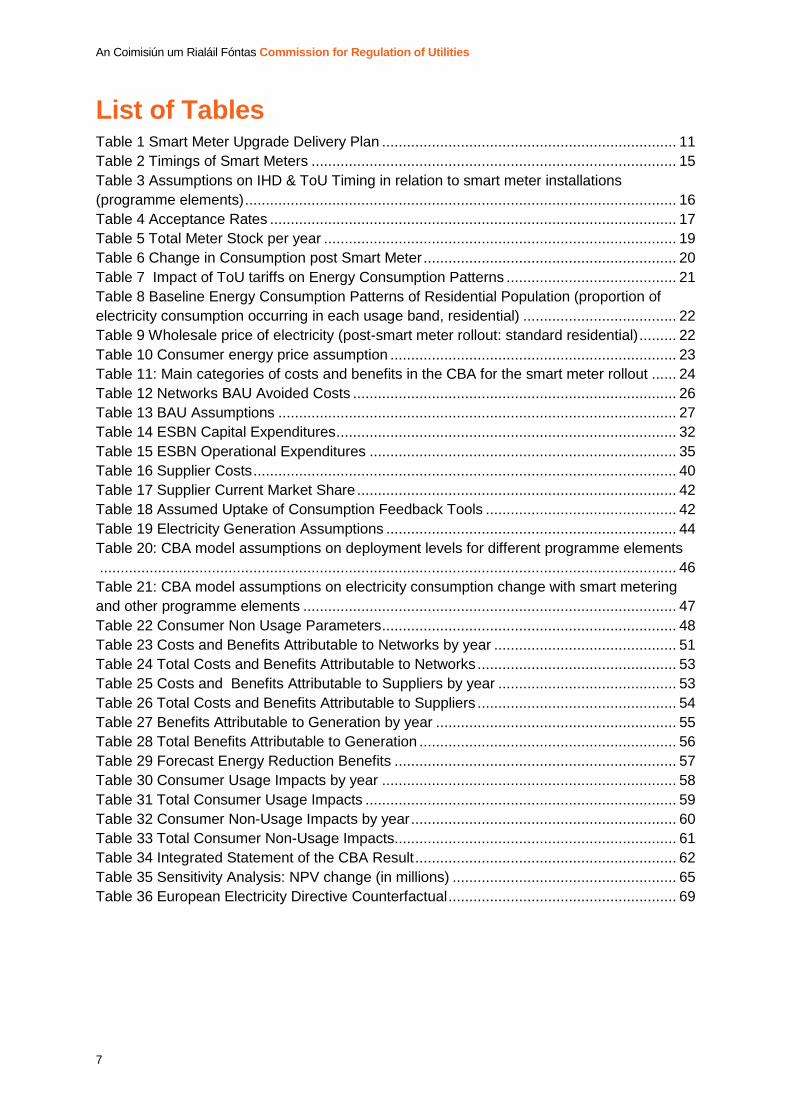
Glossary of Terms and Abbreviations
Abbreviation or Term Definition or Meaning
BAU Business as Usual
Capex Capital Expenditure
CBA Cost Benefit Analysis
CBT Consumer Behavioural Trail
CRU Commission for Regulation of Utilities
DSO Distribution System Operator
EV Electric Vehicle
FTE Full Time Employee
HAN Home Area Network
HH Half Hourly
HLD High Level Design
IHD In-Home Display
MDMS Meter Data Management System
MW Megawatt
NPV Net Present Value
Opex Operational Expenditure
SEAI Sustainable Energy Authority of Ireland
SEM Single Electricity Market

An Coimisiún um Rialáil Fóntas Commission for Regulation of Utilities
9
SME Small to Medium Sized Enterprises
SMP System Marginal Price
ToU Time of Use
WAN Wide Area Network

An Coimisiún um Rialáil Fóntas Commission for Regulation of Utilities
10
1. Introduction
1.1 Background
The Commission for Regulation of Utilities (CRU) has conducted a cost benefit analysis (CBA)
for a new phased approach to the electricity smart metering upgrade. This was done by updating
previous CBAs for the smart metering programme. Findings of this updated analysis are
presented in the remainder of this paper.
In total, three CBAs have been carried out for the smart metering upgrade programme. They
have been used to help inform significant decisions in the overall programme. Each iteration of
the CBA has been updated taking into account policy, technology and market developments.
Following smart meter customer trials, the first smart metering CBA was conducted in 2011. The
results of that CBA supported the decision to initiate the smart metering upgrade programme5.
However, at that point in time it was acknowledged that the CBA included a large number of
assumptions and included relatively little information upon the expected costs that the
programme would entail. As such it was important that the CBA was further updated when further
information was available. To this end, a second CBA was completed in 2014 and included
greater detail on smart metering policies and the design of the smart meter itself. This 2014 CBA
has now been updated to consider the value for money proposition of the new phased for the
smart update as presented by ESBN.
It should be noted that the focus of the CBAs is on quantifiable costs and benefits only – this is to
protect the robustness of the CBA. There are significant non-quantifiable benefits associated with
smart metering which are not considered here. One such example is smart grid enablement.
The preparation of the CBA involved input and close working with the major stakeholders of the
smart meter upgrade programme for input assumptions and technical support. High-level details
of input assumptions and their structure are provided throughout the report, but disaggregated
assumptions by stakeholder are not always provided due to their confidential nature. Where an
assumption was not provided or where the assumption provided was a significant outlier relative
to available benchmarks, an adjustment was made based on evidence from relative peer
organisations.
5 https://www.cru.ie/wp-content/uploads/2011/07/cer11080c.pdf
An Coimisiún um Rialáil Fóntas Commission for Regulation of Utilities
11
1.1.1 Programme Overview
This CBA was part of a checkpoint review. That review was conducted to ensure that the smart
metering programme was carried out in the most effective way for the Irish energy consumer. As
detailed previously, it considered a new phased approach for the smart metering update for
electricity customers. This new phased approach was proposed by ESBN to reduce the technical
complexity associated with delivering the smart metering upgrade.
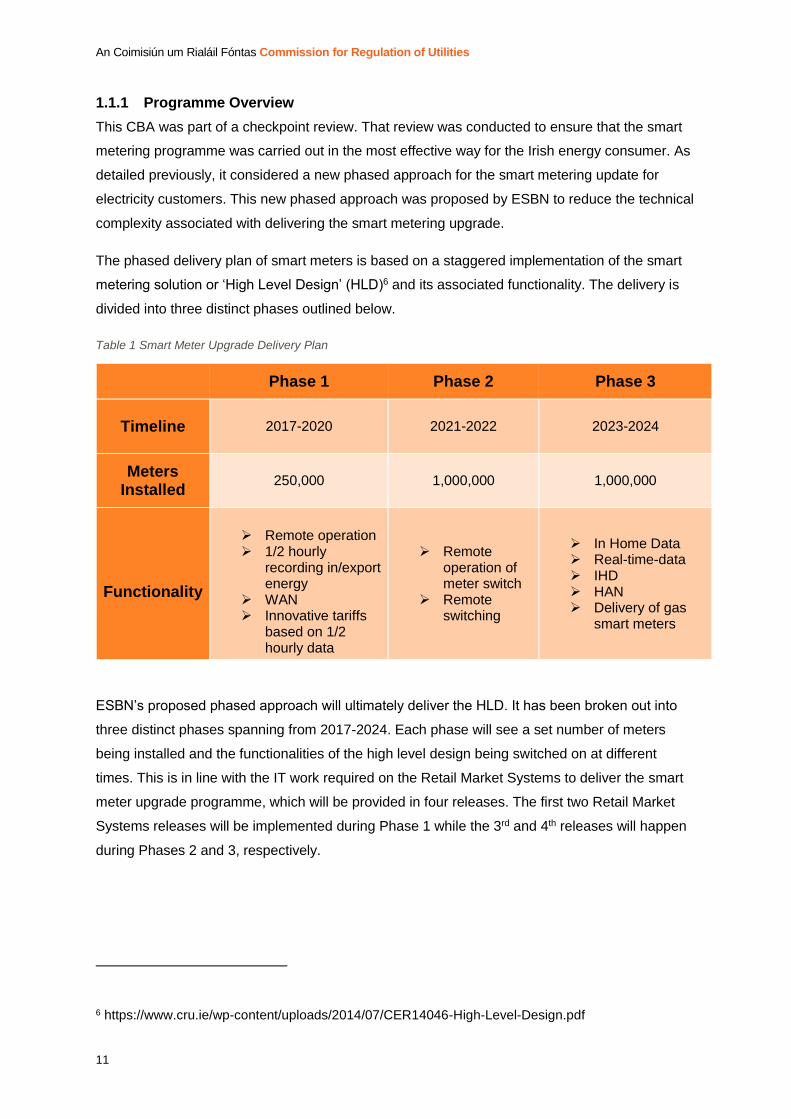
The phased delivery plan of smart meters is based on a staggered implementation of the smart
metering solution or ‘High Level Design’ (HLD)6 and its associated functionality. The delivery is
divided into three distinct phases outlined below.
Table 1 Smart Meter Upgrade Delivery Plan
ESBN’s proposed phased approach will ultimately deliver the HLD. It has been broken out into
three distinct phases spanning from 2017-2024. Each phase will see a set number of meters
being installed and the functionalities of the high level design being switched on at different
times. This is in line with the IT work required on the Retail Market Systems to deliver the smart
meter upgrade programme, which will be provided in four releases. The first two Retail Market
Systems releases will be implemented during Phase 1 while the 3rd and 4th releases will happen
during Phases 2 and 3, respectively.
6 https://www.cru.ie/wp-content/uploads/2014/07/CER14046-High-Level-Design.pdf
Phase 1 Phase 2 Phase 3
Timeline 2017-2020 2021-2022 2023-2024
Meters Installed
250,000 1,000,000 1,000,000
Functionality
Remote operation 1/2 hourly
recording in/export energy
WAN Innovative tariffs
based on 1/2 hourly data
Remote operation of meter switch
Remote switching
In Home Data Real-time-data IHD HAN Delivery of gas
smart meters

An Coimisiún um Rialáil Fóntas Commission for Regulation of Utilities
12
1.1.2 Related Documents
Information on CRU’s role and relevant legislation, alongside previous smart metering decisions
and analysis can be found on CRU’s website at www.cru.ie. Related document include:
Cost-Benefit Analysis (CBA) for a National Gas Smart Metering Rollout in Ireland
(CER/11/180c)
NSMP (Electricity & Gas) Cost Benefit Analysis – consultant report
CER National Smart Metering Programme Call for Evidence on Wider Programme Costs
and Benefits (CER/16/337)
Update on the Smart Meter Upgrade (CER/17/279)

An Coimisiún um Rialáil Fóntas Commission for Regulation of Utilities
13
2. Key Central Assumptions
This section presents an overview of the structure and detail of the primary assumptions which
drive the CBA of the electricity smart meter upgrade programme. This is broken down into
various elements to describe the assumed smart meter roll-out schedule; the residential and
Small and Medium-sized Enterprises (SMEs) penetration rates of electricity smart meters; timing
and uptake of programme elements; and the capital and operational costs associated with the
programme roll-out from the perspective of networks, consumers, generation, suppliers and the
overall programme.
2.1 CBA Project Schedule
An overview of the CBA project schedule is outlined below.
CBA start date 01/01/2017
Duration of CBA model 21 years
End date for the CBA model 01/01/2038
Years to run NPV Calculation 20
The CBA model has been run for a period of 20 years. The duration is essentially a seventeen
year asset life from the first installation year of a electricity smart meter. This is conservative
given that meters installed in 2024 will only be fourteen years old when the CBA is concluded.
2.2 Microeconomic factors
The CBA is run using the discount rate stipulated in the Irish Public Spending Code for national
infrastructure projects. The discount rate is 5% and is applied to the NPV calculation. The
compounded annual return on the investment in smart metering must exceed the discount factor
if the NPV is positive. A positive NPV means a higher annual return than 5% is being achieved. A
negative NPV means a lower return than 5% is being achieved.
A 10% cost of capital for supplier expenditures has also been applied to the model.
Discount Rate
(the opportunity cost of money expressed in annual
terms)
5%
An Coimisiún um Rialáil Fóntas Commission for Regulation of Utilities
14
Supplier cost of capital 10%
It should be noted that the CBA model outcomes are highly sensitive to the assumed discount
rate and model duration.
2.3 Programme Roll-Out
2.3.1 Programme Elements
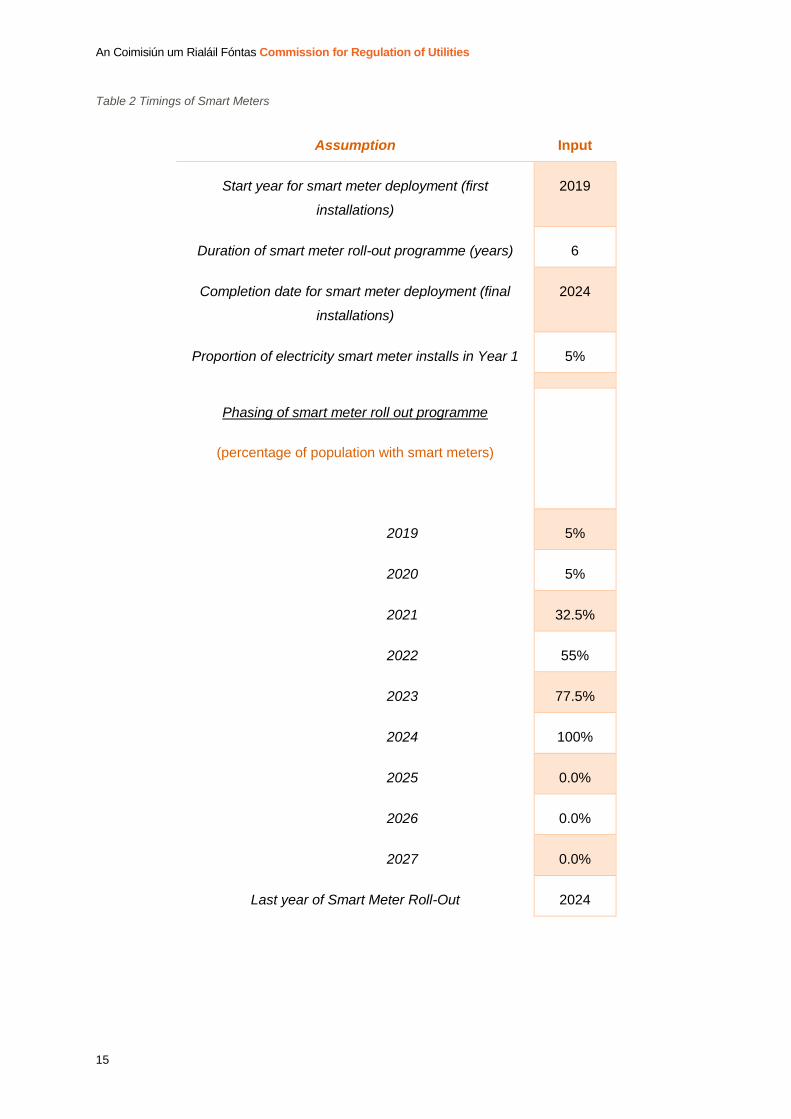
The assumed electricity smart meter roll-out schedule is outlined in the subsequent tables. These
are divided into the delivery of the meters themselves and the associated key functionality
elements of the programme.
Key points if note are:
Between 2019 and 2020 electricity smart meters are rolled-out to those who request a
meter and properties which require meter replacement;
Between 2021 and 2024 electricity smart meters are rolled-out to the remaining meter
population;
The roll-out of electricity smart meters is to private residents and Small and Medium-
sized Enterprises (SMEs) in Ireland;
In-Home Displays (IHDs) are provided by ESBN only to private residencies who request
them;
Supplier apps or devices will be available before ESBN’s IHD is available. Supplier apps
or devices will be available at the end of 2020 to those who choose to avail of them;
The IHD from ESBN willl not be provided until Phase 3. It can therefore be assumed that
that no customer will be able to receive a IHD until 2024 (end of Phase 3 and four years
after the deployment of smart services);
ToU tariffs, designed to promote a shift away from peak time consumption of electricity
are introduced to consumers from the end of 2020 and one year after installation of the
smart meter;
Smart meter customers (except for ToU refusals) are assumed to transferred to a ToU
tariff no later than two years post smart meter install or post smart services, whichever is
later;
It is assumed that not all customers will immediately transfer to a ToU tariff. Transfers to
ToU are therefore spread over a number of years after smart services deployment or
smart meter install (whichever is later). The final uptake of ToU is determined by the ToU
enrolment assumption.
An Coimisiún um Rialáil Fóntas Commission for Regulation of Utilities
15
Table 2 Timings of Smart Meters
Assumption Input
Start year for smart meter deployment (first
installations)
2019
Duration of smart meter roll-out programme (years) 6
Completion date for smart meter deployment (final
installations)
2024
Proportion of electricity smart meter installs in Year 1 5%
Phasing of smart meter roll out programme
(percentage of population with smart meters)
2019 5%
2020 5%
2021 32.5%
2022 55%
2023 77.5%
2024 100%
2025 0.0%
2026 0.0%
2027 0.0%
Last year of Smart Meter Roll-Out 2024

An Coimisiún um Rialáil Fóntas Commission for Regulation of Utilities
16
Table 3 Assumptions on IHD & ToU Timing in relation to smart meter installations (programme elements)
Assumption Input
Start year for WAN communications 2020
Year for deployment of smart services 2020
Number years post customer having smart
services that backstop MIHD is provided
4
Number of years post smart meter install/smart
services that customer must be transferred to ToU
2
Proportion of customers transferring to ToU in first
year post smart meter install/smart services
50%
Number of years after end of smart meter
deployment that flat tariffs end
2
Final year for flat tariffs, after which new smart
meters are on ToU
2026
Phasing of customer transfers to ToU, years post
smart meter install or smart services deployment,
whichever is later
Year 0
Year 1
50%
50%
Number of years post customer having smart
services that supplier information service is
provided
0

An Coimisiún um Rialáil Fóntas Commission for Regulation of Utilities
17
2.3.2 Acceptance Rates
There is not assumed to be a universal roll-out of electricity smart meters, IHDs or ToU tariffs.
Reasons for this are as follows:
There are likely to be challenges in accessing certain private residences, such as holiday
homes or those vacant on a long-term basis;
There are certain types of dwelling where the distance from the meter is too great for an
IHD to work effectively, most notability apartments;
Developments in policy now enable suppliers to provide their own ‘free of charge’ energy
information service in the form of an app or device, instead of the ESBN ‘backstop’ IHD7.
It is assumed a number of customers will choose a supplier service over the ESBN IIHD;
There are likely to be a number of refusals to accept ToU tariffs, particularly from
individuals who will be challenged in shifting demand at peak times (e.g. dialysis
patients).
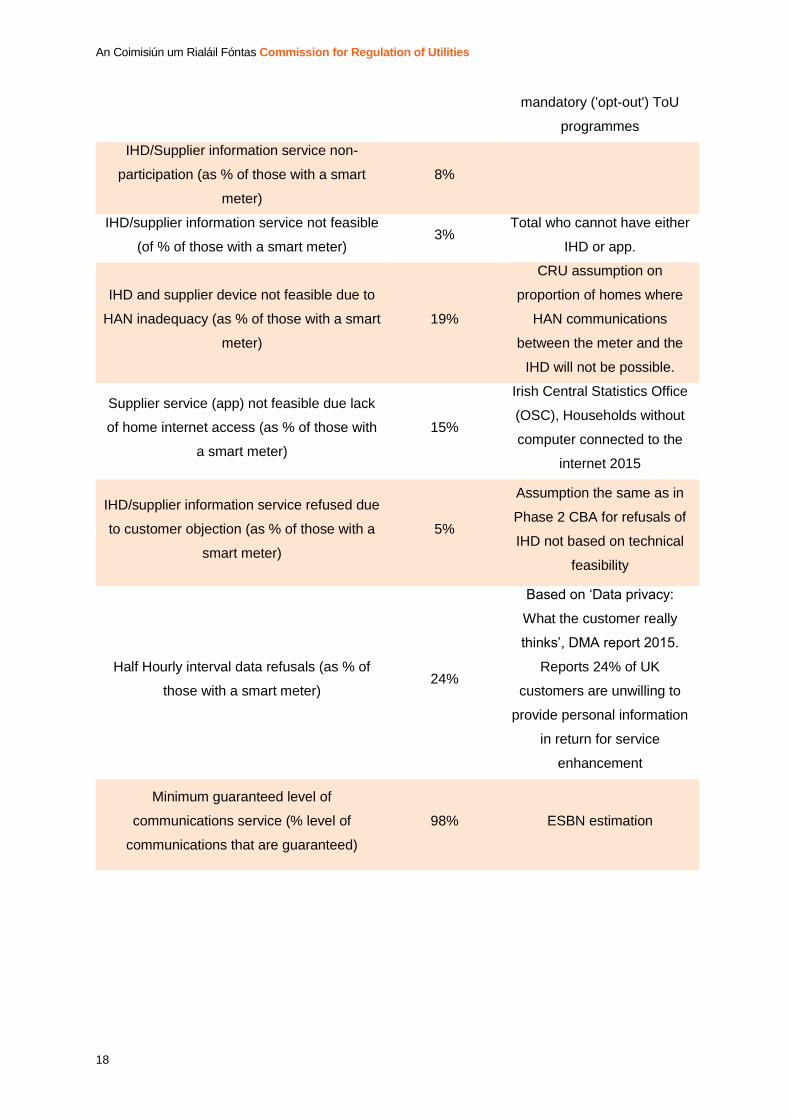
The esitmated rates of residential population accpetance of electricity smart metrs, IHDs and
ToU tarriffs is outlined below.
Table 4 Acceptance Rates
Assumption Value Rational
Proportion of electricity meters not replaced
by a smart meter 5%
Based on numbers achieved
in international smart meter
rollouts.
Proportion of population WAN
communications feasible (Note: those
properties that are WAN communications
infeasible will receive a smart meter but not
have access to smart services)
95% ESBN estimation
Total ToU non-enrolment before end of flat
tariffs (as % of total population) 64%
Based on enrolment
achieved in international
voluntary (‘opt-in’) ToU
programmes with high levels
of consumer engagement
Total ToU non-enrolment after end of flat
tariffs (as % of total population) 5%
Based on enrolment
achieved in international
7 https://www.cru.ie/wp-content/uploads/2015/07/CER15272-Empowering-Protecting-Customers.pdf
An Coimisiún um Rialáil Fóntas Commission for Regulation of Utilities
18
mandatory ('opt-out') ToU
programmes
IHD/Supplier information service non-
participation (as % of those with a smart
meter)
8%
IHD/supplier information service not feasible
(of % of those with a smart meter) 3%
Total who cannot have either
IHD or app.
IHD and supplier device not feasible due to
HAN inadequacy (as % of those with a smart
meter)
19%
CRU assumption on
proportion of homes where
HAN communications
between the meter and the
IHD will not be possible.
Supplier service (app) not feasible due lack
of home internet access (as % of those with
a smart meter)
15%
Irish Central Statistics Office
(OSC), Households without
computer connected to the
internet 2015
IHD/supplier information service refused due
to customer objection (as % of those with a
smart meter)
5%
Assumption the same as in
Phase 2 CBA for refusals of
IHD not based on technical
feasibility
Half Hourly interval data refusals (as % of
those with a smart meter) 24%
Based on ‘Data privacy:
What the customer really
thinks’, DMA report 2015.
Reports 24% of UK
customers are unwilling to
provide personal information
in return for service
enhancement
Minimum guaranteed level of
communications service (% level of
communications that are guaranteed)
98% ESBN estimation

An Coimisiún um Rialáil Fóntas Commission for Regulation of Utilities
19
2.3.3 Total Meter Stock
The forecasted total electricity meter stock for domestic and SME consumers over the duration of
the CBA analysis is outlined in the following table. The numbers represent the esitmated total
number of meters in Ireland per year irrespective of type (legacy or smart). These assumptions
derive from ESBN forecasts.
Table 5 Total Meter Stock per year
Year Urban
Residential
Rural
Residential SME Total
2017 1,409,894 641,752 187,719 2,239,365
2018 1,422,242 647,404 190,628 2,260,274
2019 1,435,962 653,684 193,582 2,283,228
2020 1,451,307 660,839 197,579 2,309,725
2021 1,468,457 668,689 201,655 2,338,801
2022 1,485,607 676,539 205,814 2,367,960
2023 1,504,815 685,331 210,056 2,400,202
2024 1,524,023 694,123 214,383 2,432,529
2025 1,544,603 703,543 218,796 2,466,942
2026 1,565,183 712,963 223,296 2,501,442
2027 1,585,763 722,383 227,887 2,536,033
2028 1,606,343 731,803 232,570 2,570,716
2029 1,625,551 740,595 237,347 2,603,493
2030 1,644,759 749,387 242,219 2,636,365
2031 1,663,967 758,179 247,189 2,669,335
2032 1,683,175 766,971 275,189 2,725,335
2033 1,702,383 775,763 280,360 2,758,506

An Coimisiún um Rialáil Fóntas Commission for Regulation of Utilities
20
2034 1,722,963 785,183 285,634 2,793,780
2035 1,743,543 794,603 291,014 2,829,160
2036 1,764,123 804,023 296,501 2,864,647
2037 1,784,703 813,443 302,098 2,900,244
2038 1,805,283 822,863 307,807 2,935,953
2.4 Usage Benefits Realisation
One of the primary benefits of smart metering is a change in the patterns of electricity usage by
residential households, most notably a reduction in overall energy consumption and movement of
demand away from peak times. This assumption is based on evidence from extensive CRU
comissioned consumer behavioural trials8 (CBT) in Ireland and international studies.
An important assumption of note is that no usage benefits can be attained without a smart meter.
2.4.1 Impact of Smart Metering on Energy Consumption Patterns
The assumed change in electricity consumption by domestic and SME customers as a result of
being provided additional information by smart meters is outlined below.
Table 6 Change in Consumption post Smart Meter
Information
provided to
customer
Reduction in
Consumption Rational Evidence
Real time
feedback for
standard
residential and
SME customers
(customers who
are not on "smart"
lifestyle PAYG)
-2.86%
Assumed that real time
feedback on energy
consumption alone
gives energy
consumption reduction
benefit, but no peak
shifting benefit.
Based on overall
consumption reduction
achieved in the Irish smart
meter CBT for Tariff A with
bimonthly billing, energy
statement and electricity
monitor (second 6 months
of trial).
8 https://www.cru.ie/wp-content/uploads/2011/07/cer11080.pdf

An Coimisiún um Rialáil Fóntas Commission for Regulation of Utilities
21
Energy
consumption
feedback for
"smart" lifestyle
PAYG customers
0.00%
Assume consumption
savings have already
been achieved for these
customers. Only applies
to those who are on
"smart" lifestyle PAYG
in counterfactual.
Proportion of real
time feedback
benefit that is
captured by D+1
feedback
90%
Apps with energy
consumption feedback
based on next day
(D+1) data are
assumed to capture this
percentage of the
benefit of those based
on real time data.
Advanced Metering
Initiatives and Residential
Feedback Programs: A
Meta-Review for Household
Electricity-Saving
Opportunities, American
Council for an Energy-
Efficient Economy, 2010
2.4.2 Impact of ToU tariffs on Energy Consumption Patterns
It is assumed that the introduction of ToU tariffs with the rollout of electricity smart meters will
result in an electricity consumption shift by consumers. It is expected that the extent of this shift
will be influenced by the level of feedback consumers receive on their energy usage. As such two
different rates of consumption change have been assumed for the model: one for the change
assumed to occur with a smart meter and a ToU tariff, the second for the assumed change to
occur with a smart meter, ToU tariff and provision of real-time feedback to a consumer on their
electricity usage. The assumed changes are outline in the table below.
Table 7 Impact of ToU tariffs on Energy Consumption Patterns
Programme elements Peak Day Night Total
Smart Meter and ToU tariff -8.15% -2.60% -0.36% -2.63%
Smart Meter, ToU tariff and ‘near-real-
time’ feedback -9.93% -3.09% 0.86% -2.86%
These assumptions are based upon the consumption pattern change in the Irish smart meter
CBT for Tariff A with bimonthly billing and an energy statement (second 6 months of trial).
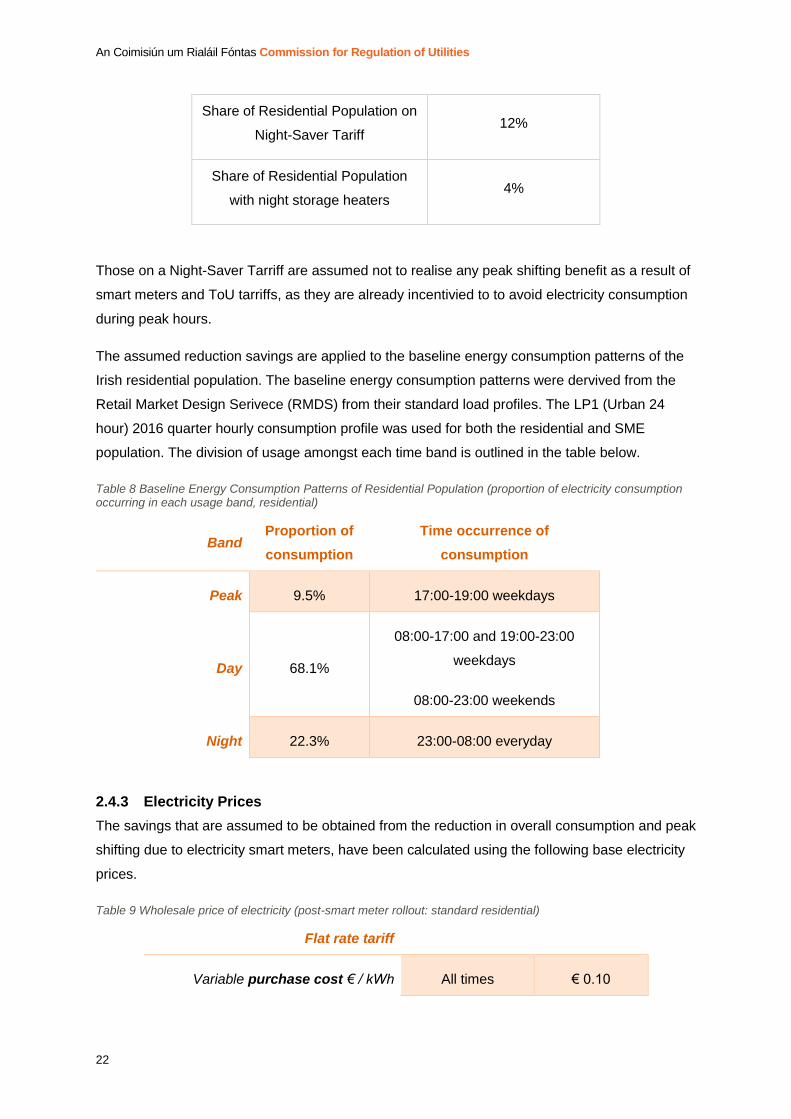
A number of homes are on a Night-Saver Tariff or have night storage heaters. The assumed
percentage of the residential population with these is outlined below.
An Coimisiún um Rialáil Fóntas Commission for Regulation of Utilities
22
Share of Residential Population on
Night-Saver Tariff 12%
Share of Residential Population
with night storage heaters 4%
Those on a Night-Saver Tarriff are assumed not to realise any peak shifting benefit as a result of
smart meters and ToU tarriffs, as they are already incentivied to to avoid electricity consumption
during peak hours.
The assumed reduction savings are applied to the baseline energy consumption patterns of the
Irish residential population. The baseline energy consumption patterns were dervived from the
Retail Market Design Serivece (RMDS) from their standard load profiles. The LP1 (Urban 24
hour) 2016 quarter hourly consumption profile was used for both the residential and SME
population. The division of usage amongst each time band is outlined in the table below.
Table 8 Baseline Energy Consumption Patterns of Residential Population (proportion of electricity consumption occurring in each usage band, residential)
Band Proportion of
consumption
Time occurrence of
consumption
Peak 9.5% 17:00-19:00 weekdays
Day 68.1%
08:00-17:00 and 19:00-23:00
weekdays
08:00-23:00 weekends
Night 22.3% 23:00-08:00 everyday
2.4.3 Electricity Prices
The savings that are assumed to be obtained from the reduction in overall consumption and peak
shifting due to electricity smart meters, have been calculated using the following base electricity
prices.
Table 9 Wholesale price of electricity (post-smart meter rollout: standard residential)
Flat rate tariff
Variable purchase cost € / kWh All times € 0.10

An Coimisiún um Rialáil Fóntas Commission for Regulation of Utilities
23
ToU tariff
Variable purchase cost € / kWh Peak € 0.15
Day € 0.10
Night € 0.09
The wholesale price of electricity encompasses the cost to produce electricity. This is the price
suppliers pay to obtain the electricity. This assumption mainly affects the generation side
benefits.
Table 10 Consumer energy price assumption
Baseline Flat Tariff 0.186€/kWh
Proportion of Unit Cost that accounts for wholesale price of
electricity, network losses and VAT
Peak 56%
Day 55%
Night 54%
Total 55%
ToU Tariffs (Post Introduction of Smart Metering)
Peak 0.263€/kWh
Day 0.184€/kWh
Night 0.158€/kWh
The consumer energy price is the final cost of each unit of electricity. This is the price final
customers pay for their electricity encompassing: price for electricity generation; network costs;
and taxes fees and surcharges. This assumption mainly affects the consumer benefits.

An Coimisiún um Rialáil Fóntas Commission for Regulation of Utilities
24
3. CBA Model Cost and Benefit Categories by Stakeholder
The assumed costs and benefits obtained through the electricity smart meter upgrade
programme can be broken down by stakeholder. These are described in further detail in this
section.
3.1 Cost Benefit Categories by Stakeholder
A high level overview of the CBA model cost and benefit categories per stakeholder is provided
in the table below.
Table 11: Main categories of costs and benefits in the CBA for the smart meter rollout
Stakeholder Cost Benefit
Networks
ESBN’s costs associated with
the smart metering upgrade
programme, including meter
deployment and IT systems
enhancement.
ESBN avoided costs and
benefits due to the smart
metering rollout, including
avoided manual meter reads
and site visits.
Suppliers
Various small benefits from
change to processes, and
remote meter reading.
Costs associated with IT
systems enhancement and
operation of smart Pay-you-Go.
Generation
System None.
Avoided capacity costs and
reduction in System Marginal
Price due to consumer
consumption change.
Consumer
Time costs for learning about
the smart meter and other
programme elements.
Consumption change leads to a
reduction in electricity bills, and
some time savings from
avoided manual meter reads.
Overall
Programme
Cost for CRU programme
management, and for
consumer engagement.
None.
The remainder of this section describes each of these categories in further detail.

An Coimisiún um Rialáil Fóntas Commission for Regulation of Utilities
25
3.2 Networks
The electricity network distribution system operator (DSO), ESBN, assumes significant
responsibility for the electricity smart metering upgrade. Given this role, ESBN faces a
substantial share of the assumed costs and benefits of the upgrade. These are outlined in the
following section. Which is subdivided into the following categories:
- Network Benefits Overview
- Business as Usual Avoided Costs
- Network Costs Overview
- Network Capital Costs
- Network Operational Costs
3.2.1 Network Benefits Overview
ESBN will have a range of avoided costs under the electricity smart metering upgrade. The main
avoided costs included in the CBA for the smart meter upgrade programme are summarised
below.
Networks main benefits from smart meter upgrade
programme
Avoided costs of business as usual meter replacements
Avoided installation costs for PAYG meters
Avoided manual meter readings
Avoided site visits for meter operations
Avoided network reinforcement costs due to consumption change
Reduction in electricity theft due to enhanced visibility
Electricity meter replacement has been postponed by ESBN since CRU made the decision to
proceed with the smart meter upgrade programme in 2011. Therefore, a large number of
electricity meters will require replacement. The cost of business as usual (BAU) meter
replacement is avoided if electricity smart meters are deployed. Additionally, in the absence of
the electricity smart meter upgrade programme, ESBN would continue to install a separate
electricity meter for PAYG hardship customers. This cost is avoided in the electricity smart meter

An Coimisiún um Rialáil Fóntas Commission for Regulation of Utilities
26
upgrade programme, as smart meters can switch between credit and PAYG, negating the need
to install a separate meter.
A number of meter operations will be performed remotely with smart meters. This includes: meter
readings; disconnections and re-energisations; and dealing with voltage complaints. The smart
meter upgrade programme avoids BAU site visit costs associated with these meter operations.
The deployment of electricity smart meters will enable customers to reduce their overall
electricity consumption and shift consumption from peak to off-peak times. This is expected to
result in a reduction in network peak demand, thus reducing network reinforcement costs.
The data provided by electricity smart meters will provide ESBN with greater visibility of the
network and facilitate better identification of electricity theft. This will lead to a reduction in theft
levels benefiting ESBN.
Sources and Assumptions
The main inputs for the calculation of these avoided costs were provided by ESBN. The inputs
provided by ESBN, have been compared to international benchmarks to determine the final CBA
input.
3.2.2 Business as Usual Avoided Costs
In the delivery of the electricity smart meter upgrade programme ESBN will avoid a number of
legacy costs as a direct result. These are provided in the CBA model as a benefit to ESBN. A
high-level overview of the avoided costs and their magnitude are outlined in the following table.
Table 12 Networks BAU Avoided Costs
Component Input Rational
Avoided Manual Meter
Reads €210 million
Encompasses avoided manual meter reads;
reduction in meter reading management
overhead; and avoided access issues with hard
to read meters.
Avoided costs of New
Connections €40 million
All new connections are assumed to receive a
smart meter, so avoided costs of acquisition and
install of a traditional meter are computed as a
benefit.
Avoided costs of meter
replacement €148 million
Savings associated with avoided costs of the
traditional meter replacement programme.
These avoided costs include the unit and install
cost for traditional meters.
An Coimisiún um Rialáil Fóntas Commission for Regulation of Utilities
27
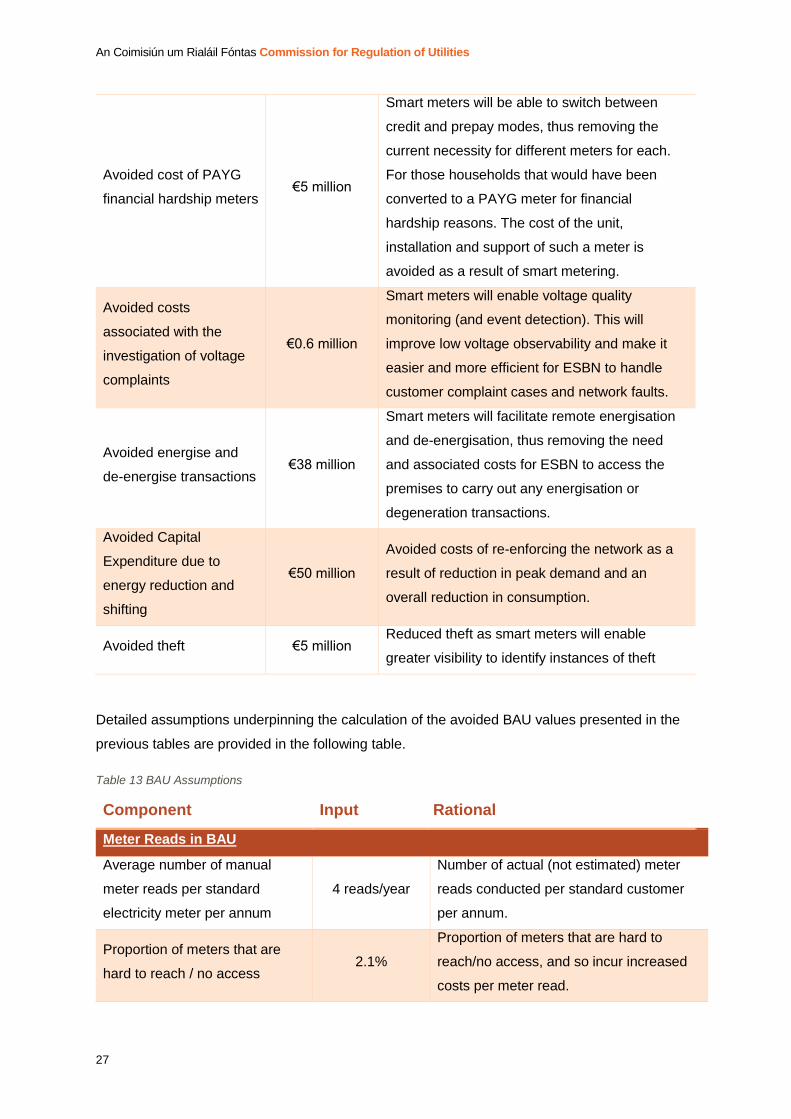
Avoided cost of PAYG
financial hardship meters €5 million
Smart meters will be able to switch between
credit and prepay modes, thus removing the
current necessity for different meters for each.
For those households that would have been
converted to a PAYG meter for financial
hardship reasons. The cost of the unit,
installation and support of such a meter is
avoided as a result of smart metering.
Avoided costs
associated with the
investigation of voltage
complaints
€0.6 million
Smart meters will enable voltage quality
monitoring (and event detection). This will
improve low voltage observability and make it
easier and more efficient for ESBN to handle
customer complaint cases and network faults.
Avoided energise and
de-energise transactions €38 million
Smart meters will facilitate remote energisation
and de-energisation, thus removing the need
and associated costs for ESBN to access the
premises to carry out any energisation or
degeneration transactions.
Avoided Capital
Expenditure due to
energy reduction and
shifting
€50 million
Avoided costs of re-enforcing the network as a
result of reduction in peak demand and an
overall reduction in consumption.
Avoided theft €5 million Reduced theft as smart meters will enable
greater visibility to identify instances of theft
Detailed assumptions underpinning the calculation of the avoided BAU values presented in the
previous tables are provided in the following table.
Table 13 BAU Assumptions
Component Input Rational
Meter Reads in BAU
Average number of manual
meter reads per standard
electricity meter per annum
4 reads/year
Number of actual (not estimated) meter
reads conducted per standard customer
per annum.
Proportion of meters that are
hard to reach / no access 2.1%
Proportion of meters that are hard to
reach/no access, and so incur increased
costs per meter read.

An Coimisiún um Rialáil Fóntas Commission for Regulation of Utilities
28
Average number of manual
meter reads per hard to reach
electricity meter per annum
1 reads/year
Number of actual (not estimated) meter
reads conducted per hard to reach/no
access customer per annum.
Cost per standard meter read €1.15/read Cost of conducting manual read for
standard customer.
Cost per hard to reach meter
read €10.00/read
Cost of conducting manual read for hard
to reach/no access sites.
Manual meter reading
management overhead €14,000,000
Cost incurred annually supporting the
activities of manually reading meters
New connections in BAU
Urban €26 /meter
€67/install Cost for meter unit and install for BAU
new connections
Rural €26/meter
€76/install
SME €49/meter
€131/install
Meter Replacement
Traditional Meter €26/meter
€71/install
Cost for meter unit and install for BAU
traditional meter replacements
Time Switch €40/meter
€40/install
Cost for meter unit for BAU time switch
meter replacements
BAU meter replacement
Number of traditional meter
replacements per annum
115,000
meters/year
BAU annual number of replacements of
traditional meter during smart meter rollout
years.
Number of Time Switch
replacements per annum
10,000
meters/year
BAU annual number of replacements of
Time Switch meters during smart meter
rollout years.
Manual meter reading
equipment replacement €2,250,000
Cost of replacing the equipment required
for meter reading traditional meters.
Assumed to occur twice.
Prepayment meter costs in BAU
Unit cost of Prepayment meter
(hardship PAYG)
€119/meter
€64/install
Unit and install cost for financial hardship
(networks) PAYG meter in BAU.
Support cost per prepayment
meter (hardship PAYG) €5/year
Annual cost of supporting PAYG meter
(maintenance etc.).
Siteworks costs in BAU

An Coimisiún um Rialáil Fóntas Commission for Regulation of Utilities
29
Energise cost per transaction €70/transaction Current networks cost of energisation site
visit
De-Energise Not actioned cost
per transaction €70/transaction
Current networks cost of de-energisation
not actioned site visit
De-Energise cost per
transaction €70/transaction
Current networks cost of de-energisation
site visit
Exchange from standard tariff to
night saver tariff cost per
transaction
€170/transaction
Current networks cost of changing
customers meter for switch to NST
(including site visit)
Exchange from night saver tariff
to standard tariff cost per
transaction
€170/transaction
Current networks cost of changing
customers meter for switch from NST to
standard tariff (including site visit)
Proportion smart meter
disconnections requiring site
visit
10%
Proportion of disconnections that still
require a site visit after the smart meter
rollout.
Voltage investigation visits per
annum 1,296 visits/year
Number of voltage investigation visits
which would be avoided under smart
metering per year.
Voltage cost per visit €80 /visit Cost per voltage investigation visit
Deferred CAPEX per 1% saving
in Energy Consumption
€1,000,000
/year
Value of a 1% overall energy reduction to
the DSO.
Deferred CAPEX per 1% saving
shift in Peak consumption €730,000 /year
Value of a 1% shift in peak consumption
to the DSO.
Theft avoidance
Cost per MWh €40 /MWh Electricity cost per MWh for calculation of
theft benefit.
Theft factor 1% Current proportion of electricity
consumption lost to theft.
Reduction in theft level 30%
Expected reduction in theft as a result of
smart metering (assuming all customers
have a smart meter and provide HH data
daily)

An Coimisiún um Rialáil Fóntas Commission for Regulation of Utilities
30
3.2.3 Network Costs Overview
ESBN will incur costs in rolling out electricity smart meters. They carry the highest proportion of
programme costs in terms of stakeholders. The costs entailed include both upfront capital
expenditure and ongoing operational costs. The main network costs included in the CBA for the
electricity smart metering upgrade programme are summarised below.
Networks main costs from smart meter upgrade
programme
Smart meter units and installations costs
Smart Meter communications costs
Cost of IT systems enhancement for smart metering
Costs related to the deployment and support of the backstop IHD
Staff Training and additional staff costs
Costs associated with legacy non-smart meters
Programme management costs
ESBN will incur upfront costs in purchasing smart meter units and installing them in homes and
SMEs. In addition, the deployment of electricity smart meters will require enhancement of ESBN
IT systems to deal with new smart metering processes and data. ESBN will also incur ongoing
network communication costs for remotely accessing smart metering data and performing smart
metering operations. Further costs will be entailed by ESBN in procuring, deploying and
supporting the backstop IHD. The deployment of electricity smart meters and new processes
associated with smart metering will require ESBN to take on additional staff and complete staff
training; incurring an associated cost.
The remaining non-smart (legacy) electricity meters will entail increased costs after the smart
metering rollout. The costs for carrying out manual meter reads for those meters will be higher
due to the larger geographical spacing between these meters; reducing the number of reads that
can be completed each day.
ESBN will incur some programme management costs associated with the electricity smart
metering upgrade, such as costs for managing the deployment and co-ordination with other
stakeholders.

An Coimisiún um Rialáil Fóntas Commission for Regulation of Utilities
31
Sources and assumptions
The main inputs for the calculation of these avoided costs were provided by ESBN. The inputs
provided by ESBN have been compared to international benchmarks to determine the final CBA
input.
3.2.4 Network Capital Costs
The programme will present a capital cost for ESBN in acquiring and installing electricity smart
meters and IHDs. The assumptions on these costs were provided by ESBN. It is assumed that
the backstop IHD provided by ESBN will be taken up by 20% of customers, as the remaining
proportion of smart metering consumers will avail of a supplier app or device instead. The IHD is
assumed to be acquired and installed after the rollout of smart meters in 2024.
The major items of capital expenditure are the following:
Smart meter units acquisition and installation;
IHD acquisition and installation – associated communication charges and maintenance of
the IHD;
Programme management – essentially the costs which ESBN will incur for the
management of thesmart metering upgrade, including procurement;
Head end system –the system and software needed to ensure reliable communication
between the smart meter and ESBN’s meter data management system;
Meter data management system (MDMS) – the system needed for the storage,
management and distribution of consumption data from smart meters;
Backend enhancement – the current system used by ESBN for meter management will
need significant enhancement to accommodate the new functionality of smart meters;
Deployment and materials management – investment in systems to ensure an effective
management of smart metering upgrade;
IT security – investment will be required in new applications (supplementary to that built
into mainstream systems) to ensure that smart meter data is secure at all points of transit
and processing.
ESBN provided CRU with an estimated breakdown of costs. However, these have not been
published at this stage due to commercial and procurement sensitivities. Data not presented for
commercially sensitive reasons is indicated with an X. The breakdown of these costs and rational
is outlined in the following table.

An Coimisiún um Rialáil Fóntas Commission for Regulation of Utilities
32
Table 14 ESBN Capital Expenditures
Component Input Rational
Smart Meter unit X €/unit
Install cost X €/install
Communications infrastructure per meter
Night Saving Heating (NSH)
incremental install cost
X€/NST
meter
NSH Circuit may require additional work at point
of SM installation. Cost is per NSH instance.
Cost for meter HAN
communications module X €/meter
Additional cost per smart meter install of fitting
HAN module to the electricity meter.
Cost for configuration of in-
home communications X €/install
Additional cost per smart meter install for set-up
and configuration of DSO supported in-home
channel.
IT Capex items
Harmonised Downloadable
File X €/year
IT capital cost for providing consumer access to
their Harmonised Downloadable File, as
specified in CRU policy decisions
Effective Year for Harmonised
Downloadable File capital cost 2019
Assumed to be incurred in first two years of SM
deployment
Repeat Year for Harmonised
Downloadable File capital cost 2020
Head End - data collection
systems €X
Cost incurred of developing Head End data
collection system. Assumed to occur in one year
only.
Effective Year for head end
data collection systems capital
cost
2018
Meter Data Management
System (MDMS) X €/year
Cost of developing Meter Data Management
System.
Effective Year for MDMS
capital cost 2018
Assumed to have 1 year lead in time and to
occur in two consecutive years
Repeat Year for MDMS capital
cost 2019
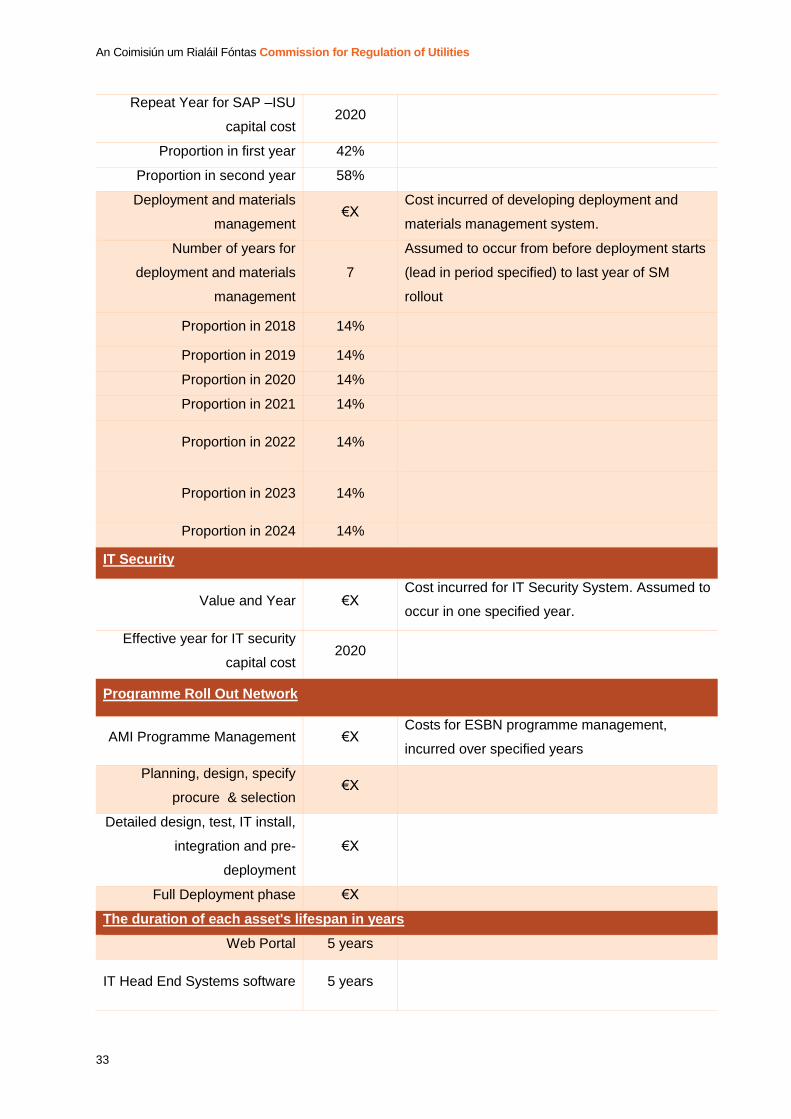
SAP -ISU - Market Systems €X
Cost incurred of upgrading SAP Market
Messaging System. Assumed to occur in 2
specified years.
Effective Year for SAP –ISU
capital cost 2019
An Coimisiún um Rialáil Fóntas Commission for Regulation of Utilities
33
Repeat Year for SAP –ISU
capital cost 2020
Proportion in first year 42%
Proportion in second year 58%
Deployment and materials
management €X
Cost incurred of developing deployment and
materials management system.
Number of years for
deployment and materials
management
7
Assumed to occur from before deployment starts
(lead in period specified) to last year of SM
rollout
Proportion in 2018 14%
Proportion in 2019 14%
Proportion in 2020 14%
Proportion in 2021 14%
Proportion in 2022 14%
Proportion in 2023 14%
Proportion in 2024 14%
IT Security
Value and Year €X Cost incurred for IT Security System. Assumed to
occur in one specified year.
Effective year for IT security
capital cost 2020
Programme Roll Out Network
AMI Programme Management €X Costs for ESBN programme management,
incurred over specified years
Planning, design, specify
procure & selection €X
Detailed design, test, IT install,
integration and pre-
deployment
€X
Full Deployment phase €X
The duration of each asset's lifespan in years
Web Portal 5 years
IT Head End Systems software 5 years

An Coimisiún um Rialáil Fóntas Commission for Regulation of Utilities
34
MDMS 5 years
SAP ISU Market systems 5 years
Deployment and Material
Management 7 years
IT security 5 years
Programme roll out 3 years
HAN Card Module 15 years
Smart Meter 15 years
IHD 1 year
MIHD Asset
Acquisition cost IHD X €/unit Unit cost of IHD
Installation cost IHD X €/install
Unit cost of installing IHD. This includes secure
pairing with the Electricity Meter (and Gas Meter)
and may include site visit costs
IHD systems and back office
annual costs X €/year
Operational expenditure in each year that MIHDs
are supported.
Cut off year for IHD
maintenance 2026
Final year where ESBN provides IHD
maintenance and support. Assumed to be (IHD
maintenance period + 1) years after end of smart
meter rollout. (Based on CER policy decision that
ESBN must offer IHD for at least one year, and
maintain it for at least 12 months.)
IHD customer support cost per
call X €/call
Cost per call received from the IHD support
service
Proportion of supported IHDs
requiring a support call
annually
5%
Proportion of IHD Customers being supported
that require a support call per annum
Cost per IHD support visit X €/visit Cost for IHD support visit and
repair/replacement.
3.2.5 Network Operational Costs
ESBN is the programme owner of the electricity smart meters and their associated infrastructure.
This will entail significant operating costs in their ongoing maintenance.
The major items of additional operating expenditure for ESBN as a result of the electricity smart
metering upgrade programme are the following:

An Coimisiún um Rialáil Fóntas Commission for Regulation of Utilities
35
Mobile operator charges – related to the required ongoing communication between the
smart meters and the MDMS of the ESBN;
Telecoms operation and maintenance – the costs associated with operating and
maintaining the telecoms infrastructure required to support the smart meter MDMS
communications;
Head end and MDMS annual management and enhancement – the annual costs
associated with the operation and maintenance of these systems and occasional
enhancement;
Network Operations Centre – the costs of providing a team to ensure that smart meter
business processes are fit-for-purpose and that the supporting infrastructures are
performing to the required standards;
Data storage costs – the costs of storing the data from smart metres;
Replacement of faulty meters – the costs associated with the replacement of faulty smart
meters.
ESBN provided CRU with an estimated breakdown of costs. However these have not been
published at this stage due to commercial and procurement sensitivities. The breakdown of these
costs and assumed timing are outlined in the table below.
Table 15 ESBN Operational Expenditures
Component Input Rational
Mobile communications X €/meter/year Collection & Messaging Cost
WAN communications infrastructure ongoing operations and maintenance
Additional cost for WAN
communications infrastructure
replacement
€X
Provision for additional costs for
WAN Module replacement in
specified year
Effective year for additional cost for
WAN communications
infrastructure replacement
2026
Head End data collection systems
Additional cost for enhancement to
Head End systems X €/year
Provision for additional
enhancements to the Head End
system which apply in 2 specified
years
Effective year for additional cost for
enhancement to Head End
systems
2020
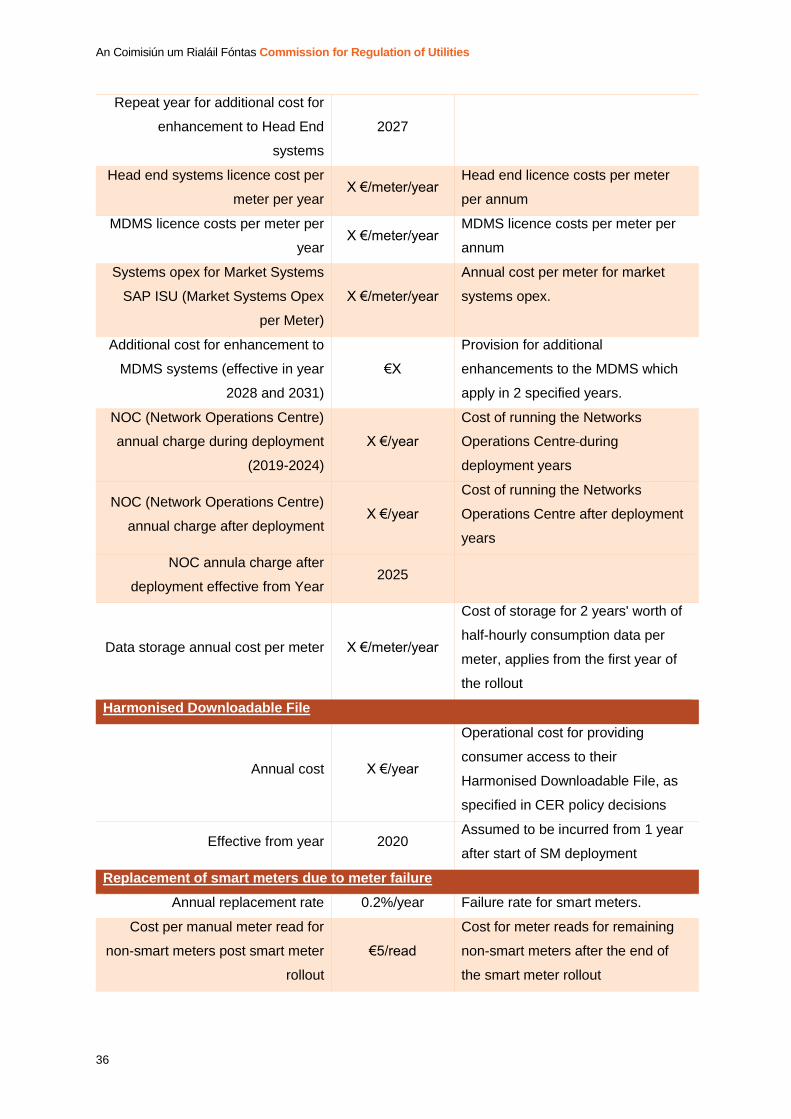
An Coimisiún um Rialáil Fóntas Commission for Regulation of Utilities
36
Repeat year for additional cost for
enhancement to Head End
systems
2027
Head end systems licence cost per
meter per year X €/meter/year
Head end licence costs per meter
per annum
MDMS licence costs per meter per
year X €/meter/year
MDMS licence costs per meter per
annum
Systems opex for Market Systems
SAP ISU (Market Systems Opex
per Meter)
X €/meter/year
Annual cost per meter for market
systems opex.
Additional cost for enhancement to
MDMS systems (effective in year
2028 and 2031)
€X
Provision for additional
enhancements to the MDMS which
apply in 2 specified years.
NOC (Network Operations Centre)
annual charge during deployment
(2019-2024)
X €/year
Cost of running the Networks
Operations Centre during
deployment years
NOC (Network Operations Centre)
annual charge after deployment X €/year
Cost of running the Networks
Operations Centre after deployment
years
NOC annula charge after
deployment effective from Year 2025
Data storage annual cost per meter X €/meter/year
Cost of storage for 2 years' worth of
half-hourly consumption data per
meter, applies from the first year of
the rollout
Harmonised Downloadable File
Annual cost X €/year
Operational cost for providing
consumer access to their
Harmonised Downloadable File, as
specified in CER policy decisions
Effective from year 2020 Assumed to be incurred from 1 year
after start of SM deployment
Replacement of smart meters due to meter failure
Annual replacement rate 0.2%/year Failure rate for smart meters.
Cost per manual meter read for
non-smart meters post smart meter
rollout
€5/read
Cost for meter reads for remaining
non-smart meters after the end of
the smart meter rollout

An Coimisiún um Rialáil Fóntas Commission for Regulation of Utilities
37
Number of manual reads per year
for non-smart meters post smart
meter rollout
4 reads/year
Number of manual (actual, not
estimated) reads per year for
remaining non-smart meters
Overhead associated with legacy
non-smart meters €1,000,000/year
Legacy overhead, additional to what
is incurred in BAU.
3.3 Suppliers
This section describes the primary assumptions which underpin the analysis of the costs and
benefits to electricity suppliers as a result of the electricity smart metering upgrade. These are
outlined in the following section. Which is subdivided into the following categories:
- Supplier benefits overview
- Supplier costs overview
- Supplier cost apportionment
- Supplier services
It should be noted that all costs provided by suppliers are estimated and highly caveated.
Information was obtained from Electric Ireland; Bord Gais Energy; SSE Airtricity; Energia;
PrePay Power; and Pinergy.
3.3.1 Supplier Benefits Overview
Suppliers are expected to see benefits associated with the rollout of electricity smart metering,
however, these are small in relation to programme benefits experienced by other stakeholders.
The main supplier benefits included in the CBA for the smart metering upgrade programme are
summarised in the following table.
Supplier benefits from smart metering upgrade
Reduction in customer call volumes related to estimated bills
Reduction in supplier costs related to consumer debt
Reduction in supplier costs associated with a customer switching
supplier
Avoided costs of PAYG lifestyle meters
Once electricity smart meters are deployed, data will be collected every day and meter readings
will be performed remotely. The daily collection of data will facilitate suppliers to bill their

An Coimisiún um Rialáil Fóntas Commission for Regulation of Utilities
38
customers on actual meter readings, rather than issuing estimated bills. This will result in a
reduction in calls to suppliers in relation to estimated bills, providing a benefit to suppliers.
Bills based upon actual consumption and the provision of consumption feedback will enable
customers to better manage their electricity spend as they can continuously monitor and react to
their usage. This will help consumers avoid going into debt with their supplier. This is expected to
lead to a reduction in costs associated with supplier’s customer debt management (such as
through a reduction in the number of dunning messages sent to customers).
The process cost associated with a customer switching supplier may be reduced, as ad hoc
manual electricity meter reads will no longer be required with electricity smart meters. This
represents a supplier benefit in the CBA.
Suppliers will avoid costs associated with installing electricity PAYG meters for customers who
choose to switch to PAYG as a lifestyle choice. Smart meters will have the capability to switch
between credit and PAYG modes, thus the installation of a new meter to facilitate a customer’s
switch to PAYG will no longer be necessary. This represents a supplier benefit in the CBA.
Sources and assumptions
The inputs required for the calculation of these benefits were provided by suppliers. The inputs
provided by suppliers were compared against each other and international benchmarks to decide
the final CBA inputs. Suppliers provided their own benefit inputs, which were applied to their own
customer base. Where an input was not received by a supplier, CRU provided an assumed value
based upon other suppler inputs and international benchmarks9.
Assumed Value
The assumed value for Suppliers of each benefit component is outlined below.
Component value
Avoided Ad-Hoc meter reads €7,550,286
Reduction in Bad Debts €13,365,641
Reduction in Switching Costs €6,673,994
Reduction in Dunning cycles €9,490,747
9 It should be noted that the values (both costs and benefits) attributable to suppliers are subject to change and have a high level of sensitivity. This is because the majority of the costs will not be known until smart meters are installed and suppliers will develop their business plans as the impact of smart meters become apparent.
An Coimisiún um Rialáil Fóntas Commission for Regulation of Utilities
39
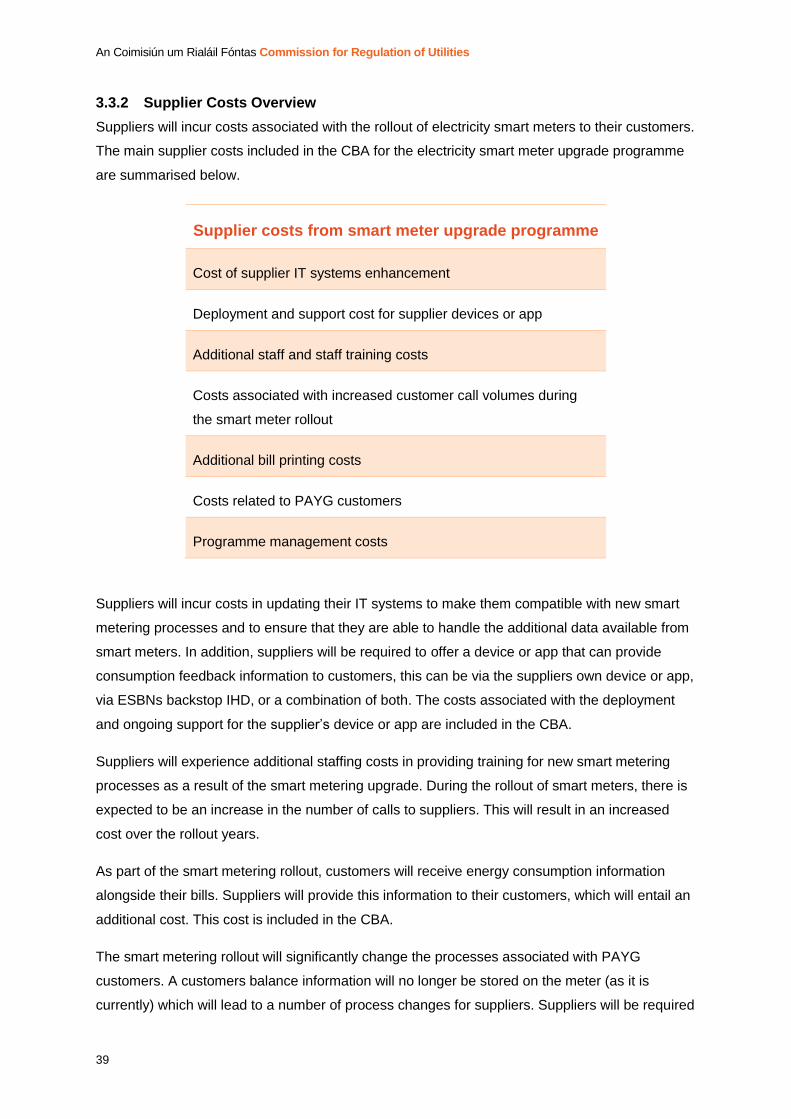
3.3.2 Supplier Costs Overview
Suppliers will incur costs associated with the rollout of electricity smart meters to their customers.
The main supplier costs included in the CBA for the electricity smart meter upgrade programme
are summarised below.
Supplier costs from smart meter upgrade programme
Cost of supplier IT systems enhancement
Deployment and support cost for supplier devices or app
Additional staff and staff training costs
Costs associated with increased customer call volumes during
the smart meter rollout
Additional bill printing costs
Costs related to PAYG customers
Programme management costs
Suppliers will incur costs in updating their IT systems to make them compatible with new smart
metering processes and to ensure that they are able to handle the additional data available from
smart meters. In addition, suppliers will be required to offer a device or app that can provide
consumption feedback information to customers, this can be via the suppliers own device or app,
via ESBNs backstop IHD, or a combination of both. The costs associated with the deployment
and ongoing support for the supplier’s device or app are included in the CBA.
Suppliers will experience additional staffing costs in providing training for new smart metering
processes as a result of the smart metering upgrade. During the rollout of smart meters, there is
expected to be an increase in the number of calls to suppliers. This will result in an increased
cost over the rollout years.
As part of the smart metering rollout, customers will receive energy consumption information
alongside their bills. Suppliers will provide this information to their customers, which will entail an
additional cost. This cost is included in the CBA.
The smart metering rollout will significantly change the processes associated with PAYG
customers. A customers balance information will no longer be stored on the meter (as it is
currently) which will lead to a number of process changes for suppliers. Suppliers will be required

An Coimisiún um Rialáil Fóntas Commission for Regulation of Utilities
40
to send customers their balance information and notifications related to disconnection and
reconnection of supply10. These additional communications will incur a cost for suppliers.
Suppliers will also incur management costs associated with participating in the electricity smart
metering upgrade. These costs have been included in the CBA.
Sources and assumptions
The inputs required for the calculation of these benefits were provided by suppliers. The inputs
provided by all suppliers were compared against each other and international benchmarks to
decide the final CBA inputs. Suppliers provided their own benefit inputs, which were applied to
their own customer base. Where an input was not received by a supplier, CRU provided an
assumed value based upon other suppler inputs and internal benchmarks11.
Assumed Value
The assumed value for Suppliers of each cost component is outlined below.
Table 16 Supplier Costs
Component Input
CAPEX IT €38,087,392
OPEX IT €23,950,701
Replacement of CAPEX €14,422,734
Supplier service/device costs
Real time data app deployment €1,803,810
Real time data app ongoing support €3,076,627
D+1 data app deployment €624,866
D+1 data app ongoing support €1,706,812
10 As set out in the CRU decision on smart PAYG - https://www.cru.ie/wp-content/uploads/2015/07/CER15271-Smart-Pay-As-You-Go.pdf 11 It should be noted that the values (both costs and benefits) attributable to suppliers are subject to change and have a high level of sensitivity. This is because the majority of the costs will not be known until smart meters are installed and suppliers will develop their business plans as the impact of smart meters become apparent.
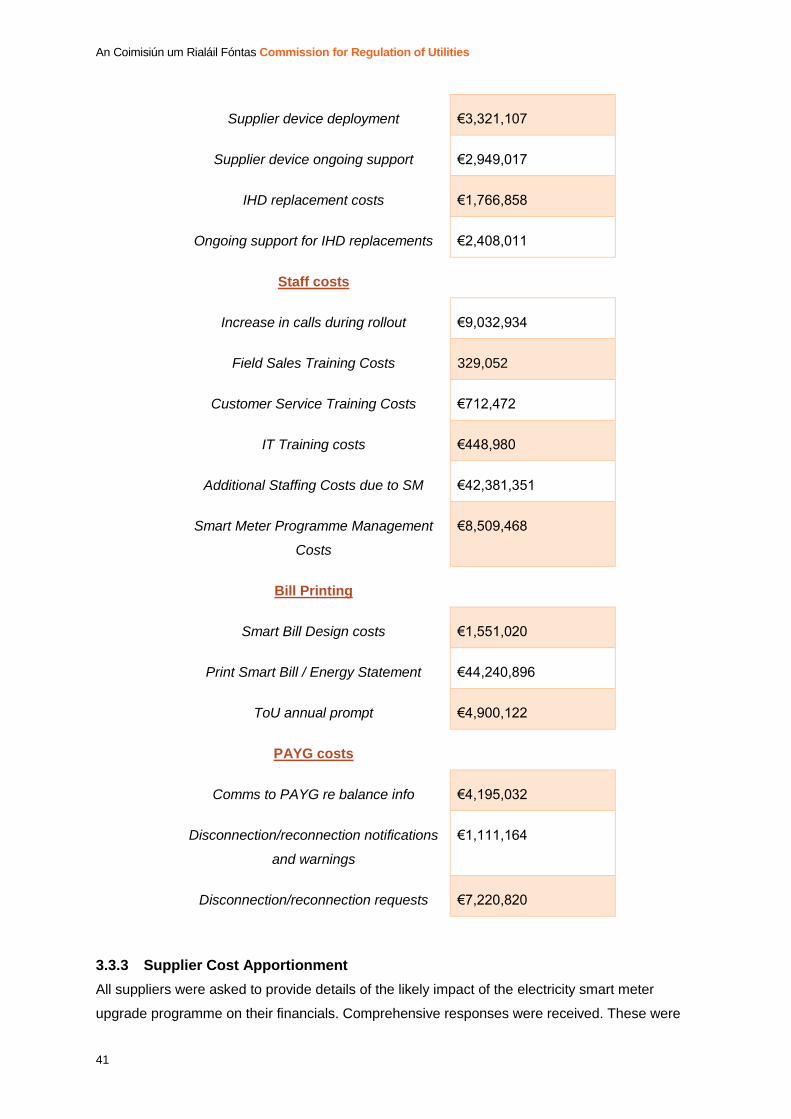
An Coimisiún um Rialáil Fóntas Commission for Regulation of Utilities
41
Supplier device deployment €3,321,107
Supplier device ongoing support €2,949,017
IHD replacement costs €1,766,858
Ongoing support for IHD replacements €2,408,011
Staff costs
Increase in calls during rollout €9,032,934
Field Sales Training Costs 329,052
Customer Service Training Costs €712,472
IT Training costs €448,980
Additional Staffing Costs due to SM €42,381,351
Smart Meter Programme Management
Costs
€8,509,468
Bill Printing
Smart Bill Design costs €1,551,020
Print Smart Bill / Energy Statement €44,240,896
ToU annual prompt €4,900,122
PAYG costs
Comms to PAYG re balance info €4,195,032
Disconnection/reconnection notifications
and warnings
€1,111,164
Disconnection/reconnection requests €7,220,820
3.3.3 Supplier Cost Apportionment
All suppliers were asked to provide details of the likely impact of the electricity smart meter
upgrade programme on their financials. Comprehensive responses were received. These were

An Coimisiún um Rialáil Fóntas Commission for Regulation of Utilities
42
reviewed against each other and international benchmarks to feed into the model. Where no
input was received for a cost CRU used international benchmarks and other supplier inputs to
add an assumed cost. The costs per supplier was inputted according to electricity market share.
The division of electricity market share assumed is outlined below. Note this was taken at a point
in time (end of 2015)12
Table 17 Supplier Current Electricity Market Share
Supplier EI BGE SSE Energia PPP Pinergy
Market
Share 58.78% 14.50% 15.85% 5.22% 4.67% 0.98%
It is recognised that market share will change over the 20 year period that the CBA is run and
that new suppliers will enter the market. However, for the purpose of this CBA the above market
share has been assumed for the duration of the model run.
3.3.4 Supplier Services
Under the electricity smart metering upgrade suppliers are obliged to provide a consumption
feedback tool for their customers. This can be though their own service in the form of an app or
device, or suppliers can avail of ESBN’s backstop MIHD.
The assumed uptake division of consumption feedback tools by residential customers is outlined
below. The division of residential customers using each feedback method is based upon supplier
submissions.
Table 18 Assumed Uptake of Consumption Feedback Tools
Consumption Feedback Tool Percentage Uptake
Proportion of residential customers using
supplier service (app) with real time
consumption data
19%
Proportion of residential customers using
supplier service (app) with D+1
consumption data
49%
12 https://www.cru.ie/wp-content/uploads/2016/07/CER16149-Retail-Markets-Annual-Report-2015.pdf

An Coimisiún um Rialáil Fóntas Commission for Regulation of Utilities
43
Proportion of residential customers using
supplier device 11%
Proportion of residential customers using
IHD 20%
It should be noted that the division in uptake only relates to residential customers. All SME
customers are assumed to use the supplier service (app) with D+1 consumption data. This is
based upon CRU policy not obligating suppliers to offer a device to SMEs.
3.4 Electricity Generation
Electricity generation is assumed to occur no cost from the rollout of electricity smart meters. It is
assumed the electricity smart metering upgrade will result in a net benefit for electricity
generation.
3.4.1 Generation System Benefits Overview
The change in consumer energy consumption due to the electricity smart metering upgrade
results in a number of wider generation system benefits. The main generation benefits included
in the CBA for the smart metering upgrade are summarised below.
Generation system benefits from smart metering
upgrade
Reduced generation capacity requirements due to a reduction in
peak demand
Reduction in System Marginal Price (SMP) due to a reduction in
electricity consumption and peak shifting
As outlined in the section on consumer benefits. The deployment of electricity smart meters, ToU
tariffs and other programme elements is expected to result in a change in electricity consumption
patterns. Electricity consumption at peak times is expected to reduce, resulting in a reduction in
overall system peak demand. Consequently, the requirement for generation capacity to meet
peak demand will be lower. The reduction in generation capacity requirement represents a
benefit in the CBA.

An Coimisiún um Rialáil Fóntas Commission for Regulation of Utilities
44
The change in consumption patterns, particularly the overall reduction in residential consumption,
would reduce wholesale demand to lead to a change in the SMP of electricity. The reduction in
demand is expected to lead to a reduction in prices, as high price generation is required less
frequently. This will reduce the overall cost of electricity for all market participants, representing a
benefit in the CBA.
Sources and assumptions
The reduction in generation capacity is calculated using the peak consumption reduction from the
Irish smart meter CBT. The resulting reduction in MW capacity requirement is calculated based
upon the proportion of capacity that is for residential and SME consumption, and the penetration
of smart meters, their feedback mechanisms and ToU tariffs. The value of this is then calculated
using the Best New Entrant plant cost.
The reduction in SMP was modelled by CRU market modelling team, based on the consumption
change from the Irish smart meter CBT. The percentage reduction in SMP as a result of smart
metering is applied to the total value of all SEM purchases to calculate the total benefit.
Assumed Value
The assumed value for the electricity generation system of each cost component is outlined
below.
Table 19 Electricity Generation Assumptions
Component Input Rational
Capacity, all Island (2011)
MW 6,922MW
The most recent annual Wholesale
market capacity for the year
Best New Entry Plant cost (€
per KW per year (2016)) €71.45/kW capacity
CRU – Pass through costs for Business
Electricity Customers from 1st October
201613
Residential share of capacity
pot 36%
The most up-to-date statistic on the
proportion of residential demand
comprising the capacity pot
13 https://www.cru.ie/wp-content/uploads/2016/07/CER16308-Pass-through-costs-for-business-electricity-customers-from-1st-October-2016.pdf

An Coimisiún um Rialáil Fóntas Commission for Regulation of Utilities
45
ROI share of capacity pot 75%
The most up-to-date statistic on the
proportion of the capacity pot
attributable to ROI Demand
SME share of Pot 12%
Ratio of SME/Residential consumption
in 2017 multiplied by residential share of
capacity pot (36%). This is based upon
SEMO reports.
Value of total SEM
purchases per annum (2011) €2,383,682,352/year
Value of electricity consumer by
residential households in 2011.
Reduction in SMP due to
consumption change from
smart metering
1.3%
Reduction if all customers see full
benefit of smart metering. The output of
the market simulation model in which
Energy reduction attributable to smart
metering impacts on the SMP
3.5 Consumers
Consumers are assumed to obtain the greatest benefit from the rollout of electricity smart
meters. This is due to the high value of benefits they are assumed to gain in comparison to the
relatively low costs they will occur with electricity smart meters. This is outlined in the following
section. Which is subdivided into the following categories:
- Consumer benefits overview
- Consumer costs overview
3.5.1 Consumer Benefits Overview
The main consumer benefits included in the CBA for the electricity smart meter upgrade
programme are summarised below.
Consumers main benefits from smart meter upgrade
programme
Reduced electricity bills due to consumption change from
feedback and ToU tariffs
Time saving due to remote meter readings

An Coimisiún um Rialáil Fóntas Commission for Regulation of Utilities
46
The deployment of electricity smart meters alongside other programme elements such as
feedback on consumption and ToU tariffs is expected to provide benefits to consumers.
Feedback upon energy use via a device or app can give consumers greater visibility of their
consumption. This will facilitate consumers in reducing their overall consumption. Additionally,
the introduction of ToU tariffs will encourage consumers to shift their consumption to off-peak
times. A further benefit that smart meters are assumed to provide consumers is a time saving
benefit of no longer having to submit manual meter readings and no longer having estimated
bills.
Sources and assumptions
Feedback on consumption and ToU tariffs are the elements of the programme that are expected
to lead to the shift in consumer consumption. Feedback on consumer consumption can be ‘near
real time’ via a device in the home (IHD or supplier device), or provided by suppliers via a web
based application that displays the previous days consumption (this is referred to as D+1
consumption data). The supplier app is assumed to enable a consumer to analyse their typical
consumption profile at different aggregated levels (daily, weekly, monthly etc.) and provide
comparison in consumption.
The assumption on consumer consumption change with the various programme elements is
based on the Irish Smart Meter Consumer Behaviour Trials (CBT)14 and a literature review of
international trials and programmes. The assumption on uptake of these programme elements is
based on a literature review of international trials and programmes and input from suppliers.
These assumptions are detailed in the succeeding tables.
Table 20: CBA model assumptions on deployment levels for different programme elements
Deployment level Assumption
Smart Meter 95%
Assume 5% do not have a smart meter
installed. Based upon penetration rates in
international rollouts.
Smart meter
communications 95%
Assume 5% of installed meters do not have
functioning communications. Based upon an
14 https://www.cru.ie/document_group/smart-metering-cost-benefit-analysis-and-trials-findings-reports/

An Coimisiún um Rialáil Fóntas Commission for Regulation of Utilities
47
estimate from ESBN. These meters cannot
receive smart services.
Time of Use
Tariffs
36% on a ToU tariff before
the end of flat tariffs; 95%
on a ToU tariff after the end
of flat tariffs
Assumption based upon the uptake
achieved in international voluntary and
mandatory ToU trials and rollouts.
Feedback
device or app 92%
Assume that both a device and app will not
be feasible for 3% of households15
Table 21: CBA model assumptions on electricity consumption change with smart metering and other programme elements
Consumption Change
with ToU
Consumption change
with ToU and ‘near real
time’ feedback
Consumption change
with ToU and D+1
feedback
Peak -8.15% -9.93% -9.75%
Day -2.60% -3.09% -3.04%
Night -0.36% +0.86% +0.74%
Based on the Irish Smart Meter CBT results for
Tariff A during the second 6 months of the trial
Assumed that D+1
captures 90% of ‘near
real-time’ benefit
In terms of consumption change as a result of additional feedback, D+1 data is assumed to
capture 90% of the ‘near real time’ benefit16. For SMEs it is assumed that they change their
consumption patterns to the same level as residential consumers as a result of electricity smart
metering. The Irish Smart meter CBT did not produce statistically significant enough results for
SME consumption change. However, research form the literature review and the CRU Annual
Consumer Survey17 found SME consumers to be more responsive than residential consumers to
15 It is assumed in the CBA that 15% of properties have no home internet (Irish Central Statistics Office: Households without a computer connected to the internet 2015) and that 19% are HAN infeasible (ESBN estimate). It is therefore assumed that 3% are both HAN infeasible and have no home internet. 16 Advanced Metering Initiatives and Residential Feedback Programs: A Meta-Review for Household Electricity-Saving Opportunities, American Council for an Energy-Efficient Economy, 2010 17 https://www.cru.ie/wp-content/uploads/2016/07/CER16264-Consumer-Survey-Report-2016.pdf

An Coimisiún um Rialáil Fóntas Commission for Regulation of Utilities
48
the consumption change signals electricity smart meters provide. Therefore, in the CBA a
conservative assumption has been used of SMEs achieving the same level of consumption
change as residential consumers did in the Irish smart meter CBT.
It is assumed that PAYG lifestyle consumers (PAYG that offers real time or D+1 feedback) have
already achieved consumption reduction benefits. Therefore no additional feedback related
benefit from smart meters has been included for these customers. There is, however, a peak
shifting benefit for these customers associated with the deployment of ToU tariffs.
The monetary benefit for consumers as a result of a change in energy consumption, is the
assumed reduction they will achieve in their energy bills. This benefit is calculated based upon
the assumed reduction proportioned to the assumed electricity cost (including generation costs
and distribution loses). The assumed electricity costs are outlined in the generation section.
3.5.2 Consumer Costs Overview
The CBA includes a small time cost to the consumer in learning about the electricity smart meter
and other programme elements.
Assumed Value
The main impact of smart meters on consumers is the value of time. Residential and SME
consumers are assumed to have different values. This coincides with the Public Spending Code
which identifies different time savings in terms of work and leisure. Whilst the Public Spending
Code does not stipulate how the value for each type of time should be calculated, it is noted that
leisure time, in comparison to work time, is generally valued at a cheaper rate. It is assumed that
for SMEs the time required to learn about smart meters would be work time. On the other hand
the time for residential consumer’s to learn about smart metres is assumed to be a mix of both
work and leisure time.
The key assumptions are outlined in the table below.
Table 22 Consumer Non Usage Parameters
Component Input Rational
Residential Time
Time to learn about smart meter
in year of install
0.41
hours/customer
Time cost to residential consumers for
learning about the smart meter.
Time to learn about IHD/supplier
device in year of install
0.41
hours/customer
Time cost to residential consumers for
learning about the MIHD/supplier device.
Time to learn about supplier app
in year of deployment
0.41
hours/customer
Time cost to residential consumers for
learning about the supplier app.

An Coimisiún um Rialáil Fóntas Commission for Regulation of Utilities
49
Average time to manually read
meter
0.0833
hours/read
Value based upon inputs form ESBN and
international benchmarks.
Average time to report meter
read
0.0500
hours/read
Value based upon inputs form ESBN and
international benchmarks.
Cost of consumer time € per
hour -€15.68/hour
Value based upon inputs form ESBN and
international benchmarks.
% meter site visits (meter
replacements, disconnections,
re-energisations etc.) that
require customer to be present
50%
Proportion of site visits (for meter
installation, disconnection, re-connection
etc.) that currently require the customer to
be present. Used to calculate the avoided
time benefit of customers with smart
meters as these activities can be done
remotely; negating the need for a site
visit.
Average length of meter site
visit for disconnections,
reconnections etc.
1 hour
Average length of site visit for
disconnection, re-connection etc. Used to
calculate the avoided time benefit of
customers with smart meters as these
activities can be done remotely; negating
the need for a site visit.
Average meter installation visit
length 1 hour
Value based upon inputs form ESBN and
international benchmarks.
Proportion of networks site visit
time that is a cost to the
consumer
50%
Factor to account for the fact that not all
of the site visit/installation time is a cost to
the average consumer.
SME Time
Time for SME to learn about
new tariffs, etc. in year of install 0.50 hours
Time cost to SME consumers for learning
about the smart meter and new services it
facilitates
Average time per SME avoided
making meter reads
0.0833
hours/read
Value based upon inputs form ESBN and
international benchmarks.
Average time per SME to report
meter read
0.0500
hours/read
Value based upon inputs form ESBN
and international benchmarks.
Cost of SME time € per hour -€31.36/hour Value based upon inputs form ESBN and
international benchmarks.
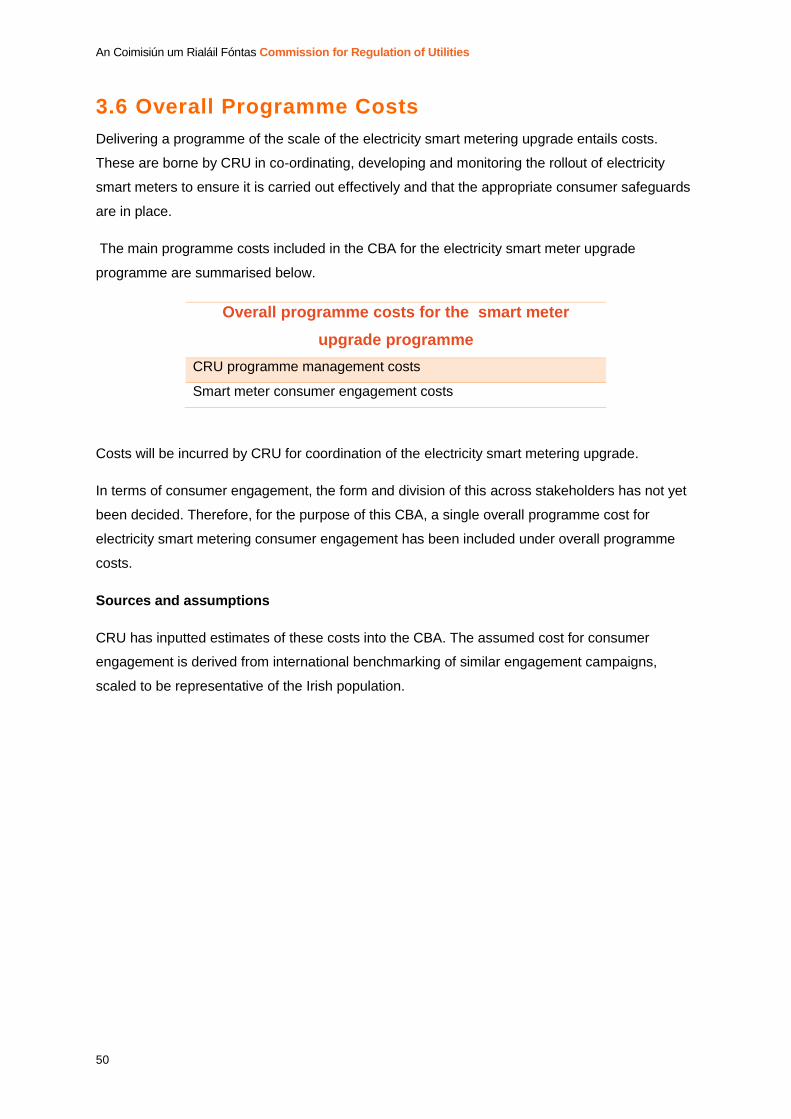
An Coimisiún um Rialáil Fóntas Commission for Regulation of Utilities
50
3.6 Overall Programme Costs
Delivering a programme of the scale of the electricity smart metering upgrade entails costs.
These are borne by CRU in co-ordinating, developing and monitoring the rollout of electricity
smart meters to ensure it is carried out effectively and that the appropriate consumer safeguards
are in place.
The main programme costs included in the CBA for the electricity smart meter upgrade
programme are summarised below.
Overall programme costs for the smart meter
upgrade programme
CRU programme management costs
Smart meter consumer engagement costs
Costs will be incurred by CRU for coordination of the electricity smart metering upgrade.
In terms of consumer engagement, the form and division of this across stakeholders has not yet
been decided. Therefore, for the purpose of this CBA, a single overall programme cost for
electricity smart metering consumer engagement has been included under overall programme
costs.
Sources and assumptions
CRU has inputted estimates of these costs into the CBA. The assumed cost for consumer
engagement is derived from international benchmarking of similar engagement campaigns,
scaled to be representative of the Irish population.
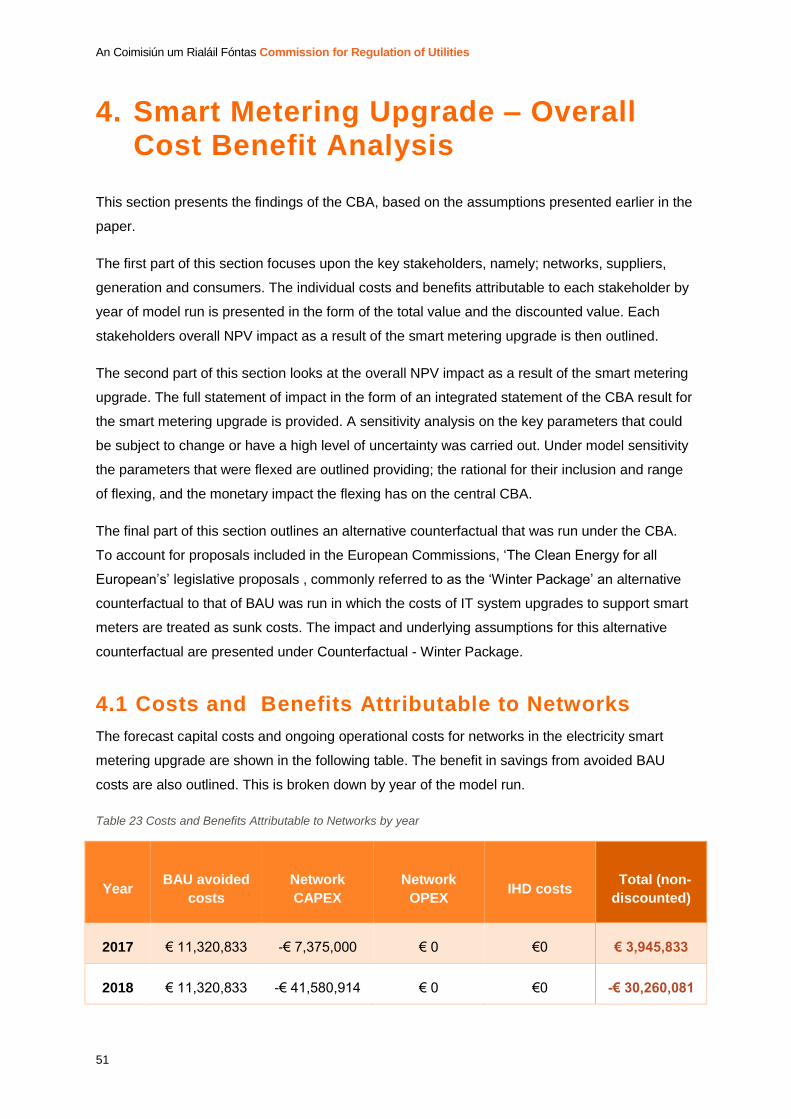
An Coimisiún um Rialáil Fóntas Commission for Regulation of Utilities
51
4. Smart Metering Upgrade – Overall Cost Benefit Analysis
This section presents the findings of the CBA, based on the assumptions presented earlier in the
paper.
The first part of this section focuses upon the key stakeholders, namely; networks, suppliers,
generation and consumers. The individual costs and benefits attributable to each stakeholder by
year of model run is presented in the form of the total value and the discounted value. Each
stakeholders overall NPV impact as a result of the smart metering upgrade is then outlined.
The second part of this section looks at the overall NPV impact as a result of the smart metering
upgrade. The full statement of impact in the form of an integrated statement of the CBA result for
the smart metering upgrade is provided. A sensitivity analysis on the key parameters that could
be subject to change or have a high level of uncertainty was carried out. Under model sensitivity
the parameters that were flexed are outlined providing; the rational for their inclusion and range
of flexing, and the monetary impact the flexing has on the central CBA.
The final part of this section outlines an alternative counterfactual that was run under the CBA.
To account for proposals included in the European Commissions, ‘The Clean Energy for all
European’s’ legislative proposals , commonly referred to as the ‘Winter Package’ an alternative
counterfactual to that of BAU was run in which the costs of IT system upgrades to support smart
meters are treated as sunk costs. The impact and underlying assumptions for this alternative
counterfactual are presented under Counterfactual - Winter Package.
4.1 Costs and Benefits Attributable to Networks
The forecast capital costs and ongoing operational costs for networks in the electricity smart
metering upgrade are shown in the following table. The benefit in savings from avoided BAU
costs are also outlined. This is broken down by year of the model run.
Table 23 Costs and Benefits Attributable to Networks by year
Year BAU avoided
costs
Network
CAPEX
Network
OPEX IHD costs
Total (non-
discounted)
2017 € 11,320,833 -€ 7,375,000 € 0 €0 € 3,945,833
2018 € 11,320,833 -€ 41,580,914 € 0 €0 -€ 30,260,081
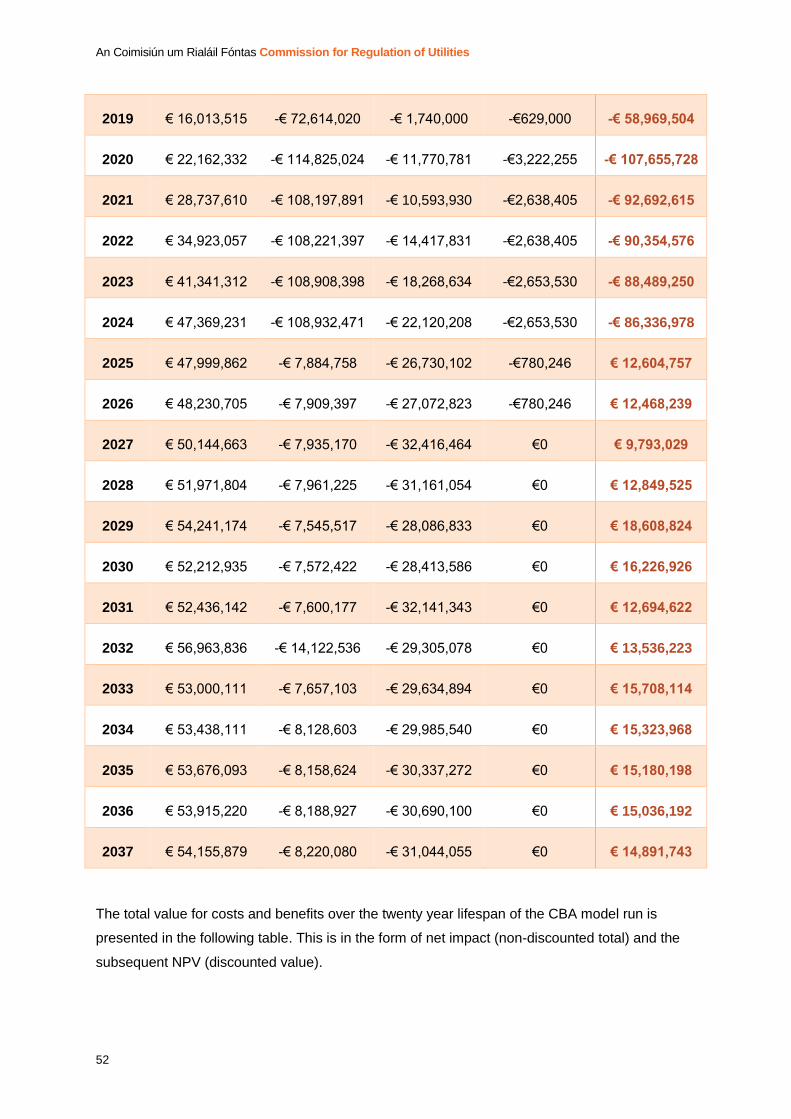
An Coimisiún um Rialáil Fóntas Commission for Regulation of Utilities
52
2019 € 16,013,515 -€ 72,614,020 -€ 1,740,000 -€629,000 -€ 58,969,504
2020 € 22,162,332 -€ 114,825,024 -€ 11,770,781 -€3,222,255 -€ 107,655,728
2021 € 28,737,610 -€ 108,197,891 -€ 10,593,930 -€2,638,405 -€ 92,692,615
2022 € 34,923,057 -€ 108,221,397 -€ 14,417,831 -€2,638,405 -€ 90,354,576
2023 € 41,341,312 -€ 108,908,398 -€ 18,268,634 -€2,653,530 -€ 88,489,250
2024 € 47,369,231 -€ 108,932,471 -€ 22,120,208 -€2,653,530 -€ 86,336,978
2025 € 47,999,862 -€ 7,884,758 -€ 26,730,102 -€780,246 € 12,604,757
2026 € 48,230,705 -€ 7,909,397 -€ 27,072,823 -€780,246 € 12,468,239
2027 € 50,144,663 -€ 7,935,170 -€ 32,416,464 €0 € 9,793,029
2028 € 51,971,804 -€ 7,961,225 -€ 31,161,054 €0 € 12,849,525
2029 € 54,241,174 -€ 7,545,517 -€ 28,086,833 €0 € 18,608,824
2030 € 52,212,935 -€ 7,572,422 -€ 28,413,586 €0 € 16,226,926
2031 € 52,436,142 -€ 7,600,177 -€ 32,141,343 €0 € 12,694,622
2032 € 56,963,836 -€ 14,122,536 -€ 29,305,078 €0 € 13,536,223
2033 € 53,000,111 -€ 7,657,103 -€ 29,634,894 €0 € 15,708,114
2034 € 53,438,111 -€ 8,128,603 -€ 29,985,540 €0 € 15,323,968
2035 € 53,676,093 -€ 8,158,624 -€ 30,337,272 €0 € 15,180,198
2036 € 53,915,220 -€ 8,188,927 -€ 30,690,100 €0 € 15,036,192
2037 € 54,155,879 -€ 8,220,080 -€ 31,044,055 €0 € 14,891,743
The total value for costs and benefits over the twenty year lifespan of the CBA model run is
presented in the following table. This is in the form of net impact (non-discounted total) and the
subsequent NPV (discounted value).

An Coimisiún um Rialáil Fóntas Commission for Regulation of Utilities
53
Table 24 Total Costs and Benefits Attributable to Networks
Total BAU avoided
costs
Network
CAPEX Network OPEX IHD costs Overall
Non-
Discounted € 895,575,259 -€ 779,539,655 -€ 465,930,529 -€15,995,615 -€ 365,890,540
Discounted
(NPV) €499,052,983 -€597,019,152 -€247,222,411 -€12,488,881 -€357,677,461
Based on the assumptions presented earlier in the document, networks are impacted negatively
to the amount of €366 million in nominal terms. The equivalent NPV impact is negative €358
million.
4.2 Costs and Benefits Attributable to Suppliers
The table below shows the forecast cost and benefits attributable to suppliers for the electricity
smart metering upgrade. This is broken down by year of the model run.
Table 25 Costs and Benefits Attributable to Suppliers by year
Year Costs Benefits Total (non-
discounted)
Total NPV
(Discounted)
2017 €0 €0 €0 €0
2018 -€13,986,017 €0 -€13,986,017 -€13,320,016
2019 -€32,889,049 €0 -€32,889,049 -€29,831,337
2020 -€24,897,077 €482,399 -€24,414,678 -€21,090,317
2021 -€13,666,508 €855,695 -€12,810,813 -€10,539,488
2022 -€16,153,777 €1,229,061 -€14,924,715 -€11,693,905
2023 -€18,783,717 €1,605,061 -€17,178,655 -€12,818,977
2024 -€21,408,643 €1,981,134 -€19,427,509 -€13,806,768
2025 -€16,681,455 €2,010,527 -€14,670,928 -€9,929,862

An Coimisiún um Rialáil Fóntas Commission for Regulation of Utilities
54
2026 -€16,463,170 €2,039,994 -€14,423,176 -€9,297,308
2027 -€15,311,298 €2,069,538 -€13,241,760 -€8,129,292
2028 -€15,443,922 €2,099,162 -€13,344,760 -€7,802,405
2029 -€15,564,113 €2,127,157 -€13,436,956 -€7,482,200
2030 -€15,688,068 €2,155,234 -€13,532,834 -€7,176,751
2031 -€15,814,230 €2,183,394 -€13,630,836 -€6,884,499
2032 -€16,105,602 €2,231,224 -€13,874,377 -€6,673,813
2033 -€16,177,781 €2,259,556 -€13,918,225 -€6,376,099
2034 -€16,297,131 €2,289,684 -€14,007,447 -€6,111,403
2035 -€16,434,340 €2,319,903 -€14,114,437 -€5,864,840
2036 -€16,570,154 €2,350,213 -€14,219,942 -€5,627,314
2037 -€16,706,408 €2,380,617 -€14,325,791 €0
2038 -€16,843,106 €2,411,116 -€14,431,990 €0
The total value for costs and benefits over the twenty year lifespan of the CBA model run is
presented in the table below. This is in the form of net impact (non-discounted total) and the
subsequent NPV (discounted value).
Table 26 Total Costs and Benefits Attributable to Suppliers
Total Costs Benefits Overall
Non-
Discounted -€367,885,565 €37,080,668 -€330,804,896
Discounted
(NPV) -€218,751,224.87 €18,294,633.00 -€200,456,591.87

An Coimisiún um Rialáil Fóntas Commission for Regulation of Utilities
55
Based on the assumptions presented earlier in the document, suppliers are impacted negatively
to the amount of €331 million in nominal terms. The equivalent NPV impact is negative €200
million.
4.3 Benefits Attributable to Generation
The table below shows the value of benefits associated with a reduction in the peak generation
capacity required and the SMP of electricity. This is broken down by year of the model run.
Table 27 Benefits Attributable to Generation by year
Year
Reduction in
Peak
Capacity
Reduction in
System Marginal
Price
Total (non-
discounted)
Total NPV
(Discounted)
2017 €0 €0 €0 €0
2018 €0 €0 €0 €0
2019 €0 €0 €0 €0
2020 €628,059 €4,557,390 €5,185,449 €4,479,386
2021 €1,714,977 €7,953,370 €9,668,347 €7,954,173
2022 €2,630,884 €11,249,376 €13,880,260 €10,875,547
2023 €3,518,916 €14,451,164 €17,970,080 €13,409,551
2024 €4,381,933 €17,552,518 €21,934,451 €15,588,405
2025 €4,800,896 €17,544,020 €22,344,916 €15,123,918
2026 €4,799,395 €17,535,804 €22,335,199 €14,397,469
2027 €8,929,535 €17,527,864 €26,457,399 €16,242,548
2028 €12,844,215 €17,520,192 €30,364,407 €17,753,440
2029 €12,837,437 €17,513,390 €30,350,827 €16,900,476
2030 €12,827,101 €17,506,820 €30,333,921 €16,086,726
2031 €12,817,021 €17,500,480 €30,317,501 €15,312,398
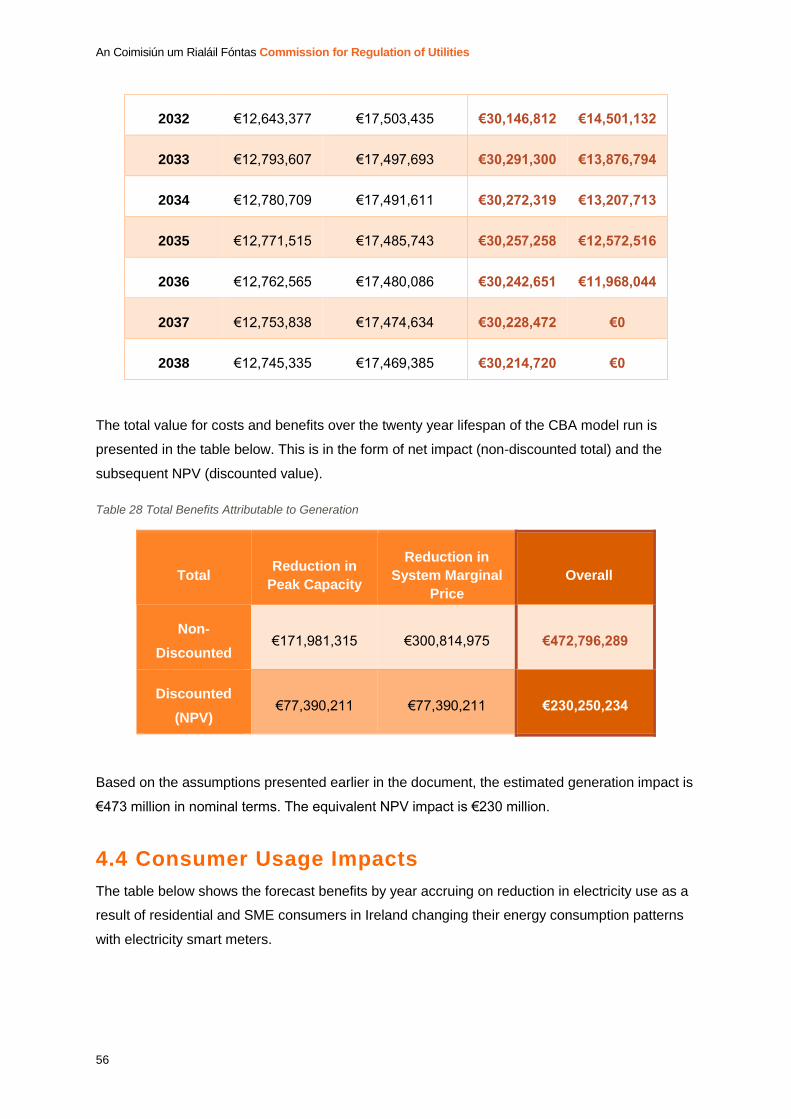
An Coimisiún um Rialáil Fóntas Commission for Regulation of Utilities
56
2032 €12,643,377 €17,503,435 €30,146,812 €14,501,132
2033 €12,793,607 €17,497,693 €30,291,300 €13,876,794
2034 €12,780,709 €17,491,611 €30,272,319 €13,207,713
2035 €12,771,515 €17,485,743 €30,257,258 €12,572,516
2036 €12,762,565 €17,480,086 €30,242,651 €11,968,044
2037 €12,753,838 €17,474,634 €30,228,472 €0
2038 €12,745,335 €17,469,385 €30,214,720 €0
The total value for costs and benefits over the twenty year lifespan of the CBA model run is
presented in the table below. This is in the form of net impact (non-discounted total) and the
subsequent NPV (discounted value).
Table 28 Total Benefits Attributable to Generation
Total Reduction in
Peak Capacity
Reduction in
System Marginal
Price
Overall
Non-
Discounted €171,981,315 €300,814,975 €472,796,289
Discounted
(NPV) €77,390,211 €77,390,211 €230,250,234
Based on the assumptions presented earlier in the document, the estimated generation impact is
€473 million in nominal terms. The equivalent NPV impact is €230 million.
4.4 Consumer Usage Impacts
The table below shows the forecast benefits by year accruing on reduction in electricity use as a
result of residential and SME consumers in Ireland changing their energy consumption patterns
with electricity smart meters.

An Coimisiún um Rialáil Fóntas Commission for Regulation of Utilities
57
Table 29 Forecast Electricity Reduction Benefits
Year
Number of
smart meters
installed
Proportion of
Benefit
Applicable
Effective
Benefit per
Connection
(kWh)
Aggregate
Reduction
Benefit (kWh)
2017 - 0% 0 0
2018 - 0% 0 0
2019 118,308 0% 0 0
2020 239,116 20% -32.2247 -16,575,740
2021 706,503 34% -56.1134 -51,228,751
2022 1,173,890 48% -78.5767 -103,055,073
2023 1,644,277 62% -100.222 -171,690,082
2024 2,114,664 76% -121.513 -256,958,159
2025 2,144,664 75% -120.629 -258,708,447
2026 2,174,664 75% -117.965 -256,534,644
2027 2,204,664 75% -114.734 -252,950,152
2028 2,234,664 75% -111.61 -249,410,383
2029 2,262,664 75% -108.591 -245,704,585
2030 2,290,664 75% -105.668 -242,050,600
2031 2,318,664 75% -102.838 -238,446,062
2032 2,346,664 75% -100.147 -235,010,551
2033 2,374,664 75% -97.4869 -231,498,635
2034 2,404,664 75% -94.9041 -228,212,384
2035 2,434,664 75% -92.3978 -224,957,618
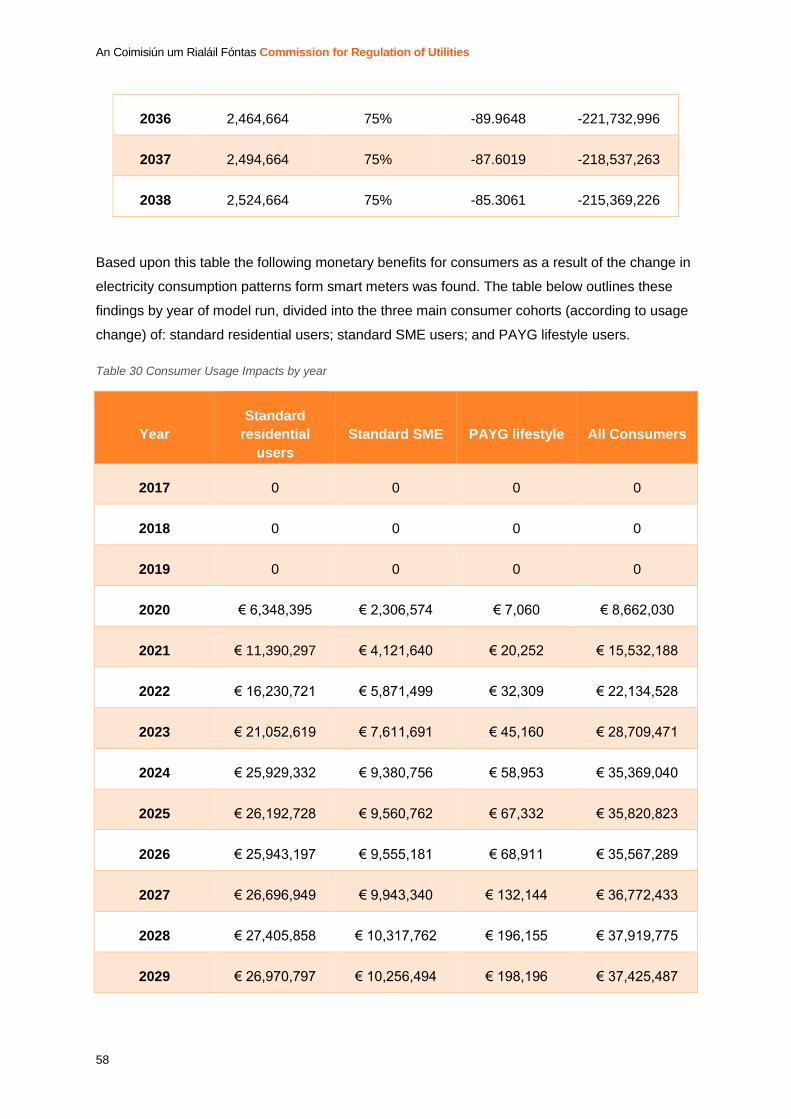
An Coimisiún um Rialáil Fóntas Commission for Regulation of Utilities
58
2036 2,464,664 75% -89.9648 -221,732,996
2037 2,494,664 75% -87.6019 -218,537,263
2038 2,524,664 75% -85.3061 -215,369,226
Based upon this table the following monetary benefits for consumers as a result of the change in
electricity consumption patterns form smart meters was found. The table below outlines these
findings by year of model run, divided into the three main consumer cohorts (according to usage
change) of: standard residential users; standard SME users; and PAYG lifestyle users.
Table 30 Consumer Usage Impacts by year
Year
Standard
residential
users
Standard SME PAYG lifestyle All Consumers
2017 0 0 0 0
2018 0 0 0 0
2019 0 0 0 0
2020 € 6,348,395 € 2,306,574 € 7,060 € 8,662,030
2021 € 11,390,297 € 4,121,640 € 20,252 € 15,532,188
2022 € 16,230,721 € 5,871,499 € 32,309 € 22,134,528
2023 € 21,052,619 € 7,611,691 € 45,160 € 28,709,471
2024 € 25,929,332 € 9,380,756 € 58,953 € 35,369,040
2025 € 26,192,728 € 9,560,762 € 67,332 € 35,820,823
2026 € 25,943,197 € 9,555,181 € 68,911 € 35,567,289
2027 € 26,696,949 € 9,943,340 € 132,144 € 36,772,433
2028 € 27,405,858 € 10,317,762 € 196,155 € 37,919,775
2029 € 26,970,797 € 10,256,494 € 198,196 € 37,425,487
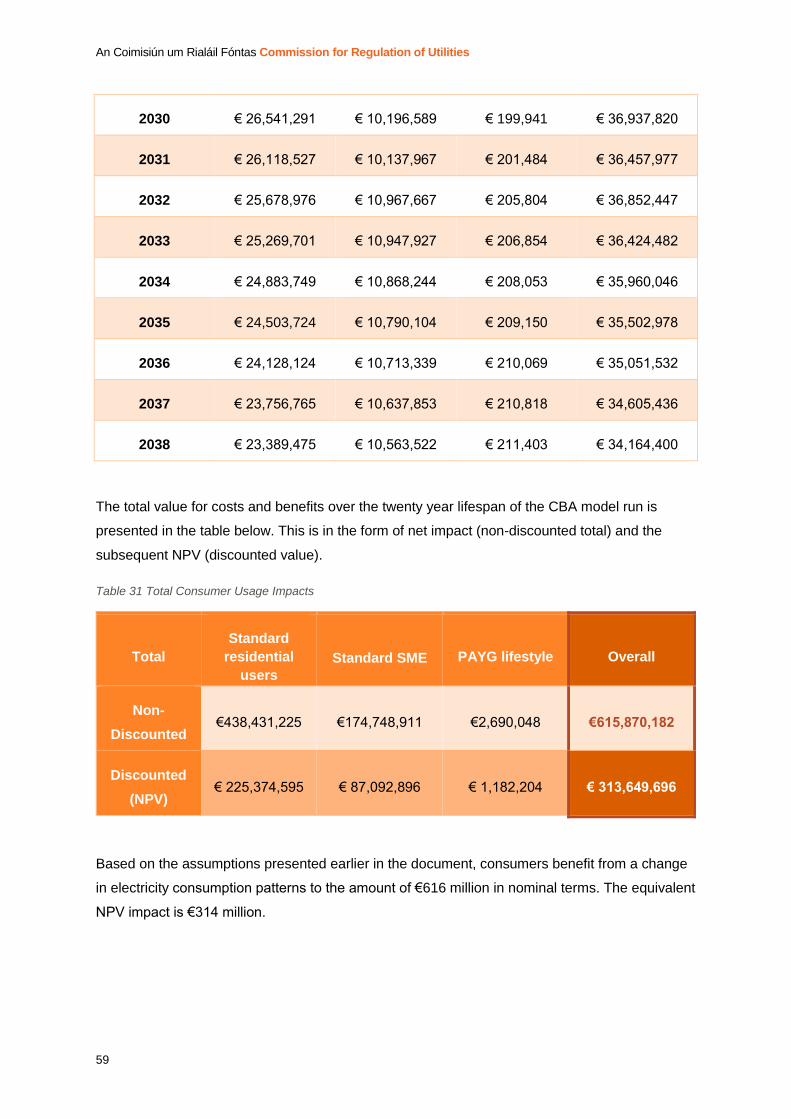
An Coimisiún um Rialáil Fóntas Commission for Regulation of Utilities
59
2030 € 26,541,291 € 10,196,589 € 199,941 € 36,937,820
2031 € 26,118,527 € 10,137,967 € 201,484 € 36,457,977
2032 € 25,678,976 € 10,967,667 € 205,804 € 36,852,447
2033 € 25,269,701 € 10,947,927 € 206,854 € 36,424,482
2034 € 24,883,749 € 10,868,244 € 208,053 € 35,960,046
2035 € 24,503,724 € 10,790,104 € 209,150 € 35,502,978
2036 € 24,128,124 € 10,713,339 € 210,069 € 35,051,532
2037 € 23,756,765 € 10,637,853 € 210,818 € 34,605,436
2038 € 23,389,475 € 10,563,522 € 211,403 € 34,164,400
The total value for costs and benefits over the twenty year lifespan of the CBA model run is
presented in the table below. This is in the form of net impact (non-discounted total) and the
subsequent NPV (discounted value).
Table 31 Total Consumer Usage Impacts
Total
Standard
residential
users
Standard SME PAYG lifestyle Overall
Non-
Discounted €438,431,225 €174,748,911 €2,690,048 €615,870,182
Discounted
(NPV) € 225,374,595 € 87,092,896 € 1,182,204 € 313,649,696
Based on the assumptions presented earlier in the document, consumers benefit from a change
in electricity consumption patterns to the amount of €616 million in nominal terms. The equivalent
NPV impact is €314 million.

An Coimisiún um Rialáil Fóntas Commission for Regulation of Utilities
60
4.5 Consumer Non-Usage Impacts
The table below shows the value of time impacts and IHD energy costs of smart metering on
residential households and SMEs. This is broken down by year of the model run.
Table 32 Consumer Non-Usage Impacts by year
Year Total Time
Cost
Total Time
Benefit
IHD Energy
Costs
2017 €0 €438,202 €0
2018 €0 €438,202 €0
2019 -€1,293,509 €438,202 €0
2020 -€7,352,946 €985,278 -€75,343
2021 -€6,718,496 €1,408,920 -€133,724
2022 -€6,719,798 €1,832,481 -€192,104
2023 -€6,757,269 €2,258,975 -€250,924
2024 -€6,758,602 €2,685,356 -€309,743
2025 €0 €2,725,478 -€314,138
2026 €0 €2,757,291 -€318,532
2027 €0 €2,789,133 -€322,926
2028 €0 €2,821,005 -€327,320
2029 €0 €2,850,920 -€331,421
2030 €0 €2,880,866 -€335,523
2031 €0 €2,910,843 -€339,624
2032 €0 €2,945,418 -€343,725
2033 €0 €2,975,461 -€347,827
2034 €0 €3,007,525 -€352,221

An Coimisiún um Rialáil Fóntas Commission for Regulation of Utilities
61
2035 €0 €3,039,621 -€356,615
2036 €0 €3,071,752 -€361,009
2037 €0 €3,103,917 -€365,403
2038 €0 €3,136,116 -€369,798
The total value for costs and benefits over the twenty year lifespan of the CBA model run is
presented in the table below. This is in the form of net impact (non-discounted total) and the
subsequent NPV (discounted value).
Table 33 Total Consumer Non-Usage Impacts
Total Total Time
Cost Total Time
Benefit
IHD Energy
Costs Overall
Non-
Discounted -€ 35,600,621 € 51,500,962 -€5,747,919 € 10,152,422
Discounted
(NPV) -€ 28,163,054 € 26,433,048 -€2,843,978 -€ 4,573,984
Based on the assumptions presented earlier in the document the consumer non-usage impact of
the electricity smart meter upgrade is €10 million in nominal terms. The equivalent NPV impact
being negative €5 million. This constitutes both costs and benefits. Consumers benefit from time
savings to the amount of €52 million in nominal terms. The equivalent NPV impact is €26 million.
In terms of the cost of time consumers are negativity impacted by the rollout of smart meters to
the amount of negative €36 million in nominal terms. The equivalent NPV impact is negative €28
million. In terms of energy costs to power the IHD consumers are negatively impacted to the
value of €6 million. The equivalent NPV is negative €3 million.

An Coimisiún um Rialáil Fóntas Commission for Regulation of Utilities
62
4.6 Full Statement of Impact
The table below shows an integrated statement of the CBA result for the electricity smart
metering upgrade, based on the application of the assumptions described earlier in the paper.
Table 34 Integrated Statement of the CBA Result
Stakeholder Discounted (NPV)
Network Impact -€357,677,460.66
Supply side Impact -€200,456,591.87
Generation €230,250,233.76
Consumer Impact Usage €313,649,695.54
Consumer Impact Other -€4,573,983.82
Programme costs -€17,071,395.95
Total -€35,879,502.99
Using a 5% discount rate, the NPV for the electricity CBA in aggregate is negative €36 million.
It should be noted that the overall cost of the national smart metering upgrade is over €1 billion
and that there remains a number of unquantifiable benefits, which cannot, by their nature, be
included in the CBA at this time. Smart meters are also considered to play a key role in the
attainment of national energy policy objectives. Additionally, many of the costs provided for the
purpose of advising CBA assumptions are indicative only. Therefore the result should be
interpreted as broadly neutral.
In should further be noted that under an alternative counterfactual in which EU developments
(from the European Commission’s “The Clean Energy for All Europeans” legislative proposals)
would result in the IT systems costs associated with smart metering to being considered as sunk
costs, the NPV for the electricity smart metering upgrade is significantly improved. Under the EU
Clean Energy counterfactual, using a 5% discount rate, the NPV for the electricity CBA in
aggregate is €106 million. The assumptions and rational underlying this counterfactual are
explained later in this section.
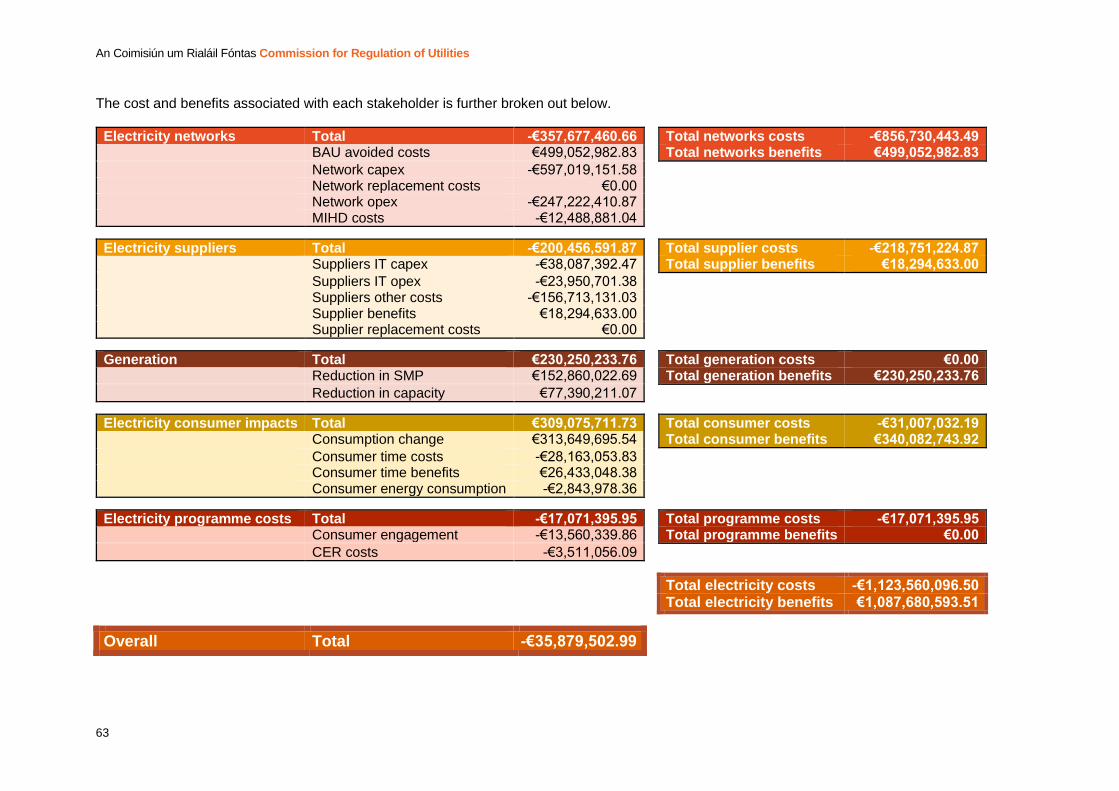
An Coimisiún um Rialáil Fóntas Commission for Regulation of Utilities
63
The cost and benefits associated with each stakeholder is further broken out below.
Electricity networks Total -€357,677,460.66 Total networks costs -€856,730,443.49 BAU avoided costs €499,052,982.83 Total networks benefits €499,052,982.83
Network capex -€597,019,151.58 Network replacement costs €0.00 Network opex -€247,222,410.87 MIHD costs -€12,488,881.04 Electricity suppliers Total -€200,456,591.87 Total supplier costs -€218,751,224.87 Suppliers IT capex -€38,087,392.47 Total supplier benefits €18,294,633.00
Suppliers IT opex -€23,950,701.38 Suppliers other costs -€156,713,131.03 Supplier benefits €18,294,633.00 Supplier replacement costs €0.00 Generation Total €230,250,233.76 Total generation costs €0.00 Reduction in SMP €152,860,022.69 Total generation benefits €230,250,233.76
Reduction in capacity €77,390,211.07 Electricity consumer impacts Total €309,075,711.73 Total consumer costs -€31,007,032.19 Consumption change €313,649,695.54 Total consumer benefits €340,082,743.92
Consumer time costs -€28,163,053.83 Consumer time benefits €26,433,048.38 Consumer energy consumption -€2,843,978.36 Electricity programme costs Total -€17,071,395.95 Total programme costs -€17,071,395.95 Consumer engagement -€13,560,339.86 Total programme benefits €0.00
CER costs -€3,511,056.09
Total electricity costs -€1,123,560,096.50
Total electricity benefits €1,087,680,593.51
Overall Total -€35,879,502.99
An Coimisiún um Rialáil Fóntas Commission for Regulation of Utilities
64
The CBA model is not-distributional in nature, i.e. no regard is had to how incremental costs or
benefits flow through the system. Nonetheless, it can be noted that ESBN and electricity
suppliers are negative in NPV terms. The scale of the net cost in the case of networks is very
substantial reflecting in large the assumed capital and operational costs of procuring, installing
and managing the meters and their associated communication system.
Both consumers and the generation side are net positive in aggregate reflecting the assumed
consumption change in overall reduction and peak shifting.
4.7 Model Sensitivity
In considering the CBA model result it is important to note its sensitivity to a number of
underlying assumptions.
A sensitivity analysis was conducted on key parameters that could be subject to change or have
a high level of uncertainty. The range is not intended to reflect the expected level of uncertainty
in the selected parameters. The standard level of change identifies inputs upon which the NPV is
most strongly dependant on; thus indicating which elements of the programme on the cost and
benefits sides, are most critical to the programmes overall success. The results are illustrated in
the table below in terms of change to NPV (negative €36 million) in millions. (Further detail on the
main sensitivities is provided in the appendix). For those assumptions with no specific high/low
uncertainty thresholds, a range of ±15% was used.

An Coimisiún um Rialáil Fóntas Commission for Regulation of Utilities
65
Table 35 Sensitivity Analysis: NPV change (in millions)
-42
-136
-45
-5
-14
-3
-37
-5
-119
0
0
0
-15
-14
-9
-40
-106
42
0
0
1
14
4
14
5
119
54
45
15
15
14
9
12
82
Meter cost (±€XX) [Base: €XX per meter]
Lenght of install visit
Network IT Costs
ToU non-enrolment after end of flat tariffs (3 / 10%) [Base: 5%]
MIHD/supplier information service refusal (2 / 8%) [Base: 5%]
HH Data Refusal (10 / 40%) [Base: 24%]
Proportion of real time feedback benefit that is captured by D+1 data (80 / 100%) [Base: 90%]
SME reduction with real time feedback (-2 / -3.29%) [Base: -2.86%]
Consumer responsiveness to ToU/IHD/supplier service (80 / 120%) [Base: 100%]
Additional benefits if EVs deployed as forecasted
No additional paper billing costs
Supplier devices/apps also deployed in BAU
Supplier IT costs (±15%) [Base: €38,087,392]
Supplier IT opex on existing systems (± 20%) [Base: €23,950,701]
Additional Supplier Staffing costs (±15%) [Base: €42,381,351]
Peak demand reduction (-3 / -12%) [Base: -9.93%]
Reduction in SMP benefits (0.4 / -2%) [Base: 1.3%]


An Coimisiún um Rialáil Fóntas Commission for Regulation of Utilities
66
From the sensitivity analysis, the elements that are most critical to the programme’s success can
be identified. They are as follows:
1. Meter and associated infrastructure costs: These cost will be dependent upon
procurement by ESBN. The meters and associated infrastructure represent the largest
proportion of capital spend for the smart meter upgrade programme. A slight change in
the cost of meter and install has a large impact upon the overall NPV due to scaling
across the whole meter population.
2. Consumer responsiveness: the level of overall consumption reduction and peak
shifting represents the largest benefit to the programme. It is assumed consumers will
react to the same level as was achieved in the CBT trails. A change in consumer
response to that assumed affects both anticipated consumer savings and generation
benefits, especially in relation to the potential reduction in SMP (due to a reduced peak).
An Coimisiún um Rialáil Fóntas Commission for Regulation of Utilities
68
4.8 Counterfactual – The European Commissions
‘Clean Energy for All Europeans’ legislative
proposal
An alternative counterfactual to that of BAU was run to account for the proposals included in the
European Commission’s “The Clean Energy for All Europeans” legislative proposals18. The
Clean Energy Package released in November 2016 proposed new provisions for electricity smart
metering, whereby a customer could request an electricity smart meter if they wanted one. Of
particular relevance is Chapter III Art 21 of the winter package which states:
Where smart metering is negatively assessed as a result of cost-benefit assessment
referred to in Article 19(2), nor systematically rolled out, Member States shall ensure that
every final customer is entitled to have installed or, where applicable, to have upgraded,
on request and under fair and reasonable conditions, a smart meter that complies with
the following requirements:
(a) is equipped where technically feasible with functionalities referred to in Article
20, or with a minimum set of functionalities to be defined and published by
Member States at national level and in line with the provisions in Annex III,
(b) is interoperable and able to deliver the desired connectivity of the metering
infrastructure with consumer energy management systems in near-real time19.
If these proposals are adopted, then Ireland will have to ensure provisions are in place for any
customer to have an electricity smart meter if they so desire. To enable this, irrespective of a
wide scale rollout of smart meters, the supporting smart metering IT system functionality would
have to be in place. Therefore, a counterfactual CBA has been run in which the costs of IT
system upgrades are treated as sunk costs.
In the counterfactual scenario the costs of IT system upgrades to support electricity smart meters
are treated as sunk costs and the following costs are excluded from the CBA:
Development of a Head End data collection system
18 https://ec.europa.eu/energy/en/news/commission-proposes-new-rules-consumer-centred-clean-energy-transition 19 https://ec.europa.eu/energy/sites/ener/files/documents/1_en_act_part1_v7_864.pdf

An Coimisiún um Rialáil Fóntas Commission for Regulation of Utilities
68
Development of a Meter Data Management System (MDMS) and its additional
enhancement
Upgrading of SPA-ISU Market Messaging System
Development and deployment of materials management system
Development of an IT Security System
A proportion of ESBNs AMI Programme Management (to include IT planning, design,
procurement, testing, install, integration and deployment)
Networks Operations Centre (NOC) annual running charge
Annual cost per meter of storing two years’ worth of half-hourly consumption data
In excluding the above costs, the NPV of the CBA improves; resulting in a positive NPV of
approximately €106 million.
Table 36 European Electricity Directive Counterfactual
Base Case NPV Winter package
counterfactual NPV Difference
Total NPV -€ 35,879,502.99 € 105,728,618.23 € 141,608,121.22
It is important to note the above figures for the counterfactual scenario only consider network
associated costs to be sunk. Costs on other stakeholders could also be considered to be sunk;
as, for example, other parties would also have to develop IT systems to support smart meters
under the aforementioned European proposal in the winter package. Including such costs could
further improve the NPV.
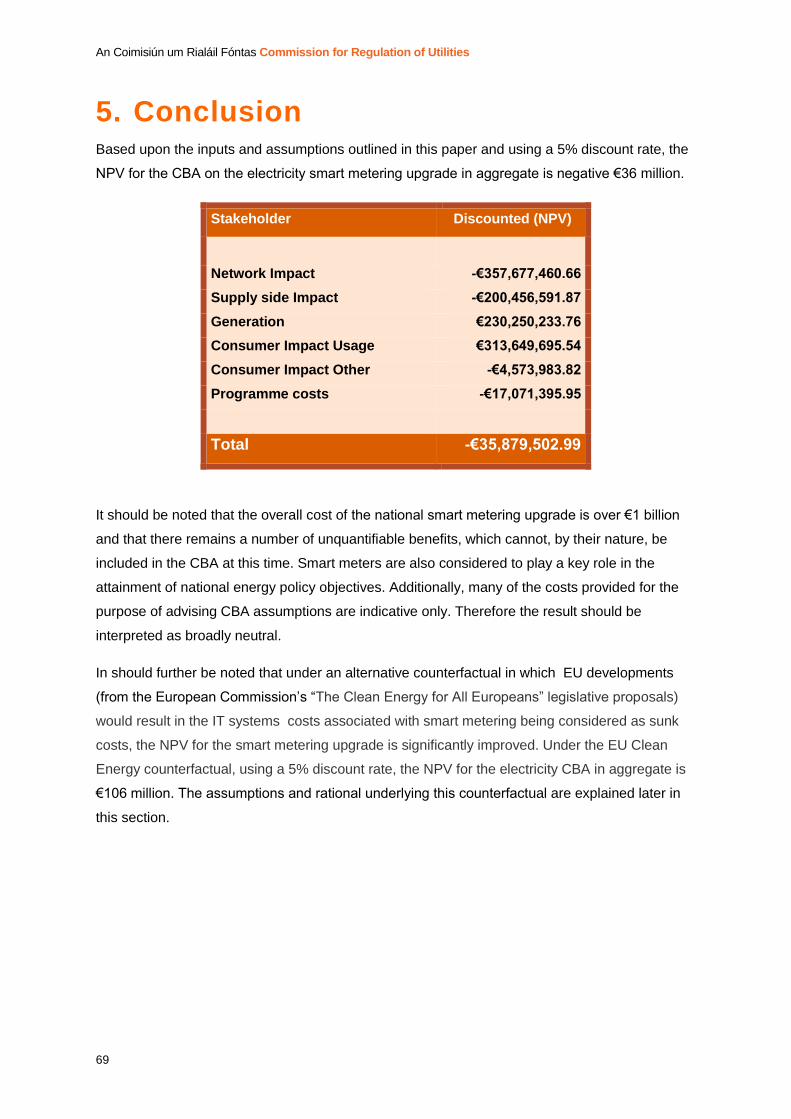
An Coimisiún um Rialáil Fóntas Commission for Regulation of Utilities
69
5. Conclusion Based upon the inputs and assumptions outlined in this paper and using a 5% discount rate, the
NPV for the CBA on the electricity smart metering upgrade in aggregate is negative €36 million.
Stakeholder Discounted (NPV)
Network Impact -€357,677,460.66
Supply side Impact -€200,456,591.87
Generation €230,250,233.76
Consumer Impact Usage €313,649,695.54
Consumer Impact Other -€4,573,983.82
Programme costs -€17,071,395.95
Total -€35,879,502.99
It should be noted that the overall cost of the national smart metering upgrade is over €1 billion
and that there remains a number of unquantifiable benefits, which cannot, by their nature, be
included in the CBA at this time. Smart meters are also considered to play a key role in the
attainment of national energy policy objectives. Additionally, many of the costs provided for the
purpose of advising CBA assumptions are indicative only. Therefore the result should be
interpreted as broadly neutral.
In should further be noted that under an alternative counterfactual in which EU developments
(from the European Commission’s “The Clean Energy for All Europeans” legislative proposals)
would result in the IT systems costs associated with smart metering being considered as sunk
costs, the NPV for the smart metering upgrade is significantly improved. Under the EU Clean
Energy counterfactual, using a 5% discount rate, the NPV for the electricity CBA in aggregate is
€106 million. The assumptions and rational underlying this counterfactual are explained later in
this section.

An Coimisiún um Rialáil Fóntas Commission for Regulation of Utilities
70
Appendix
Sensitivity Commentary
Reduction in SMP benefits (0.4 /
2%)
The reduction in residential demand due to smart
metering is expected to lead to a reduction in SMP, as
high price generation is required less frequently. This
will reduce the overall cost of electricity for all market
participants, increasing the generation benefits in the
CBA. This sensitivity flexes the predicted savings at
generation level between 0.4 - 2% based on ranges
provided by CER modelling. The baseline is a 1.3%
saving at generation level which was modelled by the
CER market modelling team, based on the
consumption change from the Irish smart metering
CBT. The reduction in SMP as a result of smart
metering is applied to the total value of all SEM
purchases to calculate the total benefit.
Peak demand reduction (-3 /-12%)
This varies the level of peak demand reduction that is
achieved as a result of smart metering. The base case
is -9.93%. Flexing this affects the generation and
consumer impact usage benefits.
Additional Supplier Staffing costs
(±15%)
The exact additional staffing costs Suppliers will incur
as a result of smart metering, as the shape of the
programme is still being developed. As such the
additional staffing costs they will face is uncertain. To
account for this level of uncertainty a sensitivity
analysis has been carried out of ±15% of the base
case value of €42,381,351.
Supplier IT Opex on existing
systems (±20%)
The exact costs Suppliers will incur on IT Opex in
updating their existing systems as a result of smart
metering is uncertain. It can be assumed for IT capex
items that are adaptions to existing systems. A certain
An Coimisiún um Rialáil Fóntas Commission for Regulation of Utilities
70
percentage of this Opex would be experienced in BAU.
The CBA assumed a value of 50% in BAU. However,
the exact value that suppliers would incur is uncertain.
To account for this level of uncertainty a sensitivity
analysis has been carried out of ±20% of the base
case value of €23,950,701.
Supplier IT costs (±15%)
The exact IT costs Suppliers will incur as a result of
smart metering as the shape of the programme is still
being developed. To account for this level of
uncertainty a sensitivity analysis has been carried out
of ±15% of the base case value of €38,087,392.
Supplier devices/apps also
deployed in BAU
Suppliers stated that they will provide devices/apps to
customers alongside the smart metering rollout. These
apps would link to the smart meter to provide
consumers with increased information on their energy
usage. Therefore in the base case the costs
associated with these are included. Under this
sensitivity it is assumed that the supplier cost of
developing a device /app would not be attributable to
smart metering, and as such would be excluded from
the CBA. Support for inclusion of this sensitivity is that
some suppliers stated they expect to be incurring
these cost regardless of the smart metering upgrade.
This sensitivity follows the assumption that suppliers
will be developing and providing their customers
innovative products as part of BAU as a way to
become more competitive and offer a better customer
experience.
An Coimisiún um Rialáil Fóntas Commission for Regulation of Utilities
70
No additional paper billing costs
Smart metering will require suppliers to provide
additional bills with increased information provision.
Under this scenario additional paper billing costs
submitted by Suppliers as a result of smart metering
would be excluded. It is assumed under this scenario
that the additional bills and features provided on bills
would be provided electronically. An increase in
paperless billing would reduce a significant proportion
of this cost.
Additional benefits if EVs
deployed as forecasted
Due to the uncertainty around the future of EVs. The
base case scenario does not account for additional
benefits arising if EVs are deployed as forecast. Under
this scenario EVs are deployed as forecasted by SEAI
(most conservative projections published by the
SEAI20). This increases the generation benefits smart
metering provides.
Consumer responsiveness to
ToU/IHD/supplier service (80 /
120%)
This affects both the generation and consumer impact
usage benefits. This scenario is included to account for
variations in that predicted by studies in consumer
response to the new services offered by smart
metering. The base case is 100% consumer
responsiveness.
SME reduction with real time
feedback (-2 / -3.29%)
The CBT did not provide statistically significant results
upon SME reduction. However, other sources of
research suggest that SMEs are more responsive to
smart metering in reducing their energy consumption
than residential customers. Therefore, in the base
case a conservative view upon SME energy reduction
was adopted. The base case is a reduction of -2.86%
based on overall consumption reduction achieved in
20 https://www.seai.ie/resources/publications/Electric-Vehicle-Roadmap.pdf
An Coimisiún um Rialáil Fóntas Commission for Regulation of Utilities
70
the Irish smart meter CBT for Tariff A with bimonthly
billing, energy statement and electricity monitor
(second 6 months of trial). Flexing this affects the
generation and consumer impact usage benefits.
Proportion of real time feedback
benefit that is captured by D+1
data (80 / 100%)
In the base case, apps with energy consumption
feedback based on next day (D+1) data are assumed
to capture 90% of the benefit of those based on real
time data. This is based on the study ‘Advanced
Metering Initiatives and Residential Feedback
Programs: A Meta-Review for Household Electricity-
Saving Opportunities, American Council for an Energy-
Efficient Economy, 2010’. To account for the
uncertainty around this figure, it has been flexed ±10%
from the base to ascertain the impact of variations in
response from that expected. Flexing this affects the
generation and consumer impact usage benefits.
HH Data Refusal (10 / 40%)
The Data Protection Act requires consumers to ‘opt-in’
to sharing their half-hourly data. Previous evidence on
responsiveness was based on the Consumer
Behaviour trails in which consumers had to actively
‘opt-out’ of sharing their half hourly data. The CBA has
been updated using figures obtained from other trails
in which consumers actively ‘opted-in’ to sharing their
half hourly data. Based on ‘Data privacy: What the
customer really thinks’, DMA report 2015. Reports
24% of UK customers are unwilling to provide personal
information in return for service enhancement. This
was used to provide a base case of 24% refusal rate.
However, to account for the uncertainty as to the level
of ‘opting-in’ by Irish consumers, the level of ‘opting-in’
has been flexed from 10% to 40%.
An Coimisiún um Rialáil Fóntas Commission for Regulation of Utilities
70
IHD/supplier information service
refusal (2 / 8%)
The base case is 5% of those with a smart meter will
refuse a IHD and/or supplier information service.
Flexing this affects to a small degree the costs
incurred by networks and suppliers. However, this is
outweighed by the impact it has on the benefits on
generation and consumer impact usage.
ToU non-enrolment after end of
flat tariffs (3 / 10%)
The base case is 5% based on enrolment achieved in
international mandatory ('opt-out') ToU programmes.
Flexing this affects the generation and consumer
impact usage benefits.
Network IT Costs
The exact costs ESBN will incur in updating, buying
and supporting IT systems for smart metering is
unknown at present. This exact figure will not be
obtainable until these systems are procured. Therefore
the base case uses best available estimated values
provided by ESBN. To account for the uncertainty
around these figures a sensitivity analysis has been
carried out flexing the potential for higher cost than
those submitted by ESBN at present. The increase in
costs was across all of ESBN’s IT costs based upon
potential high-end projections from ESBN.
Length of install visit
The cost of installing smart meters is higher under the
phased approach. This is because it is no longer a
geographically based rollout. To account for this the
base case value of installation is higher than previous
alternative plans. However, as the exact form of rollout
installation has not been decided, a sensitivity check
has been run to ascertain the impact of longer
installation times. The sensitivity analysis examined
the impact of doubling installation times across urban,
rural and SME installs.

An Coimisiún um Rialáil Fóntas Commission for Regulation of Utilities
70
Meter cost
The exact meter cost will not be known until
procurement. Therefore it is important to account for
the effect their cost has on the NPV. The base case
meter cost is based on best available estimates
provided by ESBN at a value of €XX per meter. This
value is flexed ±€XX in the sensitivity analysis.