Embed Size (px)
Citation preview
www.acea.auto Page 1 of 12
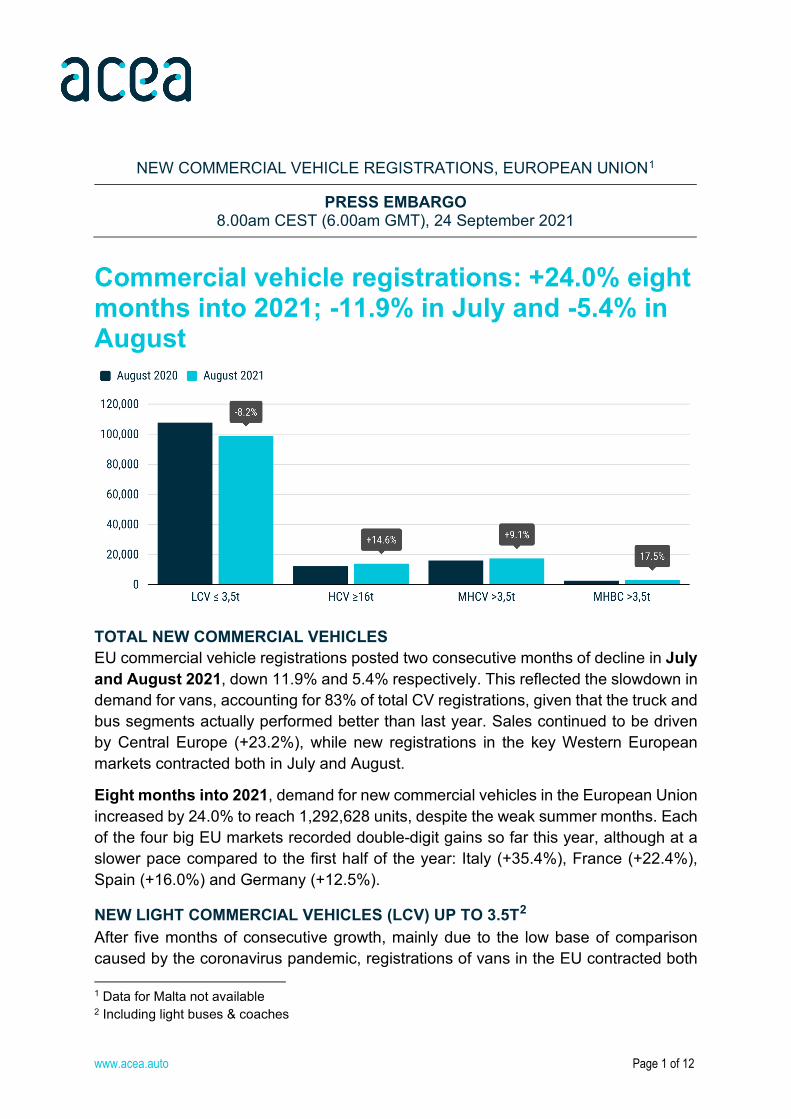
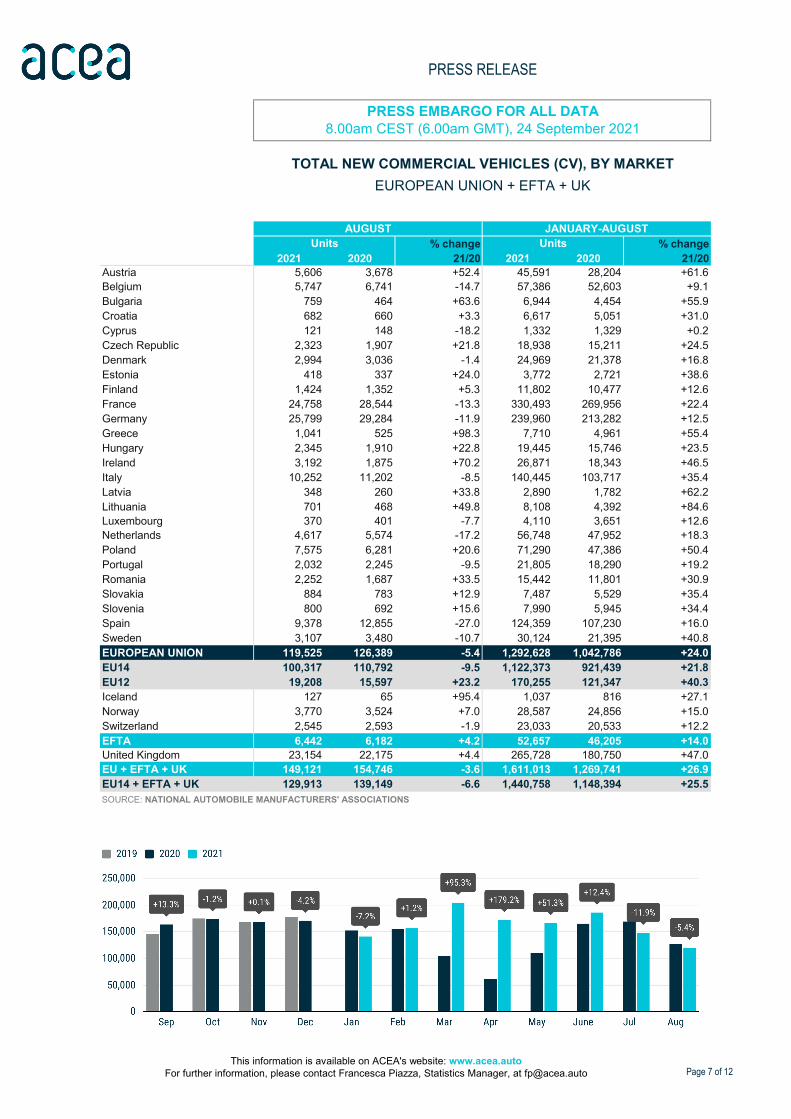
Commercial vehicle registrations: +24.0% eight months into 2021; -11.9% in July and -5.4% in August
TOTAL NEW COMMERCIAL VEHICLES EU commercial vehicle registrations posted two consecutive months of decline in July and August 2021, down 11.9% and 5.4% respectively. This reflected the slowdown in demand for vans, accounting for 83% of total CV registrations, given that the truck and bus segments actually performed better than last year. Sales continued to be driven by Central Europe (+23.2%), while new registrations in the key Western European markets contracted both in July and August.
Eight months into 2021, demand for new commercial vehicles in the European Union increased by 24.0% to reach 1,292,628 units, despite the weak summer months. Each of the four big EU markets recorded double-digit gains so far this year, although at a slower pace compared to the first half of the year: Italy (+35.4%), France (+22.4%), Spain (+16.0%) and Germany (+12.5%).
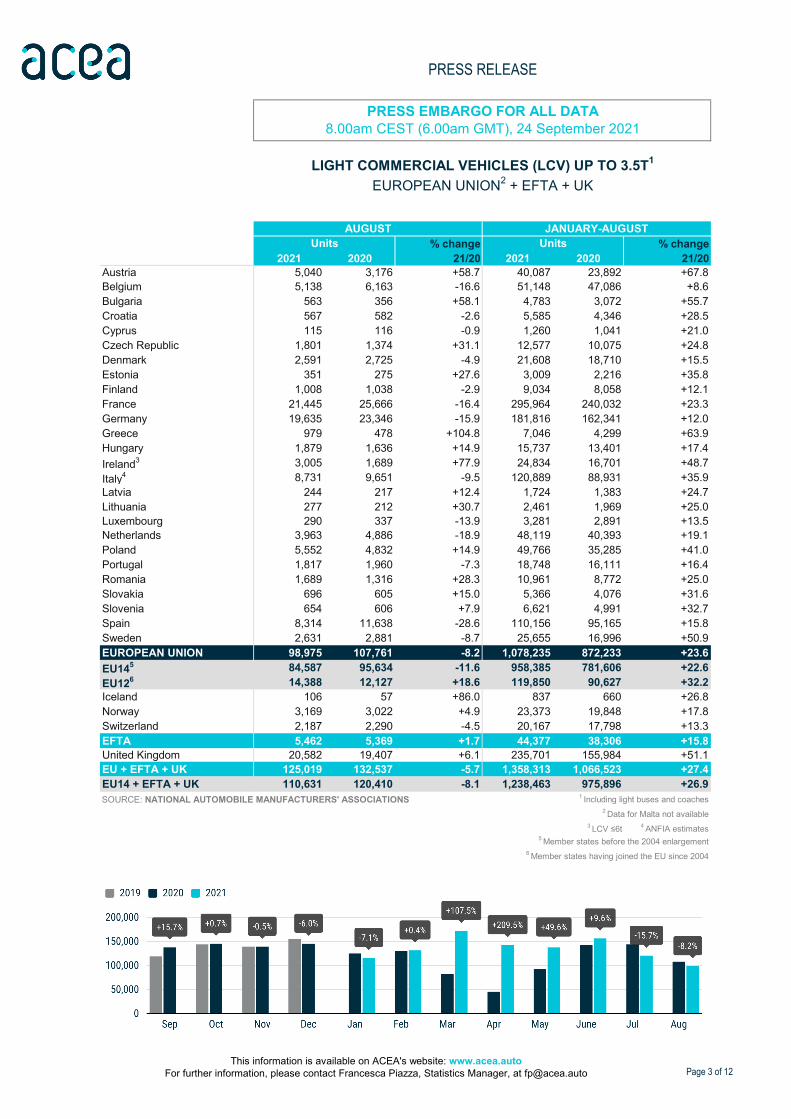
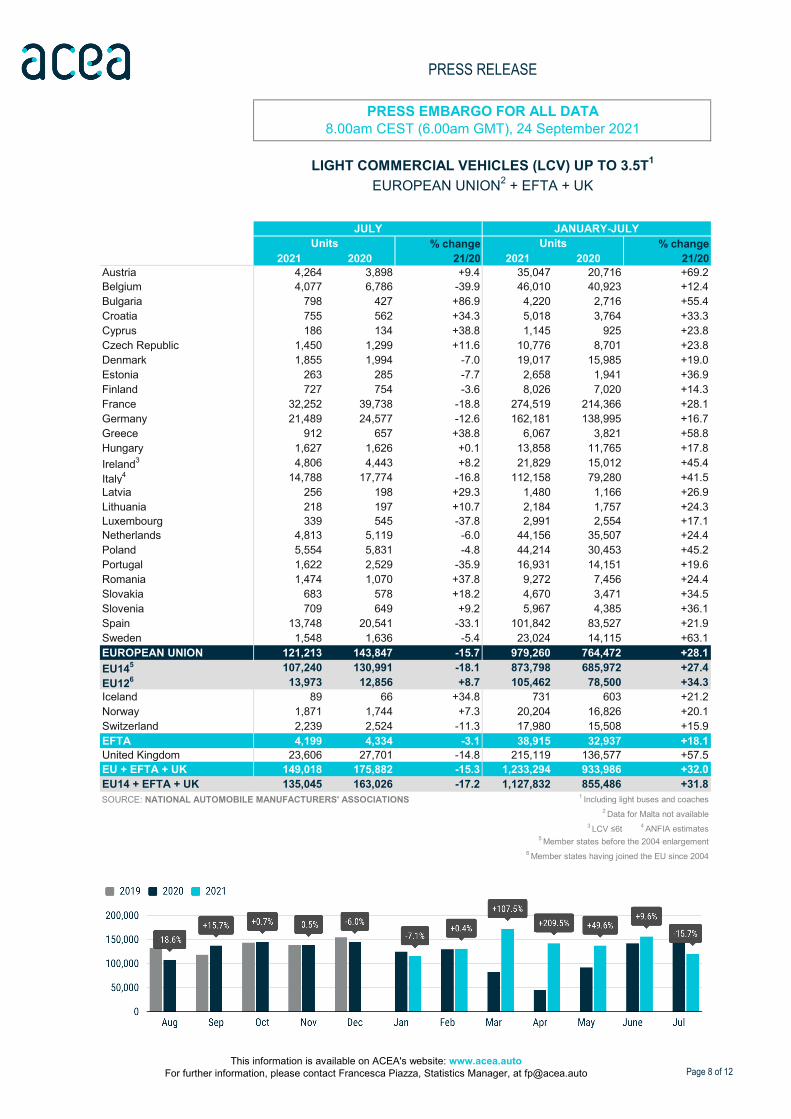
NEW LIGHT COMMERCIAL VEHICLES (LCV) UP TO 3.5T2 After five months of consecutive growth, mainly due to the low base of comparison caused by the coronavirus pandemic, registrations of vans in the EU contracted both
1 Data for Malta not available 2 Including light buses & coaches
NEW COMMERCIAL VEHICLE REGISTRATIONS, EUROPEAN UNION1
PRESS EMBARGO 8.00am CEST (6.00am GMT), 24 September 2021

www.acea.auto Page 2 of 12
in July (‐15.7%) and August (‐8.2%). As a result, the region’s major markets all posted notable declines during those last two months.
Over the first eight months of 2021, demand for new light commercial vehicles across the EU remained positive (+23.6%), still benefiting from the substantial gains recorded earlier this year and bringing the total to 1,078,235 units. The same applies for the key EU markets, with all four posting growth so far in 2021: Italy (+35.9%), France (+23.3%), Spain (+15.8%) and Germany (+12.0%).
NEW HEAVY COMMERCIAL VEHICLES (HCV) OF 16T AND OVER3 August 2021 results again show a double-digit increase (+14.6%) in EU demand for heavy trucks, marking the seventh consecutive month of growth in the segment. Germany (+14.6%) and France (+0.5%) made positive contributions to the result, while Spain (-6.1%) and Italy (-4.4%) performed less well than last year.
From January to August, 161,581 new heavy trucks were registered across the European Union, or 33.1% more than during the same period in 2020. The major markets consolidated their positive results during this period: Italy (+39.5%), Spain (+30.6%), Germany (+19.8%) and France (+14.5%).
NEW MEDIUM AND HEAVY COMMERCIAL VEHICLES (MHCV) OVER 3.5T4 After posting a 10.6% increase in July, EU demand for new trucks went up again in August (+9.1%). The Central European markets made a major contribution (+42.7%) to this performance, while only Germany (+4.6%) managed to post growth among the largest Western European markets.
So far in 2021, demand for new trucks increased by 27.9%, counting 195,247 units registered across the region. With the exception of Greece and Cyprus, all EU markets recorded high double-digit, and some even triple-digit, percentage gains during this eight-month period, including the four major markets.
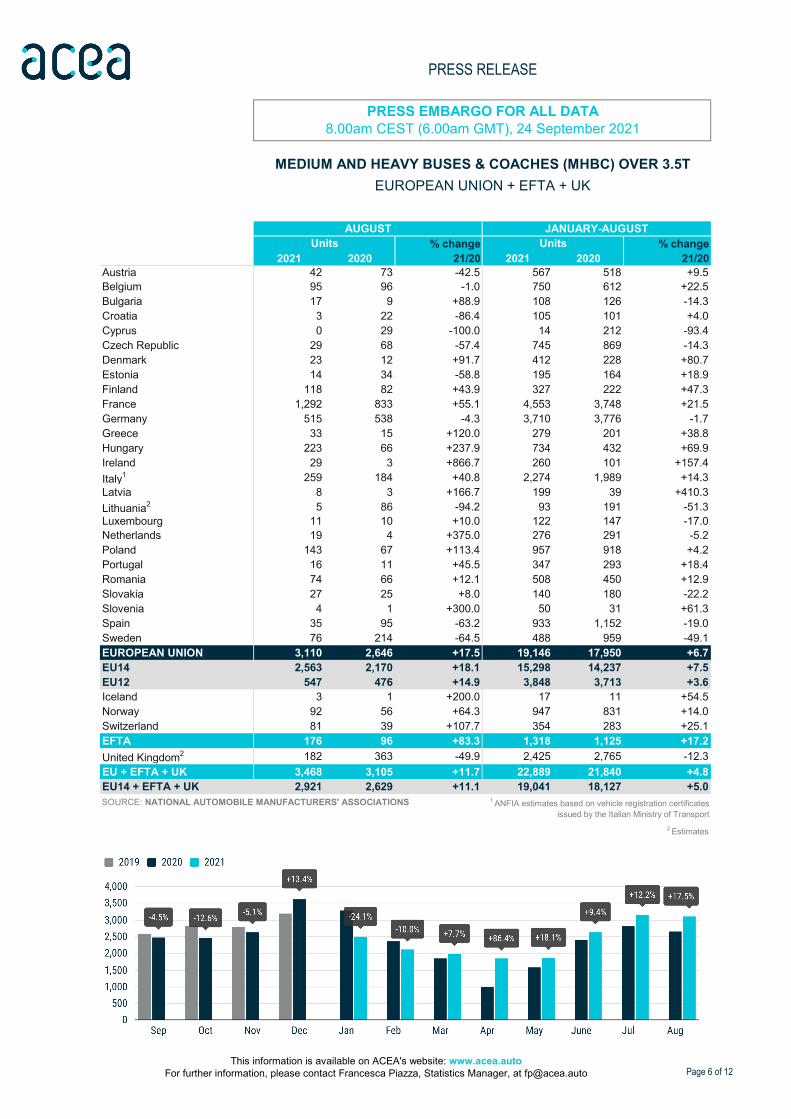
NEW MEDIUM AND HEAVY BUSES & COACHES (MHBC) OVER 3.5T August was a positive month for the bus segment, with new registrations growing by 17.5% to 3,110 units. Results at country level were very mixed: France (+55.1%) and Italy (+40.8%) saw double-digit percentage growth last month, while demand for new buses in Germany (-4.3%) and especially Spain (-63.2%) was weaker than a year ago.
Eight months into the year, new bus sales across the EU saw considerable growth (+6.7%) thanks to positive results in the summer months. France posted the highest growth rate of the region’s four largest markets (+21.5%), followed by Italy (+14.3%), while registrations fell in Germany (-1.7%) and Spain (-19.0%) at the same time.
3 Excluding heavy buses & coaches 4 Excluding medium and heavy buses & coaches
% change % change2021 2020 21/20 2021 2020 21/20
Austria 5,040 3,176 +58.7 40,087 23,892 +67.8Belgium 5,138 6,163 -16.6 51,148 47,086 +8.6Bulgaria 563 356 +58.1 4,783 3,072 +55.7Croatia 567 582 -2.6 5,585 4,346 +28.5Cyprus 115 116 -0.9 1,260 1,041 +21.0Czech Republic 1,801 1,374 +31.1 12,577 10,075 +24.8Denmark 2,591 2,725 -4.9 21,608 18,710 +15.5Estonia 351 275 +27.6 3,009 2,216 +35.8Finland 1,008 1,038 -2.9 9,034 8,058 +12.1France 21,445 25,666 -16.4 295,964 240,032 +23.3Germany 19,635 23,346 -15.9 181,816 162,341 +12.0Greece 979 478 +104.8 7,046 4,299 +63.9Hungary 1,879 1,636 +14.9 15,737 13,401 +17.4Ireland3 3,005 1,689 +77.9 24,834 16,701 +48.7Italy4 8,731 9,651 -9.5 120,889 88,931 +35.9Latvia 244 217 +12.4 1,724 1,383 +24.7Lithuania 277 212 +30.7 2,461 1,969 +25.0Luxembourg 290 337 -13.9 3,281 2,891 +13.5Netherlands 3,963 4,886 -18.9 48,119 40,393 +19.1Poland 5,552 4,832 +14.9 49,766 35,285 +41.0Portugal 1,817 1,960 -7.3 18,748 16,111 +16.4Romania 1,689 1,316 +28.3 10,961 8,772 +25.0Slovakia 696 605 +15.0 5,366 4,076 +31.6Slovenia 654 606 +7.9 6,621 4,991 +32.7Spain 8,314 11,638 -28.6 110,156 95,165 +15.8Sweden 2,631 2,881 -8.7 25,655 16,996 +50.9EUROPEAN UNION 98,975 107,761 -8.2 1,078,235 872,233 +23.6EU145 84,587 95,634 -11.6 958,385 781,606 +22.6EU126 14,388 12,127 +18.6 119,850 90,627 +32.2Iceland 106 57 +86.0 837 660 +26.8Norway 3,169 3,022 +4.9 23,373 19,848 +17.8Switzerland 2,187 2,290 -4.5 20,167 17,798 +13.3EFTA 5,462 5,369 +1.7 44,377 38,306 +15.8United Kingdom 20,582 19,407 +6.1 235,701 155,984 +51.1EU + EFTA + UK 125,019 132,537 -5.7 1,358,313 1,066,523 +27.4EU14 + EFTA + UK 110,631 120,410 -8.1 1,238,463 975,896 +26.9SOURCE: NATIONAL AUTOMOBILE MANUFACTURERS' ASSOCIATIONS 1 Including light buses and coaches
2 Data for Malta not available3 LCV ≤6t 4 ANFIA estimates
5 Member states before the 2004 enlargement6 Member states having joined the EU since 2004
UnitsAUGUST JANUARY-AUGUST
Units
LIGHT COMMERCIAL VEHICLES (LCV) UP TO 3.5T1
EUROPEAN UNION2 + EFTA + UK
PRESS RELEASE
PRESS EMBARGO FOR ALL DATA8.00am CEST (6.00am GMT), 24 September 2021
This information is available on ACEA's website: www.acea.auto For further information, please contact Francesca Piazza, Statistics Manager, at [email protected] Page 3 of 12

% change % change2021 2020 21/20 2021 2020 21/20
Austria 487 410 +18.8 4,797 3,677 +30.5Belgium 433 398 +8.8 4,522 4,004 +12.9Bulgaria 175 94 +86.2 1,979 1,204 +64.4Croatia 80 45 +77.8 740 469 +57.8Cyprus 2 1 +100.0 32 28 +14.3Czech Republic 416 387 +7.5 4,774 3,383 +41.1Denmark 339 272 +24.6 2,668 2,177 +22.6Estonia 51 28 +82.1 536 308 +74.0Finland 204 142 +43.7 1,671 1,506 +11.0France 1,714 1,706 +0.5 25,623 22,370 +14.5Germany 3,948 3,445 +14.6 38,191 31,881 +19.8Greece 24 22 +9.1 242 292 -17.1Hungary 203 187 +8.6 2,699 1,712 +57.7Ireland2 122 156 -21.8 1,498 1,297 +15.5Italy3 1,005 1,051 -4.4 14,344 10,279 +39.5Latvia 86 34 +152.9 896 319 +180.9Lithuania4 418 164 +154.9 5,499 2,171 +153.3Luxembourg4 64 38 +68.4 614 466 +31.8Netherlands 563 577 -2.4 7,377 6,303 +17.0Poland 1,662 1,191 +39.5 18,961 9,846 +92.6Portugal 145 223 -35.0 2,314 1,577 +46.7Romania 443 281 +57.7 3,788 2,411 +57.1Slovakia 141 134 +5.2 1,763 1,099 +60.4Slovenia 127 74 +71.6 1,211 828 +46.3Spain 819 872 -6.1 11,287 8,644 +30.6Sweden 370 325 +13.8 3,555 3,116 +14.1EUROPEAN UNION 14,041 12,257 +14.6 161,581 121,367 +33.1EU14 10,237 9,637 +6.2 118,703 97,589 +21.6EU12 3,804 2,620 +45.2 42,878 23,778 +80.3Iceland 12 3 +300.0 95 65 +46.2Norway 324 296 +9.5 2,876 2,765 +4.0Switzerland 245 202 +21.3 2,129 2,002 +6.3EFTA 581 501 +16.0 5,100 4,832 +5.5United Kingdom4 1,703 1,662 +2.5 19,981 15,309 +30.5EU + EFTA + UK 16,325 14,420 +13.2 186,662 141,508 +31.9EU14 + EFTA + UK 12,521 11,800 +6.1 143,784 117,730 +22.1SOURCE: NATIONAL AUTOMOBILE MANUFACTURERS' ASSOCIATIONS 1 Excluding heavy buses and coaches
2 HCV ≥17t
4 Estimates
3 ANFIA estimates based on vehicle registration certificates issued by the Italian Ministry of Transport
PRESS RELEASE
PRESS EMBARGO FOR ALL DATA8.00am CEST (6.00am GMT), 24 September 2021
HEAVY COMMERCIAL VEHICLES (HCV) OF 16T AND OVER1
EUROPEAN UNION + EFTA + UK
AUGUST JANUARY-AUGUSTUnits Units
This information is available on ACEA's website: www.acea.auto For further information, please contact Francesca Piazza, Statistics Manager, at [email protected] Page 4 of 12

% change % change2021 2020 21/20 2021 2020 21/20
Austria 524 429 +22.1 4,937 3,794 +30.1Belgium 514 482 +6.6 5,488 4,905 +11.9Bulgaria 179 99 +80.8 2,053 1,256 +63.5Croatia 112 56 +100.0 927 604 +53.5Cyprus 6 3 +100.0 58 76 -23.7Czech Republic 493 465 +6.0 5,616 4,267 +31.6Denmark 380 299 +27.1 2,949 2,440 +20.9Estonia 53 28 +89.3 568 341 +66.6Finland 298 232 +28.4 2,441 2,197 +11.1France 2,021 2,045 -1.2 29,976 26,176 +14.5Germany 5,649 5,400 +4.6 54,434 47,165 +15.4Greece 29 32 -9.4 385 461 -16.5Hungary 243 208 +16.8 2,974 1,913 +55.5Ireland 158 183 -13.7 1,777 1,541 +15.3Italy2 1,262 1,367 -7.7 17,282 12,797 +35.0Latvia 96 40 +140.0 967 360 +168.6Lithuania3 419 170 +146.5 5,554 2,232 +148.8Luxembourg 69 54 +27.8 707 613 +15.3Netherlands 635 684 -7.2 8,353 7,268 +14.9Poland 1,880 1,382 +36.0 20,567 11,183 +83.9Portugal 199 274 -27.4 2,710 1,886 +43.7Romania 489 305 +60.3 3,973 2,579 +54.1Slovakia 161 153 +5.2 1,981 1,273 +55.6Slovenia 142 85 +67.1 1,319 923 +42.9Spain 1,029 1,122 -8.3 13,270 10,913 +21.6Sweden 400 385 +3.9 3,981 3,440 +15.7EUROPEAN UNION 17,440 15,982 +9.1 195,247 152,603 +27.9EU14 13,167 12,988 +1.4 148,690 125,596 +18.4EU12 4,273 2,994 +42.7 46,557 27,007 +72.4Iceland 18 7 +157.1 183 145 +26.2Norway 509 446 +14.1 4,267 4,177 +2.15Switzerland 277 264 +4.9 2,512 2,452 +2.4EFTA 804 717 +12.1 6,962 6,774 +2.8United Kingdom3 2,390 2,405 -0.6 27,602 22,001 +25.5EU + EFTA + UK 20,634 19,104 +8.0 229,811 181,378 +26.7EU14 + EFTA + UK 16,361 16,110 +1.6 183,254 154,371 +18.7SOURCE: NATIONAL AUTOMOBILE MANUFACTURERS' ASSOCIATIONS 1 Excluding buses and coaches over 3.5t
3 Estimates
2 ANFIA estimates based on vehicle registration certificates issued by the Italian Ministry of Transport
PRESS RELEASE
PRESS EMBARGO FOR ALL DATA8.00am CEST (6.00am GMT), 24 September 2021
MEDIUM AND HEAVY COMMERCIAL VEHICLES (MHCV) OVER 3.5T1
EUROPEAN UNION + EFTA + UK
AUGUST JANUARY-AUGUSTUnits Units
This information is available on ACEA's website: www.acea.auto For further information, please contact Francesca Piazza, Statistics Manager, at [email protected] Page 5 of 12
% change % change2021 2020 21/20 2021 2020 21/20
Austria 42 73 -42.5 567 518 +9.5Belgium 95 96 -1.0 750 612 +22.5Bulgaria 17 9 +88.9 108 126 -14.3Croatia 3 22 -86.4 105 101 +4.0Cyprus 0 29 -100.0 14 212 -93.4Czech Republic 29 68 -57.4 745 869 -14.3Denmark 23 12 +91.7 412 228 +80.7Estonia 14 34 -58.8 195 164 +18.9Finland 118 82 +43.9 327 222 +47.3France 1,292 833 +55.1 4,553 3,748 +21.5Germany 515 538 -4.3 3,710 3,776 -1.7Greece 33 15 +120.0 279 201 +38.8Hungary 223 66 +237.9 734 432 +69.9Ireland 29 3 +866.7 260 101 +157.4Italy1 259 184 +40.8 2,274 1,989 +14.3Latvia 8 3 +166.7 199 39 +410.3Lithuania2 5 86 -94.2 93 191 -51.3Luxembourg 11 10 +10.0 122 147 -17.0Netherlands 19 4 +375.0 276 291 -5.2Poland 143 67 +113.4 957 918 +4.2Portugal 16 11 +45.5 347 293 +18.4Romania 74 66 +12.1 508 450 +12.9Slovakia 27 25 +8.0 140 180 -22.2Slovenia 4 1 +300.0 50 31 +61.3Spain 35 95 -63.2 933 1,152 -19.0Sweden 76 214 -64.5 488 959 -49.1EUROPEAN UNION 3,110 2,646 +17.5 19,146 17,950 +6.7EU14 2,563 2,170 +18.1 15,298 14,237 +7.5EU12 547 476 +14.9 3,848 3,713 +3.6Iceland 3 1 +200.0 17 11 +54.5Norway 92 56 +64.3 947 831 +14.0Switzerland 81 39 +107.7 354 283 +25.1EFTA 176 96 +83.3 1,318 1,125 +17.2United Kingdom2 182 363 -49.9 2,425 2,765 -12.3EU + EFTA + UK 3,468 3,105 +11.7 22,889 21,840 +4.8EU14 + EFTA + UK 2,921 2,629 +11.1 19,041 18,127 +5.0SOURCE: NATIONAL AUTOMOBILE MANUFACTURERS' ASSOCIATIONS
2 Estimates
1 ANFIA estimates based on vehicle registration certificates issued by the Italian Ministry of Transport
PRESS RELEASE
PRESS EMBARGO FOR ALL DATA8.00am CEST (6.00am GMT), 24 September 2021
MEDIUM AND HEAVY BUSES & COACHES (MHBC) OVER 3.5TEUROPEAN UNION + EFTA + UK
AUGUST JANUARY-AUGUSTUnits Units
This information is available on ACEA's website: www.acea.auto For further information, please contact Francesca Piazza, Statistics Manager, at [email protected] Page 6 of 12
% change % change2021 2020 21/20 2021 2020 21/20
Austria 5,606 3,678 +52.4 45,591 28,204 +61.6Belgium 5,747 6,741 -14.7 57,386 52,603 +9.1Bulgaria 759 464 +63.6 6,944 4,454 +55.9Croatia 682 660 +3.3 6,617 5,051 +31.0Cyprus 121 148 -18.2 1,332 1,329 +0.2Czech Republic 2,323 1,907 +21.8 18,938 15,211 +24.5Denmark 2,994 3,036 -1.4 24,969 21,378 +16.8Estonia 418 337 +24.0 3,772 2,721 +38.6Finland 1,424 1,352 +5.3 11,802 10,477 +12.6France 24,758 28,544 -13.3 330,493 269,956 +22.4Germany 25,799 29,284 -11.9 239,960 213,282 +12.5Greece 1,041 525 +98.3 7,710 4,961 +55.4Hungary 2,345 1,910 +22.8 19,445 15,746 +23.5Ireland 3,192 1,875 +70.2 26,871 18,343 +46.5Italy 10,252 11,202 -8.5 140,445 103,717 +35.4Latvia 348 260 +33.8 2,890 1,782 +62.2Lithuania 701 468 +49.8 8,108 4,392 +84.6Luxembourg 370 401 -7.7 4,110 3,651 +12.6Netherlands 4,617 5,574 -17.2 56,748 47,952 +18.3Poland 7,575 6,281 +20.6 71,290 47,386 +50.4Portugal 2,032 2,245 -9.5 21,805 18,290 +19.2Romania 2,252 1,687 +33.5 15,442 11,801 +30.9Slovakia 884 783 +12.9 7,487 5,529 +35.4Slovenia 800 692 +15.6 7,990 5,945 +34.4Spain 9,378 12,855 -27.0 124,359 107,230 +16.0Sweden 3,107 3,480 -10.7 30,124 21,395 +40.8EUROPEAN UNION 119,525 126,389 -5.4 1,292,628 1,042,786 +24.0EU14 100,317 110,792 -9.5 1,122,373 921,439 +21.8EU12 19,208 15,597 +23.2 170,255 121,347 +40.3Iceland 127 65 +95.4 1,037 816 +27.1Norway 3,770 3,524 +7.0 28,587 24,856 +15.0Switzerland 2,545 2,593 -1.9 23,033 20,533 +12.2EFTA 6,442 6,182 +4.2 52,657 46,205 +14.0United Kingdom 23,154 22,175 +4.4 265,728 180,750 +47.0EU + EFTA + UK 149,121 154,746 -3.6 1,611,013 1,269,741 +26.9EU14 + EFTA + UK 129,913 139,149 -6.6 1,440,758 1,148,394 +25.5SOURCE: NATIONAL AUTOMOBILE MANUFACTURERS' ASSOCIATIONS
TOTAL NEW COMMERCIAL VEHICLES (CV), BY MARKET
PRESS RELEASE
PRESS EMBARGO FOR ALL DATA8.00am CEST (6.00am GMT), 24 September 2021
EUROPEAN UNION + EFTA + UK
AUGUST JANUARY-AUGUSTUnits Units
This information is available on ACEA's website: www.acea.auto For further information, please contact Francesca Piazza, Statistics Manager, at [email protected] Page 7 of 12
% change % change2021 2020 21/20 2021 2020 21/20
Austria 4,264 3,898 +9.4 35,047 20,716 +69.2Belgium 4,077 6,786 -39.9 46,010 40,923 +12.4Bulgaria 798 427 +86.9 4,220 2,716 +55.4Croatia 755 562 +34.3 5,018 3,764 +33.3Cyprus 186 134 +38.8 1,145 925 +23.8Czech Republic 1,450 1,299 +11.6 10,776 8,701 +23.8Denmark 1,855 1,994 -7.0 19,017 15,985 +19.0Estonia 263 285 -7.7 2,658 1,941 +36.9Finland 727 754 -3.6 8,026 7,020 +14.3France 32,252 39,738 -18.8 274,519 214,366 +28.1Germany 21,489 24,577 -12.6 162,181 138,995 +16.7Greece 912 657 +38.8 6,067 3,821 +58.8Hungary 1,627 1,626 +0.1 13,858 11,765 +17.8Ireland3 4,806 4,443 +8.2 21,829 15,012 +45.4Italy4 14,788 17,774 -16.8 112,158 79,280 +41.5Latvia 256 198 +29.3 1,480 1,166 +26.9Lithuania 218 197 +10.7 2,184 1,757 +24.3Luxembourg 339 545 -37.8 2,991 2,554 +17.1Netherlands 4,813 5,119 -6.0 44,156 35,507 +24.4Poland 5,554 5,831 -4.8 44,214 30,453 +45.2Portugal 1,622 2,529 -35.9 16,931 14,151 +19.6Romania 1,474 1,070 +37.8 9,272 7,456 +24.4Slovakia 683 578 +18.2 4,670 3,471 +34.5Slovenia 709 649 +9.2 5,967 4,385 +36.1Spain 13,748 20,541 -33.1 101,842 83,527 +21.9Sweden 1,548 1,636 -5.4 23,024 14,115 +63.1EUROPEAN UNION 121,213 143,847 -15.7 979,260 764,472 +28.1EU145 107,240 130,991 -18.1 873,798 685,972 +27.4EU126 13,973 12,856 +8.7 105,462 78,500 +34.3Iceland 89 66 +34.8 731 603 +21.2Norway 1,871 1,744 +7.3 20,204 16,826 +20.1Switzerland 2,239 2,524 -11.3 17,980 15,508 +15.9EFTA 4,199 4,334 -3.1 38,915 32,937 +18.1United Kingdom 23,606 27,701 -14.8 215,119 136,577 +57.5EU + EFTA + UK 149,018 175,882 -15.3 1,233,294 933,986 +32.0EU14 + EFTA + UK 135,045 163,026 -17.2 1,127,832 855,486 +31.8SOURCE: NATIONAL AUTOMOBILE MANUFACTURERS' ASSOCIATIONS 1 Including light buses and coaches
2 Data for Malta not available3 LCV ≤6t 4 ANFIA estimates
5 Member states before the 2004 enlargement6 Member states having joined the EU since 2004
PRESS RELEASE
PRESS EMBARGO FOR ALL DATA8.00am CEST (6.00am GMT), 24 September 2021
UnitsJULY JANUARY-JULY
Units
LIGHT COMMERCIAL VEHICLES (LCV) UP TO 3.5T1
EUROPEAN UNION2 + EFTA + UK
This information is available on ACEA's website: www.acea.auto For further information, please contact Francesca Piazza, Statistics Manager, at [email protected] Page 8 of 12

% change % change2021 2020 21/20 2021 2020 21/20
Austria 602 483 +24.6 4,310 3,267 +31.9Belgium 481 468 +2.8 4,089 3,606 +13.4Bulgaria 244 192 +27.1 1,804 1,110 +62.5Croatia 96 89 +7.9 660 424 +55.7Cyprus 4 1 +300.0 30 27 +11.1Czech Republic 600 506 +18.6 4,358 2,996 +45.5Denmark 235 140 +67.9 2,330 1,905 +22.3Estonia 57 27 +111.1 485 280 +73.2Finland 163 140 +16.4 1,467 1,364 +7.6France 3,250 3,339 -2.7 23,909 20,664 +15.7Germany 4,744 4,488 +5.7 34,243 28,436 +20.4Greece 43 54 -20.4 218 270 -19.3Hungary 358 294 +21.8 2,496 1,525 +63.7Ireland2 273 227 +20.3 1,376 1,141 +20.6Italy3 1,994 1,743 +14.4 13,339 9,228 +44.5Latvia 152 46 +230.4 810 285 +184.2Lithuania4 533 227 +134.8 5,081 2,007 +153.2Luxembourg4 78 67 +16.4 550 428 +28.5Netherlands 834 620 +34.5 6,814 5,726 +19.0Poland 2,461 1,443 +70.5 17,299 8,655 +99.9Portugal 188 284 -33.8 2,169 1,354 +60.2Romania 387 360 +7.5 3,345 2,130 +57.0Slovakia 179 154 +16.2 1,622 965 +68.1Slovenia 136 76 +78.9 1,084 754 +43.8Spain 1,157 1,252 -7.6 10,468 7,772 +34.7Sweden 292 246 +18.7 3,185 2,791 +14.1EUROPEAN UNION 19,541 16,966 +15.2 147,541 109,110 +35.2EU14 14,334 13,551 +5.8 108,467 87,952 +23.3EU12 5,207 3,415 +52.5 39,074 21,158 +84.7Iceland 21 11 +90.9 83 62 +33.9Norway 261 175 +49.1 2,552 2,469 +3.4Switzerland 275 243 +13.2 1,884 1,800 +4.7EFTA 557 429 +29.8 4,519 4,331 +4.3United Kingdom4 2,002 1,994 +0.4 18,016 13,647 +32.0EU + EFTA + UK 22,100 19,389 +14.0 170,076 127,088 +33.8EU14 + EFTA + UK 16,893 15,974 +5.8 131,002 105,930 +23.7SOURCE: NATIONAL AUTOMOBILE MANUFACTURERS' ASSOCIATIONS 1 Excluding heavy buses and coaches
2 HCV ≥17t
4 Estimates
3 ANFIA estimates based on vehicle registration certificates issued by the Italian Ministry of Transport
PRESS RELEASE
PRESS EMBARGO FOR ALL DATA8.00am CEST (6.00am GMT), 24 September 2021
HEAVY COMMERCIAL VEHICLES (HCV) OF 16T AND OVER1
EUROPEAN UNION + EFTA + UK
JULY JANUARY-JULYUnits Units
This information is available on ACEA's website: www.acea.auto For further information, please contact Francesca Piazza, Statistics Manager, at [email protected] Page 9 of 12
% change % change2021 2020 21/20 2021 2020 21/20
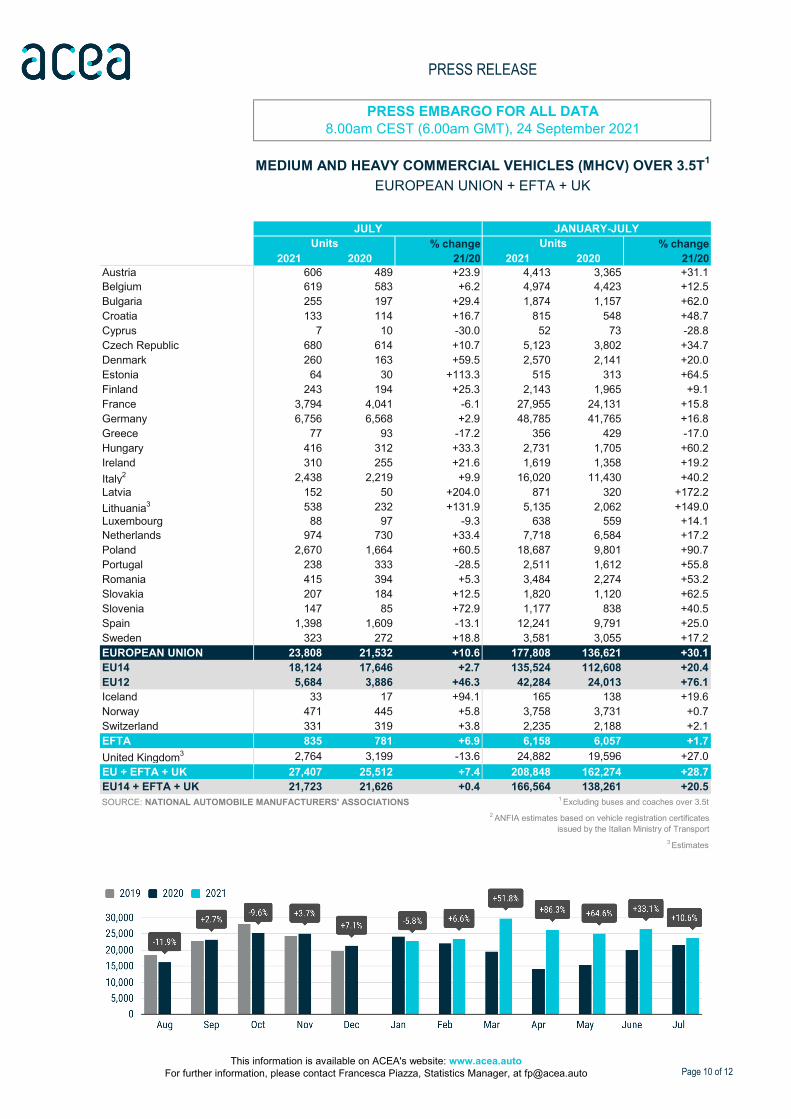
Austria 606 489 +23.9 4,413 3,365 +31.1Belgium 619 583 +6.2 4,974 4,423 +12.5Bulgaria 255 197 +29.4 1,874 1,157 +62.0Croatia 133 114 +16.7 815 548 +48.7Cyprus 7 10 -30.0 52 73 -28.8Czech Republic 680 614 +10.7 5,123 3,802 +34.7Denmark 260 163 +59.5 2,570 2,141 +20.0Estonia 64 30 +113.3 515 313 +64.5Finland 243 194 +25.3 2,143 1,965 +9.1France 3,794 4,041 -6.1 27,955 24,131 +15.8Germany 6,756 6,568 +2.9 48,785 41,765 +16.8Greece 77 93 -17.2 356 429 -17.0Hungary 416 312 +33.3 2,731 1,705 +60.2Ireland 310 255 +21.6 1,619 1,358 +19.2Italy2 2,438 2,219 +9.9 16,020 11,430 +40.2Latvia 152 50 +204.0 871 320 +172.2Lithuania3 538 232 +131.9 5,135 2,062 +149.0Luxembourg 88 97 -9.3 638 559 +14.1Netherlands 974 730 +33.4 7,718 6,584 +17.2Poland 2,670 1,664 +60.5 18,687 9,801 +90.7Portugal 238 333 -28.5 2,511 1,612 +55.8Romania 415 394 +5.3 3,484 2,274 +53.2Slovakia 207 184 +12.5 1,820 1,120 +62.5Slovenia 147 85 +72.9 1,177 838 +40.5Spain 1,398 1,609 -13.1 12,241 9,791 +25.0Sweden 323 272 +18.8 3,581 3,055 +17.2EUROPEAN UNION 23,808 21,532 +10.6 177,808 136,621 +30.1EU14 18,124 17,646 +2.7 135,524 112,608 +20.4EU12 5,684 3,886 +46.3 42,284 24,013 +76.1Iceland 33 17 +94.1 165 138 +19.6Norway 471 445 +5.8 3,758 3,731 +0.7Switzerland 331 319 +3.8 2,235 2,188 +2.1EFTA 835 781 +6.9 6,158 6,057 +1.7United Kingdom3 2,764 3,199 -13.6 24,882 19,596 +27.0EU + EFTA + UK 27,407 25,512 +7.4 208,848 162,274 +28.7EU14 + EFTA + UK 21,723 21,626 +0.4 166,564 138,261 +20.5SOURCE: NATIONAL AUTOMOBILE MANUFACTURERS' ASSOCIATIONS 1 Excluding buses and coaches over 3.5t
3 Estimates
2 ANFIA estimates based on vehicle registration certificates issued by the Italian Ministry of Transport
PRESS RELEASE
PRESS EMBARGO FOR ALL DATA8.00am CEST (6.00am GMT), 24 September 2021
MEDIUM AND HEAVY COMMERCIAL VEHICLES (MHCV) OVER 3.5T1
EUROPEAN UNION + EFTA + UK
JULY JANUARY-JULYUnits Units
This information is available on ACEA's website: www.acea.auto For further information, please contact Francesca Piazza, Statistics Manager, at [email protected] Page 10 of 12

% change % change2021 2020 21/20 2021 2020 21/20
Austria 70 95 -26.3 525 445 +18.0Belgium 124 102 +21.6 655 516 +26.9Bulgaria 27 31 -12.9 91 117 -22.2Croatia 21 53 -60.4 102 79 +29.1Cyprus 1 77 -98.7 14 183 -92.3Czech Republic 113 115 -1.7 716 801 -10.6Denmark 102 73 +39.7 389 216 +80.1Estonia 12 54 -77.8 181 130 +39.2Finland 58 26 +123.1 209 140 +49.3France 828 592 +39.9 3,261 2,915 +11.9Germany 569 611 -6.9 3,195 3,238 -1.33Greece 45 42 +7.1 246 186 +32.3Hungary 260 59 +340.7 511 366 +39.6Ireland 13 2 +550.0 231 98 +135.7Italy1 373 251 +48.6 2,015 1,805 +11.6Latvia 11 2 +450.0 191 36 +430.6Lithuania2 0 20 -100.0 88 105 -16.2Luxembourg 16 8 +100.0 111 137 -19.0Netherlands 79 6 +1,216.7 257 287 -10.5Poland 150 159 -5.7 814 851 -4.3Portugal 36 30 +20.0 331 282 +17.4Romania 58 90 -35.6 434 384 +13.0Slovakia 26 32 -18.8 113 155 -27.1Slovenia 2 3 -33.3 46 30 +53.3Spain 145 186 -22.0 898 1,057 -15.0Sweden 18 95 -81.1 412 745 -44.7EUROPEAN UNION 3,157 2,814 +12.2 16,036 15,304 +4.8EU14 2,476 2,119 +16.8 12,735 12,067 +5.5EU12 681 695 -2.0 3,301 3,237 +2.0Iceland 3 2 +50.0 14 10 +40.0Norway 428 46 +830.4 855 775 +10.3Switzerland 50 44 +13.6 273 244 +11.9EFTA 481 92 +422.8 1,142 1,029 +11.0United Kingdom2 304 296 +2.7 2,226 2,402 -7.3EU + EFTA + UK 3,942 3,202 +23.1 19,404 18,735 +3.6EU14 + EFTA + UK 3,261 2,507 +30.1 16,103 15,498 +3.9SOURCE: NATIONAL AUTOMOBILE MANUFACTURERS' ASSOCIATIONS
2 Estimates
1 ANFIA estimates based on vehicle registration certificates issued by the Italian Ministry of Transport
PRESS RELEASE
PRESS EMBARGO FOR ALL DATA8.00am CEST (6.00am GMT), 24 September 2021
MEDIUM AND HEAVY BUSES & COACHES (MHBC) OVER 3.5TEUROPEAN UNION + EFTA + UK
JULY JANUARY-JULYUnits Units
This information is available on ACEA's website: www.acea.auto For further information, please contact Francesca Piazza, Statistics Manager, at [email protected] Page 11 of 12

% change % change2021 2020 21/20 2021 2020 21/20
Austria 4,940 4,482 +10.2 39,985 24,526 +63.0Belgium 4,820 7,471 -35.5 51,639 45,862 +12.6Bulgaria 1,080 655 +64.9 6,185 3,990 +55.0Croatia 909 729 +24.7 5,935 4,391 +35.2Cyprus 194 221 -12.2 1,211 1,181 +2.5Czech Republic 2,243 2,028 +10.6 16,615 13,304 +24.9Denmark 2,217 2,230 -0.6 21,976 18,342 +19.8Estonia 339 369 -8.1 3,354 2,384 +40.7Finland 1,028 974 +5.5 10,378 9,125 +13.7France 36,874 44,371 -16.9 305,735 241,412 +26.6Germany 28,814 31,756 -9.3 214,161 183,998 +16.4Greece 1,034 792 +30.6 6,669 4,436 +50.3Hungary 2,303 1,997 +15.3 17,100 13,836 +23.6Ireland 5,129 4,700 +9.1 23,679 16,468 +43.8Italy 17,599 20,244 -13.1 130,193 92,515 +40.7Latvia 419 250 +67.6 2,542 1,522 +67.0Lithuania 756 449 +68.4 7,407 3,924 +88.8Luxembourg 443 650 -31.8 3,740 3,250 +15.1Netherlands 5,866 5,855 +0.2 52,131 42,378 +23.0Poland 8,374 7,654 +9.4 63,715 41,105 +55.0Portugal 1,896 2,892 -34.4 19,773 16,045 +23.2Romania 1,947 1,554 +25.3 13,190 10,114 +30.4Slovakia 916 794 +15.4 6,603 4,746 +39.1Slovenia 858 737 +16.4 7,190 5,253 +36.9Spain 15,291 22,336 -31.5 114,981 94,375 +21.8Sweden 1,889 2,003 -5.7 27,017 17,915 +50.8EUROPEAN UNION 148,178 168,193 -11.9 1,173,104 916,397 +28.0EU14 127,840 150,756 -15.2 1,022,057 810,647 +26.1EU12 20,338 17,437 +16.6 151,047 105,750 +42.8Iceland 125 85 +47.1 910 751 +21.2Norway 2,770 2,235 +23.9 24,817 21,332 +16.3Switzerland 2,620 2,887 -9.2 20,488 17,940 +14.2EFTA 5,515 5,207 +5.9 46,215 40,023 +15.5United Kingdom 26,674 31,196 -14.5 242,227 158,575 +52.8EU + EFTA + UK 180,367 204,596 -11.8 1,461,546 1,114,995 +31.1EU14 + EFTA + UK 160,029 187,159 -14.5 1,310,499 1,009,245 +29.8SOURCE: NATIONAL AUTOMOBILE MANUFACTURERS' ASSOCIATIONS
EUROPEAN UNION + EFTA + UK
JULY JANUARY-JULYUnits Units
TOTAL NEW COMMERCIAL VEHICLES (CV), BY MARKET
PRESS RELEASE
PRESS EMBARGO FOR ALL DATA8.00am CEST (6.00am GMT), 24 September 2021
This information is available on ACEA's website: www.acea.auto For further information, please contact Francesca Piazza, Statistics Manager, at [email protected] Page 12 of 12