Embed Size (px)
Citation preview

CommercialInsurance
Cost Savings inAmbulatory
Surgery Centers

1
Executive Summary
A review of commercial medical-claims data found that U.S. healthcare costs are reduced by more than $38 billion per year due to the availability of ambulatory surgery centers (ASCs) as an appropri-ate setting for outpatient procedures. More than $5 billion of the cost reduction accrues to the patient through lower deductible and coinsurance payments. This cost reduction is driven by the fact that, in general, ASC prices are significantly lower than hospital outpatient department (HOPD) prices for the same procedure in all markets, regardless of payer.
The study also looks at the potential savings that could be achieved if additional procedures were redirected to ASCs. As much as $55 billion could be saved annually depending on the percentage of procedures that migrate to ASCs and the mix of ASCs selected instead of HOPDs.
Finally, the study explores additional cost savings that would result if certain inpatient procedures, such as total joint replacements, continue to migrate to ASCs.
This study supplements an earlier review of Medicare costs by researchers at the University of California-Berkeley that showed that ASCs reduce Medicare costs by $2.3 billion annually.Ambulatory Surgery Center Association, Medicare Cost Savings Tied to ASCs, (2013),http://www.advancingsurgicalcare.com/medicarecostsavings.
2
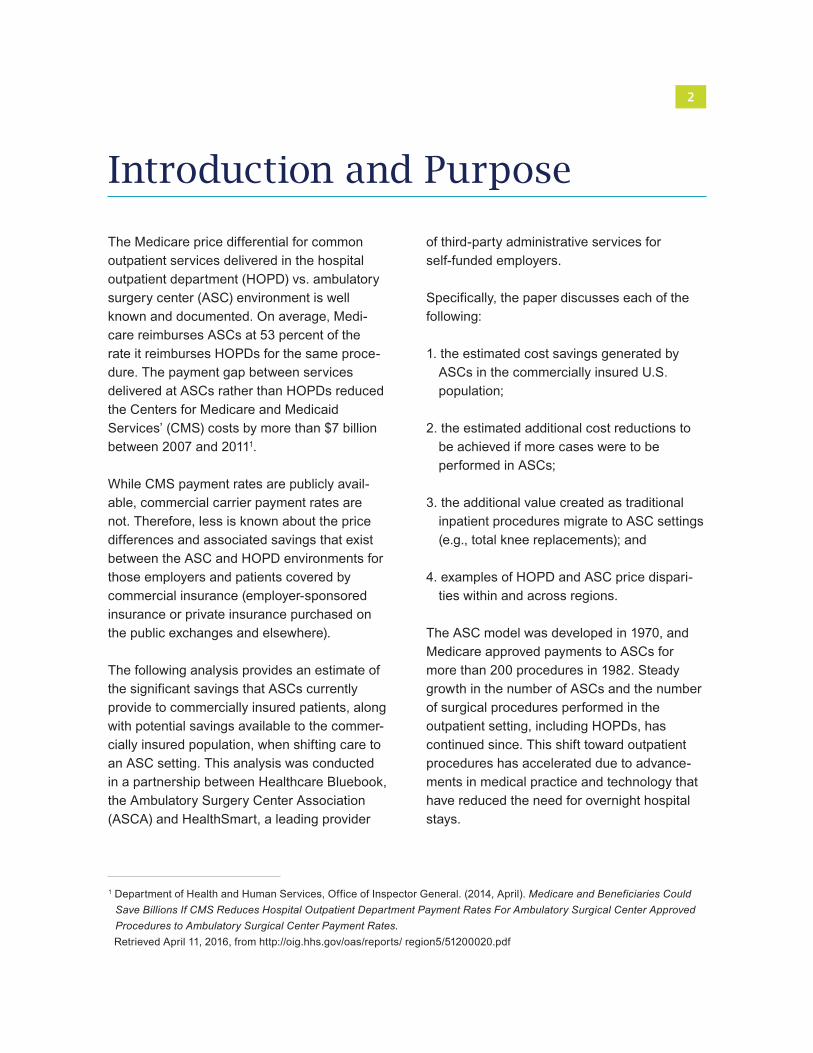
The Medicare price differential for common outpatient services delivered in the hospital outpatient department (HOPD) vs. ambulatory surgery center (ASC) environment is well known and documented. On average, Medi-care reimburses ASCs at 53 percent of the rate it reimburses HOPDs for the same proce-dure. The payment gap between services delivered at ASCs rather than HOPDs reduced the Centers for Medicare and Medicaid Services’ (CMS) costs by more than $7 billion between 2007 and 20111.
While CMS payment rates are publicly avail-able, commercial carrier payment rates are not. Therefore, less is known about the price differences and associated savings that exist between the ASC and HOPD environments for those employers and patients covered by commercial insurance (employer-sponsored insurance or private insurance purchased on the public exchanges and elsewhere).
The following analysis provides an estimate of the significant savings that ASCs currently provide to commercially insured patients, along with potential savings available to the commer-cially insured population, when shifting care to an ASC setting. This analysis was conducted in a partnership between Healthcare Bluebook, the Ambulatory Surgery Center Association (ASCA) and HealthSmart, a leading provider
Introduction and Purpose
of third-party administrative services for self-funded employers.
Specifically, the paper discusses each of the following:
1. the estimated cost savings generated by ASCs in the commercially insured U.S. population;
2. the estimated additional cost reductions to be achieved if more cases were to be performed in ASCs;
3. the additional value created as traditional inpatient procedures migrate to ASC settings (e.g., total knee replacements); and
4. examples of HOPD and ASC price dispari-ties within and across regions.
The ASC model was developed in 1970, and Medicare approved payments to ASCs for more than 200 procedures in 1982. Steady growth in the number of ASCs and the number of surgical procedures performed in the outpatient setting, including HOPDs, has continued since. This shift toward outpatient procedures has accelerated due to advance-ments in medical practice and technology that have reduced the need for overnight hospital stays.
1 Department of Health and Human Services, Office of Inspector General. (2014, April). Medicare and Beneficiaries Could Save Billions If CMS Reduces Hospital Outpatient Department Payment Rates For Ambulatory Surgical Center Approved Procedures to Ambulatory Surgical Center Payment Rates.
Retrieved April 11, 2016, from http://oig.hhs.gov/oas/reports/ region5/51200020.pdf
Today, many common surgeries are performed as outpatient procedures, and most patients, except those with complicated health condi-tions, can be served in the outpatient setting. Common ASC procedures include colonosco-pies, cataract surgeries, tonsillectomies and arthroscopic orthopedic surgeries. CMS currently approves and reimburses 3,837 procedure codes in the ASC setting, and commercial populations are constantly expanding these boundaries. In fact, some ASCs are performing total joint replacements and other traditionally inpatient procedures with excellent outcomes.
While all HOPDs are hospital owned, most ASCs are at least partially owned by physi-cians, often in conjunction with hospitals and/or management companies. Sixty-five percent of the more than 5,400 Medicare- licensed ASCs in the U.S. are wholly owned by physicians and operate as small businesses.
A study published in Health Affairs analyzed data from the National Survey of Ambulatory Surgery and discovered that procedures performed in ASCs are more efficient, taking 25 percent less time than those performed in hospitals2. This efficiency, and corresponding cost-effectiveness, is due largely to the ASCs’ focus on a limited number of procedures, their owner/operator culture and specialized nursing and support staff. Because ASCs specialize in providing outpatient surgery, they are able to deliver patient-care services efficiently and conveniently. For example, operating rooms are turned over quickly and are not interrupted by emergency cases. This enables physicians
to commence their procedures in a timely manner and use their time more productively. Consequently, ASCs tend to be more conve-nient and cost effective than HOPDs while still providing excellent care.

3
The Medicare price differential for common outpatient services delivered in the hospital outpatient department (HOPD) vs. ambulatory surgery center (ASC) environment is well known and documented. On average, Medi-care reimburses ASCs at 53 percent of the rate it reimburses HOPDs for the same proce-dure. The payment gap between services delivered at ASCs rather than HOPDs reduced the Centers for Medicare and Medicaid Services’ (CMS) costs by more than $7 billion between 2007 and 20111.
While CMS payment rates are publicly avail-able, commercial carrier payment rates are not. Therefore, less is known about the price differences and associated savings that exist between the ASC and HOPD environments for those employers and patients covered by commercial insurance (employer-sponsored insurance or private insurance purchased on the public exchanges and elsewhere).
The following analysis provides an estimate of the significant savings that ASCs currently provide to commercially insured patients, along with potential savings available to the commer-cially insured population, when shifting care to an ASC setting. This analysis was conducted in a partnership between Healthcare Bluebook, the Ambulatory Surgery Center Association (ASCA) and HealthSmart, a leading provider
of third-party administrative services for self-funded employers.
Specifically, the paper discusses each of the following:
1. the estimated cost savings generated by ASCs in the commercially insured U.S. population;
2. the estimated additional cost reductions to be achieved if more cases were to be performed in ASCs;
3. the additional value created as traditional inpatient procedures migrate to ASC settings (e.g., total knee replacements); and
4. examples of HOPD and ASC price dispari-ties within and across regions.
The ASC model was developed in 1970, and Medicare approved payments to ASCs for more than 200 procedures in 1982. Steady growth in the number of ASCs and the number of surgical procedures performed in the outpatient setting, including HOPDs, has continued since. This shift toward outpatient procedures has accelerated due to advance-ments in medical practice and technology that have reduced the need for overnight hospital stays.
2 Munnich, E. L., & Parente, S. T. (2014). Procedures Take Less Time At Ambulatory Surgery Centers, Keeping Costs Down And Ability To Meet Demand Up. Health Affairs, 33(5), 764-769.
Today, many common surgeries are performed as outpatient procedures, and most patients, except those with complicated health condi-tions, can be served in the outpatient setting. Common ASC procedures include colonosco-pies, cataract surgeries, tonsillectomies and arthroscopic orthopedic surgeries. CMS currently approves and reimburses 3,837 procedure codes in the ASC setting, and commercial populations are constantly expanding these boundaries. In fact, some ASCs are performing total joint replacements and other traditionally inpatient procedures with excellent outcomes.
While all HOPDs are hospital owned, most ASCs are at least partially owned by physi-cians, often in conjunction with hospitals and/or management companies. Sixty-five percent of the more than 5,400 Medicare- licensed ASCs in the U.S. are wholly owned by physicians and operate as small businesses.
A study published in Health Affairs analyzed data from the National Survey of Ambulatory Surgery and discovered that procedures performed in ASCs are more efficient, taking 25 percent less time than those performed in hospitals2. This efficiency, and corresponding cost-effectiveness, is due largely to the ASCs’ focus on a limited number of procedures, their owner/operator culture and specialized nursing and support staff. Because ASCs specialize in providing outpatient surgery, they are able to deliver patient-care services efficiently and conveniently. For example, operating rooms are turned over quickly and are not interrupted by emergency cases. This enables physicians
to commence their procedures in a timely manner and use their time more productively. Consequently, ASCs tend to be more conve-nient and cost effective than HOPDs while still providing excellent care.

4
Healthcare prices vary dramatically even within the same insurance network and city. For example, in Charleston, West Virginia, the price of a cataract surgery, including payments to the anesthesiologist and physician, can vary from $2,684 to $8,662 depending on the facility where the surgery is performed (Figure 1). In this case prices vary by more than 300 percent, primarily due to the amount charged by the facility – not the physicians. These facility prices vary by almost 600 percent and total more than 70 percent of all dollars spent for cataract surgery in Charleston, WV.
Payments to anesthesiologists vary, partially due to the time component of anesthesia billing, but these payments are the smallest
Patients Often Pay DramaticallyDifferent Amounts for the SameCare in the Same Community
portion of the total cost and are dwarfed by payments to facilities.
Payments to physicians are a more significant portion of total cost, but physicians performing the most expensive cataract surgeries are paid approximately the same as physicians performing the least expensive surgeries. Thus, it is the choice of facility that drives the total price variation.
The consistency of payments to physicians indicates that most physicians are unable to differentiate themselves when negotiating payment rates from insurance companies and, hence, are paid similar rates. Facilities, on the other hand, vary significantly in their service
offerings and market power and, therefore, have significantly different negotiated rates with insurance companies.
For example, Hospital A provides emergency, inpatient and outpatient care. Hospital B offers everything Hospital A offers and also operates the only children’s hospital in the metropolitan area. Due to this exclusive service line, Hospi-tal B has better negotiating leverage with an insurance company. Importantly, this leverage applies not only to services uniquely performed in the children’s hospital, but also to outpatient surgeries, such as cataract surgery, that are performed in other facilities in the area. Since the entire hospital is either in or out of network, all services are negotiated together, allowing Hospital B to demand higher reimbursement for procedures even though equally good, lower-priced alternative sites of service exist in that market area.
Since any ASC will offer fewer services than both Hospital A and B, those ASCs will have less negotiating leverage with commercial carriers and, therefore, often will receive lower reimbursement rates than either Hospital A or B if they want to be included in the insurer’s network. While the efficiency inherent in the ASC model explains why ASCs can continue to exist when receiving significantly lower payments, it is the market power of hospitals that widens these price disparities3 4.
As a result of these factors, the total price of a procedure performed at an ASC is generally significantly lower than the total price of the same procedure performed in an HOPD. For example, the average price of cataract surgery at an ASC in Charleston, West Virginia, is $2,932, including the physician and anesthesi-ologist payments, while the average price at an HOPD is $5,762 (Figure 2). In this example,
Figure 1
the average price for a cataract surgery at the least expensive facility was $2,684, including the payments to anesthesiologists and physi-cians. At the most expensive facility, the average price was $7,987. ASCs are at the low end of the spectrum and HOPDs are at the high end.
This commercial price differential between the ASC and HOPD environments is persistent across metropolitan areas (Figure 3), insur-ance carriers and procedure categories, with the degree of price variability related to local market factors.
Summary of Methodology All analysis was conducted using a sample of de-identified commercial claims data for calendar year 2014 from HealthSmart. This data represents more than 400,000 lives across all regions of the U.S. The CMS list of ASC-eligible procedure codes, with a few additions reflecting those prevalent in a
commercial population (pediatric-related codes, OB/GYN-related codes, etc.), was used to identify the spending on procedures that can be performed in an ASC.
Total price of service was included in the analysis (facility fees, professional fees and anesthesia fees, where relevant). Based on the commercial population considered, these services accounted for about 19 percent of total medical spend, or $890 per person for the year. All prices are calculated using the “allowed” amount, which reflects the actual amount a provider received after any discounts were applied.
Thirteen high-volume outpatient procedures were used as proxies to analyze the price differential between the ASC and HOPD environments and estimate the percentage of spending that could be saved by performing the procedures in ASCs instead of HOPDs. An adjustment was made to account for the fact that some high-risk patients are not candidates
for ASC-based care (patients with high comor-bidities are traditionally directed to an HOPD in order to be closer to critical-access care). This adjusted percentage was applied to the $890 ASC-eligible spend per person and then scaled by the commercially insured U.S. population to estimate the national savings potential.
All estimates are based on the calendar year 2014 data. No adjustments were made to account for population aging or increasing utilization of ASC-eligible services. (See Appendix A: Methodology and Appendix B: Adjustments for ASC Ineligibility for a more detailed explanation of the methodology.)
Current ASC Use Reduces Private Healthcare Costs by $38 Billion AnnuallyThe lower cost of care in ASCs relative to HOPDs saves employers and consumers tens of billions of dollars a year. For the commer-cially insured population in the U.S., an
estimated $37.8 billion is saved annually by using ASCs. Stated differently, if all of the procedures currently performed in ASCs for the commercially insured population in the U.S. were performed in HOPDs, the cost of those procedures would increase by $37.8 billion in just one year.
Potential Cost Reductions Attributed to ASCsDespite the savings detailed above, for com-mercially insured populations, only 48 percent of procedures commonly performed in ASCs are actually performed in ASCs. If the remain-ing 52 percent were performed at ASC price points, an additional $41 billion in healthcare costs could be saved annually.
As a practical matter, ASCs would not be the appropriate setting for a small percentage of patients (e.g., those with serious health issues) currently treated in HOPDs. For example, patients on dialysis (0.1 percent of Americans) are not ASC eligible for certain procedures. When ASC-ineligible cases are accounted for, the total potential annual savings from performing the surgeries in ASCs instead of HOPDs is $38.2B. (This assumes 3 percent of relevant cases are ASC ineligible. See Appen-dix B: Adjustments for ASC Ineligibility.)
The average ASC price, however, is a blend of both lower-priced and higher-priced ASCs. The optimal migration of cases would shift cases from HOPDs to the local low-price ASCs. If patients were directed to low-price ASCs only, the potential annual savings increases from $38.2 billion to $55.6 billion.
Migrating a meaningful number of patients to lower-cost ASC settings would, undoubtedly, also have the added benefit of causing HOPDs
to consider price reductions in order to main-tain their market share. While this study did not attempt to model the competitive reactions of HOPDs if confronted with a significant loss of patient volume, fundamental economic princi-ples as well as a recent study that looked at the impact of reference-based pricing on patient choices concluded that hospitals did, in fact, lower their pricing for certain procedures in response to a loss of market share to competing ASCs5.
Potential Savings Can Grow if ASCs Can Perform More Complex ProceduresWith advances in surgical techniques, pain management and post-surgical care, more procedures traditionally performed in the inpatient setting are being shifted to ASCs. This creates an expanding frontier for reducing healthcare costs. As an example, total hip and total knee replacements, which currently account for about 1.5 percent of total medical spend, are now being performed safely in ASCs in a limited number of markets. The potential savings are significant. Assuming that the price differential and the rate of ASC ineligibility due to comorbidities for total joint replacement will be commensurate with other outpatient procedures, $3.2 billion could be
saved by moving total hip and knee replace-ments to ASCs. (See Appendix A: Methodology.)
Projected NationalCost ReductionsTo realize the potential cost reductions high-lighted above, several things need to happen. On the supply side, ASC capacity will have to double in order to support the migration from HOPDs.
On the demand side, patients must be educat-ed and incentivized to choose ASCs for their outpatient procedures. As premiums rise and adoption of high-deductible health plans increases, patients have greater incentives to reduce their costs by choosing ASC-based care, but education is lacking. Though health-care transparency has made significant advancements in recent years, most patients are still unaware of the lower costs that ASCs offer.
Even modest changes in market share produce massive savings for the entire health system. For example, if an additional 5 percent of current HOPD cases were moved to ASCs annually over the next ten years, $113.8 billion would be saved compared to current utilization rates (Table 1). This assumes that the annual potential ASC savings is currently $41.4 billion:
$38.2 billion from current ASC-eligible proce-dures above plus $3.2 billion from total knee and hip replacement.
For ASC eligible procedures in this study, patients were responsible for 15 percent of the cost on average. That would mean $17.1 billion in reduced costs for patients over the next ten years (Figure 4). If 3 percent or 8 percent of HOPD cases were moved to ASCs annually, ten-year savings would be $68.3 billion and $182 billion respectively (Table 2).
These estimates do not account for inflation or upward trends in medical spending. They also do not take into account the potential that HOPD pricing will decrease in order to com-pete with ASCs, which would create further outpatient savings. As referenced above, in the CalPERS reference pricing program, high- priced providers will reduce prices to be com- petitive and attract price-sensitive consumers.
Reducing Costs forEmployers and EmployeesFrom 2005 to 2015, average health insurance premiums for employer-sponsored family coverage increased 61 percent, from $10,880 to $17,545 per year. To combat these rising costs, employers have increasingly adopted Consumer Driven Health Plans (CDHP) and account-based plan types, shifting costs to employees. This has driven the average employee’s share of healthcare spending up 81 percent in the same time period, from $2,713 to $4,9556 annually. This highlights the need for programs like price transparency that can help patients identify better value providers within their networks so that employers and their employees both can lower costs.
For example, in Charlotte, NC, the average ASC price for a knee arthroscopy was $6,118, while the average HOPD price was $12,493, more than twice as expensive. That means $6,375 is saved on average in Charlotte, NC, when a patient chooses an ASC for a knee arthroscopy. How those savings are divided between the payer and the patient depends on the plan design.
For a knee arthroscopy in Charlotte, NC, if a patient has a Silver Plan as defined by the Affordable Care Act, with a $2,700 deductible, 80 percent coinsurance and $5,000 maximum out of pocket, the patient would save $1,275— more than the median family’s weekly income. The remaining $5,100 would be saved by the payer. For self-funded employer-sponsored insurance, that is $5,100 directly to the bottom line for the employer.
Applying the same plan design to the earlier example of cataract surgery in Charleston, WV, a patient would save $566 by choosing an ASC instead of an HOPD. This is a significant savings in a geographic area where annual income per capita is less than $35,0007. The payer would realize an additional savings of $2,264.
Estimating Savings for Self-Insured PopulationsFor employers that self insure, it is reasonably straightforward to estimate the potential cost reductions from ASCs for their covered employees. With $890 in ASC-eligible spend-ing per commercially insured person and 20.6 percent savings opportunity from moving all
ASC-eligible cases from HOPDs to ASCs, $183 in potential ASC savings exists per commercially insured person. A self-funded employer with 1,000 employees is normally covering more than 2,000 lives, when employ-ees and dependents are counted, which means a potential ASC-based savings of more than $366,000 for the employer and employees.
ConclusionBillions of dollars spent each year on commer-cially insured outpatient surgeries and proce-dures can be reduced, without compromising quality, if more cases migrate to ambulatory surgery centers. While a small percentage of patients have health conditions that require outpatient care to be received in proximity to a full-service hospital should complications arise, most patients can receive the same level of care at lower cost by seeking treatment in an ASC. Advances in medical technology and pain control are allowing increasingly complex procedures, such as total joint replacements, to be performed in an outpatient setting.
Policymakers, insurers, employers and benefi-ciaries all have a shared interest in reducing healthcare costs, and the $38 billion in annual savings identified in this study highlight the role that ASCs already play in controlling these costs. Strategies should be implemented to generate additional savings by ensuring that the most efficient site of service for outpatient care is selected whenever possible. In particu-lar, innovative plan design and increased consumer awareness of the benefits of receiv-ing care in an ASC can save thousands of dollars per procedure.
Cataract Surgeries─Charleston, WV
Dis
tinct
Pro
cedu
res
$0 $1000 $2000 $3000 $4000 $5000 $6000 $7000 $8000 $9000Total Price
Professional
Anesthesia
Facility

5
Healthcare prices vary dramatically even within the same insurance network and city. For example, in Charleston, West Virginia, the price of a cataract surgery, including payments to the anesthesiologist and physician, can vary from $2,684 to $8,662 depending on the facility where the surgery is performed (Figure 1). In this case prices vary by more than 300 percent, primarily due to the amount charged by the facility – not the physicians. These facility prices vary by almost 600 percent and total more than 70 percent of all dollars spent for cataract surgery in Charleston, WV.
Payments to anesthesiologists vary, partially due to the time component of anesthesia billing, but these payments are the smallest
portion of the total cost and are dwarfed by payments to facilities.
Payments to physicians are a more significant portion of total cost, but physicians performing the most expensive cataract surgeries are paid approximately the same as physicians performing the least expensive surgeries. Thus, it is the choice of facility that drives the total price variation.
The consistency of payments to physicians indicates that most physicians are unable to differentiate themselves when negotiating payment rates from insurance companies and, hence, are paid similar rates. Facilities, on the other hand, vary significantly in their service
3 Neprash, H.T., BA, Chernew, M.E., PhD, Hicks, A.L., MS, Gibson, T., PhD, & McWilliams, M., MD, PhD, (2015, October). Association of Financial Integration Between Physicians and Hospitals With Commercial Health Care Prices. Journal of the American Medical Association.
4 The Robert Wood Johnson Foundation, Martin Gaynor, PhD & Robert Town, PhD. (2012, June). The impact of hospital consolidation – Update.Retrieved April 20, 2016, from http://www.rwjf.org/en/library/research/2012/06/the-impact-of-hospital-consolidation.htm
offerings and market power and, therefore, have significantly different negotiated rates with insurance companies.
For example, Hospital A provides emergency, inpatient and outpatient care. Hospital B offers everything Hospital A offers and also operates the only children’s hospital in the metropolitan area. Due to this exclusive service line, Hospi-tal B has better negotiating leverage with an insurance company. Importantly, this leverage applies not only to services uniquely performed in the children’s hospital, but also to outpatient surgeries, such as cataract surgery, that are performed in other facilities in the area. Since the entire hospital is either in or out of network, all services are negotiated together, allowing Hospital B to demand higher reimbursement for procedures even though equally good, lower-priced alternative sites of service exist in that market area.
Since any ASC will offer fewer services than both Hospital A and B, those ASCs will have less negotiating leverage with commercial carriers and, therefore, often will receive lower reimbursement rates than either Hospital A or B if they want to be included in the insurer’s network. While the efficiency inherent in the ASC model explains why ASCs can continue to exist when receiving significantly lower payments, it is the market power of hospitals that widens these price disparities3 4.
As a result of these factors, the total price of a procedure performed at an ASC is generally significantly lower than the total price of the same procedure performed in an HOPD. For example, the average price of cataract surgery at an ASC in Charleston, West Virginia, is $2,932, including the physician and anesthesi-ologist payments, while the average price at an HOPD is $5,762 (Figure 2). In this example,
the average price for a cataract surgery at the least expensive facility was $2,684, including the payments to anesthesiologists and physi-cians. At the most expensive facility, the average price was $7,987. ASCs are at the low end of the spectrum and HOPDs are at the high end.
This commercial price differential between the ASC and HOPD environments is persistent across metropolitan areas (Figure 3), insur-ance carriers and procedure categories, with the degree of price variability related to local market factors.
Summary of Methodology All analysis was conducted using a sample of de-identified commercial claims data for calendar year 2014 from HealthSmart. This data represents more than 400,000 lives across all regions of the U.S. The CMS list of ASC-eligible procedure codes, with a few additions reflecting those prevalent in a
Figure 2
commercial population (pediatric-related codes, OB/GYN-related codes, etc.), was used to identify the spending on procedures that can be performed in an ASC.
Total price of service was included in the analysis (facility fees, professional fees and anesthesia fees, where relevant). Based on the commercial population considered, these services accounted for about 19 percent of total medical spend, or $890 per person for the year. All prices are calculated using the “allowed” amount, which reflects the actual amount a provider received after any discounts were applied.
Thirteen high-volume outpatient procedures were used as proxies to analyze the price differential between the ASC and HOPD environments and estimate the percentage of spending that could be saved by performing the procedures in ASCs instead of HOPDs. An adjustment was made to account for the fact that some high-risk patients are not candidates
for ASC-based care (patients with high comor-bidities are traditionally directed to an HOPD in order to be closer to critical-access care). This adjusted percentage was applied to the $890 ASC-eligible spend per person and then scaled by the commercially insured U.S. population to estimate the national savings potential.
All estimates are based on the calendar year 2014 data. No adjustments were made to account for population aging or increasing utilization of ASC-eligible services. (See Appendix A: Methodology and Appendix B: Adjustments for ASC Ineligibility for a more detailed explanation of the methodology.)
Current ASC Use Reduces Private Healthcare Costs by $38 Billion AnnuallyThe lower cost of care in ASCs relative to HOPDs saves employers and consumers tens of billions of dollars a year. For the commer-cially insured population in the U.S., an
estimated $37.8 billion is saved annually by using ASCs. Stated differently, if all of the procedures currently performed in ASCs for the commercially insured population in the U.S. were performed in HOPDs, the cost of those procedures would increase by $37.8 billion in just one year.
Potential Cost Reductions Attributed to ASCsDespite the savings detailed above, for com-mercially insured populations, only 48 percent of procedures commonly performed in ASCs are actually performed in ASCs. If the remain-ing 52 percent were performed at ASC price points, an additional $41 billion in healthcare costs could be saved annually.
As a practical matter, ASCs would not be the appropriate setting for a small percentage of patients (e.g., those with serious health issues) currently treated in HOPDs. For example, patients on dialysis (0.1 percent of Americans) are not ASC eligible for certain procedures. When ASC-ineligible cases are accounted for, the total potential annual savings from performing the surgeries in ASCs instead of HOPDs is $38.2B. (This assumes 3 percent of relevant cases are ASC ineligible. See Appen-dix B: Adjustments for ASC Ineligibility.)
The average ASC price, however, is a blend of both lower-priced and higher-priced ASCs. The optimal migration of cases would shift cases from HOPDs to the local low-price ASCs. If patients were directed to low-price ASCs only, the potential annual savings increases from $38.2 billion to $55.6 billion.
Migrating a meaningful number of patients to lower-cost ASC settings would, undoubtedly, also have the added benefit of causing HOPDs
to consider price reductions in order to main-tain their market share. While this study did not attempt to model the competitive reactions of HOPDs if confronted with a significant loss of patient volume, fundamental economic princi-ples as well as a recent study that looked at the impact of reference-based pricing on patient choices concluded that hospitals did, in fact, lower their pricing for certain procedures in response to a loss of market share to competing ASCs5.
Potential Savings Can Grow if ASCs Can Perform More Complex ProceduresWith advances in surgical techniques, pain management and post-surgical care, more procedures traditionally performed in the inpatient setting are being shifted to ASCs. This creates an expanding frontier for reducing healthcare costs. As an example, total hip and total knee replacements, which currently account for about 1.5 percent of total medical spend, are now being performed safely in ASCs in a limited number of markets. The potential savings are significant. Assuming that the price differential and the rate of ASC ineligibility due to comorbidities for total joint replacement will be commensurate with other outpatient procedures, $3.2 billion could be
saved by moving total hip and knee replace-ments to ASCs. (See Appendix A: Methodology.)
Projected NationalCost ReductionsTo realize the potential cost reductions high-lighted above, several things need to happen. On the supply side, ASC capacity will have to double in order to support the migration from HOPDs.
On the demand side, patients must be educat-ed and incentivized to choose ASCs for their outpatient procedures. As premiums rise and adoption of high-deductible health plans increases, patients have greater incentives to reduce their costs by choosing ASC-based care, but education is lacking. Though health-care transparency has made significant advancements in recent years, most patients are still unaware of the lower costs that ASCs offer.
Even modest changes in market share produce massive savings for the entire health system. For example, if an additional 5 percent of current HOPD cases were moved to ASCs annually over the next ten years, $113.8 billion would be saved compared to current utilization rates (Table 1). This assumes that the annual potential ASC savings is currently $41.4 billion:
$38.2 billion from current ASC-eligible proce-dures above plus $3.2 billion from total knee and hip replacement.
For ASC eligible procedures in this study, patients were responsible for 15 percent of the cost on average. That would mean $17.1 billion in reduced costs for patients over the next ten years (Figure 4). If 3 percent or 8 percent of HOPD cases were moved to ASCs annually, ten-year savings would be $68.3 billion and $182 billion respectively (Table 2).
These estimates do not account for inflation or upward trends in medical spending. They also do not take into account the potential that HOPD pricing will decrease in order to com-pete with ASCs, which would create further outpatient savings. As referenced above, in the CalPERS reference pricing program, high- priced providers will reduce prices to be com- petitive and attract price-sensitive consumers.
Reducing Costs forEmployers and EmployeesFrom 2005 to 2015, average health insurance premiums for employer-sponsored family coverage increased 61 percent, from $10,880 to $17,545 per year. To combat these rising costs, employers have increasingly adopted Consumer Driven Health Plans (CDHP) and account-based plan types, shifting costs to employees. This has driven the average employee’s share of healthcare spending up 81 percent in the same time period, from $2,713 to $4,9556 annually. This highlights the need for programs like price transparency that can help patients identify better value providers within their networks so that employers and their employees both can lower costs.
For example, in Charlotte, NC, the average ASC price for a knee arthroscopy was $6,118, while the average HOPD price was $12,493, more than twice as expensive. That means $6,375 is saved on average in Charlotte, NC, when a patient chooses an ASC for a knee arthroscopy. How those savings are divided between the payer and the patient depends on the plan design.
For a knee arthroscopy in Charlotte, NC, if a patient has a Silver Plan as defined by the Affordable Care Act, with a $2,700 deductible, 80 percent coinsurance and $5,000 maximum out of pocket, the patient would save $1,275— more than the median family’s weekly income. The remaining $5,100 would be saved by the payer. For self-funded employer-sponsored insurance, that is $5,100 directly to the bottom line for the employer.
Applying the same plan design to the earlier example of cataract surgery in Charleston, WV, a patient would save $566 by choosing an ASC instead of an HOPD. This is a significant savings in a geographic area where annual income per capita is less than $35,0007. The payer would realize an additional savings of $2,264.
Estimating Savings for Self-Insured PopulationsFor employers that self insure, it is reasonably straightforward to estimate the potential cost reductions from ASCs for their covered employees. With $890 in ASC-eligible spend-ing per commercially insured person and 20.6 percent savings opportunity from moving all
ASC-eligible cases from HOPDs to ASCs, $183 in potential ASC savings exists per commercially insured person. A self-funded employer with 1,000 employees is normally covering more than 2,000 lives, when employ-ees and dependents are counted, which means a potential ASC-based savings of more than $366,000 for the employer and employees.
ConclusionBillions of dollars spent each year on commer-cially insured outpatient surgeries and proce-dures can be reduced, without compromising quality, if more cases migrate to ambulatory surgery centers. While a small percentage of patients have health conditions that require outpatient care to be received in proximity to a full-service hospital should complications arise, most patients can receive the same level of care at lower cost by seeking treatment in an ASC. Advances in medical technology and pain control are allowing increasingly complex procedures, such as total joint replacements, to be performed in an outpatient setting.
Policymakers, insurers, employers and benefi-ciaries all have a shared interest in reducing healthcare costs, and the $38 billion in annual savings identified in this study highlight the role that ASCs already play in controlling these costs. Strategies should be implemented to generate additional savings by ensuring that the most efficient site of service for outpatient care is selected whenever possible. In particu-lar, innovative plan design and increased consumer awareness of the benefits of receiv-ing care in an ASC can save thousands of dollars per procedure.
Average Cataract Surgery Price* by Facility─Charleston, WV
$2,684$3,181
$3,373$4,002
$4,543$5,896
$6,023$6,571
$7,697$7,987
Dis
tinct
Fac
ilitie
s
HOPDASC
* Includes allowed amounts for all claim components: anesthesia, professional and facility.

Healthcare prices vary dramatically even within the same insurance network and city. For example, in Charleston, West Virginia, the price of a cataract surgery, including payments to the anesthesiologist and physician, can vary from $2,684 to $8,662 depending on the facility where the surgery is performed (Figure 1). In this case prices vary by more than 300 percent, primarily due to the amount charged by the facility – not the physicians. These facility prices vary by almost 600 percent and total more than 70 percent of all dollars spent for cataract surgery in Charleston, WV.
Payments to anesthesiologists vary, partially due to the time component of anesthesia billing, but these payments are the smallest
portion of the total cost and are dwarfed by payments to facilities.
Payments to physicians are a more significant portion of total cost, but physicians performing the most expensive cataract surgeries are paid approximately the same as physicians performing the least expensive surgeries. Thus, it is the choice of facility that drives the total price variation.
The consistency of payments to physicians indicates that most physicians are unable to differentiate themselves when negotiating payment rates from insurance companies and, hence, are paid similar rates. Facilities, on the other hand, vary significantly in their service
offerings and market power and, therefore, have significantly different negotiated rates with insurance companies.
For example, Hospital A provides emergency, inpatient and outpatient care. Hospital B offers everything Hospital A offers and also operates the only children’s hospital in the metropolitan area. Due to this exclusive service line, Hospi-tal B has better negotiating leverage with an insurance company. Importantly, this leverage applies not only to services uniquely performed in the children’s hospital, but also to outpatient surgeries, such as cataract surgery, that are performed in other facilities in the area. Since the entire hospital is either in or out of network, all services are negotiated together, allowing Hospital B to demand higher reimbursement for procedures even though equally good, lower-priced alternative sites of service exist in that market area.
Since any ASC will offer fewer services than both Hospital A and B, those ASCs will have less negotiating leverage with commercial carriers and, therefore, often will receive lower reimbursement rates than either Hospital A or B if they want to be included in the insurer’s network. While the efficiency inherent in the ASC model explains why ASCs can continue to exist when receiving significantly lower payments, it is the market power of hospitals that widens these price disparities3 4.
As a result of these factors, the total price of a procedure performed at an ASC is generally significantly lower than the total price of the same procedure performed in an HOPD. For example, the average price of cataract surgery at an ASC in Charleston, West Virginia, is $2,932, including the physician and anesthesi-ologist payments, while the average price at an HOPD is $5,762 (Figure 2). In this example,
6
the average price for a cataract surgery at the least expensive facility was $2,684, including the payments to anesthesiologists and physi-cians. At the most expensive facility, the average price was $7,987. ASCs are at the low end of the spectrum and HOPDs are at the high end.
This commercial price differential between the ASC and HOPD environments is persistent across metropolitan areas (Figure 3), insur-ance carriers and procedure categories, with the degree of price variability related to local market factors.
Summary of Methodology All analysis was conducted using a sample of de-identified commercial claims data for calendar year 2014 from HealthSmart. This data represents more than 400,000 lives across all regions of the U.S. The CMS list of ASC-eligible procedure codes, with a few additions reflecting those prevalent in a
Figure 3
commercial population (pediatric-related codes, OB/GYN-related codes, etc.), was used to identify the spending on procedures that can be performed in an ASC.
Total price of service was included in the analysis (facility fees, professional fees and anesthesia fees, where relevant). Based on the commercial population considered, these services accounted for about 19 percent of total medical spend, or $890 per person for the year. All prices are calculated using the “allowed” amount, which reflects the actual amount a provider received after any discounts were applied.
Thirteen high-volume outpatient procedures were used as proxies to analyze the price differential between the ASC and HOPD environments and estimate the percentage of spending that could be saved by performing the procedures in ASCs instead of HOPDs. An adjustment was made to account for the fact that some high-risk patients are not candidates
for ASC-based care (patients with high comor-bidities are traditionally directed to an HOPD in order to be closer to critical-access care). This adjusted percentage was applied to the $890 ASC-eligible spend per person and then scaled by the commercially insured U.S. population to estimate the national savings potential.
All estimates are based on the calendar year 2014 data. No adjustments were made to account for population aging or increasing utilization of ASC-eligible services. (See Appendix A: Methodology and Appendix B: Adjustments for ASC Ineligibility for a more detailed explanation of the methodology.)
Current ASC Use Reduces Private Healthcare Costs by $38 Billion AnnuallyThe lower cost of care in ASCs relative to HOPDs saves employers and consumers tens of billions of dollars a year. For the commer-cially insured population in the U.S., an
estimated $37.8 billion is saved annually by using ASCs. Stated differently, if all of the procedures currently performed in ASCs for the commercially insured population in the U.S. were performed in HOPDs, the cost of those procedures would increase by $37.8 billion in just one year.
Potential Cost Reductions Attributed to ASCsDespite the savings detailed above, for com-mercially insured populations, only 48 percent of procedures commonly performed in ASCs are actually performed in ASCs. If the remain-ing 52 percent were performed at ASC price points, an additional $41 billion in healthcare costs could be saved annually.
As a practical matter, ASCs would not be the appropriate setting for a small percentage of patients (e.g., those with serious health issues) currently treated in HOPDs. For example, patients on dialysis (0.1 percent of Americans) are not ASC eligible for certain procedures. When ASC-ineligible cases are accounted for, the total potential annual savings from performing the surgeries in ASCs instead of HOPDs is $38.2B. (This assumes 3 percent of relevant cases are ASC ineligible. See Appen-dix B: Adjustments for ASC Ineligibility.)
The average ASC price, however, is a blend of both lower-priced and higher-priced ASCs. The optimal migration of cases would shift cases from HOPDs to the local low-price ASCs. If patients were directed to low-price ASCs only, the potential annual savings increases from $38.2 billion to $55.6 billion.
Migrating a meaningful number of patients to lower-cost ASC settings would, undoubtedly, also have the added benefit of causing HOPDs
to consider price reductions in order to main-tain their market share. While this study did not attempt to model the competitive reactions of HOPDs if confronted with a significant loss of patient volume, fundamental economic princi-ples as well as a recent study that looked at the impact of reference-based pricing on patient choices concluded that hospitals did, in fact, lower their pricing for certain procedures in response to a loss of market share to competing ASCs5.
Potential Savings Can Grow if ASCs Can Perform More Complex ProceduresWith advances in surgical techniques, pain management and post-surgical care, more procedures traditionally performed in the inpatient setting are being shifted to ASCs. This creates an expanding frontier for reducing healthcare costs. As an example, total hip and total knee replacements, which currently account for about 1.5 percent of total medical spend, are now being performed safely in ASCs in a limited number of markets. The potential savings are significant. Assuming that the price differential and the rate of ASC ineligibility due to comorbidities for total joint replacement will be commensurate with other outpatient procedures, $3.2 billion could be
saved by moving total hip and knee replace-ments to ASCs. (See Appendix A: Methodology.)
Projected NationalCost ReductionsTo realize the potential cost reductions high-lighted above, several things need to happen. On the supply side, ASC capacity will have to double in order to support the migration from HOPDs.
On the demand side, patients must be educat-ed and incentivized to choose ASCs for their outpatient procedures. As premiums rise and adoption of high-deductible health plans increases, patients have greater incentives to reduce their costs by choosing ASC-based care, but education is lacking. Though health-care transparency has made significant advancements in recent years, most patients are still unaware of the lower costs that ASCs offer.
Even modest changes in market share produce massive savings for the entire health system. For example, if an additional 5 percent of current HOPD cases were moved to ASCs annually over the next ten years, $113.8 billion would be saved compared to current utilization rates (Table 1). This assumes that the annual potential ASC savings is currently $41.4 billion:
$38.2 billion from current ASC-eligible proce-dures above plus $3.2 billion from total knee and hip replacement.
For ASC eligible procedures in this study, patients were responsible for 15 percent of the cost on average. That would mean $17.1 billion in reduced costs for patients over the next ten years (Figure 4). If 3 percent or 8 percent of HOPD cases were moved to ASCs annually, ten-year savings would be $68.3 billion and $182 billion respectively (Table 2).
These estimates do not account for inflation or upward trends in medical spending. They also do not take into account the potential that HOPD pricing will decrease in order to com-pete with ASCs, which would create further outpatient savings. As referenced above, in the CalPERS reference pricing program, high- priced providers will reduce prices to be com- petitive and attract price-sensitive consumers.
Reducing Costs forEmployers and EmployeesFrom 2005 to 2015, average health insurance premiums for employer-sponsored family coverage increased 61 percent, from $10,880 to $17,545 per year. To combat these rising costs, employers have increasingly adopted Consumer Driven Health Plans (CDHP) and account-based plan types, shifting costs to employees. This has driven the average employee’s share of healthcare spending up 81 percent in the same time period, from $2,713 to $4,9556 annually. This highlights the need for programs like price transparency that can help patients identify better value providers within their networks so that employers and their employees both can lower costs.
For example, in Charlotte, NC, the average ASC price for a knee arthroscopy was $6,118, while the average HOPD price was $12,493, more than twice as expensive. That means $6,375 is saved on average in Charlotte, NC, when a patient chooses an ASC for a knee arthroscopy. How those savings are divided between the payer and the patient depends on the plan design.
For a knee arthroscopy in Charlotte, NC, if a patient has a Silver Plan as defined by the Affordable Care Act, with a $2,700 deductible, 80 percent coinsurance and $5,000 maximum out of pocket, the patient would save $1,275— more than the median family’s weekly income. The remaining $5,100 would be saved by the payer. For self-funded employer-sponsored insurance, that is $5,100 directly to the bottom line for the employer.
Applying the same plan design to the earlier example of cataract surgery in Charleston, WV, a patient would save $566 by choosing an ASC instead of an HOPD. This is a significant savings in a geographic area where annual income per capita is less than $35,0007. The payer would realize an additional savings of $2,264.
Estimating Savings for Self-Insured PopulationsFor employers that self insure, it is reasonably straightforward to estimate the potential cost reductions from ASCs for their covered employees. With $890 in ASC-eligible spend-ing per commercially insured person and 20.6 percent savings opportunity from moving all
ASC-eligible cases from HOPDs to ASCs, $183 in potential ASC savings exists per commercially insured person. A self-funded employer with 1,000 employees is normally covering more than 2,000 lives, when employ-ees and dependents are counted, which means a potential ASC-based savings of more than $366,000 for the employer and employees.
ConclusionBillions of dollars spent each year on commer-cially insured outpatient surgeries and proce-dures can be reduced, without compromising quality, if more cases migrate to ambulatory surgery centers. While a small percentage of patients have health conditions that require outpatient care to be received in proximity to a full-service hospital should complications arise, most patients can receive the same level of care at lower cost by seeking treatment in an ASC. Advances in medical technology and pain control are allowing increasingly complex procedures, such as total joint replacements, to be performed in an outpatient setting.
Policymakers, insurers, employers and benefi-ciaries all have a shared interest in reducing healthcare costs, and the $38 billion in annual savings identified in this study highlight the role that ASCs already play in controlling these costs. Strategies should be implemented to generate additional savings by ensuring that the most efficient site of service for outpatient care is selected whenever possible. In particu-lar, innovative plan design and increased consumer awareness of the benefits of receiv-ing care in an ASC can save thousands of dollars per procedure.
$0 $1000
Tulsa
Evansville
Charleston
$2000 $3000 $4000 $5000 $6000 $7000 $8000 $9000Total Price
Dis
tinct
Fac
ilitie
s
Average Cataract Surgery Price* by Market & Facility
HOPDASC
* Includes allowed amounts for all claim components: anesthesia, professional and facility.

Healthcare prices vary dramatically even within the same insurance network and city. For example, in Charleston, West Virginia, the price of a cataract surgery, including payments to the anesthesiologist and physician, can vary from $2,684 to $8,662 depending on the facility where the surgery is performed (Figure 1). In this case prices vary by more than 300 percent, primarily due to the amount charged by the facility – not the physicians. These facility prices vary by almost 600 percent and total more than 70 percent of all dollars spent for cataract surgery in Charleston, WV.
Payments to anesthesiologists vary, partially due to the time component of anesthesia billing, but these payments are the smallest
portion of the total cost and are dwarfed by payments to facilities.
Payments to physicians are a more significant portion of total cost, but physicians performing the most expensive cataract surgeries are paid approximately the same as physicians performing the least expensive surgeries. Thus, it is the choice of facility that drives the total price variation.
The consistency of payments to physicians indicates that most physicians are unable to differentiate themselves when negotiating payment rates from insurance companies and, hence, are paid similar rates. Facilities, on the other hand, vary significantly in their service
offerings and market power and, therefore, have significantly different negotiated rates with insurance companies.
For example, Hospital A provides emergency, inpatient and outpatient care. Hospital B offers everything Hospital A offers and also operates the only children’s hospital in the metropolitan area. Due to this exclusive service line, Hospi-tal B has better negotiating leverage with an insurance company. Importantly, this leverage applies not only to services uniquely performed in the children’s hospital, but also to outpatient surgeries, such as cataract surgery, that are performed in other facilities in the area. Since the entire hospital is either in or out of network, all services are negotiated together, allowing Hospital B to demand higher reimbursement for procedures even though equally good, lower-priced alternative sites of service exist in that market area.
Since any ASC will offer fewer services than both Hospital A and B, those ASCs will have less negotiating leverage with commercial carriers and, therefore, often will receive lower reimbursement rates than either Hospital A or B if they want to be included in the insurer’s network. While the efficiency inherent in the ASC model explains why ASCs can continue to exist when receiving significantly lower payments, it is the market power of hospitals that widens these price disparities3 4.
As a result of these factors, the total price of a procedure performed at an ASC is generally significantly lower than the total price of the same procedure performed in an HOPD. For example, the average price of cataract surgery at an ASC in Charleston, West Virginia, is $2,932, including the physician and anesthesi-ologist payments, while the average price at an HOPD is $5,762 (Figure 2). In this example,
the average price for a cataract surgery at the least expensive facility was $2,684, including the payments to anesthesiologists and physi-cians. At the most expensive facility, the average price was $7,987. ASCs are at the low end of the spectrum and HOPDs are at the high end.
This commercial price differential between the ASC and HOPD environments is persistent across metropolitan areas (Figure 3), insur-ance carriers and procedure categories, with the degree of price variability related to local market factors.
Summary of Methodology All analysis was conducted using a sample of de-identified commercial claims data for calendar year 2014 from HealthSmart. This data represents more than 400,000 lives across all regions of the U.S. The CMS list of ASC-eligible procedure codes, with a few additions reflecting those prevalent in a
7
commercial population (pediatric-related codes, OB/GYN-related codes, etc.), was used to identify the spending on procedures that can be performed in an ASC.
Total price of service was included in the analysis (facility fees, professional fees and anesthesia fees, where relevant). Based on the commercial population considered, these services accounted for about 19 percent of total medical spend, or $890 per person for the year. All prices are calculated using the “allowed” amount, which reflects the actual amount a provider received after any discounts were applied.
Thirteen high-volume outpatient procedures were used as proxies to analyze the price differential between the ASC and HOPD environments and estimate the percentage of spending that could be saved by performing the procedures in ASCs instead of HOPDs. An adjustment was made to account for the fact that some high-risk patients are not candidates
for ASC-based care (patients with high comor-bidities are traditionally directed to an HOPD in order to be closer to critical-access care). This adjusted percentage was applied to the $890 ASC-eligible spend per person and then scaled by the commercially insured U.S. population to estimate the national savings potential.
All estimates are based on the calendar year 2014 data. No adjustments were made to account for population aging or increasing utilization of ASC-eligible services. (See Appendix A: Methodology and Appendix B: Adjustments for ASC Ineligibility for a more detailed explanation of the methodology.)
Current ASC Use Reduces Private Healthcare Costs by $38 Billion AnnuallyThe lower cost of care in ASCs relative to HOPDs saves employers and consumers tens of billions of dollars a year. For the commer-cially insured population in the U.S., an
estimated $37.8 billion is saved annually by using ASCs. Stated differently, if all of the procedures currently performed in ASCs for the commercially insured population in the U.S. were performed in HOPDs, the cost of those procedures would increase by $37.8 billion in just one year.
Potential Cost Reductions Attributed to ASCsDespite the savings detailed above, for com-mercially insured populations, only 48 percent of procedures commonly performed in ASCs are actually performed in ASCs. If the remain-ing 52 percent were performed at ASC price points, an additional $41 billion in healthcare costs could be saved annually.
As a practical matter, ASCs would not be the appropriate setting for a small percentage of patients (e.g., those with serious health issues) currently treated in HOPDs. For example, patients on dialysis (0.1 percent of Americans) are not ASC eligible for certain procedures. When ASC-ineligible cases are accounted for, the total potential annual savings from performing the surgeries in ASCs instead of HOPDs is $38.2B. (This assumes 3 percent of relevant cases are ASC ineligible. See Appen-dix B: Adjustments for ASC Ineligibility.)
The average ASC price, however, is a blend of both lower-priced and higher-priced ASCs. The optimal migration of cases would shift cases from HOPDs to the local low-price ASCs. If patients were directed to low-price ASCs only, the potential annual savings increases from $38.2 billion to $55.6 billion.
Migrating a meaningful number of patients to lower-cost ASC settings would, undoubtedly, also have the added benefit of causing HOPDs
to consider price reductions in order to main-tain their market share. While this study did not attempt to model the competitive reactions of HOPDs if confronted with a significant loss of patient volume, fundamental economic princi-ples as well as a recent study that looked at the impact of reference-based pricing on patient choices concluded that hospitals did, in fact, lower their pricing for certain procedures in response to a loss of market share to competing ASCs5.
Potential Savings Can Grow if ASCs Can Perform More Complex ProceduresWith advances in surgical techniques, pain management and post-surgical care, more procedures traditionally performed in the inpatient setting are being shifted to ASCs. This creates an expanding frontier for reducing healthcare costs. As an example, total hip and total knee replacements, which currently account for about 1.5 percent of total medical spend, are now being performed safely in ASCs in a limited number of markets. The potential savings are significant. Assuming that the price differential and the rate of ASC ineligibility due to comorbidities for total joint replacement will be commensurate with other outpatient procedures, $3.2 billion could be
saved by moving total hip and knee replace-ments to ASCs. (See Appendix A: Methodology.)
Projected NationalCost ReductionsTo realize the potential cost reductions high-lighted above, several things need to happen. On the supply side, ASC capacity will have to double in order to support the migration from HOPDs.
On the demand side, patients must be educat-ed and incentivized to choose ASCs for their outpatient procedures. As premiums rise and adoption of high-deductible health plans increases, patients have greater incentives to reduce their costs by choosing ASC-based care, but education is lacking. Though health-care transparency has made significant advancements in recent years, most patients are still unaware of the lower costs that ASCs offer.
Even modest changes in market share produce massive savings for the entire health system. For example, if an additional 5 percent of current HOPD cases were moved to ASCs annually over the next ten years, $113.8 billion would be saved compared to current utilization rates (Table 1). This assumes that the annual potential ASC savings is currently $41.4 billion:
$38.2 billion from current ASC-eligible proce-dures above plus $3.2 billion from total knee and hip replacement.
For ASC eligible procedures in this study, patients were responsible for 15 percent of the cost on average. That would mean $17.1 billion in reduced costs for patients over the next ten years (Figure 4). If 3 percent or 8 percent of HOPD cases were moved to ASCs annually, ten-year savings would be $68.3 billion and $182 billion respectively (Table 2).
These estimates do not account for inflation or upward trends in medical spending. They also do not take into account the potential that HOPD pricing will decrease in order to com-pete with ASCs, which would create further outpatient savings. As referenced above, in the CalPERS reference pricing program, high- priced providers will reduce prices to be com- petitive and attract price-sensitive consumers.
Reducing Costs forEmployers and EmployeesFrom 2005 to 2015, average health insurance premiums for employer-sponsored family coverage increased 61 percent, from $10,880 to $17,545 per year. To combat these rising costs, employers have increasingly adopted Consumer Driven Health Plans (CDHP) and account-based plan types, shifting costs to employees. This has driven the average employee’s share of healthcare spending up 81 percent in the same time period, from $2,713 to $4,9556 annually. This highlights the need for programs like price transparency that can help patients identify better value providers within their networks so that employers and their employees both can lower costs.
For example, in Charlotte, NC, the average ASC price for a knee arthroscopy was $6,118, while the average HOPD price was $12,493, more than twice as expensive. That means $6,375 is saved on average in Charlotte, NC, when a patient chooses an ASC for a knee arthroscopy. How those savings are divided between the payer and the patient depends on the plan design.
For a knee arthroscopy in Charlotte, NC, if a patient has a Silver Plan as defined by the Affordable Care Act, with a $2,700 deductible, 80 percent coinsurance and $5,000 maximum out of pocket, the patient would save $1,275— more than the median family’s weekly income. The remaining $5,100 would be saved by the payer. For self-funded employer-sponsored insurance, that is $5,100 directly to the bottom line for the employer.
Applying the same plan design to the earlier example of cataract surgery in Charleston, WV, a patient would save $566 by choosing an ASC instead of an HOPD. This is a significant savings in a geographic area where annual income per capita is less than $35,0007. The payer would realize an additional savings of $2,264.
Estimating Savings for Self-Insured PopulationsFor employers that self insure, it is reasonably straightforward to estimate the potential cost reductions from ASCs for their covered employees. With $890 in ASC-eligible spend-ing per commercially insured person and 20.6 percent savings opportunity from moving all
ASC-eligible cases from HOPDs to ASCs, $183 in potential ASC savings exists per commercially insured person. A self-funded employer with 1,000 employees is normally covering more than 2,000 lives, when employ-ees and dependents are counted, which means a potential ASC-based savings of more than $366,000 for the employer and employees.
ConclusionBillions of dollars spent each year on commer-cially insured outpatient surgeries and proce-dures can be reduced, without compromising quality, if more cases migrate to ambulatory surgery centers. While a small percentage of patients have health conditions that require outpatient care to be received in proximity to a full-service hospital should complications arise, most patients can receive the same level of care at lower cost by seeking treatment in an ASC. Advances in medical technology and pain control are allowing increasingly complex procedures, such as total joint replacements, to be performed in an outpatient setting.
Policymakers, insurers, employers and benefi-ciaries all have a shared interest in reducing healthcare costs, and the $38 billion in annual savings identified in this study highlight the role that ASCs already play in controlling these costs. Strategies should be implemented to generate additional savings by ensuring that the most efficient site of service for outpatient care is selected whenever possible. In particu-lar, innovative plan design and increased consumer awareness of the benefits of receiv-ing care in an ASC can save thousands of dollars per procedure.
Annual Savings from ProceduresPerformed in ASCs
% of Common ASC ProceduresCurrently Performed at ASCs
Current Annual Savings
Potential Additional AnnualSavings
Potential Additional AnnualSavings from OptimalMigration to ASCs
48%
$37.8 B
$38.2 B
$55.6 B

Healthcare prices vary dramatically even within the same insurance network and city. For example, in Charleston, West Virginia, the price of a cataract surgery, including payments to the anesthesiologist and physician, can vary from $2,684 to $8,662 depending on the facility where the surgery is performed (Figure 1). In this case prices vary by more than 300 percent, primarily due to the amount charged by the facility – not the physicians. These facility prices vary by almost 600 percent and total more than 70 percent of all dollars spent for cataract surgery in Charleston, WV.
Payments to anesthesiologists vary, partially due to the time component of anesthesia billing, but these payments are the smallest
portion of the total cost and are dwarfed by payments to facilities.
Payments to physicians are a more significant portion of total cost, but physicians performing the most expensive cataract surgeries are paid approximately the same as physicians performing the least expensive surgeries. Thus, it is the choice of facility that drives the total price variation.
The consistency of payments to physicians indicates that most physicians are unable to differentiate themselves when negotiating payment rates from insurance companies and, hence, are paid similar rates. Facilities, on the other hand, vary significantly in their service
offerings and market power and, therefore, have significantly different negotiated rates with insurance companies.
For example, Hospital A provides emergency, inpatient and outpatient care. Hospital B offers everything Hospital A offers and also operates the only children’s hospital in the metropolitan area. Due to this exclusive service line, Hospi-tal B has better negotiating leverage with an insurance company. Importantly, this leverage applies not only to services uniquely performed in the children’s hospital, but also to outpatient surgeries, such as cataract surgery, that are performed in other facilities in the area. Since the entire hospital is either in or out of network, all services are negotiated together, allowing Hospital B to demand higher reimbursement for procedures even though equally good, lower-priced alternative sites of service exist in that market area.
Since any ASC will offer fewer services than both Hospital A and B, those ASCs will have less negotiating leverage with commercial carriers and, therefore, often will receive lower reimbursement rates than either Hospital A or B if they want to be included in the insurer’s network. While the efficiency inherent in the ASC model explains why ASCs can continue to exist when receiving significantly lower payments, it is the market power of hospitals that widens these price disparities3 4.
As a result of these factors, the total price of a procedure performed at an ASC is generally significantly lower than the total price of the same procedure performed in an HOPD. For example, the average price of cataract surgery at an ASC in Charleston, West Virginia, is $2,932, including the physician and anesthesi-ologist payments, while the average price at an HOPD is $5,762 (Figure 2). In this example,
the average price for a cataract surgery at the least expensive facility was $2,684, including the payments to anesthesiologists and physi-cians. At the most expensive facility, the average price was $7,987. ASCs are at the low end of the spectrum and HOPDs are at the high end.
This commercial price differential between the ASC and HOPD environments is persistent across metropolitan areas (Figure 3), insur-ance carriers and procedure categories, with the degree of price variability related to local market factors.
Summary of Methodology All analysis was conducted using a sample of de-identified commercial claims data for calendar year 2014 from HealthSmart. This data represents more than 400,000 lives across all regions of the U.S. The CMS list of ASC-eligible procedure codes, with a few additions reflecting those prevalent in a
commercial population (pediatric-related codes, OB/GYN-related codes, etc.), was used to identify the spending on procedures that can be performed in an ASC.
Total price of service was included in the analysis (facility fees, professional fees and anesthesia fees, where relevant). Based on the commercial population considered, these services accounted for about 19 percent of total medical spend, or $890 per person for the year. All prices are calculated using the “allowed” amount, which reflects the actual amount a provider received after any discounts were applied.
Thirteen high-volume outpatient procedures were used as proxies to analyze the price differential between the ASC and HOPD environments and estimate the percentage of spending that could be saved by performing the procedures in ASCs instead of HOPDs. An adjustment was made to account for the fact that some high-risk patients are not candidates
for ASC-based care (patients with high comor-bidities are traditionally directed to an HOPD in order to be closer to critical-access care). This adjusted percentage was applied to the $890 ASC-eligible spend per person and then scaled by the commercially insured U.S. population to estimate the national savings potential.
All estimates are based on the calendar year 2014 data. No adjustments were made to account for population aging or increasing utilization of ASC-eligible services. (See Appendix A: Methodology and Appendix B: Adjustments for ASC Ineligibility for a more detailed explanation of the methodology.)
Current ASC Use Reduces Private Healthcare Costs by $38 Billion AnnuallyThe lower cost of care in ASCs relative to HOPDs saves employers and consumers tens of billions of dollars a year. For the commer-cially insured population in the U.S., an
estimated $37.8 billion is saved annually by using ASCs. Stated differently, if all of the procedures currently performed in ASCs for the commercially insured population in the U.S. were performed in HOPDs, the cost of those procedures would increase by $37.8 billion in just one year.
Potential Cost Reductions Attributed to ASCsDespite the savings detailed above, for com-mercially insured populations, only 48 percent of procedures commonly performed in ASCs are actually performed in ASCs. If the remain-ing 52 percent were performed at ASC price points, an additional $41 billion in healthcare costs could be saved annually.
As a practical matter, ASCs would not be the appropriate setting for a small percentage of patients (e.g., those with serious health issues) currently treated in HOPDs. For example, patients on dialysis (0.1 percent of Americans) are not ASC eligible for certain procedures. When ASC-ineligible cases are accounted for, the total potential annual savings from performing the surgeries in ASCs instead of HOPDs is $38.2B. (This assumes 3 percent of relevant cases are ASC ineligible. See Appen-dix B: Adjustments for ASC Ineligibility.)
The average ASC price, however, is a blend of both lower-priced and higher-priced ASCs. The optimal migration of cases would shift cases from HOPDs to the local low-price ASCs. If patients were directed to low-price ASCs only, the potential annual savings increases from $38.2 billion to $55.6 billion.
Migrating a meaningful number of patients to lower-cost ASC settings would, undoubtedly, also have the added benefit of causing HOPDs
8
to consider price reductions in order to main-tain their market share. While this study did not attempt to model the competitive reactions of HOPDs if confronted with a significant loss of patient volume, fundamental economic princi-ples as well as a recent study that looked at the impact of reference-based pricing on patient choices concluded that hospitals did, in fact, lower their pricing for certain procedures in response to a loss of market share to competing ASCs5.
Potential Savings Can Grow if ASCs Can Perform More Complex ProceduresWith advances in surgical techniques, pain management and post-surgical care, more procedures traditionally performed in the inpatient setting are being shifted to ASCs. This creates an expanding frontier for reducing healthcare costs. As an example, total hip and total knee replacements, which currently account for about 1.5 percent of total medical spend, are now being performed safely in ASCs in a limited number of markets. The potential savings are significant. Assuming that the price differential and the rate of ASC ineligibility due to comorbidities for total joint replacement will be commensurate with other outpatient procedures, $3.2 billion could be
5 Robinson, J., et. al. (2015, March). Reference-Based Benefit Design Changes Consumers’ Choices And Employers’ Payments For Ambulatory Surgery. Health Affairs.
saved by moving total hip and knee replace-ments to ASCs. (See Appendix A: Methodology.)
Projected NationalCost ReductionsTo realize the potential cost reductions high-lighted above, several things need to happen. On the supply side, ASC capacity will have to double in order to support the migration from HOPDs.
On the demand side, patients must be educat-ed and incentivized to choose ASCs for their outpatient procedures. As premiums rise and adoption of high-deductible health plans increases, patients have greater incentives to reduce their costs by choosing ASC-based care, but education is lacking. Though health-care transparency has made significant advancements in recent years, most patients are still unaware of the lower costs that ASCs offer.
Even modest changes in market share produce massive savings for the entire health system. For example, if an additional 5 percent of current HOPD cases were moved to ASCs annually over the next ten years, $113.8 billion would be saved compared to current utilization rates (Table 1). This assumes that the annual potential ASC savings is currently $41.4 billion:
$38.2 billion from current ASC-eligible proce-dures above plus $3.2 billion from total knee and hip replacement.
For ASC eligible procedures in this study, patients were responsible for 15 percent of the cost on average. That would mean $17.1 billion in reduced costs for patients over the next ten years (Figure 4). If 3 percent or 8 percent of HOPD cases were moved to ASCs annually, ten-year savings would be $68.3 billion and $182 billion respectively (Table 2).
These estimates do not account for inflation or upward trends in medical spending. They also do not take into account the potential that HOPD pricing will decrease in order to com-pete with ASCs, which would create further outpatient savings. As referenced above, in the CalPERS reference pricing program, high- priced providers will reduce prices to be com- petitive and attract price-sensitive consumers.
Reducing Costs forEmployers and EmployeesFrom 2005 to 2015, average health insurance premiums for employer-sponsored family coverage increased 61 percent, from $10,880 to $17,545 per year. To combat these rising costs, employers have increasingly adopted Consumer Driven Health Plans (CDHP) and account-based plan types, shifting costs to employees. This has driven the average employee’s share of healthcare spending up 81 percent in the same time period, from $2,713 to $4,9556 annually. This highlights the need for programs like price transparency that can help patients identify better value providers within their networks so that employers and their employees both can lower costs.
Table 1
For example, in Charlotte, NC, the average ASC price for a knee arthroscopy was $6,118, while the average HOPD price was $12,493, more than twice as expensive. That means $6,375 is saved on average in Charlotte, NC, when a patient chooses an ASC for a knee arthroscopy. How those savings are divided between the payer and the patient depends on the plan design.
For a knee arthroscopy in Charlotte, NC, if a patient has a Silver Plan as defined by the Affordable Care Act, with a $2,700 deductible, 80 percent coinsurance and $5,000 maximum out of pocket, the patient would save $1,275— more than the median family’s weekly income. The remaining $5,100 would be saved by the payer. For self-funded employer-sponsored insurance, that is $5,100 directly to the bottom line for the employer.
Applying the same plan design to the earlier example of cataract surgery in Charleston, WV, a patient would save $566 by choosing an ASC instead of an HOPD. This is a significant savings in a geographic area where annual income per capita is less than $35,0007. The payer would realize an additional savings of $2,264.
Estimating Savings for Self-Insured PopulationsFor employers that self insure, it is reasonably straightforward to estimate the potential cost reductions from ASCs for their covered employees. With $890 in ASC-eligible spend-ing per commercially insured person and 20.6 percent savings opportunity from moving all
ASC-eligible cases from HOPDs to ASCs, $183 in potential ASC savings exists per commercially insured person. A self-funded employer with 1,000 employees is normally covering more than 2,000 lives, when employ-ees and dependents are counted, which means a potential ASC-based savings of more than $366,000 for the employer and employees.
ConclusionBillions of dollars spent each year on commer-cially insured outpatient surgeries and proce-dures can be reduced, without compromising quality, if more cases migrate to ambulatory surgery centers. While a small percentage of patients have health conditions that require outpatient care to be received in proximity to a full-service hospital should complications arise, most patients can receive the same level of care at lower cost by seeking treatment in an ASC. Advances in medical technology and pain control are allowing increasingly complex procedures, such as total joint replacements, to be performed in an outpatient setting.
Policymakers, insurers, employers and benefi-ciaries all have a shared interest in reducing healthcare costs, and the $38 billion in annual savings identified in this study highlight the role that ASCs already play in controlling these costs. Strategies should be implemented to generate additional savings by ensuring that the most efficient site of service for outpatient care is selected whenever possible. In particu-lar, innovative plan design and increased consumer awareness of the benefits of receiv-ing care in an ASC can save thousands of dollars per procedure.
Estimating the Addressable Spend per Commercially Insured PatientThe addressable spend is the expenditure on any procedure that could be performed in an ASC for an ASC-eligible patient, whether that patient is ASC eligible or not. (Adjustments for ASC ineligible are made later in the process. See Appendix B: Adjustments for ASC Ineligibility.) All prices are calculated using the allowed amount, which is the actual amount a provider receives after any discounts are applied.
CMS currently covers 3,837 procedure codes in the ASC setting. Procedure codes from select Healthcare Bluebook ShopSmart™ procedures were added to the CMS list to produce a complete ASC-eligible procedure code list. These procedure codes were used to identify procedures in one
year of medical-claims data. For each procedure performed in an ASC or HOPD, the total anesthe-sia, professional and facility payments were included as part of the procedure price. All office-based, inpatient-based and emergent care was excluded. When the total payments from this process were divided by the total members in the represented population, the annual addressable spend per person was $890.
Estimating Percent Savings from ASCsTo estimate the percent savings from ASCs, thirteen high-volume procedures were used as proxies to represent all ASC procedures. These procedures were selected for their high volume and stan-dardization. The average ASC price was calculated for each procedure in each metropolitan market across the U.S.
The potential ASC savings is the sum of the differences between the price of each HOPD case and the average ASC case price for that metropolitan market and procedure combination. Market and procedure combinations with limited data volume were excluded.
To produce the ASC savings as a percentage, the potential ASC savings was divided by the total spend for all analyzed markets and procedures and multiplied by one hundred.
Ten-Year Savings Projection2017 2018 2019 2020 2021 2022 2023 2024 2025 2026 Total
Potential Savings $41.4 B $41.4 B $41.4 B $41.4 B $41.4 B $41.4 B $41.4 B $41.4 B $41.4 B $41.4 B $413.7 BPercent of Savings Captured 5% 10% 15% 20% 25% 30% 35% 40% 45% 50% 28%Savings $2.1 B $4.1 B $6.2 B $8.3 B $10.3 B $12.4 B $14.5 B $16.5 B $18.6 B $20.7 B $113.8 B

Healthcare prices vary dramatically even within the same insurance network and city. For example, in Charleston, West Virginia, the price of a cataract surgery, including payments to the anesthesiologist and physician, can vary from $2,684 to $8,662 depending on the facility where the surgery is performed (Figure 1). In this case prices vary by more than 300 percent, primarily due to the amount charged by the facility – not the physicians. These facility prices vary by almost 600 percent and total more than 70 percent of all dollars spent for cataract surgery in Charleston, WV.
Payments to anesthesiologists vary, partially due to the time component of anesthesia billing, but these payments are the smallest
portion of the total cost and are dwarfed by payments to facilities.
Payments to physicians are a more significant portion of total cost, but physicians performing the most expensive cataract surgeries are paid approximately the same as physicians performing the least expensive surgeries. Thus, it is the choice of facility that drives the total price variation.
The consistency of payments to physicians indicates that most physicians are unable to differentiate themselves when negotiating payment rates from insurance companies and, hence, are paid similar rates. Facilities, on the other hand, vary significantly in their service
offerings and market power and, therefore, have significantly different negotiated rates with insurance companies.
For example, Hospital A provides emergency, inpatient and outpatient care. Hospital B offers everything Hospital A offers and also operates the only children’s hospital in the metropolitan area. Due to this exclusive service line, Hospi-tal B has better negotiating leverage with an insurance company. Importantly, this leverage applies not only to services uniquely performed in the children’s hospital, but also to outpatient surgeries, such as cataract surgery, that are performed in other facilities in the area. Since the entire hospital is either in or out of network, all services are negotiated together, allowing Hospital B to demand higher reimbursement for procedures even though equally good, lower-priced alternative sites of service exist in that market area.
Since any ASC will offer fewer services than both Hospital A and B, those ASCs will have less negotiating leverage with commercial carriers and, therefore, often will receive lower reimbursement rates than either Hospital A or B if they want to be included in the insurer’s network. While the efficiency inherent in the ASC model explains why ASCs can continue to exist when receiving significantly lower payments, it is the market power of hospitals that widens these price disparities3 4.
As a result of these factors, the total price of a procedure performed at an ASC is generally significantly lower than the total price of the same procedure performed in an HOPD. For example, the average price of cataract surgery at an ASC in Charleston, West Virginia, is $2,932, including the physician and anesthesi-ologist payments, while the average price at an HOPD is $5,762 (Figure 2). In this example,
the average price for a cataract surgery at the least expensive facility was $2,684, including the payments to anesthesiologists and physi-cians. At the most expensive facility, the average price was $7,987. ASCs are at the low end of the spectrum and HOPDs are at the high end.
This commercial price differential between the ASC and HOPD environments is persistent across metropolitan areas (Figure 3), insur-ance carriers and procedure categories, with the degree of price variability related to local market factors.
Summary of Methodology All analysis was conducted using a sample of de-identified commercial claims data for calendar year 2014 from HealthSmart. This data represents more than 400,000 lives across all regions of the U.S. The CMS list of ASC-eligible procedure codes, with a few additions reflecting those prevalent in a
commercial population (pediatric-related codes, OB/GYN-related codes, etc.), was used to identify the spending on procedures that can be performed in an ASC.
Total price of service was included in the analysis (facility fees, professional fees and anesthesia fees, where relevant). Based on the commercial population considered, these services accounted for about 19 percent of total medical spend, or $890 per person for the year. All prices are calculated using the “allowed” amount, which reflects the actual amount a provider received after any discounts were applied.
Thirteen high-volume outpatient procedures were used as proxies to analyze the price differential between the ASC and HOPD environments and estimate the percentage of spending that could be saved by performing the procedures in ASCs instead of HOPDs. An adjustment was made to account for the fact that some high-risk patients are not candidates
for ASC-based care (patients with high comor-bidities are traditionally directed to an HOPD in order to be closer to critical-access care). This adjusted percentage was applied to the $890 ASC-eligible spend per person and then scaled by the commercially insured U.S. population to estimate the national savings potential.
All estimates are based on the calendar year 2014 data. No adjustments were made to account for population aging or increasing utilization of ASC-eligible services. (See Appendix A: Methodology and Appendix B: Adjustments for ASC Ineligibility for a more detailed explanation of the methodology.)
Current ASC Use Reduces Private Healthcare Costs by $38 Billion AnnuallyThe lower cost of care in ASCs relative to HOPDs saves employers and consumers tens of billions of dollars a year. For the commer-cially insured population in the U.S., an
estimated $37.8 billion is saved annually by using ASCs. Stated differently, if all of the procedures currently performed in ASCs for the commercially insured population in the U.S. were performed in HOPDs, the cost of those procedures would increase by $37.8 billion in just one year.
Potential Cost Reductions Attributed to ASCsDespite the savings detailed above, for com-mercially insured populations, only 48 percent of procedures commonly performed in ASCs are actually performed in ASCs. If the remain-ing 52 percent were performed at ASC price points, an additional $41 billion in healthcare costs could be saved annually.
As a practical matter, ASCs would not be the appropriate setting for a small percentage of patients (e.g., those with serious health issues) currently treated in HOPDs. For example, patients on dialysis (0.1 percent of Americans) are not ASC eligible for certain procedures. When ASC-ineligible cases are accounted for, the total potential annual savings from performing the surgeries in ASCs instead of HOPDs is $38.2B. (This assumes 3 percent of relevant cases are ASC ineligible. See Appen-dix B: Adjustments for ASC Ineligibility.)
The average ASC price, however, is a blend of both lower-priced and higher-priced ASCs. The optimal migration of cases would shift cases from HOPDs to the local low-price ASCs. If patients were directed to low-price ASCs only, the potential annual savings increases from $38.2 billion to $55.6 billion.
Migrating a meaningful number of patients to lower-cost ASC settings would, undoubtedly, also have the added benefit of causing HOPDs
9
to consider price reductions in order to main-tain their market share. While this study did not attempt to model the competitive reactions of HOPDs if confronted with a significant loss of patient volume, fundamental economic princi-ples as well as a recent study that looked at the impact of reference-based pricing on patient choices concluded that hospitals did, in fact, lower their pricing for certain procedures in response to a loss of market share to competing ASCs5.
Potential Savings Can Grow if ASCs Can Perform More Complex ProceduresWith advances in surgical techniques, pain management and post-surgical care, more procedures traditionally performed in the inpatient setting are being shifted to ASCs. This creates an expanding frontier for reducing healthcare costs. As an example, total hip and total knee replacements, which currently account for about 1.5 percent of total medical spend, are now being performed safely in ASCs in a limited number of markets. The potential savings are significant. Assuming that the price differential and the rate of ASC ineligibility due to comorbidities for total joint replacement will be commensurate with other outpatient procedures, $3.2 billion could be
6 Henry J. Kaiser Family Foundation. (2015, September). Kaiser/HRET Survey of Employer-Sponsored Health Benefits, 2005–2015. Retrieved April 10, 2016, from http://kff.org/health-costs/report/2015-employer-health-benefits-survey/
saved by moving total hip and knee replace-ments to ASCs. (See Appendix A: Methodology.)
Projected NationalCost ReductionsTo realize the potential cost reductions high-lighted above, several things need to happen. On the supply side, ASC capacity will have to double in order to support the migration from HOPDs.
On the demand side, patients must be educat-ed and incentivized to choose ASCs for their outpatient procedures. As premiums rise and adoption of high-deductible health plans increases, patients have greater incentives to reduce their costs by choosing ASC-based care, but education is lacking. Though health-care transparency has made significant advancements in recent years, most patients are still unaware of the lower costs that ASCs offer.
Even modest changes in market share produce massive savings for the entire health system. For example, if an additional 5 percent of current HOPD cases were moved to ASCs annually over the next ten years, $113.8 billion would be saved compared to current utilization rates (Table 1). This assumes that the annual potential ASC savings is currently $41.4 billion:
$38.2 billion from current ASC-eligible proce-dures above plus $3.2 billion from total knee and hip replacement.
For ASC eligible procedures in this study, patients were responsible for 15 percent of the cost on average. That would mean $17.1 billion in reduced costs for patients over the next ten years (Figure 4). If 3 percent or 8 percent of HOPD cases were moved to ASCs annually, ten-year savings would be $68.3 billion and $182 billion respectively (Table 2).
These estimates do not account for inflation or upward trends in medical spending. They also do not take into account the potential that HOPD pricing will decrease in order to com-pete with ASCs, which would create further outpatient savings. As referenced above, in the CalPERS reference pricing program, high- priced providers will reduce prices to be com- petitive and attract price-sensitive consumers.
Reducing Costs forEmployers and EmployeesFrom 2005 to 2015, average health insurance premiums for employer-sponsored family coverage increased 61 percent, from $10,880 to $17,545 per year. To combat these rising costs, employers have increasingly adopted Consumer Driven Health Plans (CDHP) and account-based plan types, shifting costs to employees. This has driven the average employee’s share of healthcare spending up 81 percent in the same time period, from $2,713 to $4,9556 annually. This highlights the need for programs like price transparency that can help patients identify better value providers within their networks so that employers and their employees both can lower costs.
Table 2
Figure 4
For example, in Charlotte, NC, the average ASC price for a knee arthroscopy was $6,118, while the average HOPD price was $12,493, more than twice as expensive. That means $6,375 is saved on average in Charlotte, NC, when a patient chooses an ASC for a knee arthroscopy. How those savings are divided between the payer and the patient depends on the plan design.
For a knee arthroscopy in Charlotte, NC, if a patient has a Silver Plan as defined by the Affordable Care Act, with a $2,700 deductible, 80 percent coinsurance and $5,000 maximum out of pocket, the patient would save $1,275— more than the median family’s weekly income. The remaining $5,100 would be saved by the payer. For self-funded employer-sponsored insurance, that is $5,100 directly to the bottom line for the employer.
Applying the same plan design to the earlier example of cataract surgery in Charleston, WV, a patient would save $566 by choosing an ASC instead of an HOPD. This is a significant savings in a geographic area where annual income per capita is less than $35,0007. The payer would realize an additional savings of $2,264.
Estimating Savings for Self-Insured PopulationsFor employers that self insure, it is reasonably straightforward to estimate the potential cost reductions from ASCs for their covered employees. With $890 in ASC-eligible spend-ing per commercially insured person and 20.6 percent savings opportunity from moving all
ASC-eligible cases from HOPDs to ASCs, $183 in potential ASC savings exists per commercially insured person. A self-funded employer with 1,000 employees is normally covering more than 2,000 lives, when employ-ees and dependents are counted, which means a potential ASC-based savings of more than $366,000 for the employer and employees.
ConclusionBillions of dollars spent each year on commer-cially insured outpatient surgeries and proce-dures can be reduced, without compromising quality, if more cases migrate to ambulatory surgery centers. While a small percentage of patients have health conditions that require outpatient care to be received in proximity to a full-service hospital should complications arise, most patients can receive the same level of care at lower cost by seeking treatment in an ASC. Advances in medical technology and pain control are allowing increasingly complex procedures, such as total joint replacements, to be performed in an outpatient setting.
Policymakers, insurers, employers and benefi-ciaries all have a shared interest in reducing healthcare costs, and the $38 billion in annual savings identified in this study highlight the role that ASCs already play in controlling these costs. Strategies should be implemented to generate additional savings by ensuring that the most efficient site of service for outpatient care is selected whenever possible. In particu-lar, innovative plan design and increased consumer awareness of the benefits of receiv-ing care in an ASC can save thousands of dollars per procedure.
Estimating the Addressable Spend per Commercially Insured PatientThe addressable spend is the expenditure on any procedure that could be performed in an ASC for an ASC-eligible patient, whether that patient is ASC eligible or not. (Adjustments for ASC ineligible are made later in the process. See Appendix B: Adjustments for ASC Ineligibility.) All prices are calculated using the allowed amount, which is the actual amount a provider receives after any discounts are applied.
CMS currently covers 3,837 procedure codes in the ASC setting. Procedure codes from select Healthcare Bluebook ShopSmart™ procedures were added to the CMS list to produce a complete ASC-eligible procedure code list. These procedure codes were used to identify procedures in one
year of medical-claims data. For each procedure performed in an ASC or HOPD, the total anesthe-sia, professional and facility payments were included as part of the procedure price. All office-based, inpatient-based and emergent care was excluded. When the total payments from this process were divided by the total members in the represented population, the annual addressable spend per person was $890.
Estimating Percent Savings from ASCsTo estimate the percent savings from ASCs, thirteen high-volume procedures were used as proxies to represent all ASC procedures. These procedures were selected for their high volume and stan-dardization. The average ASC price was calculated for each procedure in each metropolitan market across the U.S.
The potential ASC savings is the sum of the differences between the price of each HOPD case and the average ASC case price for that metropolitan market and procedure combination. Market and procedure combinations with limited data volume were excluded.
To produce the ASC savings as a percentage, the potential ASC savings was divided by the total spend for all analyzed markets and procedures and multiplied by one hundred.
Projected National Cost Reduction
Plan Sponsor SavingsPatient Savings
Total Savings
$96.7 B$17.1 B
$113.8 B
Average Annual Health Insurance Premiumsand Worker Contributions for Family Coverage,
2005-2015
$10,880
61% TotalPremiumIncrease
83% WorkerContribution
Increase$8,167
$2,7132005
Worker Contribution
SOURCE: Kaiser/HRET Survey of Employer-SponsoredHealth Benefits, 2005-2015
$12,591
$4,955
2015
$17,545
Employer Contribution
Ten-Year Savings Projections2017 2018 2019 2020 2021 2022 2023 2024 2025 2026 Total
Savings at 3% Additional Capture $1.2 B $2.5 B $3.7 B $5.0 B $6.2 B $7.4 B $8.7 B $9.9 B $11.2 B $12.4 B $68.3 BSavings at 5% Additional Capture $2.1 B $4.1 B $6.2 B $8.3 B $10.3 B $12.4 B $14.5 B $16.5 B $18.6 B $20.7 B $113.8 BSavings at 8% Additional Capture $3.3 B $6.6 B $9.9 B $13.2 B $16.5 B $19.9 B $23.2 B $26.5 B $29.8 B $33.1 B $182.0 B

Healthcare prices vary dramatically even within the same insurance network and city. For example, in Charleston, West Virginia, the price of a cataract surgery, including payments to the anesthesiologist and physician, can vary from $2,684 to $8,662 depending on the facility where the surgery is performed (Figure 1). In this case prices vary by more than 300 percent, primarily due to the amount charged by the facility – not the physicians. These facility prices vary by almost 600 percent and total more than 70 percent of all dollars spent for cataract surgery in Charleston, WV.
Payments to anesthesiologists vary, partially due to the time component of anesthesia billing, but these payments are the smallest
portion of the total cost and are dwarfed by payments to facilities.
Payments to physicians are a more significant portion of total cost, but physicians performing the most expensive cataract surgeries are paid approximately the same as physicians performing the least expensive surgeries. Thus, it is the choice of facility that drives the total price variation.
The consistency of payments to physicians indicates that most physicians are unable to differentiate themselves when negotiating payment rates from insurance companies and, hence, are paid similar rates. Facilities, on the other hand, vary significantly in their service
offerings and market power and, therefore, have significantly different negotiated rates with insurance companies.
For example, Hospital A provides emergency, inpatient and outpatient care. Hospital B offers everything Hospital A offers and also operates the only children’s hospital in the metropolitan area. Due to this exclusive service line, Hospi-tal B has better negotiating leverage with an insurance company. Importantly, this leverage applies not only to services uniquely performed in the children’s hospital, but also to outpatient surgeries, such as cataract surgery, that are performed in other facilities in the area. Since the entire hospital is either in or out of network, all services are negotiated together, allowing Hospital B to demand higher reimbursement for procedures even though equally good, lower-priced alternative sites of service exist in that market area.
Since any ASC will offer fewer services than both Hospital A and B, those ASCs will have less negotiating leverage with commercial carriers and, therefore, often will receive lower reimbursement rates than either Hospital A or B if they want to be included in the insurer’s network. While the efficiency inherent in the ASC model explains why ASCs can continue to exist when receiving significantly lower payments, it is the market power of hospitals that widens these price disparities3 4.
As a result of these factors, the total price of a procedure performed at an ASC is generally significantly lower than the total price of the same procedure performed in an HOPD. For example, the average price of cataract surgery at an ASC in Charleston, West Virginia, is $2,932, including the physician and anesthesi-ologist payments, while the average price at an HOPD is $5,762 (Figure 2). In this example,
the average price for a cataract surgery at the least expensive facility was $2,684, including the payments to anesthesiologists and physi-cians. At the most expensive facility, the average price was $7,987. ASCs are at the low end of the spectrum and HOPDs are at the high end.
This commercial price differential between the ASC and HOPD environments is persistent across metropolitan areas (Figure 3), insur-ance carriers and procedure categories, with the degree of price variability related to local market factors.
Summary of Methodology All analysis was conducted using a sample of de-identified commercial claims data for calendar year 2014 from HealthSmart. This data represents more than 400,000 lives across all regions of the U.S. The CMS list of ASC-eligible procedure codes, with a few additions reflecting those prevalent in a
commercial population (pediatric-related codes, OB/GYN-related codes, etc.), was used to identify the spending on procedures that can be performed in an ASC.
Total price of service was included in the analysis (facility fees, professional fees and anesthesia fees, where relevant). Based on the commercial population considered, these services accounted for about 19 percent of total medical spend, or $890 per person for the year. All prices are calculated using the “allowed” amount, which reflects the actual amount a provider received after any discounts were applied.
Thirteen high-volume outpatient procedures were used as proxies to analyze the price differential between the ASC and HOPD environments and estimate the percentage of spending that could be saved by performing the procedures in ASCs instead of HOPDs. An adjustment was made to account for the fact that some high-risk patients are not candidates
for ASC-based care (patients with high comor-bidities are traditionally directed to an HOPD in order to be closer to critical-access care). This adjusted percentage was applied to the $890 ASC-eligible spend per person and then scaled by the commercially insured U.S. population to estimate the national savings potential.
All estimates are based on the calendar year 2014 data. No adjustments were made to account for population aging or increasing utilization of ASC-eligible services. (See Appendix A: Methodology and Appendix B: Adjustments for ASC Ineligibility for a more detailed explanation of the methodology.)
Current ASC Use Reduces Private Healthcare Costs by $38 Billion AnnuallyThe lower cost of care in ASCs relative to HOPDs saves employers and consumers tens of billions of dollars a year. For the commer-cially insured population in the U.S., an
estimated $37.8 billion is saved annually by using ASCs. Stated differently, if all of the procedures currently performed in ASCs for the commercially insured population in the U.S. were performed in HOPDs, the cost of those procedures would increase by $37.8 billion in just one year.
Potential Cost Reductions Attributed to ASCsDespite the savings detailed above, for com-mercially insured populations, only 48 percent of procedures commonly performed in ASCs are actually performed in ASCs. If the remain-ing 52 percent were performed at ASC price points, an additional $41 billion in healthcare costs could be saved annually.
As a practical matter, ASCs would not be the appropriate setting for a small percentage of patients (e.g., those with serious health issues) currently treated in HOPDs. For example, patients on dialysis (0.1 percent of Americans) are not ASC eligible for certain procedures. When ASC-ineligible cases are accounted for, the total potential annual savings from performing the surgeries in ASCs instead of HOPDs is $38.2B. (This assumes 3 percent of relevant cases are ASC ineligible. See Appen-dix B: Adjustments for ASC Ineligibility.)
The average ASC price, however, is a blend of both lower-priced and higher-priced ASCs. The optimal migration of cases would shift cases from HOPDs to the local low-price ASCs. If patients were directed to low-price ASCs only, the potential annual savings increases from $38.2 billion to $55.6 billion.
Migrating a meaningful number of patients to lower-cost ASC settings would, undoubtedly, also have the added benefit of causing HOPDs
10
to consider price reductions in order to main-tain their market share. While this study did not attempt to model the competitive reactions of HOPDs if confronted with a significant loss of patient volume, fundamental economic princi-ples as well as a recent study that looked at the impact of reference-based pricing on patient choices concluded that hospitals did, in fact, lower their pricing for certain procedures in response to a loss of market share to competing ASCs5.
Potential Savings Can Grow if ASCs Can Perform More Complex ProceduresWith advances in surgical techniques, pain management and post-surgical care, more procedures traditionally performed in the inpatient setting are being shifted to ASCs. This creates an expanding frontier for reducing healthcare costs. As an example, total hip and total knee replacements, which currently account for about 1.5 percent of total medical spend, are now being performed safely in ASCs in a limited number of markets. The potential savings are significant. Assuming that the price differential and the rate of ASC ineligibility due to comorbidities for total joint replacement will be commensurate with other outpatient procedures, $3.2 billion could be
7 United States Census Bureau. (2014). 2010–2014 American Community Survey 5-Year Estimates. Retrieved April 30, 2016, from http://www.census.gov/
saved by moving total hip and knee replace-ments to ASCs. (See Appendix A: Methodology.)
Projected NationalCost ReductionsTo realize the potential cost reductions high-lighted above, several things need to happen. On the supply side, ASC capacity will have to double in order to support the migration from HOPDs.
On the demand side, patients must be educat-ed and incentivized to choose ASCs for their outpatient procedures. As premiums rise and adoption of high-deductible health plans increases, patients have greater incentives to reduce their costs by choosing ASC-based care, but education is lacking. Though health-care transparency has made significant advancements in recent years, most patients are still unaware of the lower costs that ASCs offer.
Even modest changes in market share produce massive savings for the entire health system. For example, if an additional 5 percent of current HOPD cases were moved to ASCs annually over the next ten years, $113.8 billion would be saved compared to current utilization rates (Table 1). This assumes that the annual potential ASC savings is currently $41.4 billion:
$38.2 billion from current ASC-eligible proce-dures above plus $3.2 billion from total knee and hip replacement.
For ASC eligible procedures in this study, patients were responsible for 15 percent of the cost on average. That would mean $17.1 billion in reduced costs for patients over the next ten years (Figure 4). If 3 percent or 8 percent of HOPD cases were moved to ASCs annually, ten-year savings would be $68.3 billion and $182 billion respectively (Table 2).
These estimates do not account for inflation or upward trends in medical spending. They also do not take into account the potential that HOPD pricing will decrease in order to com-pete with ASCs, which would create further outpatient savings. As referenced above, in the CalPERS reference pricing program, high- priced providers will reduce prices to be com- petitive and attract price-sensitive consumers.
Reducing Costs forEmployers and EmployeesFrom 2005 to 2015, average health insurance premiums for employer-sponsored family coverage increased 61 percent, from $10,880 to $17,545 per year. To combat these rising costs, employers have increasingly adopted Consumer Driven Health Plans (CDHP) and account-based plan types, shifting costs to employees. This has driven the average employee’s share of healthcare spending up 81 percent in the same time period, from $2,713 to $4,9556 annually. This highlights the need for programs like price transparency that can help patients identify better value providers within their networks so that employers and their employees both can lower costs.
For example, in Charlotte, NC, the average ASC price for a knee arthroscopy was $6,118, while the average HOPD price was $12,493, more than twice as expensive. That means $6,375 is saved on average in Charlotte, NC, when a patient chooses an ASC for a knee arthroscopy. How those savings are divided between the payer and the patient depends on the plan design.
For a knee arthroscopy in Charlotte, NC, if a patient has a Silver Plan as defined by the Affordable Care Act, with a $2,700 deductible, 80 percent coinsurance and $5,000 maximum out of pocket, the patient would save $1,275— more than the median family’s weekly income. The remaining $5,100 would be saved by the payer. For self-funded employer-sponsored insurance, that is $5,100 directly to the bottom line for the employer.
Applying the same plan design to the earlier example of cataract surgery in Charleston, WV, a patient would save $566 by choosing an ASC instead of an HOPD. This is a significant savings in a geographic area where annual income per capita is less than $35,0007. The payer would realize an additional savings of $2,264.
Estimating Savings for Self-Insured PopulationsFor employers that self insure, it is reasonably straightforward to estimate the potential cost reductions from ASCs for their covered employees. With $890 in ASC-eligible spend-ing per commercially insured person and 20.6 percent savings opportunity from moving all
ASC-eligible cases from HOPDs to ASCs, $183 in potential ASC savings exists per commercially insured person. A self-funded employer with 1,000 employees is normally covering more than 2,000 lives, when employ-ees and dependents are counted, which means a potential ASC-based savings of more than $366,000 for the employer and employees.
ConclusionBillions of dollars spent each year on commer-cially insured outpatient surgeries and proce-dures can be reduced, without compromising quality, if more cases migrate to ambulatory surgery centers. While a small percentage of patients have health conditions that require outpatient care to be received in proximity to a full-service hospital should complications arise, most patients can receive the same level of care at lower cost by seeking treatment in an ASC. Advances in medical technology and pain control are allowing increasingly complex procedures, such as total joint replacements, to be performed in an outpatient setting.
Policymakers, insurers, employers and benefi-ciaries all have a shared interest in reducing healthcare costs, and the $38 billion in annual savings identified in this study highlight the role that ASCs already play in controlling these costs. Strategies should be implemented to generate additional savings by ensuring that the most efficient site of service for outpatient care is selected whenever possible. In particu-lar, innovative plan design and increased consumer awareness of the benefits of receiv-ing care in an ASC can save thousands of dollars per procedure.
Estimating the Addressable Spend per Commercially Insured PatientThe addressable spend is the expenditure on any procedure that could be performed in an ASC for an ASC-eligible patient, whether that patient is ASC eligible or not. (Adjustments for ASC ineligible are made later in the process. See Appendix B: Adjustments for ASC Ineligibility.) All prices are calculated using the allowed amount, which is the actual amount a provider receives after any discounts are applied.
CMS currently covers 3,837 procedure codes in the ASC setting. Procedure codes from select Healthcare Bluebook ShopSmart™ procedures were added to the CMS list to produce a complete ASC-eligible procedure code list. These procedure codes were used to identify procedures in one
year of medical-claims data. For each procedure performed in an ASC or HOPD, the total anesthe-sia, professional and facility payments were included as part of the procedure price. All office-based, inpatient-based and emergent care was excluded. When the total payments from this process were divided by the total members in the represented population, the annual addressable spend per person was $890.
Estimating Percent Savings from ASCsTo estimate the percent savings from ASCs, thirteen high-volume procedures were used as proxies to represent all ASC procedures. These procedures were selected for their high volume and stan-dardization. The average ASC price was calculated for each procedure in each metropolitan market across the U.S.
The potential ASC savings is the sum of the differences between the price of each HOPD case and the average ASC case price for that metropolitan market and procedure combination. Market and procedure combinations with limited data volume were excluded.
To produce the ASC savings as a percentage, the potential ASC savings was divided by the total spend for all analyzed markets and procedures and multiplied by one hundred.

Healthcare prices vary dramatically even within the same insurance network and city. For example, in Charleston, West Virginia, the price of a cataract surgery, including payments to the anesthesiologist and physician, can vary from $2,684 to $8,662 depending on the facility where the surgery is performed (Figure 1). In this case prices vary by more than 300 percent, primarily due to the amount charged by the facility – not the physicians. These facility prices vary by almost 600 percent and total more than 70 percent of all dollars spent for cataract surgery in Charleston, WV.
Payments to anesthesiologists vary, partially due to the time component of anesthesia billing, but these payments are the smallest
portion of the total cost and are dwarfed by payments to facilities.
Payments to physicians are a more significant portion of total cost, but physicians performing the most expensive cataract surgeries are paid approximately the same as physicians performing the least expensive surgeries. Thus, it is the choice of facility that drives the total price variation.
The consistency of payments to physicians indicates that most physicians are unable to differentiate themselves when negotiating payment rates from insurance companies and, hence, are paid similar rates. Facilities, on the other hand, vary significantly in their service
offerings and market power and, therefore, have significantly different negotiated rates with insurance companies.
For example, Hospital A provides emergency, inpatient and outpatient care. Hospital B offers everything Hospital A offers and also operates the only children’s hospital in the metropolitan area. Due to this exclusive service line, Hospi-tal B has better negotiating leverage with an insurance company. Importantly, this leverage applies not only to services uniquely performed in the children’s hospital, but also to outpatient surgeries, such as cataract surgery, that are performed in other facilities in the area. Since the entire hospital is either in or out of network, all services are negotiated together, allowing Hospital B to demand higher reimbursement for procedures even though equally good, lower-priced alternative sites of service exist in that market area.
Since any ASC will offer fewer services than both Hospital A and B, those ASCs will have less negotiating leverage with commercial carriers and, therefore, often will receive lower reimbursement rates than either Hospital A or B if they want to be included in the insurer’s network. While the efficiency inherent in the ASC model explains why ASCs can continue to exist when receiving significantly lower payments, it is the market power of hospitals that widens these price disparities3 4.
As a result of these factors, the total price of a procedure performed at an ASC is generally significantly lower than the total price of the same procedure performed in an HOPD. For example, the average price of cataract surgery at an ASC in Charleston, West Virginia, is $2,932, including the physician and anesthesi-ologist payments, while the average price at an HOPD is $5,762 (Figure 2). In this example,
the average price for a cataract surgery at the least expensive facility was $2,684, including the payments to anesthesiologists and physi-cians. At the most expensive facility, the average price was $7,987. ASCs are at the low end of the spectrum and HOPDs are at the high end.
This commercial price differential between the ASC and HOPD environments is persistent across metropolitan areas (Figure 3), insur-ance carriers and procedure categories, with the degree of price variability related to local market factors.
Summary of Methodology All analysis was conducted using a sample of de-identified commercial claims data for calendar year 2014 from HealthSmart. This data represents more than 400,000 lives across all regions of the U.S. The CMS list of ASC-eligible procedure codes, with a few additions reflecting those prevalent in a
commercial population (pediatric-related codes, OB/GYN-related codes, etc.), was used to identify the spending on procedures that can be performed in an ASC.
Total price of service was included in the analysis (facility fees, professional fees and anesthesia fees, where relevant). Based on the commercial population considered, these services accounted for about 19 percent of total medical spend, or $890 per person for the year. All prices are calculated using the “allowed” amount, which reflects the actual amount a provider received after any discounts were applied.
Thirteen high-volume outpatient procedures were used as proxies to analyze the price differential between the ASC and HOPD environments and estimate the percentage of spending that could be saved by performing the procedures in ASCs instead of HOPDs. An adjustment was made to account for the fact that some high-risk patients are not candidates
for ASC-based care (patients with high comor-bidities are traditionally directed to an HOPD in order to be closer to critical-access care). This adjusted percentage was applied to the $890 ASC-eligible spend per person and then scaled by the commercially insured U.S. population to estimate the national savings potential.
All estimates are based on the calendar year 2014 data. No adjustments were made to account for population aging or increasing utilization of ASC-eligible services. (See Appendix A: Methodology and Appendix B: Adjustments for ASC Ineligibility for a more detailed explanation of the methodology.)
Current ASC Use Reduces Private Healthcare Costs by $38 Billion AnnuallyThe lower cost of care in ASCs relative to HOPDs saves employers and consumers tens of billions of dollars a year. For the commer-cially insured population in the U.S., an
estimated $37.8 billion is saved annually by using ASCs. Stated differently, if all of the procedures currently performed in ASCs for the commercially insured population in the U.S. were performed in HOPDs, the cost of those procedures would increase by $37.8 billion in just one year.
Potential Cost Reductions Attributed to ASCsDespite the savings detailed above, for com-mercially insured populations, only 48 percent of procedures commonly performed in ASCs are actually performed in ASCs. If the remain-ing 52 percent were performed at ASC price points, an additional $41 billion in healthcare costs could be saved annually.
As a practical matter, ASCs would not be the appropriate setting for a small percentage of patients (e.g., those with serious health issues) currently treated in HOPDs. For example, patients on dialysis (0.1 percent of Americans) are not ASC eligible for certain procedures. When ASC-ineligible cases are accounted for, the total potential annual savings from performing the surgeries in ASCs instead of HOPDs is $38.2B. (This assumes 3 percent of relevant cases are ASC ineligible. See Appen-dix B: Adjustments for ASC Ineligibility.)
The average ASC price, however, is a blend of both lower-priced and higher-priced ASCs. The optimal migration of cases would shift cases from HOPDs to the local low-price ASCs. If patients were directed to low-price ASCs only, the potential annual savings increases from $38.2 billion to $55.6 billion.
Migrating a meaningful number of patients to lower-cost ASC settings would, undoubtedly, also have the added benefit of causing HOPDs
11
to consider price reductions in order to main-tain their market share. While this study did not attempt to model the competitive reactions of HOPDs if confronted with a significant loss of patient volume, fundamental economic princi-ples as well as a recent study that looked at the impact of reference-based pricing on patient choices concluded that hospitals did, in fact, lower their pricing for certain procedures in response to a loss of market share to competing ASCs5.
Potential Savings Can Grow if ASCs Can Perform More Complex ProceduresWith advances in surgical techniques, pain management and post-surgical care, more procedures traditionally performed in the inpatient setting are being shifted to ASCs. This creates an expanding frontier for reducing healthcare costs. As an example, total hip and total knee replacements, which currently account for about 1.5 percent of total medical spend, are now being performed safely in ASCs in a limited number of markets. The potential savings are significant. Assuming that the price differential and the rate of ASC ineligibility due to comorbidities for total joint replacement will be commensurate with other outpatient procedures, $3.2 billion could be
saved by moving total hip and knee replace-ments to ASCs. (See Appendix A: Methodology.)
Projected NationalCost ReductionsTo realize the potential cost reductions high-lighted above, several things need to happen. On the supply side, ASC capacity will have to double in order to support the migration from HOPDs.
On the demand side, patients must be educat-ed and incentivized to choose ASCs for their outpatient procedures. As premiums rise and adoption of high-deductible health plans increases, patients have greater incentives to reduce their costs by choosing ASC-based care, but education is lacking. Though health-care transparency has made significant advancements in recent years, most patients are still unaware of the lower costs that ASCs offer.
Even modest changes in market share produce massive savings for the entire health system. For example, if an additional 5 percent of current HOPD cases were moved to ASCs annually over the next ten years, $113.8 billion would be saved compared to current utilization rates (Table 1). This assumes that the annual potential ASC savings is currently $41.4 billion:
$38.2 billion from current ASC-eligible proce-dures above plus $3.2 billion from total knee and hip replacement.
For ASC eligible procedures in this study, patients were responsible for 15 percent of the cost on average. That would mean $17.1 billion in reduced costs for patients over the next ten years (Figure 4). If 3 percent or 8 percent of HOPD cases were moved to ASCs annually, ten-year savings would be $68.3 billion and $182 billion respectively (Table 2).
These estimates do not account for inflation or upward trends in medical spending. They also do not take into account the potential that HOPD pricing will decrease in order to com-pete with ASCs, which would create further outpatient savings. As referenced above, in the CalPERS reference pricing program, high- priced providers will reduce prices to be com- petitive and attract price-sensitive consumers.
Reducing Costs forEmployers and EmployeesFrom 2005 to 2015, average health insurance premiums for employer-sponsored family coverage increased 61 percent, from $10,880 to $17,545 per year. To combat these rising costs, employers have increasingly adopted Consumer Driven Health Plans (CDHP) and account-based plan types, shifting costs to employees. This has driven the average employee’s share of healthcare spending up 81 percent in the same time period, from $2,713 to $4,9556 annually. This highlights the need for programs like price transparency that can help patients identify better value providers within their networks so that employers and their employees both can lower costs.
For example, in Charlotte, NC, the average ASC price for a knee arthroscopy was $6,118, while the average HOPD price was $12,493, more than twice as expensive. That means $6,375 is saved on average in Charlotte, NC, when a patient chooses an ASC for a knee arthroscopy. How those savings are divided between the payer and the patient depends on the plan design.
For a knee arthroscopy in Charlotte, NC, if a patient has a Silver Plan as defined by the Affordable Care Act, with a $2,700 deductible, 80 percent coinsurance and $5,000 maximum out of pocket, the patient would save $1,275— more than the median family’s weekly income. The remaining $5,100 would be saved by the payer. For self-funded employer-sponsored insurance, that is $5,100 directly to the bottom line for the employer.
Applying the same plan design to the earlier example of cataract surgery in Charleston, WV, a patient would save $566 by choosing an ASC instead of an HOPD. This is a significant savings in a geographic area where annual income per capita is less than $35,0007. The payer would realize an additional savings of $2,264.
Estimating Savings for Self-Insured PopulationsFor employers that self insure, it is reasonably straightforward to estimate the potential cost reductions from ASCs for their covered employees. With $890 in ASC-eligible spend-ing per commercially insured person and 20.6 percent savings opportunity from moving all
About the authors/organizationsAmbulatory Surgery Center Association (ASCA)ASCA is the national membership association that represents ASCs of all specialties and provides advocacy and resources to assist ASCs in delivering high quality, cost-effective ambulatory surgery to all the patients they serve.
Healthcare BluebookHealthcarebluebook.com, headquartered in Nashville, TN, is a leading provider of health-care price and quality transparency solutions to employers, third-party administrators (TPA), health plans and provider organizations. Healthcare Bluebook products help employers and employees save money by enabling consumers to understand local health-care prices, compare providers on price and quality and shop for care anywhere in the U.S.
HealthSmartFor more than 40 years, HealthSmart has offered a wide array of customizable and scalable health-plan solutions for self-funded employers. HealthSmart’s comprehensive service suite address-es individual health from all angles. This includes claims and benefits administration, provider networks, pharmacy, benefit-management services, business intelligence, onsite employer clinics, care management, a variety of health and wellness initiatives and Web-based reporting.
Appendix A: MethodologyData SourceAll analysis was conducted using a national sample of de-identified commercial claims for calendar year 2014.
Estimating Potential ASC Savings for the Commercially Insured U.S. PopulationThe estimated potential ASC savings for the commercially insured U.S. population is calculated as:
ASC-eligible cases from HOPDs to ASCs, $183 in potential ASC savings exists per commercially insured person. A self-funded employer with 1,000 employees is normally covering more than 2,000 lives, when employ-ees and dependents are counted, which means a potential ASC-based savings of more than $366,000 for the employer and employees.
ConclusionBillions of dollars spent each year on commer-cially insured outpatient surgeries and proce-dures can be reduced, without compromising quality, if more cases migrate to ambulatory surgery centers. While a small percentage of patients have health conditions that require outpatient care to be received in proximity to a full-service hospital should complications arise, most patients can receive the same level of care at lower cost by seeking treatment in an ASC. Advances in medical technology and pain control are allowing increasingly complex procedures, such as total joint replacements, to be performed in an outpatient setting.
Policymakers, insurers, employers and benefi-ciaries all have a shared interest in reducing healthcare costs, and the $38 billion in annual savings identified in this study highlight the role that ASCs already play in controlling these costs. Strategies should be implemented to generate additional savings by ensuring that the most efficient site of service for outpatient care is selected whenever possible. In particu-lar, innovative plan design and increased consumer awareness of the benefits of receiv-ing care in an ASC can save thousands of dollars per procedure.
Equation 1
Estimating the Addressable Spend per Commercially Insured PatientThe addressable spend is the expenditure on any procedure that could be performed in an ASC for an ASC-eligible patient, whether that patient is ASC eligible or not. (Adjustments for ASC ineligible are made later in the process. See Appendix B: Adjustments for ASC Ineligibility.) All prices are calculated using the allowed amount, which is the actual amount a provider receives after any discounts are applied.
CMS currently covers 3,837 procedure codes in the ASC setting. Procedure codes from select Healthcare Bluebook ShopSmart™ procedures were added to the CMS list to produce a complete ASC-eligible procedure code list. These procedure codes were used to identify procedures in one
year of medical-claims data. For each procedure performed in an ASC or HOPD, the total anesthe-sia, professional and facility payments were included as part of the procedure price. All office-based, inpatient-based and emergent care was excluded. When the total payments from this process were divided by the total members in the represented population, the annual addressable spend per person was $890.
Estimating Percent Savings from ASCsTo estimate the percent savings from ASCs, thirteen high-volume procedures were used as proxies to represent all ASC procedures. These procedures were selected for their high volume and stan-dardization. The average ASC price was calculated for each procedure in each metropolitan market across the U.S.
The potential ASC savings is the sum of the differences between the price of each HOPD case and the average ASC case price for that metropolitan market and procedure combination. Market and procedure combinations with limited data volume were excluded.
To produce the ASC savings as a percentage, the potential ASC savings was divided by the total spend for all analyzed markets and procedures and multiplied by one hundred.
Addressable Spend perCommercially Insured Person
$890
Percent Savings from ASCs20.6%X Commercially Insured Population
208.6MX

12
Estimating the Addressable Spend per Commercially Insured PatientThe addressable spend is the expenditure on any procedure that could be performed in an ASC for an ASC-eligible patient, whether that patient is ASC eligible or not. (Adjustments for ASC ineligible are made later in the process. See Appendix B: Adjustments for ASC Ineligibility.) All prices are calculated using the allowed amount, which is the actual amount a provider receives after any discounts are applied.
CMS currently covers 3,837 procedure codes in the ASC setting. Procedure codes from select Healthcare Bluebook ShopSmart™ procedures were added to the CMS list to produce a complete ASC-eligible procedure code list. These procedure codes were used to identify procedures in one
year of medical-claims data. For each procedure performed in an ASC or HOPD, the total anesthe-sia, professional and facility payments were included as part of the procedure price. All office-based, inpatient-based and emergent care was excluded. When the total payments from this process were divided by the total members in the represented population, the annual addressable spend per person was $890.
Estimating Percent Savings from ASCsTo estimate the percent savings from ASCs, thirteen high-volume procedures were used as proxies to represent all ASC procedures. These procedures were selected for their high volume and stan-dardization. The average ASC price was calculated for each procedure in each metropolitan market across the U.S.
The potential ASC savings is the sum of the differences between the price of each HOPD case and the average ASC case price for that metropolitan market and procedure combination. Market and procedure combinations with limited data volume were excluded.
To produce the ASC savings as a percentage, the potential ASC savings was divided by the total spend for all analyzed markets and procedures and multiplied by one hundred.
Equation 2
Equation 3
Estimating Potential Savings from Total Hip & Total Knee ReplacementsTo estimate potential savings from moving total hip and knee replacements to the ASC setting, Equation 1 from above was used, but with $73.59 as the addressable spend per commercially insured person. This represents 1.5 percent of total medical spend per commercially insured person. The 20.6 percent savings opportunity was not changed because there are not currently enough markets offering ASC-based joint replacement to use as a representation of the entire U.S. However, the savings opportunity may be as much as double this estimate based on markets that currently have ASC-based total joint replacements.
Appendix B: Adjustments for ASC IneligibilitySome patients will not qualify for treatment in an ASC setting due to comorbidities or other complicat-ing factors. To account for this, potential ASC savings were estimated using three assumptions for what percent of the commercially insured population is ASC ineligible: 1 percent, 3 percent and 7
∑potential ASC savings = costm,p,h – average_ASC_pricem,p
m,p,h
∑percent savings from ASCs = x 100potential ASC savingstotal spend
m,p,h
m = marketp = procedureh = HOPD case
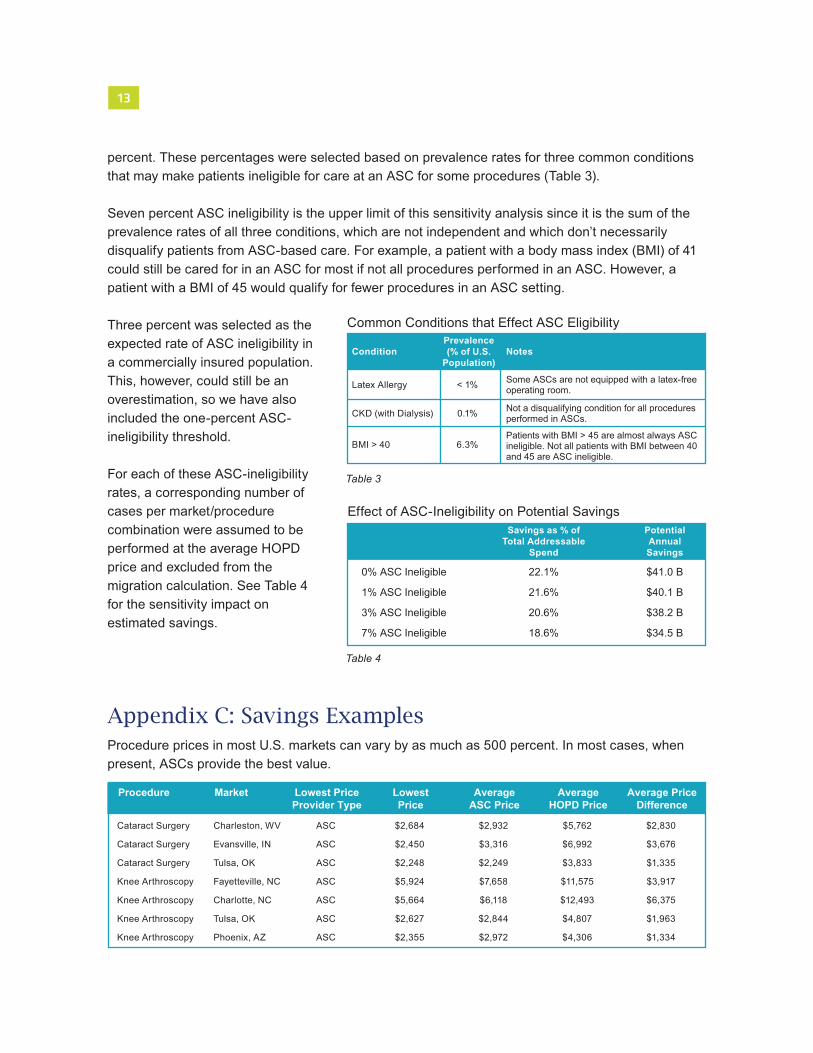
Estimating the Addressable Spend per Commercially Insured PatientThe addressable spend is the expenditure on any procedure that could be performed in an ASC for an ASC-eligible patient, whether that patient is ASC eligible or not. (Adjustments for ASC ineligible are made later in the process. See Appendix B: Adjustments for ASC Ineligibility.) All prices are calculated using the allowed amount, which is the actual amount a provider receives after any discounts are applied.
CMS currently covers 3,837 procedure codes in the ASC setting. Procedure codes from select Healthcare Bluebook ShopSmart™ procedures were added to the CMS list to produce a complete ASC-eligible procedure code list. These procedure codes were used to identify procedures in one
year of medical-claims data. For each procedure performed in an ASC or HOPD, the total anesthe-sia, professional and facility payments were included as part of the procedure price. All office-based, inpatient-based and emergent care was excluded. When the total payments from this process were divided by the total members in the represented population, the annual addressable spend per person was $890.
Estimating Percent Savings from ASCsTo estimate the percent savings from ASCs, thirteen high-volume procedures were used as proxies to represent all ASC procedures. These procedures were selected for their high volume and stan-dardization. The average ASC price was calculated for each procedure in each metropolitan market across the U.S.
The potential ASC savings is the sum of the differences between the price of each HOPD case and the average ASC case price for that metropolitan market and procedure combination. Market and procedure combinations with limited data volume were excluded.
To produce the ASC savings as a percentage, the potential ASC savings was divided by the total spend for all analyzed markets and procedures and multiplied by one hundred.
13
percent. These percentages were selected based on prevalence rates for three common conditions that may make patients ineligible for care at an ASC for some procedures (Table 3).
Seven percent ASC ineligibility is the upper limit of this sensitivity analysis since it is the sum of the prevalence rates of all three conditions, which are not independent and which don’t necessarily disqualify patients from ASC-based care. For example, a patient with a body mass index (BMI) of 41 could still be cared for in an ASC for most if not all procedures performed in an ASC. However, a patient with a BMI of 45 would qualify for fewer procedures in an ASC setting.
Three percent was selected as the expected rate of ASC ineligibility in a commercially insured population. This, however, could still be an overestimation, so we have also included the one-percent ASC- ineligibility threshold.
For each of these ASC-ineligibility rates, a corresponding number of cases per market/procedure combination were assumed to be performed at the average HOPD price and excluded from the migration calculation. See Table 4 for the sensitivity impact on estimated savings.
Appendix C: Savings ExamplesProcedure prices in most U.S. markets can vary by as much as 500 percent. In most cases, when present, ASCs provide the best value.
Table 4
Procedure
Cataract Surgery
Cataract Surgery
Cataract Surgery
Knee Arthroscopy
Knee Arthroscopy
Knee Arthroscopy
Knee Arthroscopy
Market
Charleston, WV
Evansville, IN
Tulsa, OK
Fayetteville, NC
Charlotte, NC
Tulsa, OK
Phoenix, AZ
Lowest PriceProvider Type
ASC
ASC
ASC
ASC
ASC
ASC
ASC
LowestPrice
$2,684
$2,450
$2,248
$5,924
$5,664
$2,627
$2,355
AverageASC Price
$2,932
$3,316
$2,249
$7,658
$6,118
$2,844
$2,972
AverageHOPD Price
$5,762
$6,992
$3,833
$11,575
$12,493
$4,807
$4,306
Average PriceDifference
$2,830
$3,676
$1,335
$3,917
$6,375
$1,963
$1,334
Condition NotesPrevalence(% of U.S.
Population)
Latex Allergy
CKD (with Dialysis)
BMI > 40
Some ASCs are not equipped with a latex-freeoperating room.
Not a disqualifying condition for all procedures performed in ASCs.
Patients with BMI > 45 are almost always ASCineligible. Not all patients with BMI between 40 and 45 are ASC ineligible.
< 1%
0.1%
6.3%
Common Conditions that Effect ASC Eligibility
Table 3
Effect of ASC-Ineligibility on Potential SavingsSavings as % of
Total AddressableSpend
PotentialAnnualSavings
0% ASC Ineligible 22.1% $41.0 B
1% ASC Ineligible 21.6% $40.1 B
3% ASC Ineligible 20.6% $38.2 B
7% ASC Ineligible 18.6% $34.5 B