Embed Size (px)
Citation preview
1
Comenius University in Bratislava
Monika Šulc Michalková, Jakub Miřijovskýet al.
INTERDISCIPLINARY STUDIES OF RIVER CHANNELS AND UAV MAPPING
IN THE V4 REGION
Bratislava 2016

2
Mgr. Monika Šulc Michalková, PhD. et PhD.Comenius University in Bratislava (2009 – 2015)Masaryk University Brno
RNDr. Jakub Miřijovský, Ph.D.Palacký University Olomouc
Prof. Dénes Lóczy, DSc.University of Pécs
Assoc. Prof. Wojciech Zgłobicki, PhD.Maria Curie-Sklodowska University in Lublin
Interdisciplinary studies of river channels and UAV mapping in the V4 region
Reviewed by: Doc. RNDr. Karel Kirchner, CSc., Mgr. Vít Pászto, Ph.D.
First publication© Šulc Michalková M., Miřijovský J., Lóczy D., Zgłobicki W., Ajkai-Ortmann A., Baran-Zgłobicka B., Czigány S., Dezső J., Fulajtár M., Gajek G., Gawrysiak L., Gyenizse P., Halász A., Halmai Á., Jenčo M., Pirkhoffer E., Ronczyk L., Saksa M., Warowna J., 2016© Comenius University in Bratislava, 2016
ISBN 978-80-223-4055-7
3
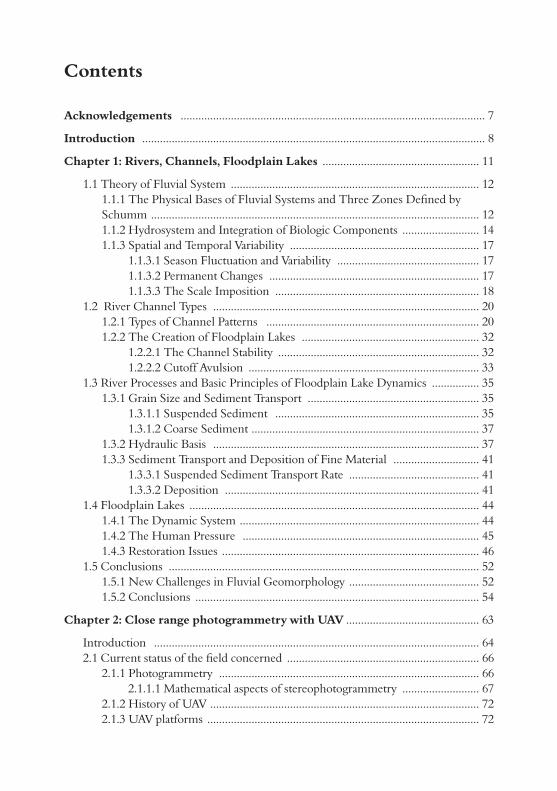
Contents
Acknowledgements
Introduction
Chapter 1: Rivers, Channels, Floodplain Lakes
1.1 Theory of Fluvial System1.1.1 The Physical Bases of Fluvial Systems and Three Zones Defined by Schumm1.1.2 Hydrosystem and Integration of Biologic Components1.1.3 Spatial and Temporal Variability
1.1.3.1 Season Fluctuation and Variability1.1.3.2 Permanent Changes1.1.3.3 The Scale Imposition
1.2 River Channel Types1.2.1 Types of Channel Patterns1.2.2 The Creation of Floodplain Lakes
1.2.2.1 The Channel Stability1.2.2.2 Cutoff Avulsion
1.3 River Processes and Basic Principles of Floodplain Lake Dynamics1.3.1 Grain Size and Sediment Transport
1.3.1.1 Suspended Sediment1.3.1.2 Coarse Sediment
1.3.2 Hydraulic Basis1.3.3 Sediment Transport and Deposition of Fine Material
1.3.3.1 Suspended Sediment Transport Rate1.3.3.2 Deposition
1.4 Floodplain Lakes1.4.1 The Dynamic System1.4.2 The Human Pressure1.4.3 Restoration Issues
1.5 Conclusions1.5.1 New Challenges in Fluvial Geomorphology1.5.2 Conclusions
Chapter 2: Close range photogrammetry with UAV
Introduction 2.1 Current status of the field concerned
2.1.1 Photogrammetry2.1.1.1 Mathematical aspects of stereophotogrammetry
2.1.2 History of UAV2.1.3 UAV platforms
Contents
....................................................................................................... 7
.................................................................................................................... 8
..................................................... 11
.................................................................................... 12
............................................................................................................... 12.......................... 14
................................................................ 17................................................ 17
....................................................................... 17..................................................................... 18
.......................................................................................... 20........................................................................ 20
............................................................ 32.................................................................... 32
.............................................................................. 33................ 35
.......................................................... 35..................................................................... 35
............................................................................. 37.......................................................................................... 37
............................. 41............................................ 41
...................................................................................... 41.................................................................................................. 44
................................................................................. 44................................................................................ 45
....................................................................................... 46......................................................................................................... 52
............................................ 52................................................................................................ 54
............................................. 63
.............................................................................................................. 64................................................................. 66
........................................................................................ 66.......................... 67
........................................................................................... 72............................................................................................ 72

4
2.1.4 UAV photogrammetry2.1.5 Application areas of UAV systems
2.2 UAV technology deployment concept2.2.1 Concept design2.2.2 The concept
2.3 Resources of UAV photogrammetry2.3.1 Aerial carrier
2.3.1.1 Permitted frequencies2.3.1.2 PIXY paraglider model2.3.1.3 HexaKopter XL
2.3.2 Camera and its calibration2.3.2.1 Camera2.3.2.2 Calibration
2.3.3 Personnel and knowledge2.4 Legislation for the operation of UAVS
2.4.1 Operation of unmanned systems2.4.2 Airspace
2.5 Flight plan and preparation for imaging2.5.1 Checking the site and the permit to fly2.5.2 Defining the parameters for imaging2.5.3 Waypoints and flight axes2.5.4 Meteorological and lighting conditions
2.5.4.1 Meteorological conditions2.5.4.2 Lighting conditions
2.6 Field work and imaging flight2.6.1 Ground control points
2.6.1.1 Types of ground control points2.6.1.2 Distribution and number of ground control points2.6.1.3 Measuring ground control points
2.6.2 Camera setup2.6.2.1 Exposure parameters2.6.2.2 Camera focus
2.6.3 Imaging flight2.6.3.1 Pre-flight preparation2.6.3.2 Launch2.6.3.3 Flight2.6.3.4 Landing2.6.3.5 Data check
................................................................................ 77 ............................................................. 78
................................................................ 79........................................................................................... 79
................................................................................................ 79................................................................... 81
................................................................................................ 81.................................................................... 81................................................................... 82
.............................................................................. 83......................................................................... 85
........................................................................................... 85...................................................................................... 85
.......................................................................... 89............................................................... 91.............................................................. 91
....................................................................................................... 91............................................................. 94
..................................................... 94........................................................ 96
........................................................................... 97.................................................. 101
........................................................... 101...................................................................... 104
........................................................................... 109............................................................................. 109
.................................................... 109................... 111
................................................ 112............................................................................................ 113
.................................................................... 114................................................................................ 115
........................................................................................... 116................................................................... 116
........................................................................................... 116............................................................................................. 118
.......................................................................................... 118.................................................................................... 120

5
Chapter 3: Case studies
• Floodplain degradation and possible rehabilitation along the Hungarian Drava section
• Floodway zoning and flood modelling using remote sensing and DEM along the lower Hungarian Drava section
• Assessment of a water recharge project into an oxbow of the Drava flood-plain
• Application of GIS and aerial photography in geomorphological studies, Małopolska Vistula River Gap, Poland
• Soil erosion mapping with the aid of aerial photographs tested at Pastovce site, Ipeľská pahorkatina
For Conclusion: Three Year Project Overview
Annexes
............................................................................................. 125
....................................................................................................... 127
.......................................................... 177
...................................................................................................................... 201
............................................................... 221
...................................................................................... 247
................................................... 269
........................................................................................................................ 271
247
Soil erosion mapping with the aid of aerial photographs tested at Pastovce,
Ipeľská pahorkatina
Abstract
The major objectives of this study are the preparation of a soil erosion map of the Pastovce study area, the testing of the suitability of digital colour aerial photographs for erosion mapping and the investigation of the relation between the erosion spatial distribution and relief. The study site is composed of one large-scale agricultural plot (66 ha) with a sloping landscape of intensively agri-culturally exploited loess hilly land covered by Haplic and Luvic Chernozems and Calcic Luvisols, situated in Western Slovakia. The identification of erosion patterns is based on the colour difference between the topsoil and subsoil. Two colour orthophotomaps were used. The delineation of the eroded patterns was performed by mathematical classification. The results show that the area is sig-nificantly eroded. The strongly eroded soils (Haplic Calcisols) occupy 13.8 % of the study area. Other parts are affected to various extents. The relationship between the erosion spatial distribution to relief was also analysed. Two versions of DTMs with different smoothing levels were calculated. Standard morpho-metric variables (slope, aspect, tangential curvature, profile curvature, geomet-rical forms, upslope contributing areas) and erosion/deposition factor calculated by the USPED model were examined. The results showed that the correlation of erosion patterns is poor. The main reasons are the impact of microrelief, which could not be expressed by smoothing DTM models, and tillage erosion, which does not responds to topography in other manner than runoff and water erosion. Moreover, the land use history, which is unknown to large extent plays an important role in erosion distribution. In the future, the use of an unmanned aerial vehicle (UAV) would be very helpful for similar studies as it would allow for operational programmes of taking aerial photos to prepare the best input data for representing the optimised time selection and detailed data of micro-relief forms.
Keywords: erosion mapping, erosion pattern, bright patches, aerial photo-graphs, remote sensing, USPED model

248
Introduction
The investigation of spatial variability of eroded soils provides important background information for the successful implementation of sustainable and effective land management. Erosion patterns should be expressed by land eva-luation maps for decision making in land management practices, crop rotation and implementation of properly targeted and efficient land conservation strate-gies and programmes. High quality and detailed soil erosion maps can be useful for precision farming because eroded soils have significantly reduced production potential. Moreover, erosion maps are useful for a wide range of environmental studies, including integrated watershed management, runoff and flooding pre-diction and control and geomorphological studies of relief dynamics. Precise patterns and acreages of particular eroded soils are useful for land taxation, land price determination and implementation of national and EU land management, agriculture and environmental policies, such as agricultural subsidies, identifi-cation of least favourable areas, rural development programmes, etc.
The another obstacle for erosion mapping is the high cost of field surveys. The increasing price of man labour over the last decades has resulted in the very high cost for soil surveys, as a large number of highly educated, well-trained and experienced staff would be needed. For this reason, an optimal solution of this problem can be provided by remote sensing. Moreover, remote sensing implementation in the soil erosion research can provide many other benefits in addition to erosion mapping. For example, it is possible to use it for generating input data for erosion modelling, verification of erosion models and investigati-on of impacts of erosion factors. In Slovakia, remote sensing has been used for over 25 years for erosion investigations. This study aims at the further develop-ment of erosion mapping and analysing methodology based on remote sensing. Its main goal is the investigation of the impact of relief on the erosion spatial distribution.
Use of remote sensing for erosion investigation at the international level
Several comprehensive reviews on erosion investigations with remote sen-sing are available (Šúri, 1996, Fulajtár, 2002, Manchanda et al., 2002, Vrieling, 2006). All of these reviews show that the same trend has been observed since the beginning of remote sensing development. Most studies have been focu-sed on land cover, land use and vegetation characteristics. Multispectral images with infrared bands are often used to characterise the vegetation by vegetation
249
index. A number of studies have also been conducted for erosion investigation, but most use remote sensing as a supplement, only indirectly contributing to the erosion assessment (as indicated by the disturbance of vegetation, which is related to erosion processes). This is well demonstrated by the review of Vri-eling (2006), who discusses almost 200 papers; only 37 are directly related to delineation of eroded areas. Most other studies were conducted for many other purposes related to erosion research (e.g., supporting erosion modelling, esti-mation of input parameters for the models, model verification, etc.), but not for direct delineation of eroded soils. Among the studies aimed at direct erosion mapping, most publications have focused on tropical and arid regions with large territories. Thus, they do not result in detailed maps of eroded soils, but more commonly in rough regionalisation for identifying some erosion risk areas or eroded areas.
Some studies are used for the identification of linear erosion features, such as gullies or even rills (Vrieling and Rodrigues, 2005) or identification of badlands (Sujatha et al., 2000, Yuliang and Yun, 2002). Other studies are aimed at investigation of erosion dynamics. Time sequences of remote sensing images provided information on the territorial growth of eroded areas (Fadul et al., 1999 and Sujatha et al., 2000). Similar studies in alpine environments without exact delineation and acreage calculation have been performed by Alewell et al. (2008) and Mesburger et al. (2010). Detailed erosion maps were developed for the loess hilly lands of the Czech Republic (Novák and Batysta, 2013, Dum-brovský, 2013). The delineation of eroded patterns is usually performed by vi-sual vectorisation. However, in some studies, the mathematical classification was alternatively used. An example of uncontrolled mathematical classification of SPOT HRV multispectral images is provided by Servenay and Prat (2003). Beaulieu and Gaonac’h (2002) identified eroded areas using multifractal analy-sis of Landsat TM multispectral images.
An important question is how to relate the soil colours in the field to the colours of the remote sensing media. It would be very helpful if some direct quantitatively expressed relations would be found. From this point of view, the most interesting studies include Escadafal et al. (1989) and Escadafal (1993), which proposed an algorithm to express the relation between colours at remote sensing media and the soil colours expressed by the Munsel colour chart. Singh et al. (2004) also discussed the relations of soil colours in the field and of re-mote sensing media. Colour differences between eroded and non-eroded soils based on differences in iron and organic matter content were assessed using the spectral unmixing approach in De Jong et al. (1999), Haboudane et al. (2002) and Hill and Schutt (2000). The principles of spectral unmixing are provided by Vrieling (2006), Ben-Dor et al. (2003) and Escel et al. (2004).

250
In addition to colours, the impacts of surface roughness and crusting, clay content and soil moisture on the identification of eroded areas have been exa-mined (Ben-Dor et al., 2003, and Escel et al., 2004). However, the assessment of these parameters is difficult as their impacts are often overlapping and very complex (Walker et al., 2004). Even investigations of surface roughness by radar images did not produce satisfactory results (Davidson et al., 2000).
Use of remote sensing for erosion investigation in Slovakia
In Slovakia, since the beginning of 1990s, considerable attention has been given to the identification of severely eroded soils by remote sensing. Soil ma-pping of the Rišňovce Cooperative Farm in the context of a research project on sustainable agriculture used black and white aerial photos for the identification of eroded soil (Fulajtár, 1991). Although the photographs were not used for direct delineation of eroded patterns, they served as background information and the eroded soils were mapped as generalised complexes together with non--eroded soils. Several categories of complex mapping units with different pro-portions of eroded and non-eroded soils were recognised. Further on, several studies testing the methodological approaches were conducted at the Rišňovce pilot area. The first step was the analogue interpretation of black and white aerial photos and the direct delineation of eroded and accumulated patterns (Fulajtár, 1994a). This study was conducted prior to the introduction of GIS in pedology in Slovakia; as such, the patterns were hand drawn using transparent sheets without georeferencing of the photographs.
This simple approach tested at the Rišňovce site was applied for mapping the eroded soils in larger regions by environmental decision institutions. For example, a map of eroded soils of the Levice district (approximately 1551 km2) was prepared for the Slovak environmental agency (Fulajtár, 1994b).
New ideas related to theoretical and methodological aspects of remote sen-sing exploitation for soil mapping were brought by the introduction of GIS into earth sciences in Slovakia in the mid-1990s. The possibilities of combined use of DTM and remote sensing for erosion investigation was discussed in Šúri and Hofierka (1994). Šúri and Lehotský (1995) prepared the first classification of satellite images and discussed the possibility of using the mathematical classi-fication of images for erosion mapping. Šúri (1996) provided a comprehensive review of the literature on remote sensing exploitation for erosion mapping.

251
Further studies at the Rišňovce test site led to major achievements in the methodology (Fulajtár, 1995, 1996, 1998, 2002, Fulajtar and Janský, 2001). High quality results were achieved by visual vectorisation of eroded patterns from scanned black and white aerial photos and SPOT PAN images as well as by controlled mathematical classification of SPOT PAN images. The results of these methodological studies were successfully used for applied purposes. Svi-ček (2000a) prepared a map of the eroded soils of Trnavska Pahorkatina by visual vectorisation of SPOT PAN images.
Fulajtár et al. (2008) discussed several new methodological aspects related to the accuracy of erosion delineation by visual vectorisation (how the eroded patterns appear in different seasons on the same and different images, to what extent the mapping can be done for vegetated plots, how the multispectral data can be exploited, whether they can help to identify erosion patterns below the vegetation, etc.). Based on these questions, a wide range of remote sensing me-dia (e.g., black and white aerial photos, colour aerial photos, SPOT PAN im-ages, multispectral SPOT images, multispectral Landsat TM5 and TM7 images, etc.) were assessed for their potential to express eroded soils (Fulajtar et al., 2013). Another important methodological achievement was the investigation of relation between erosion patterns and relief (Smetanová, 2008, 2009 and Sme-tanová and Šabo, 2011) conducted in the southern part of Trnavská Pahorka-tina. The investigated relation is not simple and direct. Some eroded areas are clearly related to relief, but others show only loose relations. Several types could be distinguished. They differ by origin (e.g., water, wind or tillage erosion).
Objectives
The major objectives of this study are 1) the preparation of a soil erosion map of the Pastovce study area, 2) testing the suitability of digital colour aerial photographs rectified and merged to orthophotomaps for erosion mapping and 3) investigation of the relation between erosion spatial distributions and relief.
The first step (the erosion mapping) resulted in the delineation of soil ero-sion patterns manifested as bright patches on the aerial photographs. The ma-pping results were discussed and the suitability of digital colour aerial photo-graphs for erosion mapping was assessed and compared with other media used in previous studies. The study of the relation between erosion and relief is the most complex objective. It is based on a DTM. It was presumed that the bright patches occur in areas intensively affected by soil erosion. If the studied area is sufficiently small to be homogeneous regarding the parent material, soilscape
252
and climate, it can be presumed that the relief is the major factor controlling the erosion spatial distribution. The relief properties are characterised by a set of quantitative parameters. Erosion rates should be controlled by these morpho-metric variables. However, these relations may be disturbed to a large extent by the historical development of land use and land management.
Material and methods
Study site
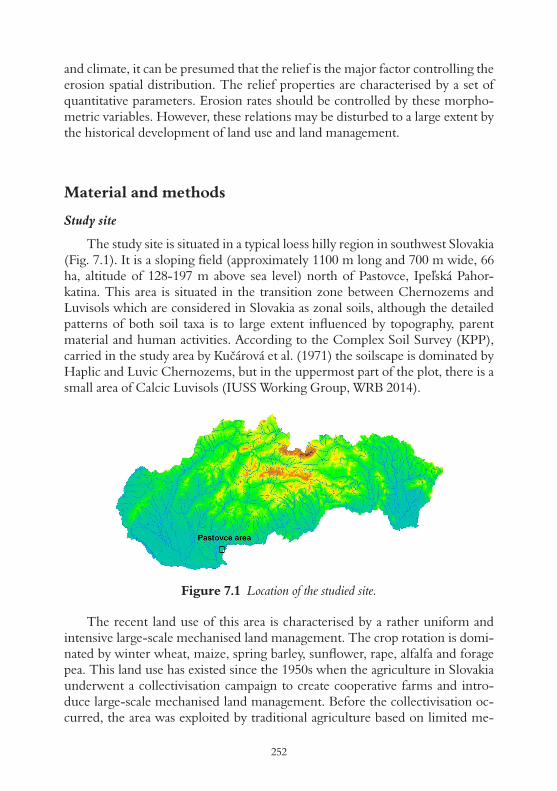
The study site is situated in a typical loess hilly region in southwest Slovakia (Fig. 7.1). It is a sloping field (approximately 1100 m long and 700 m wide, 66 ha, altitude of 128-197 m above sea level) north of Pastovce, Ipeľská Pahor-katina. This area is situated in the transition zone between Chernozems and Luvisols which are considered in Slovakia as zonal soils, although the detailed patterns of both soil taxa is to large extent influenced by topography, parent material and human activities. According to the Complex Soil Survey (KPP), carried in the study area by Kučárová et al. (1971) the soilscape is dominated by Haplic and Luvic Chernozems, but in the uppermost part of the plot, there is a small area of Calcic Luvisols (IUSS Working Group, WRB 2014).
Figure 7.1 Location of the studied site.
The recent land use of this area is characterised by a rather uniform and intensive large-scale mechanised land management. The crop rotation is domi-nated by winter wheat, maize, spring barley, sunflower, rape, alfalfa and forage pea. This land use has existed since the 1950s when the agriculture in Slovakia underwent a collectivisation campaign to create cooperative farms and intro-duce large-scale mechanised land management. Before the collectivisation oc-curred, the area was exploited by traditional agriculture based on limited me-
253
chanisation and prevailing use of man and animal power. The traditional land use structure is composed of very small and usually long and narrow plots of small private farms. Thus, the collectivisation resulted in fundamental land use changes (Sviček, 2000b) (Fig. 7.2). The study area was exposed to this traditio-nal land use for many centuries, which may have had important effects on the distribution of erosion phenomena and should be considered when interpreting the spatial distribution of erosion.
Methodological approaches
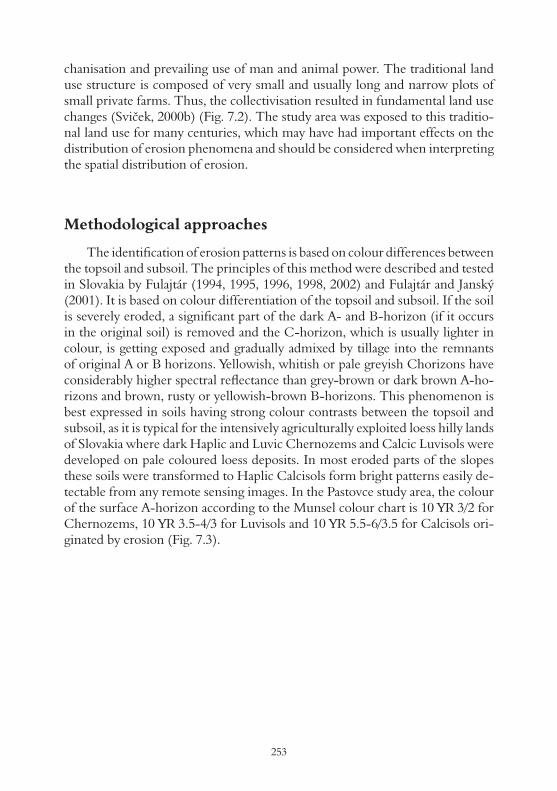
The identification of erosion patterns is based on colour differences between the topsoil and subsoil. The principles of this method were described and tested in Slovakia by Fulajtár (1994, 1995, 1996, 1998, 2002) and Fulajtár and Janský (2001). It is based on colour differentiation of the topsoil and subsoil. If the soil is severely eroded, a significant part of the dark A- and B-horizon (if it occurs in the original soil) is removed and the C-horizon, which is usually lighter in colour, is getting exposed and gradually admixed by tillage into the remnants of original A or B horizons. Yellowish, whitish or pale greyish Chorizons have considerably higher spectral reflectance than grey-brown or dark brown A-ho-rizons and brown, rusty or yellowish-brown B-horizons. This phenomenon is best expressed in soils having strong colour contrasts between the topsoil and subsoil, as it is typical for the intensively agriculturally exploited loess hilly lands of Slovakia where dark Haplic and Luvic Chernozems and Calcic Luvisols were developed on pale coloured loess deposits. In most eroded parts of the slopes these soils were transformed to Haplic Calcisols form bright patterns easily de-tectable from any remote sensing images. In the Pastovce study area, the colour of the surface A-horizon according to the Munsel colour chart is 10 YR 3/2 for Chernozems, 10 YR 3.5-4/3 for Luvisols and 10 YR 5.5-6/3.5 for Calcisols ori-ginated by erosion (Fig. 7.3).

254
Figure 7.2 Typical bright erosion patterns in the loess hilly region of Slovakia.
Figure 7.3 Typical soil profiles representing the most abundant soils of Slovak loess hilly lands: a) Haplic Chernozem, b) Calcic Luvisol and c) Haplic Calcisol originated by
erosion of Chernozems or Luvisols.
The delineation of erosion patterns can be performed by visual vectorisa-tion or mathematical classification. The mathematical classification at the Pas-tovce site is quicker, demands less manual labour, is less subjective and provides

255
high accuracy if high quality photographs or images are available. Delineation of soil erosion patterns by colours of aerial photographs is a very efficient method, which allows for rapid delineation in large areas of loess hilly lands.
The mapping and investigation of the spatial distribution of eroded are-as can be supported by soil erosion modelling. An important task is also the investigation of the impact of relief on the erosion spatial distribution. Major primary and secondary morphometric variables expected to have an impact on soil erosion were examined.
Data input
The following input data were used: ■ Orthophotomaps:
■ Orthophotomap from late summer 2011 ■ Orthophotomap from 30. 4. 2014
■ Elevation grid with 10x10-m resolution ■ Derived morphometric variables
■ Slope ■ Aspect ■ Tangential curvature ■ Profile curvature ■ Geometrical forms ■ Upslope contributing area ■ USPED erosion/deposition factor
Figure 7.4 Orthophotos and delimited bright patches of parcels of interest in a) 2011 and b) 2014.

256
Digital Elevation Model and morphometric analysis
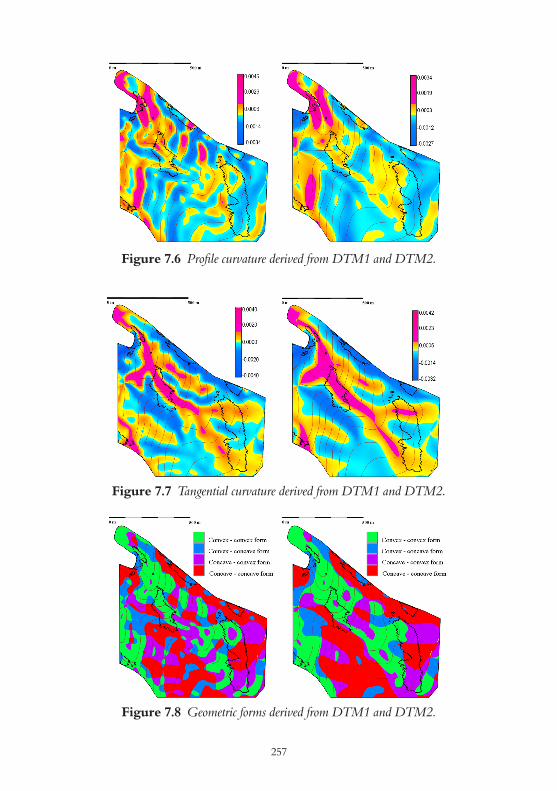
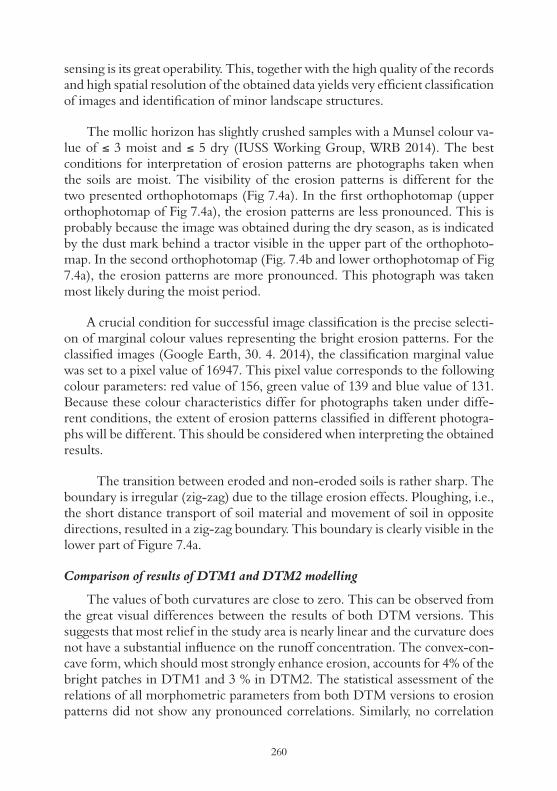
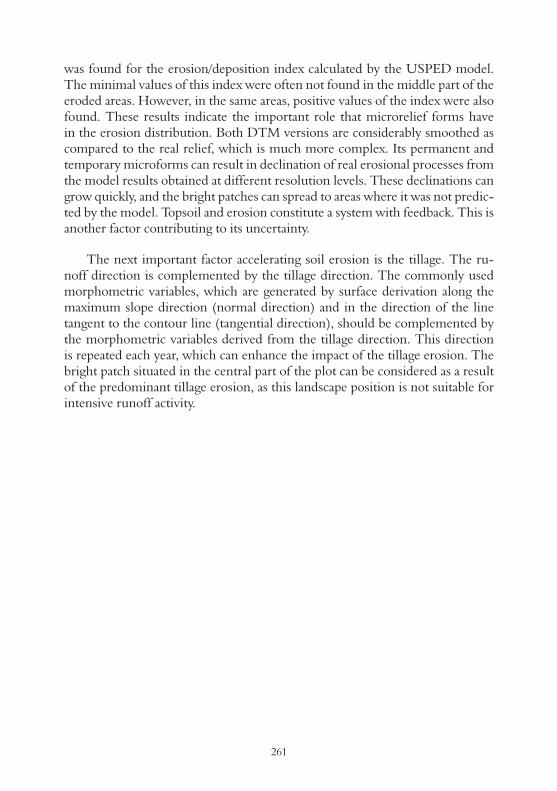
The DTM was generated by the method of regularised spline with tension. Two versions of DTM with different levels of smoothing were used. The tensi-on parameter was set to 40 for the more precise DTM1 version and to 20 for the more smoothed DTM2 version. Calculation of both DTM versions was per-formed in one segment for the whole studied plot to optimise the smoothing. For both DTM versions, the following morphometric variables were calcula-ted: slope β (Fig. 7.5), aspect α, profile curvature (KN)n (Fig. 7.6) and tangential curvature (KN)t (Fig. 7.7). On the basis of positive and negative values of the profile curvature (KN)n and tangential curvature (KN)t, a map of four basic geometrical forms of relief was created (Fig. 7.8) (Krcho 1973, 1990):
This parameter is important for the runoff behaviour. Convex-convex forms accelerate the runoff and disperse its direction, convex-concave forms accelerate and concentrate the runoff, concave-concave forms slow down and concentrate the runoff, and concave-convex forms slow down and disperse the runoff. Based on these effects, convex-concave forms enhance erosion and con-cave-convex forms enhance deposition.
Figure 7.5 Slope in degrees derived from DTM1 and DTM2.
(upper ortophotomap on the Fig 7.4a) the erosion patterns are less pronounced. This is probably due to fact that the picturing was carried during the dry period as it is indicated by the dust mark behind a tractor visible in the upper part of the ortophotomap. At the second ortophotomap (Fig. 7.4b and lower ortophotomap on the Fig 7.4a) the erosion patterns are more pronounced. This photograph was taken most probably during the more moist period.
Fig. 7.4 Orthofotomats and delimited bright patchies on interest parcel a) 2011 and 2014, b) 2014.
A crucial condition for successful image classification is the precise selection of marginal colour value representing the bright erosion patterns. For the classified image (Google Earth, 30. 4. 2014) the classification marginal value was set to a pixel value of 16947. This pixel value corresponds to following colour parameters: red value of 156, green value of 139 and blue value of 131. As these colour characteristics differ at photographs taken under different conditions the extension of erosion patterns classified at different photographs will be different. This should be kept in the mind when interpreting the obtained results.
The transition between eroded and non-eroded soils is rather sharp. The boundary is irregular (zig-zag) what result from tillage erosion effects. The ploughing result in short distance transport of soil material and movement of soil in opposite directions when the tractor is going one direction and back results in this zig-zag boundary. It is well visible especially in the lower part of the figure 7.4a.
Digital Elevation Model and morphometric analysis
The DTM was generated by the method of regularized spline with tension. Two versions of DTM with different levels of smoothing. The tension parameter was set to 40 for more precise DTM1 version and to 20 for more smoothed DTM2 version. Calculation of both DTM versions was done in one segment for the whole studied plot in order to optimize the smoothing. For both DTM versions the following morphometric variables were calculated: slope β (Fig. 7.5), aspect α, profile curvature (KN)n (Fig. 7.6) and tangential curvature (KN)t (Fig. 7.7). On the base of positive and negative values of profile curvature (KN)n and tangential curvature (KN)t the map of four basic geometrical forms of relief was created (Fig. 7.8) (Krcho 1973, 1990):
(KN)n >0 ∧ (KN)t >0 - convex-convex form,
(KN)n >0 ∧ (KN)t <0 - convex-concave form,
(KN)n <0 ∧ (KN)t <0 - concave-concave form,
(KN)n <0 ∧ (KN)t >0 - concave-convex form.
% 202
257
Figure 7.6 Profile curvature derived from DTM1 and DTM2.
Figure 7.7 Tangential curvature derived from DTM1 and DTM2.
Figure 7.8 Geometric forms derived from DTM1 and DTM2.

258
Important changes in erosion should occur at boundaries of particular (va-riably inclined) slope segments. At these boundaries, significant changes of cur-vatures derived from normal directions occur. Across these boundaries, zero isolines of normal change of profile curvature (Jenčo, 1992) or zero isolines of normal change of the gradient (Minár, 1999) occur. For delineation of basic slope segments, it is necessary to exclude zero isolines of these third order mor-phometric variables, which creates boundaries of internal segments.
Erosion modeling
The soil erosion and deposition rates were calculated by the USPED mo-del (Unit stream power-based erosion/deposition model) proposed by Mitá-šová and Mitáš (2001). USPED combined the RUSLE (Revised universal soil loss equation; Moore and Burch 1986, Renard et al. 1997) parameters, such as the rainfall erosivity factor (R) [MJ.ha-1.mm.h-1], soil erodibility factor (K) [t.ha.h.MJ-1.ha-1.mm-1], land cover factor (C), the prevention measure factor (P) (the last two factors are dimensionless) and the upslope contributing area per unit width (U) (Fig. 7.9) to estimate sediment flow (T):
T ≈ RKCPUm(sin β)n,
where β is the slope [o], and the exponents m and n control the relative influen-ce of water and slope terms and reflect the impact of different types of flow. The net erosion/deposition ED is estimated as a divergence of sediment flow T:
where α is the aspect [o]. The absolute values of net erosion/deposition rates were not calculated because the USPED model adopts the values of empirical factors derived for the RUSLE model. These factors are uniform at the studied site.
For calculation of the sediment flow map, the parameters R=K=C=P=1 and exponents m=n=1 will be used; than the erosion/deposition factor ED’ can be calculated by the following equation:
In this case, the ED’ factor is positive for areas with deposition potential in which the sediment transport capacity decreases and negative for areas with ero-sion potential in which the sediment transport capacity increases. The upslope

259
contributing area per unit width U was calculated as the output flow accumula-tion raster map using the r.terraflow module in GRASS GIS software.
Figure 7.9 Upslope contributing areas in ares (100 m2) derived from DTM1 and DTM2.
Results and discussion
Comparison of the suitability of aerial photographs for delimitation of erosion patterns
The first result of the Pastovce study was the delineation of soil erosion patterns from the colour aerial photographs rectified and merged the orthopho-tomap and to test the suitability of colour aerial photos for soil mapping. The resulting pattern together with the used orthophotomaps (from 2011 and 2014) is shown in Figure 7.4. In earlier studies of other sites in Slovakia, mostly black and white media (black and white aerial photos and SPOT PAN images) were used (Fulajtár, 1991, 1994a, 1994b, 1996, 1998, 2002, Fulajtár and Janský, 2001, Sviček, 2000a, Smetanová, 2008, 2009, Smetanová and Šabo, 2011).
A great advantage of recent colour aerial photos is that they are in electronic form. The processing possibilities of earlier analogues of aerial photos (both black and white and colour) was much more limited (even if scanned) than the processing possibilities of digital photos. The major advantage is that the digital photos can be classified. However, also the visual vectorisation is more con-venient and precise when using this medium. The major advantage of remote
260
sensing is its great operability. This, together with the high quality of the records and high spatial resolution of the obtained data yields very efficient classification of images and identification of minor landscape structures.
The mollic horizon has slightly crushed samples with a Munsel colour va-lue of ≤ 3 moist and ≤ 5 dry (IUSS Working Group, WRB 2014). The best conditions for interpretation of erosion patterns are photographs taken when the soils are moist. The visibility of the erosion patterns is different for the two presented orthophotomaps (Fig 7.4a). In the first orthophotomap (upper orthophotomap of Fig 7.4a), the erosion patterns are less pronounced. This is probably because the image was obtained during the dry season, as is indicated by the dust mark behind a tractor visible in the upper part of the orthophoto-map. In the second orthophotomap (Fig. 7.4b and lower orthophotomap of Fig 7.4a), the erosion patterns are more pronounced. This photograph was taken most likely during the moist period.
A crucial condition for successful image classification is the precise selecti-on of marginal colour values representing the bright erosion patterns. For the classified images (Google Earth, 30. 4. 2014), the classification marginal value was set to a pixel value of 16947. This pixel value corresponds to the following colour parameters: red value of 156, green value of 139 and blue value of 131. Because these colour characteristics differ for photographs taken under diffe-rent conditions, the extent of erosion patterns classified in different photogra-phs will be different. This should be considered when interpreting the obtained results.
The transition between eroded and non-eroded soils is rather sharp. The boundary is irregular (zig-zag) due to the tillage erosion effects. Ploughing, i.e., the short distance transport of soil material and movement of soil in opposite directions, resulted in a zig-zag boundary. This boundary is clearly visible in the lower part of Figure 7.4a.
Comparison of results of DTM1 and DTM2 modelling
The values of both curvatures are close to zero. This can be observed from the great visual differences between the results of both DTM versions. This suggests that most relief in the study area is nearly linear and the curvature does not have a substantial influence on the runoff concentration. The convex-con-cave form, which should most strongly enhance erosion, accounts for 4% of the bright patches in DTM1 and 3 % in DTM2. The statistical assessment of the relations of all morphometric parameters from both DTM versions to erosion patterns did not show any pronounced correlations. Similarly, no correlation
261
was found for the erosion/deposition index calculated by the USPED model. The minimal values of this index were often not found in the middle part of the eroded areas. However, in the same areas, positive values of the index were also found. These results indicate the important role that microrelief forms have in the erosion distribution. Both DTM versions are considerably smoothed as compared to the real relief, which is much more complex. Its permanent and temporary microforms can result in declination of real erosional processes from the model results obtained at different resolution levels. These declinations can grow quickly, and the bright patches can spread to areas where it was not predic-ted by the model. Topsoil and erosion constitute a system with feedback. This is another factor contributing to its uncertainty.
The next important factor accelerating soil erosion is the tillage. The ru-noff direction is complemented by the tillage direction. The commonly used morphometric variables, which are generated by surface derivation along the maximum slope direction (normal direction) and in the direction of the line tangent to the contour line (tangential direction), should be complemented by the morphometric variables derived from the tillage direction. This direction is repeated each year, which can enhance the impact of the tillage erosion. The bright patch situated in the central part of the plot can be considered as a result of the predominant tillage erosion, as this landscape position is not suitable for intensive runoff activity.
262
Conclusions
The Pastovce study showed that the studied area is considerably affected by erosion. Over 13% of the area is strongly eroded (e.g., the original A and B soil horizons are removed and the soils are transformed to Haplic Calcisols). In addition, another portion of the area is also partially eroded, however, this is not observed on the soil surface.
The investigations yielded valuable information for the development of the methodology. It was demonstrated that the digital colour aerial photographs are a very suitable tool for erosion mapping, and they are much better than earlier used media.
Soils in loess areas have high organic carbon content in the surface horizon. The dark colour of the surface of the soil is thus in sharp contrast with the lighter colour of the subsurface horizons. The mollic horizon of Chernozems is often removed as a result of erosion and weakly developed ochric A horizon is formed by gradual admixing of subsoil loess sediment with the remnants of the original A horizon. Colour differences are then visible, especially in colour aerial photographs. The darkness of the mollic horizon is more noticeable in the case of moist surface horizons. For that reason, the aerial images from the moist period are more easily interpreted. The contrast between the colour of original mollic horizon and ochric A horizon formed by erosion is indeed so obvious that even areal images from dry period are well interpreted. This applies to high resolution images.
The connections between bright patches and the land surface are not clear-ly pronounced. This conclusion is also supported by the analysis of a relief in relation to the spatial arrangement of the bright patches. These relations disa-ppear if any smoothing of the relief is performed during the DTM preparation. Furthermore, water erosion is conditioned by turbulent water streaming. We can conclude that the processes of water erosion are a demonstration of a chao-tic system. The behaviour of the chaotic system supports the creation of unfo-reseeable structures. Simple visual analysis appeared to be the most effective means of mapping these structures. The controlled data collection is critical for the success of such analysis. It means that the repeated sensing of Earth‘s surfa-ce for the purpose of mapping the bright patches should be performed during periods of similar conditions. This is the only way to ensure the accuracy of the delineation of individual areas in different moments of its evolution. Further-more, the usage of such aerial images in combination with digital terrain models enables the optimisation of soil sampling in the surrounding of bright patches with less affected soils for the purposes of more detailed mapping of the spatial

263
pattern of soil erosion and deposition based, for example, on the 137Cs method (Zhang et al., 2015).
Non-demanding operational technology such as unmanned aerial vehicles (UAVs) is thus a very good method for erosion monitoring. Remote sensing of Earth’s surface from low altitudes by drones is less dependent on weather and it allows pedologists to use the same photosensitive equipment and materials when monitoring during longer periods of time. The main advantage of the drones is the possibility of their operational deployment any time the need for remote sensing arises. Pedologists can then promptly react and catch the deve-lopment in detail in the monitored area. The UAV method can thus become a valuable tool in suggesting soil conservation measures and monitoring their effectiveness. In loess areas, it is an ideal method for immediate monitoring of erosion based on the identification of bright patches.
264
References
Alewell, C., Meusburger, K., Brodbeck, M., Bänninger, D. 2008. Methods to describe and predict soil erosion in mountain regions. Landscape and Ur-ban Planning 88, 46–53.
Beaulieu, A., Gaonac’h, H. 2002. Scaling of differentially eroded surfaces in the drainage network of the Ethiopian Plateau. In Remote Sensing of Envi-ronment 82 (1), 111 –122.
Ben-dor, E., Goldshleger, N., Benyamini, Y., Agassi, M., Blumberg, D. G. 2003. The spectral reflectance properties of soil structural crusts in the 1.2- to 2.5-Am spectral region. In Soil Science Society of America Journal 67 (1), 289– 299.
Davidson, M. W. J., Le Toan, T., Mattia, F., Satalino, G., Manninen, T., Bor-geaud, M. 2000. On the characterization of agricultural soil roughness for radar remote sensing studies. In IEEE Transactions on Geoscience and Re-mote Sensing 38 (2), 630–640.
De Jong, S. M., Paracchini, M. L., Bertolo, F., Folving, S., Megier, J., De Roo, A. P. J. 1999. Regional assessment of soil erosion using the distributed model SEMMED and remotely sensed data. In Catena 37 (3– 4), 291– 308.
Dumbrovský, M., 2013. Investigation of ruoff conditions: A case study Nová Lhota (In Czech: Rešení odtokových pomerú na príkladu studie v Nové Lhote), oral presentation, Information meeting of ELSA for municipalities, 6. 6. 2013, Nová Lhota.
Escadafal, R. 1993. Remote sensing of soil colour: principles and applications.In Remote sensing reviews 7, 261-279.
Escadafal, R., Girand, M.C., Courault, D., 1989. Munsell soil color and soil reflectance in the visible spectral bands of Landsat MSS and TM data. Rem. Sensing Environ. 27, 37-46.
Escel, G., Levy, G. J., Singer, M. J. 2004. Spectral reflectance properties of crus-ted soils under solar illumination. In Soil Science Society of America Jour-nal 68 (6), 1982–1991.
Fadul, H. M., Salih, A. A., Ali, I. A., Inanaga, S. 1999. Use of remote sensing to map gully erosion along the Atbara River, Sudan. In International Journal of Applied Earth Observation and Geoinformation 1 (3– 4), 175– 180.

265
Fulajtár, E. 1991. Soil map of Rišňovce cooperative farm (In Slovak: Pôdna mapa poľnohospodárskeho družstva Rišňovce, (1:10 000). VÚPÚ, Brati-slava, 51-63.
Fulajtár, E. 1994a. Assessment of territorial extension of eroded soils at Rišňov-ce cooperative farm (In Slovak: Zhodnotenie rozšírenia erodovaných pôd na území PD Rišňovce s využitím panchromatických čiernobielych letec-kých snímok). Proceedings of VÚPÚ 18, Bratislava.
Fulajtár, E. 1994b. Map of eroded soils in Levice district (In Slovak: Mapa ero-dovaných pôd okresu Levice) (1:50 000). VÚPÚ, Bratislava.
Fulajtár, E. 1995. Contribution to investoigation of erosion rates and erosion spatial extension in hilly land of Western Slovakia (In Slovak: Príspevok k poznaniu intenzity vodnej erózie a erodovaných pôd na pahorkatinách Západného Slovenska). Abstract booklet, Seminare „Problems of Geogra-phicaql investigation of Western Slovakia“, Brezovej pod Bradlom, SAV, Bratislava.
Fulajtár, E. 1996. The temporal and spatial variability of erosion in the eolian areas of Slovakia. Poster Report Booklet. Int. Symp. of IAHS „Erosion and Sediment Yield: Global and Regional Perspectives“, Exeter, 49-51.
Fulajtár, E. 1998. Identification of severely eroded soils from remote sensing data tested in Rišňovce and Levice Pilot Areas In Vedecké práce VÚPÚ 21, Bratislava, 27-54.
Fulajtár, E., 2002. Identification of severely eroded soils from remote sensing data tested in Rišňovce, Slovakia. In Stott D.E., Mohtar R.H., Steinardt G.C. (eds): Sustaining the Global Farm, Selected papers from the 10th International Soil Conservation Organisation Meeting in West Lafayette, ISCO-USDA-NSERL-PU, 1999, 1075-1082.
Fulajtár, E., Janský, L. 2001. Soil erosion and soil conservation (In Slovak: Vodná eózia a protierózna ochrana). VÚPOP, Bratislava, 308 p.
Fulajtár, E., Sviček, M., Szöcsová, I. 2008. Identification of eroded soils from remote sensing data, GIS, erosion models and fallout radionuclide methods in Slovakia. Prednáška na Konferencii Projektu č. 634 programu COST “Off-site and on-site effects of soil erosion”, máj 2008, Samos.
Fulajtár, E., Hrabovská, B., Saksa, M., Sviček, M., Kováčiková, I., Morávek, A. 2013. Assessment of aerial photographs and satellite images for soil erosion mapping: A case study at Rišňovce site (In Slovak: Hodnotenie leteckých

266
a družicových snímok z hľadiska využiteľnosti pre mapovanie erózie pôdy na príklade skúšobného územia v Rišňovciach). Proceedings 35. VÚPOP, Bratislava, 41-64.
Haboudane, D., Bonn, F., Royer, A., Sommer, S., Mehl, W. 2002. Land degra-dation and erosion risk mapping by fusion of spectrally-basedinformation and digital geomorphometric attributes. In International Journal of Remote Sensing 23 (18), 3795–3820.
Hill, J., Schutt, B. 2000. Mapping complex patterns of erosion and stability in dry Mediterranean ecosystems. In Remote Sensing of Environment 74 (3), 557– 569.
IUSS Working Group WRB 2014. World Reference Base for Soil Resources 2014. International soil classification system for naming soils and creating legends for soil maps. World Soil Resources Reports No. 106, FAO, Rome, 181 p. http://www.fao.org/3/a-i3794e.pdf Accessed 11. December 2015.
Jenčo, M. 1992. Morphometric Analysis of Georelief in Terms of a Theoreti-cal Conception of the Complex Digital Model of Georelief. Acta Facultatis Rerum Naturalium Universitatis Comeniane, Geographica, 33, 133-151.
Krcho, J. 1973. Morphometric analysis of relief on the basis geometric aspect of field theory. Acta Geographica Universitatis Comeniane, Geographica physica, 1, 1- 233.
Krcho, J. 1990. Morphometric analysis and digital models of terrain (In Slovak: Morfometrická analýza a digitálne modely georeliéfu). VEDA , Bratislava, 426 p.
Kučárová, M., Šiška, A., Pestún, V., 1971. Soil Survey of Czechoslovakia, Final report, Pástovce Cooperative Farm, Levice District, West Slovakia Region (In Slovak: Pôdoznalecký prieskum ČSSR, Záverečná správa, JRD Pástov-ce, okres Levice, kraj Západoslovenský, Slovenská poľnohospodárska akadé-mia/Výskumný ústav pôdoznalectva a výživy rastlín, Bratislava, 23 p.
Manchanda, M. L., Kudrat, M., Tiwari, A. K. 2002. Soil Survey and Mapping Using Remote Sensing. In: Tropical Ecology 43(1), 2002, 61-74.
Meusburger K., Konz, N., Schaub, M., Alewell, C. 2010. Soil erosion modelled with USLE and PESERA using QuickBird derived vegetation. In Interna-tional Journal of Applied Earth Observation and parameters in an alpine catchment, Geoinformation 12, 208–215.

267
Minár, J. 1999. Morphometric analysis of the fields and its utilization in geoe-cology (In Slovak: Morfometrická analýza polí a jej využitie v geoekológii. Geografický časopis 51, 261-277.
Mitášová, H., Mitáš, L. 2001. Multiscale soil erosion simulations for land use managment. Landscape erosion amd landscape evolution modeling . Eds. Harmon, R., Doe, W., 321-347, Kluwer Academic/Plenum Publishers, New York, 321-347.
Moore, I., Burch, G. 1986. Modeling erosion and deposition : Topographic effects. Transactions ASAE, 29, 1624-1640.
Novák, P., Batysta M., 2013. Landscape and soil development affected by long lasting soil erosion (In Czech: Vývoj krajiny a púdního pokryvu v dúsledku dlhodobé eroze), Antropisation X. „Positive and negative soil antropisation“ workshop at anniversary of Assoc. Prof. Zoltána Bedrnu, 7.-8. Marec 2013, Bratislava, SPS-VÚPOP, Bratislava.
Renard, K. G., Foster, G. R. Weesies, G. A. McCool, D. K. Yoder, D. C. coor-dinators 1997. Predicting Soil Erosion by Water: A Guide to Conservation Planning with the Revised Universal Soil Loss Equation. U.S. Department of Agriculture, Agriculture Handbook 703, 384 p.
Singh, D., Herlin, I., Berroir, J. P., Silva, E. F., Meirelles, M. S., 2004. An appro-ach to correlate NDVI with soil color for erosion process using NOAA/AVHRR data. In Advances in Space Research 33 (3), 328–332.
Servenay, A., Prat, C. 2003. Erosion extension of indurated volcanic soils of Mexico by aerial photographs and remote sensing analysis. In Geoderma 117 (3– 4), 367– 375.
Smetanová, A. 2008. Contribution of water and tillage erosion to bright patches formation on the base of erosion modeling (Case study Trnavská pahorka-tina Hill Land, Slovakia), Preliminary results. Landform Analysis, Vol. 9, 45–48.
Smetanová, A. 2009. Bright patches on chernozems and their relationship to the relief, In: Geografický časopis 61/3, 2009, 215-227.
Smetanová, A., Šabo, M. 2010. Bright patches in Chernozem areas on loess - an evidence of soil erosion and relief changes. Prace i Studia Geograficzne, Vol. 45, 2011, 143-152.

268
Sujatha, G., Dwivedi, R. S., Sreenivas, K., Venkataratnam, L. 2000. Mapping and monitoring of degraded lands in part of Jaunpur district of Uttar Pra-desh using temporal spaceborne multispectral data. In International Journal of Remote Sensing 21 (3), 519– 531.
Sviček M. 2000. Erosion detection with the use of remote sensing (In Slovak: Detekcia erózie pomocou metód DPZ). Poster presentation, Agrokomplex. VÚPOP, Nitra.
Šúri M. 1996. Analysis and assessment of possibilities of remote sensing ex-ploitation for erosion investigation (In Slovak: Analýza a hodnotenie mož-ností využitia diaľkového prieskumu Zeme vo výskume erózie pôdy), Geo-grafický časopis 48/1, 73-91.
Šúri M., Hofierka J. 1994. Soil water erosion identification using satellite and dtm data. In Proceedings of EGIS/MARI Conference, Paris, 937-944.
Šúri M., Lehotský M. 1995. Identification of soil erosion from SSPOT satellite image (In Slovak: Identifikácia erózie pôdy z údajov družice SPOT). Geo-graphica Slovaca 10, 265-272
Vrieling, A. 2006. Satellite remote sensing for water erosion assessment: A re-view. In Catena 65, 2 – 18.
Vrieling, A., Rodrigues, S.C. 2005. Erosion assessment in the Brazilian Cerra-dos using multi-temporal SAR imagery. Proceedings of the 2004 Envisat & ERS Symposium, SP-572, ESA, Salzburg, Austria, 8 p.
Walker, J. P., Houser, P. R., Willgoose, G. R. 2004. Active microwave remote sensing for soil moisture measurement: a field evaluation using ERS-2. In Hydrological Processes 18 (11), 1975– 1997.
Warner, T.A., Nellis, M.D., Foody, G.M. 2009 The SAGE Handbook of Re-mote Sensing SAGE Publications Ltd, 568 http://dx.doi.org/10.4135/ 9780857021052 Accessed 7. November 2015.
Yuliang, Q., Yun, Q. 2002. Fast soil erosion investigation and dynamic analysis in the Loess Plateau of China by using information composite technique. In Advances in Space Research 29 (1), 85– 88.
Zhang, X. C. (John), Zhang, G. H., Wei, X. 2015. How to make 137Cs erosion estimation more useful: An uncertainty perspective. Geoderma, 239–240, 186–194.

277
Copyrights and affiliations
Monika Šulc Michalková1,2 (65 normed pages - 3,25 AH)
Jakub Miřijovský3 (63,5 normed pages - 3,175 AH)
Dénes Lóczy4, József Dezső4, Levente Ronczyk4, Szabolcs Czigány4, Ervin Pirkhoffer4, Péter Gyenizse4, Amadé Halász4, Adrienne Ajkai-Ortmann5 (Floodplain degradation and possible rehabilitation along the Hungarian Drava section)
Szabolcs Czigány4, Ervin Pirkhoffer4, Ákos Halmai4, Dénes Lóczy4 (Floodway zoning and flood modelling using remote sensing and DEM along the lower Hungarian Drava section)
József Dezső4, Amadé Halász4, Dénes Lóczy4, Szabolcs Czigány4
(Assessment of a water recharge project into an oxbow of the Drava floodplain)
Justyna Warowna6, Grzegorz Gajek6, Leszek Gawrysiak6, Bogusława Baran-Z-głobicka6, Wojciech Zgłobicki6 (Application of GIS and aerial photography in geomorphological studies, Małopolska Vis-tula River Gap, Poland)
Emil Fulajtár7, Marián Jenčo1, Martin Saksa7
(Soil erosion mapping with the aid of aerial photographs tested at Pastovce, Ipeľská pahor-katina)
1Department of Physical Geography and Geoecology, Faculty of Natural Scien-ces, Comenius University, 842 15 Bratislava 4, Ilkovičova 6. Slovakia
2Department of Geography, Faculty of Science, Masaryk University, 611 37 Brno, Kotlářská 2. Czech Republic
3Department of Geoinformatic, Faculty of Science, Palacký University Olo-mouc, 771 46 Olomouc, 17. listopadu 50. Czech Republic
4Institute of Geography, University of Pécs, H-7624 Pécs, Ifjúság útja 6. Hungary
5Institute of Biology, University of Pécs, H-7624 Pécs, Ifjúság útja 6. Hungary
6Department of Geology and Lithosphere Conservation, Faculty of Earth Sci-ences and Spatial Management, Maria Curie-Skłodowska University, 20 718 Lublin, Krasnicka 2cd. Poland
7Pedology and soil mapping department, Soil Science and Conservation Rese-arch Institute, National Agriculture and Food Centre, 827 13 Bratislava, Gaga-rinova 10. Slovakia

278
Monika Šulc MichalkováJakub Miřijovský
Dénes LóczyWojciech Zgłobicki
Et al.
Interdisciplinary studies of river channels and UAV mapping in the V4 region
Technical editor: Bc. Andrea KřížováDatabase creation, mathematical and statistic support: Mgr. Zdeňka Geršlová
Book cover design: Ing. Zuzana Mlejová
Published by Comenius University in Bratislava,Šafárikovo námestie 6, 814 99 Bratislava 1, Slovakia
Printed by KO & KA spol. s r.o., Tlačiareň K-PRINT,Kadnárova 102, 831 06 Bratislava, Slovakia
First publicationISBN 978-80-223-4055-7