Embed Size (px)
Citation preview

Combustion Data for Jet-A, its Constituent Components, and Surrogate Mixtures Kamal Kumar* and Chih-Jen Sung†
* Department of Mechanical and Aerospace EngineeringCase Western Reserve University
† Department of Mechanical EngineeringUniversity of Connecticut
Multi-Agency Coordination Committee for Combustion Research – 2009 Fuels SummitGeneration of Comprehensive Surrogate Kinetic Models and
Validation Databases for Simulating Large Molecular WeightHydrocarbon Fuels
University of Southern CaliforniaLos Angeles, CA 90089
September 17, 2009

Key Tasks
• Acquire comprehensive experimental validation database for jet fuels, their constituents, and surrogate mixtures.– Autoignition delays and pre-ignition species evolutions at
elevated pressures and low-to-intermediate temperatures
– Fundamental flame properties, including laminar flame speeds and extinction stretch rates
• Establish the pattern of ignition response for the neat components vis-à-vis fully blended jet fuels.
• Explore the feasibility of reproducing combustion trends of Jet-A using simple binary/ternary surrogates.

Progress to Date• Autoignition of real jet fuels, including Jet-A, JP-8, and S-8.• Autoignition of neat hydrocarbon components under high
pressure conditions: n-decane, iso-octane, toluene, benzene, DME, DIB-1, MCH, 1,2,4-TMB, and xylenes.
• Chemical kinetic interactions in binary fuel blends: toluene+iso-octane, toluene+DIB-1, n-decane+iso-octane.
• Autoignition of Aachen surrogate and MURI mixture model.• Laminar flame speeds of preheated fuel/air mixtures:
MCH, toluene, iso-octane, n-heptane, n-decane, n-dodecane, Jet-A, and S-8.
• Extinction limits of preheated fuel/O2/N2 mixtures: n-decane, n-dodecane, Jet-A, and S-8.

Outline of Presentation• Autoignition Response
– Comprehensive ignition response for
a key paraffin component: n-decane
– Real jet fuels: Jet-A, JP-8, and S-8
– Jet-A constituents: aromatics, cycloalkanes, branched alkanes
– Binary blends and surrogates
• Flame Response– Laminar flame speeds and extinction stretch rates
– Neat surrogate components and real jet fuels
• Future Work

Autoignition Responseunder High Pressure Conditions
Test Matrix: n-DecaneMolar Ratio Molar composition (%)
n-C10H22 O2 N2 XFuel XO2 XN2
0.500 15.5 58.28 0.673 20.87 78.46
0.800 15.5 58.28 1.073 20.78 78.14
0.800 15.5 88.03 0.767 14.86 84.38
1.200 15.5 140.00 0.766 9.89 89.34
1.687 15.5 140.00 1.073 9.86 89.07
2.218 15.5 189.00 1.073 7.50 91.43
2.090 15.5 292.80 0.673 4.99 94.33
• Compressed Temperature: TC= 630 − 770 K
• Compressed Pressure: PC= 7 − 30 bar

n-Decane Autoignition
10-4
10-3
10-2
10-1
1.25 1.3 1.35 1.4 1.45 1.5 1.55 1.6
ExperimentCorrelation
e
xp (
T a/TC )
1000/TC (K-1)
1 = A PCn [XFuel]a [XO2]b exp( Ta /TC )
A = 3.21x10⁻¹¹
a = -1.93
Ta = 12198
Overall Ignition Delay
b = -1.25n = -1.14
10-4
10-3
10-2
10-1
100
101
102
1.3 1.35 1.4 1.45 1.5 1.55 1.6
ExperimentCorrelation
e
xp (
T a/TC )
1000/TC (K-1)
1= A PCn [XFuel]a [XO2]b exp( Ta /TC )
A = 2.69x10⁻¹⁶
a = -0.83
Ta = 22370
First-Stage Ignition Delay
b = -0.36n = -0.40
First stage delay has higher T sensitivity
Data limited to two-stage activity region

Autoignition Comparison (1)
10-7
10-6
10-5
10-4
10-3
10-2
10-1
100
0.6 0.8 1 1.2 1.4 1.6
Zhao et al.Bikas & PetersUtah SurrogateDagaut & Cathonnet
Glaude et al.Current Work: = 0.5, 14.3 barPfahl et al.: = 0.5, 13 barWestbrook et al.
Igni
tion
Del
ay (s
)
1000/TC (K-1)
Comparative Mechanism PerformanceSimulation Results
n-Decane / Air =0.5; PC=15 bar
Range ofAll CurrentExperiments

Autoignition Comparison (2)
N2/(N2+O2)=0.790
5
10
15
20
25
30
35
-5 0 5 10 15 20 25 30 35
Computational
Experimental
Pres
sure
(bar
)
Time (ms)
Nonreactive Trace
End of Compression
n-Decane/Oxidizer, =0.8, PC=14.3 bar, TC=659 K
Westbrook et al.(2009)
Bikas & Peters(2001)

Ignition Delay Sensitivity
-40 -20 0 20 40QOOH+O2=>O2QOOH
Ketohydroperoxide Production
Ketohydroperoxide Decomposition
R-H+X=>R+X-H
RO2 =>QOOH
ROOH=>RO+OH
RO2+RO2=>RO+RO+O2
QOOH=>cyclic ether+OH
QOOH=>Q+HO2
Sensitivity of Ignition Delay to Different Reaction ClassesMechanism of Westbrook et al. (2008)
Percent Sensitivity
n-Decane/Air=0.8PC=14.3 barTC=659 K
• In general, the sensitivity of a particular class of reactions tends be in the same direction, for both 1 and 2.
• A noticeable exception is the ketohydroperoxide decomposition step, which is also the most endothermic of all the reactions pertinent to the low temperature chemistry.
• Increasing rate constants for the ketohydroperoxide decomposition class would decrease 1and increase 2, while minimally affect the total ignition delay.

Jet Fuels Comparison (1)
4
6
8
10
12
14
16
18
20
-5 0 5 10 15 20 25 30 35
(a) Jet Fuel/Air, O/F=13, TC673 K, PC=7 bar
Pres
sure
(bar
)
Time(ms)
Jet-A JP-8S-8
15
20
25
30
35
40
-5 0 5 10 15 20
(b) Jet Fuel/Air, O/F=13, TC664 K, PC=15 bar
Pres
sure
(bar
)
Time(ms)
Jet-A JP-8S-8
• Two-stage activity for all three fuels with similar first-stage ∆P.
• Nearly similar first stage ignition delay for conventional jet fuels.– Longer second stage ignition delay for JP-8.
• Shortest ignition delay for S-8.

Jet Fuels Comparison (2)
• Two-stage activity suppressed at this higher temperature.
• Shortest ignition delay for S-8, followed by Jet-A and JP-8.
2
4
6
8
10
12
14
16
18
-10 0 10 20 30 40
(c) Jet Fuel/Air, O/F=13, TC714 K, PC=7 bar
Pres
sure
(bar
)
Time(ms)
Jet-A JP-8S-8

Jet Fuels Comparison (3)
100
101
1.4 1.44 1.48 1.52 1.56 1.6 1.64
JP-8S-8Jet-A
Firs
t Sta
ge Ig
nitio
n D
elay
(ms)
1000/TC (K-1)
(a) Jet Fuel/Air, O/F=13, PC=7 bar
101
102
1.08 1.16 1.24 1.32 1.4 1.48 1.56 1.64
JP-8S-8Jet-AO
vera
ll Ig
nitio
n D
elay
(ms)
1000/TC (K-1)
(b) Jet Fuel/Air, O/F=13, PC=7 bar
• First stage ignition delays for conventional jet fuels are similar.• The alternative jet fuel has a shorter first stage ignition delay.• Overall ignition delays for all three jet fuels differ: S-8<Jet-A<JP-8.

Jet Fuels Comparison (4)
100
101
1.4 1.44 1.48 1.52 1.56 1.6 1.64
JP-8S-8Jet-A
Firs
t Sta
ge Ig
nitio
n D
elay
(ms)
1000/TC (K-1)
(a) Jet Fuel/Air, O/F=13, PC=15 bar
100
101
1.28 1.32 1.36 1.4 1.44 1.48 1.52 1.56 1.6
JP-8S-8Jet-A
Ove
rall
Igni
tion
Del
ay (m
s)
1000/TC (K-1)
(b) Jet Fuel/Air, O/F=13, PC=15 bar
• Similar first stage delay for Jet-A and JP-8.
• S-8 shows highest reactivity.

Ignition Delay Correlations: Jet-A
10-4
10-3
10-2
10-1
1.3 1.35 1.4 1.45 1.5 1.55 1.6
Experiment
Correlation/ [(
P C)n
[fu
el] a
[O
2] b
]
1000/TC (K-1)
= 1+2 = A (PC)n [fuel]a [O2]b exp(Ta /TC)
A = 2.57x10⁻¹⁰
a = -2.28; b=-1.08; n=-1.39Ta = 11275
(a) Overall Ignition Delay
635 K < TC < 750 K
0.0076 < fuel < 0.0148
0.1020 < O2 < 0.316710-4
10-3
10-2
10-1
100
101
102
1.3 1.35 1.4 1.45 1.5 1.55 1.6
Experiment
Correlation 1/ [
(PC
)n [
fuel
] a [
O2]
b)
1000/TC (K-1)
1 = A (PC)n [fuel]a [O2]b exp(Ta /TC)
A = 1.37x10⁻¹²
a = -1.11; b= -0.39; n= -0.74Ta = 17132
(b) First Stage Ignition Delay
635 K < TC < 750 K
0.0076 < fuel < 0.0148
0.1020 < O2 < 0.3167
10-2
10-1
100
101
0.9 1 1.1 1.2 1.3 1.4
Experiment
Correlation/ [(
P C)n
[fu
el] a
]
1000/TC (K-1)
= 1+2 = A (PC)n [fuel]a exp(Ta /TC)
A = 4.00x10⁻⁵
a = -1.46; n= -2.13Ta = 9090
(c) Overall Ignition Delay
750 K < TC < 1060 K0.0027 < fuel < 0.0146
XO2 ~10.25%; XAr ~50%; Balance N 2

Autoignition Comparison: Jet-A vs. Neat Components (1)
Test Conditions
Fuel A/F Mass Ratio Diluent
iso-Octane 13.0 1.16 N2
n-Decane 13.0 1.15 N2
Methylcyclohexane 12.7 1.16 N2
Toluene 15.4 1.16 Ar
1,2,4-Trimethyl Benzene 15.8 1.16 Ar
m-, o-, p-Xylene 15.6 1.16 Ar
MURI Mixture Model (49.5/28.2/22.3 liq. vol% n-decane/iso-octane/toluene ) 13.0 1.12 N2
Aachen Surrogate(20/80 mass% 1,2,4-TMB/n-decane) 13.0 1.13 N2
Jet-A (04POSF4658) 13.0 1.12 N2
Diluent : Oxygen = 3.76 : 1

1
10
100
0.9 1 1.1 1.2 1.3 1.4 1.5 1.6 1.7
Total Ignition Delay for Neat Components (PC=7 bar)
Igni
tion
Del
ay (m
s)
1000/TC (1/K)
i-C8
1,2,4-TMB
n-C10
Toluene
MCH
1
10
100
0.9 1 1.1 1.2 1.3 1.4 1.5 1.6 1.7
Ignition Delay Bounds for Neat Components (PC=7 bar)
Igni
tion
Del
ay (m
s)
1000/TC (1/K)
Toluene
MCH
Jet-A
n-C10
Autoignition Comparison: Jet-A vs. Neat Components (2)
1
10
100
0.85 0.9 0.95 1 1.05 1.1 1.15 1.2 1.25
Ignition Delay for Xylene Isomers (PC=7 bar)
o-Xylene
p-xylene
m-xylene
Igni
tion
Del
ay (m
s)
1000/TC (1/K)

Autoignition Comparison: Surrogate Mixtures vs. Neat Components
1
10
100
0.9 1 1.1 1.2 1.3 1.4 1.5 1.6 1.7
Ignition Delays for MURI Mixture Model and its Constituents (PC = 7 bar)
Igni
tion
Del
ay (m
s)
1000/TC (1/K)
Toluene
n-C10
MURIMixture Model
i-C8
1
10
100
0.9 1 1.1 1.2 1.3 1.4 1.5 1.6 1.7
Ignition Delays for Aachen Surrogate and its Constituents (PC=7 bar)
Igni
tion
Del
ay (m
s)
1000/TC (1/K)
n-C10
1,2,4-TMBAachen Surrogate
• Surrogate mixtures inherit the traits of the neat constituents
– NTC trend from i-C8 in the current range for MURI mixture model

Autoignition Comparison: Jet-A vs. Binary Mixtures
• Fuel mixtures with similar CN, but different constituents, can display markedly different ignition delay times in the low-to-intermediate temperature range.
• While CN is a parameter, further refinement is required to reproduce the ignition characteristics of fully blended fuels.
100
101
102
0.9 1 1.1 1.2 1.3 1.4 1.5 1.6
JP-8, A/F=13, DCN~40Jet-A, A/F=13, DCN~45
Ove
rall
Igni
tion
Del
ay (m
s)
1000/TC (K-1)
PC=7 bar
=1.16C6H6:O2:Ar1.16:7.5:28.2
CN=0
=1.16n-Decane/Air
A/F=13CN=77
=1.15n-C10H22+iso-C8H18/Air
A/F=13CN=48
100
101
102
1.3 1.4 1.5 1.6 1.7
iso-Octaneiso-Octane +n-Decane (50.79 :49.21)n-Decane
Ove
rall
Igni
tion
Del
ay (m
s)
1000/TC (K-1)
PC=7 bar, ~1.16
n-C10H22
iso-C8H18
iso-C8H18
+ n-C10H22

Autoignition Comparison: Jet-A vs. Surrogate Mixtures
1
10
100
0.9 1 1.1 1.2 1.3 1.4 1.5 1.6 1.7
Ignition Delays of Jet-A and Surrogates (PC=7 bar)
Jet-AAachen SurrogateMURI Mixture Model
Igni
tion
Del
ay (m
s)
1000/TC (1/K)
• Both surrogates perform well in the pre-NTC low-T range• MURI mixture model appears to capture NTC, while the Aachen
surrogate does not.

Laminar Flame Speeds and Extinction Limitsof Preheated Fuel/Air Mixtures

Laminar Flame Speed Comparison
30
40
50
60
70
80
90
100
110
10 12 14 16 18 20 22
Comparative Laminar Flame SpeedsJet-A (400 K)Jet-A (470 K)S-8 (400 K)S-8 (470 K)n-Decane (400 K)n-Decane (470 K)
Lam
inar
Fla
me
Spee
d (c
m/s
)
Air-to-Fuel Mass Ratio

Laminar Flame Speeds: Jet-A vs. Aachen Surrogate
• Aachen kerosene surrogate performs well at stoichiometric conditions.
30
40
50
60
70
80
90
100
110
10 12 14 16 18 20 22
Jet-A/Air Mixtures
Tu=400K
Tu=450K
Tu=470K
Lam
inar
Fla
me
Spee
d (c
m/s
)
Air-to-Fuel Mass Ratio
---- Computational at 400 and 470K, Achen Kerosene Surrogates 30
40
50
60
70
80
90
100
110
0.6 0.8 1 1.2 1.4
Jet-A/Air Mixtures
Tu=400K
Tu=470K
Tu=450K
Equivalence Ratio,
Lam
inar
Fla
me
Spee
d (c
m/s)
----- Computational at 400 and 470K, Aachen Kerosene Surrogate

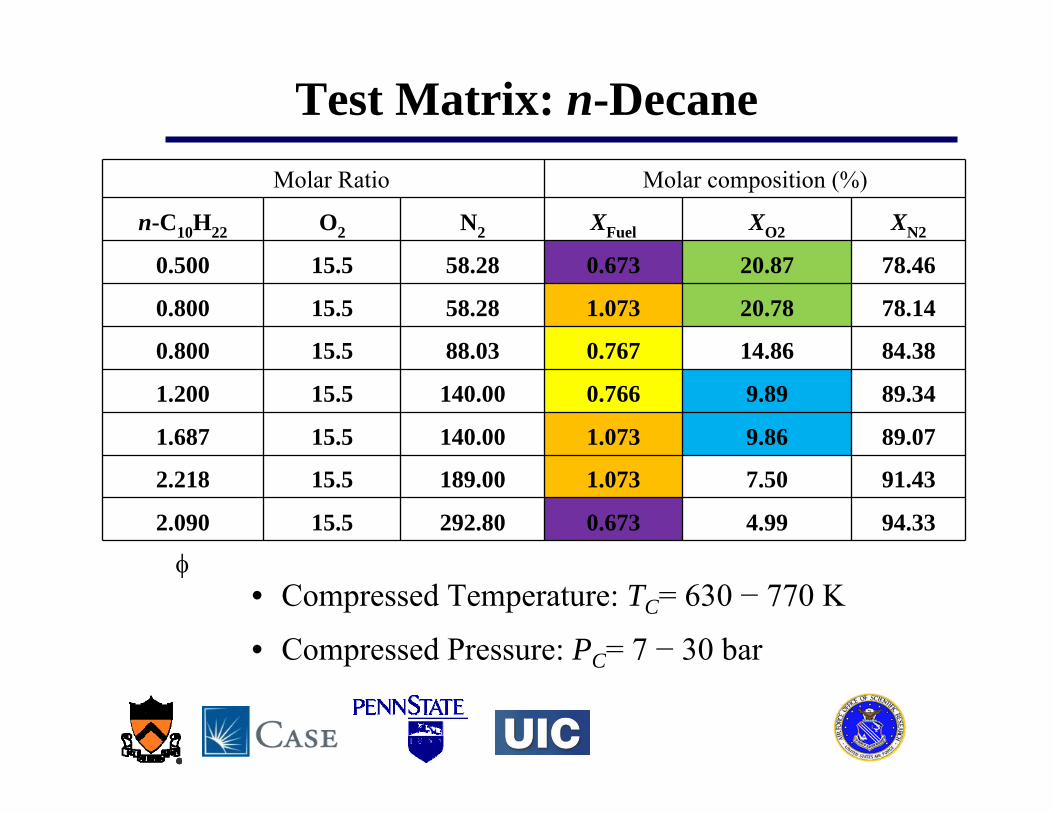
Extinction Limit Comparison
0
200
400
600
800
0.8 1 1.2 1.4 1.6
Experimental Extinction Stretch Rates
Jet-AS-8 n-Decanen-DodecaneEx
tinct
ion
Stre
tch
Rate
(s-1
)
Equivalence Ratio,
N2/(N2+O2) = 0.84Tu=400 K

Extinction Stretch Rates: Jet-A vs. Aachen Surrogate
• Qualitative trend is well captured• Significantly higher extinction stretch rates predicted
– Fair agreement at lowest equivalence ratio
1500
1550
1600
1650
1700
1750
1800
1850
200 400 600 800 1000Max
imum
Fla
meT
empe
ratu
re (K
)
Stretch Rate (s-1)
0.89
N2/(N2+O2)=0.84
Aachen Kerosene Surrogate/O2/N2 Mixtures, Tu=400 K
0
200
400
600
800
1000
1200
0.8 1 1.2 1.4 1.6
Jet Fuel/O2/N2, Tu=400 K
Jet-A, Experimental
Computational, Aachen Surrogate
Extin
ctio
n St
retc
h R
ate
(s-1
)
Equivalence Ratio,
N2/(N2+O2) = 0.84

Laminar Flame Speed: Neat Component (1)

Laminar Flame Speed: Neat Component (2)
Flame Speed Comparison:Linear Alkane > Cycloalkane > Branched Alkane ≈Aromatic
Extinction Stretch Rate: Neat Component

Future Work
• Acquire autoignition data of neat surrogate components.– n-dodecane, n-propylbenzene, 1,3,5-TMB, xylenes, etc.– Coordinated with Fred Dryer and Ken Brezinsky.
• Acquire autoignition data of surrogate mixtures and MURI mixture models.
– Comparison with Jet-A.– Coordinated with Fred Dryer.
• Conduct high-pressure flame measurements for neat surrogate components, binary fuel blends, and real jet fuels.
– Coordinated with Yiguang Ju.

Acknowledgements
• Tim Edwards of AFRL for jet fuel supplies.
• Fred Dryer and Marcos Chaos of Princeton,
Hai Wang and Xiaoqing You of USC, as well
as Ken Brezinsky and Soumya Gudiyella of
UIC for thermodynamic property calculations.
• Graduate Students: Xin Hui and Bryan Weber.