Embed Size (px)
Citation preview
1
Working Paper Series
Combining SSM and DEA: Evaluating the Basic Research Performance of the Chinese Academy of Sciences John Mingers Wenbin Liu Wei Meng Kent Business School
Kent Business School
Working Paper No.128
July 2006
ISSN 1748-7595 (Online)

2
Combining SSM and DEA: Evaluating the Basic Research Performance of the Chinese
Academy of Sciences
John Mingers, Wenbin Liu, Wei Meng
Kent Business School, University of Kent,
Canterbury CT7 2PE, UK
phone: 01227 824008, e-mail: [email protected]
V1.1, October 2005 Submitted to JORS
3
Combining SSM and DEA: Evaluating the Basic Research Performance of the Chinese
Academy of Science Abstract This paper reports on an innovative combination of hard and soft methods – soft systems methodology and data envelopment analysis – in a project evaluating the performance of the basic research institutes of the Chinese Academy of Science. Problems in defining and agreeing appropriate inputs and outputs for DEA led to the use of SSM as a way or producing a comprehensive and systemic database of performance indicators. The focus of the paper is on the use of SSM in terms of the clear and specific links within SSM to DEA, and the developments made to SSM to improve this connection. Keywords : Data envelopment analysis (DEA), education, performance evaluation, research, soft systems methodology (SSM)
Introduction
China has been making a substantial investment in basic scientific research over the last fifteen years (Meng et al., 2006). In 2001 that investment was $0.6 billion, five times that in 1990. This has had substantive results: in 2003 China was 6th in the world for publications listed in Science Citation Index (SCI) with 49,788 up from 24th in 1987. However, there is concern from both taxpayers and the scientific community as to the effectiveness of the investment particularly in terms of quality as measured. For example, by the number of world-class scientists, and the level of citations of Chinese papers. As Philip Campbell (editor-in-chief, Nature) pointed out despite major expenditure on science by the Chinese government, China is not yet fulfilling its scientific potential. This results not only in a low scientific profile on the world stage, but also in lost opportunities to make the most of what the rest of the world can offer, both scientifically and technologically (Campbell, 2004).
The largest research institution in China is the state controlled Chinese Academy of Sciences (CAS) (CAS, 2005). This was founded in 1949 to develop natural science and technology. At the end of 2003, it encompassed 116 science and technology enterprises including 89 research institutes, three universities and five libraries; and employed 43,800 people of whom 30,000 were scientists. Clearly a massive research organisation!
CAS is concerned to monitor the performance of its institutes and to ensure that the investment is used productively, and to this end has its own internal Research Evaluation Centre (REC). However, there was dissatisfaction from all sides at to the way in which the many evaluations were carried out and the effects they were having. One of the authors (Liu) was invited by the REC to investigate the use of data envelopment analysis (DEA) in assessing the efficiency of the institutions. The project began early in 2004 with Meng, who had ten years working experience at CAS, as a science and technology administrator. It was based at Kent Business School. However, problems soon emerged in trying to apply DEA as there was much disagreement by decision makers about what were appropriate measures of research performance, driven in part by changes of political concerns, and the relative weightings for the different institutes.
4
In 2004 Liu and Meng learnt about soft systems methodology (SSM) as a possible way of tackling such complex unstructured problems and mentioned it in a presentation within CAS. This generated much interest and the head of REC came to Kent to learn about SSM. At this stage Mingers joined the project to assist in using SSM as a precursor to the more detailed DEA modelling. This work was undertaken during 2005.
This paper is primarily concerned with the SSM aspects of the project and, in particular, with issues that arose in combining SSM with DEA. This necessitated some new developments within the root definition/conceptual modelling stages of SSM. Comment is also made about the more general question of combining hard and soft approaches together in the same project. After this theoretical discussion the project work itself will be described. The use of SSM was considered to be very successful although the project itself is still carrying on.
Theoretical and Methodological Issues
This section will begin by discussing the specific theoretical issues in linking SSM and DEA before considering the more general concerns about combining hard and soft.
At first sight SSM and DEA might seem to have little in common: one is a general, participative methodology for understanding and learning in situations characterised by significant differences in viewpoint and opinion; the other is a mathematical programming technique for estimating the relative efficiencies of operating units given reliable data on their inputs and outputs. However, in fact some of the core concepts within SSM are actually quite analogous with those of DEA.
Data Envelopment Analysis
DEA is based on the following (Cooper et al., 2000; Thanassoulis, 2001). Given:
• A set of n similar operational units (often called decision making units (DMUs)) e.g., bank branches or university departments.
• An agreed and measurable set of m inputs or resources, e.g., staff, money, equipment, students.
• An agreed and measurable set of s outputs or services, e.g., customers served, students educated, cars produced.
Then relative efficiency is the ratio of the weighted outputs to the weighted inputs. The main problem is how to choose the weights in a manner that is seen as fair by all the DMUs.
The weights, and the resulting efficiencies, can be found optimally using linear programming:

5
Where xij and yrj are the ith input and rth output of DMU j, and vi and ur are the corresponding weights.
This LP model determines the weights that maximise the efficiency of a particular DMU0. If virtual DMUs turn out to be as, or even more, efficient than DMU0 given its best weights then DMU0 cannot argue that the weights are unfair. The outputs from DEA provide a lot of valuable performance information in terms of best practice and possible targets for inefficient DMUs.
Soft Systems Methodology
Soft systems methodology (SSM) (Checkland, 1999; Checkland and Scholes, 1990) was suggested as a suitable approach for three reasons. First, as a general methodology it can take a systemic and structured view of the activities of an organization which is obviously necessary in order to evaluate its performance. Primary task (Checkland and Wilson, 1980) root definitions and conceptual models can be used to provide a comprehensive and consistent map of the activities necessary which can then be used to consider the actual outputs and inputs for each activity. Second, as a soft approach SSM is designed to accept and explore different viewpoints on a situation which was obviously the case here. Different views (Weltanschauungen in SSM terms) about the purpose of an institute, or of the evaluation, could be used to generate alternative sets of inputs and outputs.
Third, SSM actually has a very direct link to DEA through its concepts of Input-Transformation-Output, and monitoring and control through the 3 E’s – Efficacy, Efficiency, and Effectiveness (Checkland et al., 1990). This will be described in detail below.
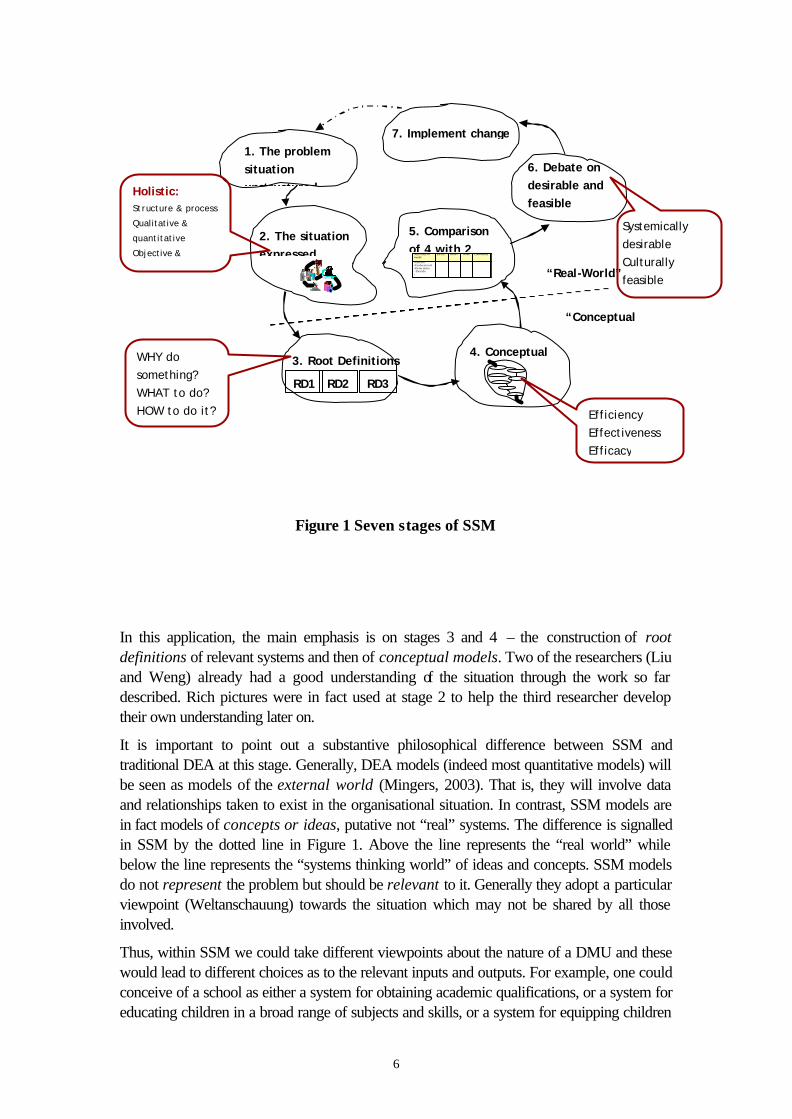
An overview of the traditional seven stages of the SSM methodology is shown in Figure 1.
mivsru
njxv
yu
xv
yuh
i
r
m
i
iji
s
r
rjr
m
iii
s
rrr
,...,2,1 ,0 ,...,2,1 ,0
,...,2,1 ,1 :subject to
:max
1
1
10
10
0
=≥=≥
=≤
∑
∑=
∑
∑
=
=
=
=
6
Figure 1 Seven stages of SSM
In this application, the main emphasis is on stages 3 and 4 – the construction of root definitions of relevant systems and then of conceptual models. Two of the researchers (Liu and Weng) already had a good understanding of the situation through the work so far described. Rich pictures were in fact used at stage 2 to help the third researcher develop their own understanding later on.
It is important to point out a substantive philosophical difference between SSM and traditional DEA at this stage. Generally, DEA models (indeed most quantitative models) will be seen as models of the external world (Mingers, 2003). That is, they will involve data and relationships taken to exist in the organisational situation. In contrast, SSM models are in fact models of concepts or ideas, putative not “real” systems. The difference is signalled in SSM by the dotted line in Figure 1. Above the line represents the “real world” while below the line represents the “systems thinking world” of ideas and concepts. SSM models do not represent the problem but should be relevant to it. Generally they adopt a particular viewpoint (Weltanschauung) towards the situation which may not be shared by all those involved.
Thus, within SSM we could take different viewpoints about the nature of a DMU and these would lead to different choices as to the relevant inputs and outputs. For example, one could conceive of a school as either a system for obtaining academic qualifications, or a system for educating children in a broad range of subjects and skills, or a system for equipping children
1. The problem situation unstructured
2. The situation expressed
3. Root Definitions
RD1 RD2 RD3
4. Conceptual
5. Comparison of 4 with 2
6. Debate on desirable and feasible changes
7. Implement change
“Real-World”
“Conceptual
Activities in model
Exist? How? Who? Comments
-Obtain -Understand -Determine –Decide -
Holistic: Structure & process
Qualitative &
quantitative
Objective &
intuitive
Systemically desirable Culturally feasible
Efficiency Effectiveness Efficacy
WHY do something? WHAT to do? HOW to do it?
7
to get jobs. Each different Weltanschauung would generate a different RD/CM and different output measures although of course there may be some commonalities.
The idea of combining together both hard and soft methods used to be a contentious issue but has become more common and accepted now. The main argument against was that the paradigms underlying such methods were themselves incommensurable and so the methods could not coherently be joined together. This incommensurability thesis was strengthened by Burrell and Morgan’s (Burrell and Morgan, 1979) depiction of paradigms within social and organizational theory. Since then, however, much work of a theoretical (Jackson, 2000; Midgley, 2000; Mingers and Gill, 1997; Mingers, 2006) and empirical nature (Munro and Mingers, 2002) has demonstrated that it is possible, and indeed beneficial, to combine methods together, and that it is routinely done by practitioners. Mingers (2000) has argued that the philosophical problems can be handled within what is known as critical realism.
Practically speaking, there are several generic ways in which hard and soft methods may be combined. There was considerable interest in combining SSM with hard information systems development methodologies (Stowell, 1995) and two approaches were identified – “grafting” or “embedding”. These were termed methodology combination and methodology enhancement in Mingers’ (1997) typology. With grafting, an SSM study is firstly carried out in order to produce clear and agreed objectives and these are then fed into a hard method. With embedding, the hard method is incorporated within SSM and treated according to SSM’s assumptions until such time as concrete systems design is taking place. Other approaches are multiparadigm multimethodology where parts of several methods may all be used together in a theoretically informed way, and coherent pluralism (Jackson, 2000) where several methodologies may be used, but each one is maintianed within its own paradigmatic framework.
In terms of the specific combination of DEA with soft methods we have found only two examples. Hogan et al (2003) were studying the use of technology consultants in implementing complex IT projects and wished to use DEA to evaluate their relative efficiency. As the area had been little researched before they used SSM as an exploratory tool to explore the implementation process. The model was used both to identify sets of inputs and outputs, and to generate hypotheses to be investigated. In the above terms this was a case of grafting as SSM was completed before DEA was started. The second example is Casu et al (2005) who combined DEA with group support methods in assessing the efficiency of university central support services. The problem here was in determining the boundaries of the unit, and thus its inputs and outputs. This was another grafting example where the group process work were carried out prior to the DEA analysis.
We can now re-consider the epistemological issue mentioned above. If the combination is by way of grafting then the problem does not really arise. SSM is carried out until agreement is reached over the boundaries or inputs/outputs. This is then used to inform a standard application of DEA used in an objectivist manner. However, with embedding the situation is different. Several RD/CMs could be developed, based on different Weltanschauungen, and each of these could lead to different DEA models. These models would not, at this stage, be regarded as models of the real-world but as models of concepts. They could potentially be used as part of the discussion and debate in the later stages of SSM. There could be several outcomes: one or more models could be accepted and used for detailed analysis and
8
recommendations; some of the models could be combined or synthesised; or it could be felt that sufficient learning had taken place and there was no need to take any of the models further.
We should also point out a distinction within SSM between “issue-based” and “primary task” root definitions (Checkland and Wilson, 1980). The former are developed to address a contentious issue from a particular perspective and so are expected to be one-sided and controversial. On the other hand a primary task model is intended to model the basic processes of an organisation in an uncontentious way so that they should be acceptable to all. They are therefore much closer to being a model of the situation.
Specific links between SSM and DEA
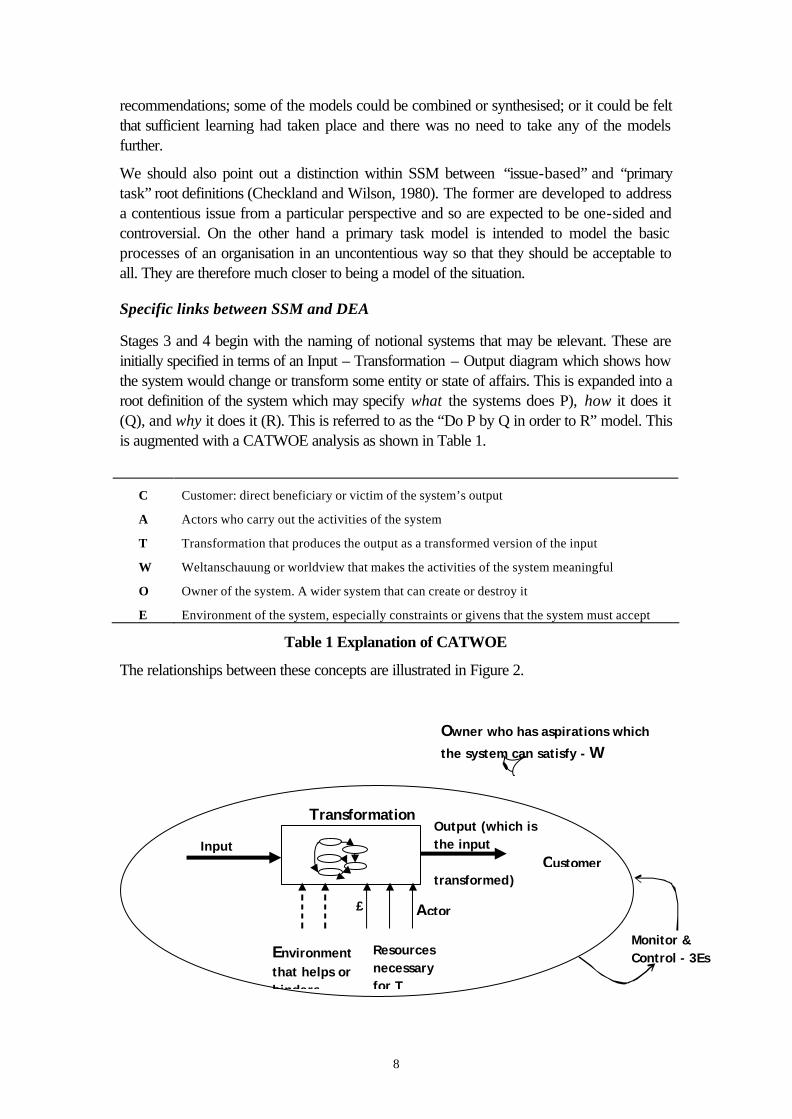
Stages 3 and 4 begin with the naming of notional systems that may be relevant. These are initially specified in terms of an Input – Transformation – Output diagram which shows how the system would change or transform some entity or state of affairs. This is expanded into a root definition of the system which may specify what the systems does P), how it does it (Q), and why it does it (R). This is referred to as the “Do P by Q in order to R” model. This is augmented with a CATWOE analysis as shown in Table 1.
C Customer: direct beneficiary or victim of the system’s output
A Actors who carry out the activities of the system
T Transformation that produces the output as a transformed version of the input
W Weltanschauung or worldview that makes the activities of the system meaningful
O Owner of the system. A wider system that can create or destroy it
E Environment of the system, especially constraints or givens that the system must accept
Table 1 Explanation of CATWOE
The relationships between these concepts are illustrated in Figure 2.
Owner who has aspirations which
the system can satisfy - W
Monitor & Control - 3Es
Resources necessary for T
Environment that helps or hinders
Input
Output (which is the input transformed)
Transformation
Customer
Actor £
9
Figure 2 Primary modelling concepts of SSM
Thus we think of a notional or conceptual system of activities that will transform an input into an output received by a customer. The output should satisfy the aspirations of the wider system that owns the system as expressed in the Weltanschauung. The activities will be performed by actors within an environment.
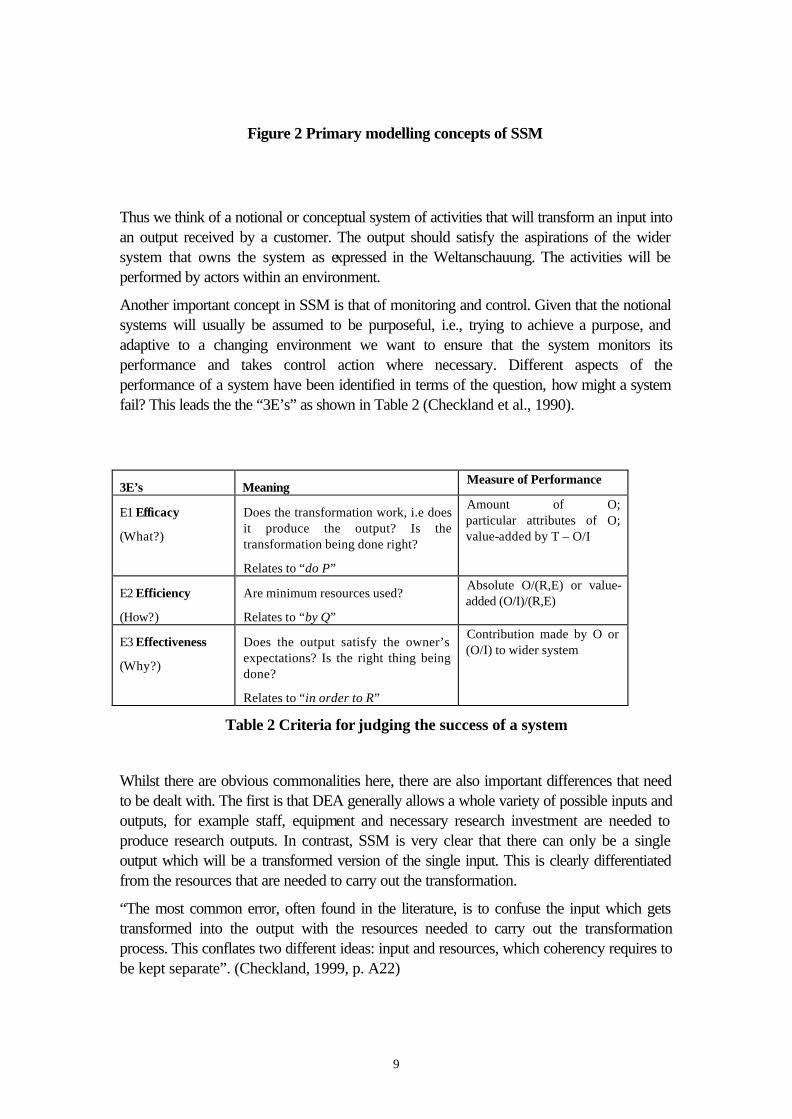
Another important concept in SSM is that of monitoring and control. Given that the notional systems will usually be assumed to be purposeful, i.e., trying to achieve a purpose, and adaptive to a changing environment we want to ensure that the system monitors its performance and takes control action where necessary. Different aspects of the performance of a system have been identified in terms of the question, how might a system fail? This leads the the “3E’s” as shown in Table 2 (Checkland et al., 1990).
3E’s Meaning Measure of Performance
E1 Efficacy
(What?)
Does the transformation work, i.e does it produce the output? Is the transformation being done right?
Relates to “do P”
Amount of O; particular attributes of O; value-added by T – O/I
E2 Efficiency
(How?)
Are minimum resources used?
Relates to “by Q”
Absolute O/(R,E) or value-added (O/I)/(R,E)
E3 Effectiveness
(Why?)
Does the output satisfy the owner’s expectations? Is the right thing being done?
Relates to “in order to R”
Contribution made by O or (O/I) to wider system
Table 2 Criteria for judging the success of a system
Whilst there are obvious commonalities here, there are also important differences that need to be dealt with. The first is that DEA generally allows a whole variety of possible inputs and outputs, for example staff, equipment and necessary research investment are needed to produce research outputs. In contrast, SSM is very clear that there can only be a single output which will be a transformed version of the single input. This is clearly differentiated from the resources that are needed to carry out the transformation.
“The most common error, often found in the literature, is to confuse the input which gets transformed into the output with the resources needed to carry out the transformation process. This conflates two different ideas: input and resources, which coherency requires to be kept separate”. (Checkland, 1999, p. A22)

10
We can illustrate this distinction with a school. From an SSM perspective legitimate transformations might be: ignorant students -> knowledgeable students; energetic teachers -> tired teachers; immature pupils -> mature pupils; but not: teachers, books, classrooms, computers and pupils -> qualifications.
Thus, when SSM talks about efficiency it means specifically the ratio of outputs to resources while DEA is less clear, mixing resources and inputs together. However, having made the distinction SSM then largely ignores the concept of resources concentrating instead on the input/transformation/output. This needs to be brought out to improve the fit with DEA. This led to the explicit incorporation of Resources in the basic concepts of SSM as shown in Figure 2. Such resources clearly include people, although these are already accounted for in CATWOE as the Actors. Another addition to the SSM model is recognition of conditions in the environment that may help or hinder the transformation. This is very common in DEA studies where, for example, a school may have a measure of local deprivation or poverty included as one of its uncontrolled inputs.
Another distinction that is clearer within SSM than DEA is the question of absolute versus value added outputs.
If we begin with E1, efficacy, and consider how it might be measured then there seem to be two distinctions. First, the amount of output produced, e.g., the number of students processed, against some characteristic or attribute of the output, e.g., student knowledge or competence as measured by results or qualifications. Second, whether the measure is absolute, independent of the input; or whether it relates to the value added by the transformation, in which case it would be some ratio of output to input (not to resources).
We can now move to E2, efficiency, which is the ratio of the system’s Output (i.e., E1) to the Resources used and any Environmental conditions helping or hindering the system. In terms of the DEA model, this would lead to consideration of whether the output should be value-added or not, and if so how this would be measured; and whether the output would be amount or the characteristics or indeed both. This is something that has not been much discussed in the DEA literature although Grosskopf et al (1999) use a combination of multiple regression and DEA to account for the value-added component. They wanted to evaluate the benefit of certain reforms within the Texas educational system and used thr residuals from a regression as a measure of value added which was then used within the DEA model. This work was extended by Brockett et al (2005) to consider both long term and short term effects.
Finally, it is interesting to consider E3, effectiveness. DEA is primarily concerned only with efficiency (and thereby efficacy) and not apparently with effectiveness. However, it seems at least potentially possible that it could be used here as well. Effectiveness is essentially the extent to which the system’s output contributes to the objectives of the wider system. If one could measure these wider objectives then one could look at the ratio of E3/E1 – i.e., the relative efficiency of different DMUs, with their different mix of outputs, contributing to the wider system; or E3/E2 – comparing the achievement of wider goals to use of resources.

11
Evaluating the basic research of the Chinese Academy of Sciences
The examples that follow are taken directly from working project documents and have not been tidied up so in some cases they are incomplete or may have mistakes and inconsistencies.
The Initial Situation The CAS was established on November 1, 1949. With its 55 years development, CAS has become the country’s supreme academic institution in science and technology. In 1998, the pilot project of the Knowledge Innovation Program (KIP) was launched in CAS. KIP is considered to be the forerunner, as well as an important component of, the construction of a national innovation system. Since then, the research income of CAS has increased rapidly from RMB4.94 billion in 1998 up to RMB9.78 billion in 2003, while more than 50% of funding was through external competition. Consequently, the outputs of CAS have also been increasing. For example, publications listed in SCI were up from 5,860 in 1998 to 12,060 in 2003. Meanwhile, the proportion of CAS SCI publications in the top 20 journals based on research field was up from 44% in 1998 to 53% in 2003. Evaluation of research institutes is a major part of the research evaluation system in CAS. From 1999 to 2001 the purposes of evaluation focused on goal achievement according to research contracts, and three key aspects contribution: fundamental, strategic and frontier research. In 2000, a questionnaire was used to evaluate the innovative culture construct. Comparing with evaluation issues before 1999, this stage of evaluation put more attention onto innovative research achievement. In 2002 three components, key innovative contribution, classified evaluation and basic quantitative measurement were aggregated into the evaluation system (CES 2002). At this stage, research institutes were classified into four categories based on their research characteristics: basic research, high-tech research, resources and environmental research, and others. In 2004, a comprehensive evaluation was been carried out mainly focused on improving research quality and research impact. Qualitative evaluation (peer review) acted as a major method instead of quantitative assessment (Li, 2005). The evaluation system of the research institutes in CAS has been adjusted to keep track of the changing research and development circumstance. However, there has been anxiety and criticism. Some questioned the reasonableness of weights for the quantitative evaluation indicators; some criticised the vague value judgement embedded in the complex evaluation system; some also pointed out that the evaluation system in 2002 was potentially biased to large institutes, as most indicators were in terms of absolute value. Meanwhile, although sustainability had been emphasised in the evaluation objectives one key factor, an efficiency analysis of research faculty, was poorly assessed. DEA has unique advantages to be able to evaluate the relative efficiency of DMUs without pre-decided weights and has become popular for evaluating not-for-profit institutions (Beasley, 1995; Abbort and Doucouliagos, 2003). These led to the involvement of Liu and Meng in discussing the CAS evaluation system. However, during the trials of DEA problems

12
soon emerged in trying to apply DEA as there was much disagreement by decision makers about what were appropriate indicators of research performance, driven in part by changes of political concerns, and the diversity of the different institutes. Although there are papers which discuss how to handle decision makers’ value judgement, and deal with multiple inputs and outputs, there is still a lack of theoretical support on how properly to select indicators as inputs or outputs.
The Development of SSM models
The initial idea of linking SSM to DEA was that it would follow the embedding model: several views of the role of CAS and its institutes would be generated and each would lead to a specific DEA model. However, this proved difficult practically, primarily because the researchers were in the UK and were not able to interact directly with members of CAS in order to surface and develop issues and viewpoints. Moreover, SSM was not generally known about within CAS. It was therefore decided to begin by developing a primary task model of a a CAS Institute and feeding this back to CAS personnel. This would both illustrate SSM for them and offer the opportunity to criticise and disagree with the basic model. Once a model could be agreed this would be used to construct a comprehensive database of efficiency indicators which would in turn provide data for the DEA trial.
Many different conceptualisations of a scientific institute were developed and a selection of initial root definitions is shown in Table 3. At this stage it was found difficult to choose between them, especially in the absence of CAS input (although as mentioned above Meng had worked at CAS).
RD1.1-1 A scientific discovery system to encourage research staff/group to discover and explore the nature of the universe and find rules governing the universe in order to publish and share its exploration in the world.
RD1.1-2 A hot topic chasing system to stimulate staff/group to chase hot topic scientific research in order to move up to leadership in specific research field.
RD1.1-3 A multidisciplinary research system to encourage staff to build cooperative relationships in order to aim at solving more complicated research problems.
RD1.2 A scientific communication system to encourage research staff to take active communications in related national and international academic society, in order to improve research impact and overseas research prospects.
RD1.3 A new research subject creating system to attract new scientists to create new research subject within budget.
RD2.1-1 A graduates’ education system to create a valid education system to ensure education quality, in order to educate high quality graduates.
RD2.2 A key state research project undertaking system to stimulate research staff to apply, undertake and execute research projects in order to get research funding, publish papers, promote research reputation and improve competition in the future. …
Table 3 Alternative root definitions of a CAS scientific institute.

13
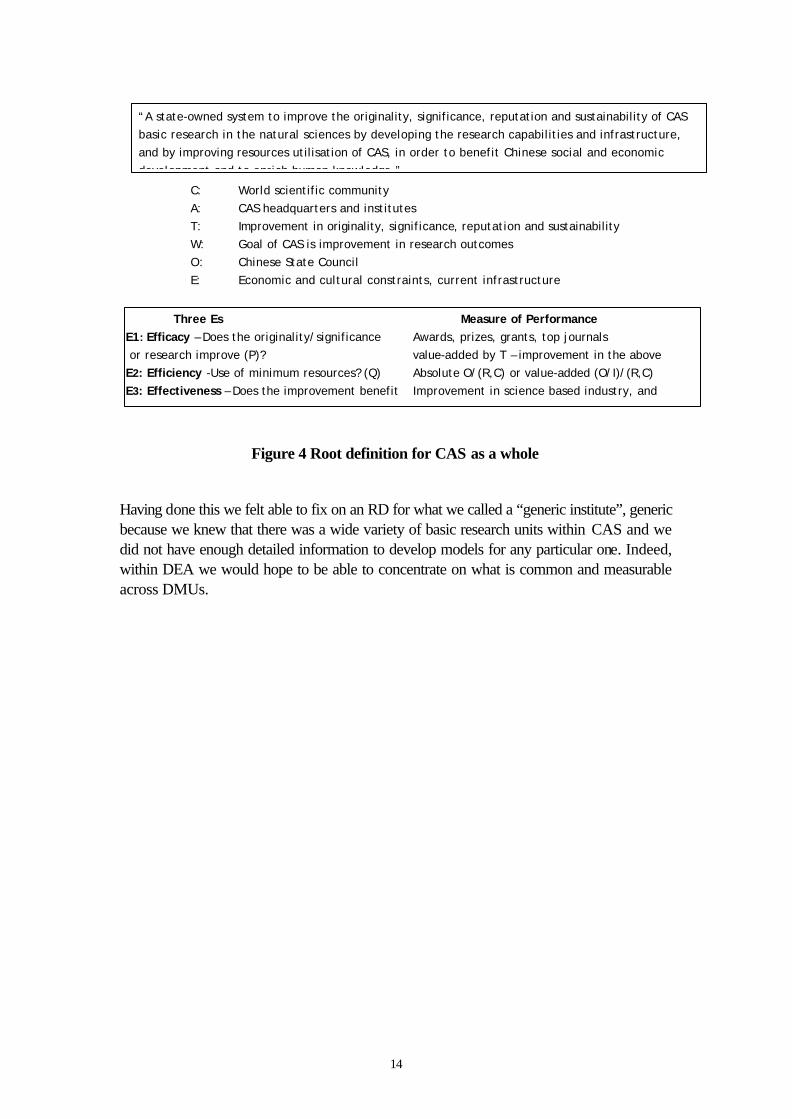
Whilst any of these may have been relevant and insightful, what we really wanted general, primary task model that would provide a sound basis for constructing an indicator database. It was felt that we needed to move up to consider the wider systems level of CAS as a whole. This is shown in Figure 3. This envisages CAS as a system of institutes that generate new contributions to knowledge. CAS has an evaluation system that measures the degree of originality, significance and sustainability and if necessary modifies the capabilities and infrastructure to improve these features (sustainability was added after the review of the model by CAS personnel). The Chinese state is shown as the owner observing CAS with its own objectives of socio-economic development as well as enriching knowledge.
Figure 3 CAS as a whole including the Evaluation System
From this a primary task root definition (RD) of CAS as a whole was developed as shown in Figure 4.
CAS structure of Institutes carrying out basic research
Knowledge New contributions to knowledge
Existing
1. Measure the level of significance, originality, sustainability 2. Decide on changes to capabilities
and infrastructure: -Institutes -Staff -Funding -Procedures -Incentives -Equipment
3.Implement changes
Chinese State Council
Socio-economic development, enrich knowledge
CAS Evaluation System
14
Figure 4 Root definition for CAS as a whole
Having done this we felt able to fix on an RD for what we called a “generic institute”, generic because we knew that there was a wide variety of basic research units within CAS and we did not have enough detailed information to develop models for any particular one. Indeed, within DEA we would hope to be able to concentrate on what is common and measurable across DMUs.
“A state-owned system to improve the originality, significance, reputation and sustainability of CAS basic research in the natural sciences by developing the research capabilities and infrastructure, and by improving resources utilisation of CAS, in order to benefit Chinese social and economic development and to enrich human knowledge.”
C: World scientific community A: CAS headquarters and institutes T: Improvement in originality, significance, reputation and sustainability W: Goal of CAS is improvement in research outcomes O: Chinese State Council E: Economic and cultural constraints, current infrastructure (R): Institutes, scientists, money, equipment
Three Es Measure of Performance E1: Efficacy – Does the originality/significance Awards, prizes, grants, top journals or research improve (P)? value-added by T – improvement in the above E2: Efficiency -Use of minimum resources? (Q) Absolute O/(R,C) or value-added (O/I)/(R,C) E3: Effectiveness – Does the improvement benefit Improvement in science based industry, and

15
Figure 5 Root Definition of a generic institute
Criteria for Effectivenes
Monitor
Control Criteria for Efficacy Efficiency
Monitor
Control
Operational
Control
Strategic Control
1. Identify potentially significant areas of discovery
2. Appreciate current resources, capabilities and
3. Decide which opportunities to pursue
4. Obtain necessary resources
5. Conduct research
6. Disseminate results through prestigious channels
7. Contribute to reputation, resources and sustainability
Three E’s Measure of performance E1: Efficacy – Does the world’s knowledge in Grants, publications… particular domains get enriched (P)? value-added by T E2: Efficiency - Use of minimum resources? (Q) Absolute O/(R,C) or value-added (O/I)/(R,C) E3: Effectiveness – Improvement in scientific Awards, prizes, attainments of leadership originality, significance, reputation and sustainability
A CAS-owned system to enrich the world’s knowledge in a particular scientific domain with original and significant research by identifying potential areas of discovery, developing the capabilities to undertake appropriate research, carrying out the research and disseminating it through prestigious channels in order to enhance the reputation, resources and sustainability of CAS and the Institute.
C: World scientific community in discipline, CAS (reputation) A: Institute personnel T: Generating significant new knowledge W: Role of an Institute within CAS is to generate significant new knowledge O: CAS E: CAS procedures, funding (R): Scientists, other staff, funding, equipment

16
Figures 6 Conceptual Model for a generic institute
The RD was developed in the PQR format together with CATWOER as shown in Figure 5. The basic transformation was the fairly obvious one of generating new knowledge but this was placed within the wider context of CAS’s concern with originality and significance as a way of improving China’s academic credentials. Again the 3E’s were developed fairly directly from the RD. The word “sustainability” was not in the original definition but was suggested by CAS when they reviewed them. Next a conceptual model was developed (Figure 6) incorporating a particular view about how significant and sustainable research was to be carried out.
At this point we considered moving into a DEA model but it became clear that there was not sufficient detail within the measures of performance to be able to properly specifiy a set of indicators to be developed. It was therefore necessary to expand the initial CM into further levels of resolution. This was done in a systemic way by taking each activity as a transformation and modelling it with its own RD, CM and 3E’s. This resulted in a 2nd level model with 39 activities. Where it was felt necessary, some activities were expanded to a 3rd and 4th level.
We cannot include all these within this paper but by way of illustration we show the RD/CM for Activity 1 (Figures 7a and 7b), and for Activity 1.1 (Figures 8a and 8b) and for Activity 1.1.3 (Figures 9a and 9b). As can bee seen, it is only when one gets down to this level of detail that one can properly specify a wide range of potential measures of performance.
Figure 7a RD for activity 1 “Identify areas of discovery”
RD1 A system to identify research opportunities for institute X that are significant and original bearing in mind the resources and capabilities needed, by effective external scanning and by improving internal discussion and communication in order to contribute to decide which opportunities to pursue which contribute to enhance reputation, resources and sustainability of the Institute.
Efficacy: Are significant and original opportunities identified? Efficiency: O/R, Effectiveness: does it enhance research reputation and significant of institute?
Areas of possible research in related disciplines
Areas of significance identified
Resources: Funding, hardware investments, staff
Research levels Research reputation CAS procedure

17
Figure 7b CM for activity 1
Figure 8a RD for activity 1.1 “Scan the external environment”
1.1 Scan the external environment for research opportunities
1.2 consider current resources and capabilities
1.3 Encourage discussion and communication within and among institutes
1.4 decide on those which are potentially possible
1.5 specify extra requirements for potentially possibilities
RD1.1 A system to stimulate staff to search potential significant scientific discovery externally by providing necessary resources and encouragement in order to get sufficient information to perceive potential areas of discovery.
Resources: Investment of hardware (information system) Funding and time
culture
Needs to search outside Needs met
E1: 1.1.1 satisfaction assessment of current information system, 1.1.2 funding to support necessary activities, 1.1.2 facilities utilization, 1.1.3 new academic organization position, 1.1.3 number of conference attending, 1.1.3 number of organized conferences, 1.1.3number of academic visitors, 1.1.3 number of presentations, 1.1.5 reports or proposals list potential significant scientific opportunities
E2: O/R E3: does stimulate system work?
18
Figure 8b CM for activity 1.1
Figure 9a RD for activity 1.1.3 “Encourage staff to undertake activities”
1.1.1 provide efficient information system ( assess journals, websites)
1.1.2 provide necessary resources
1.1.3 encourage to undertake necessary activities
1.1.4 perceive potential significant scientific topics
1.1.5 Collate and disseminate potential significant scientific opportunities
RD1.1.3 A system to encourage staff to undertake the necessary activities by allocating necessary funding and facilities to support staff to undertake necessary activities, and by creating reward system in order to identify potentially significant areas of discovery.
Needs to search outside Needs met
E1: 1.1.3.1 funding to support necessary activities, 1.1.3.2 facilities utilisation, 1.1.3.3 whether we have this reward system, 1.1.3.4 new acedemic organisation position, 1.1.3.4 number of conference
attending, 1.1.3.4 number of organised conferences, 1.1.3.4 number of academic visitors, 1.1.3.4 number of presentations,
1.1.3.5 E2: O/R E3: does it contribute potentially significant areas of discovery?
Research reputation
Resources: Funding, facilities, time
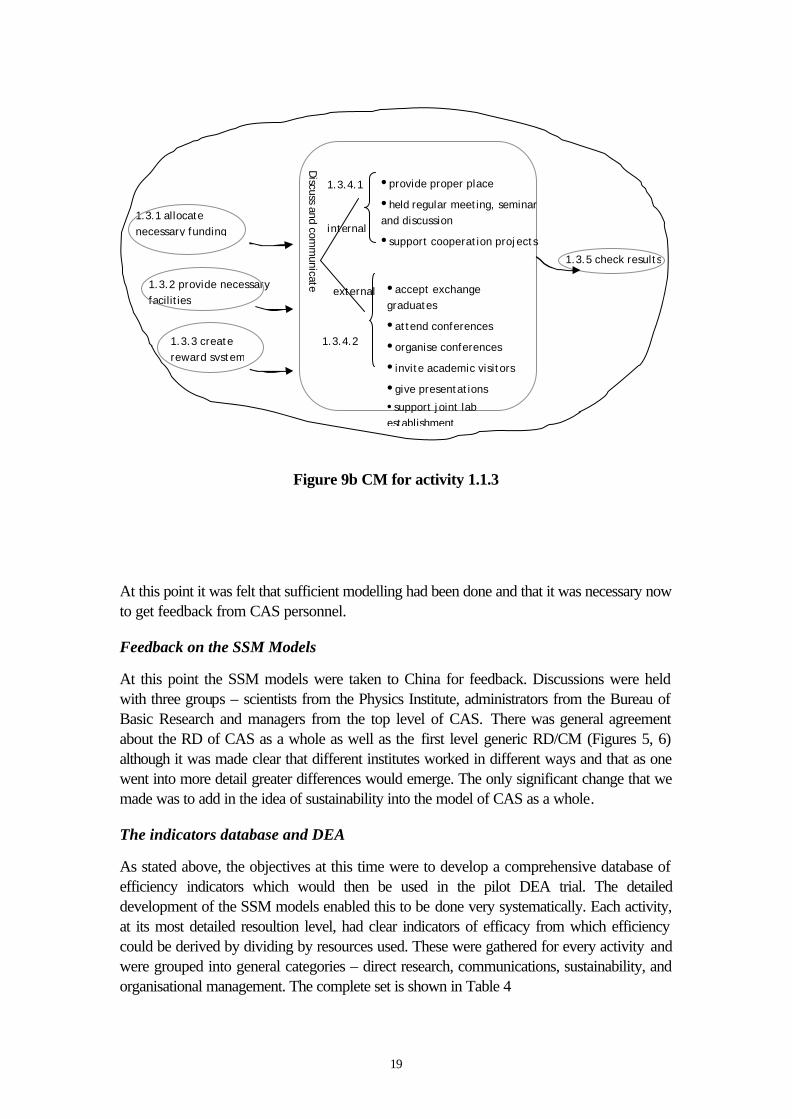
19
Figure 9b CM for activity 1.1.3
At this point it was felt that sufficient modelling had been done and that it was necessary now to get feedback from CAS personnel.
Feedback on the SSM Models
At this point the SSM models were taken to China for feedback. Discussions were held with three groups – scientists from the Physics Institute, administrators from the Bureau of Basic Research and managers from the top level of CAS. There was general agreement about the RD of CAS as a whole as well as the first level generic RD/CM (Figures 5, 6) although it was made clear that different institutes worked in different ways and that as one went into more detail greater differences would emerge. The only significant change that we made was to add in the idea of sustainability into the model of CAS as a whole.
The indicators database and DEA
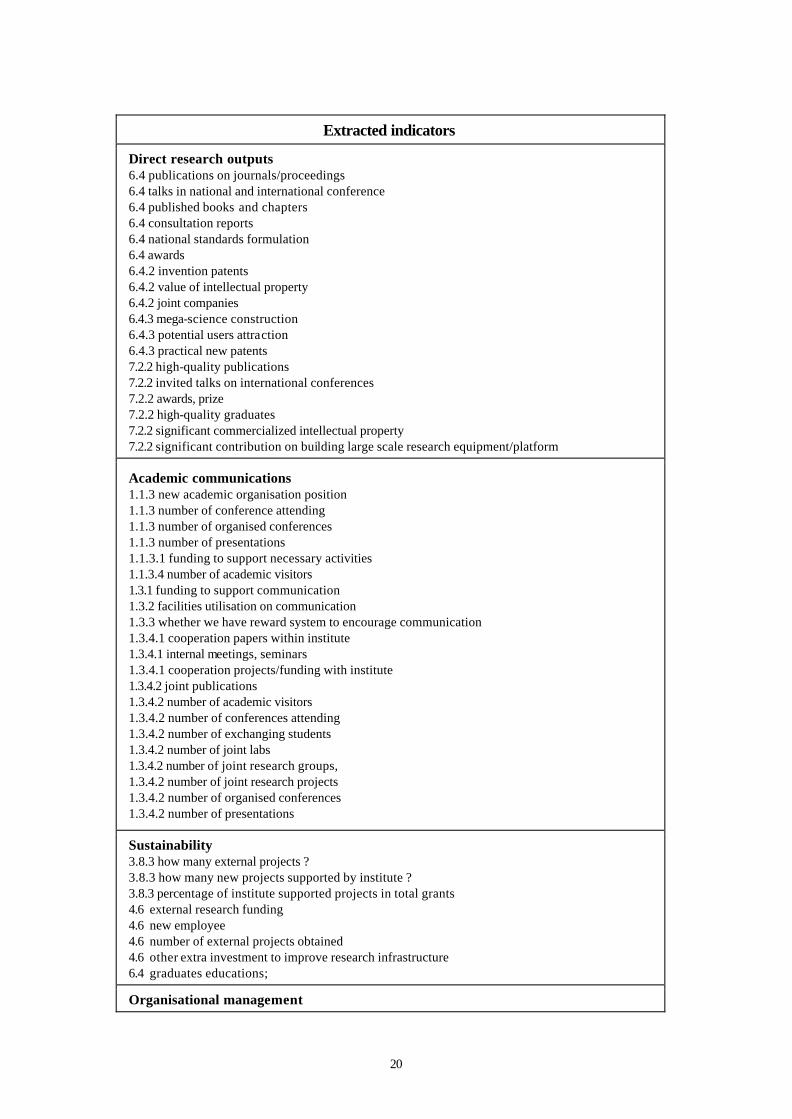
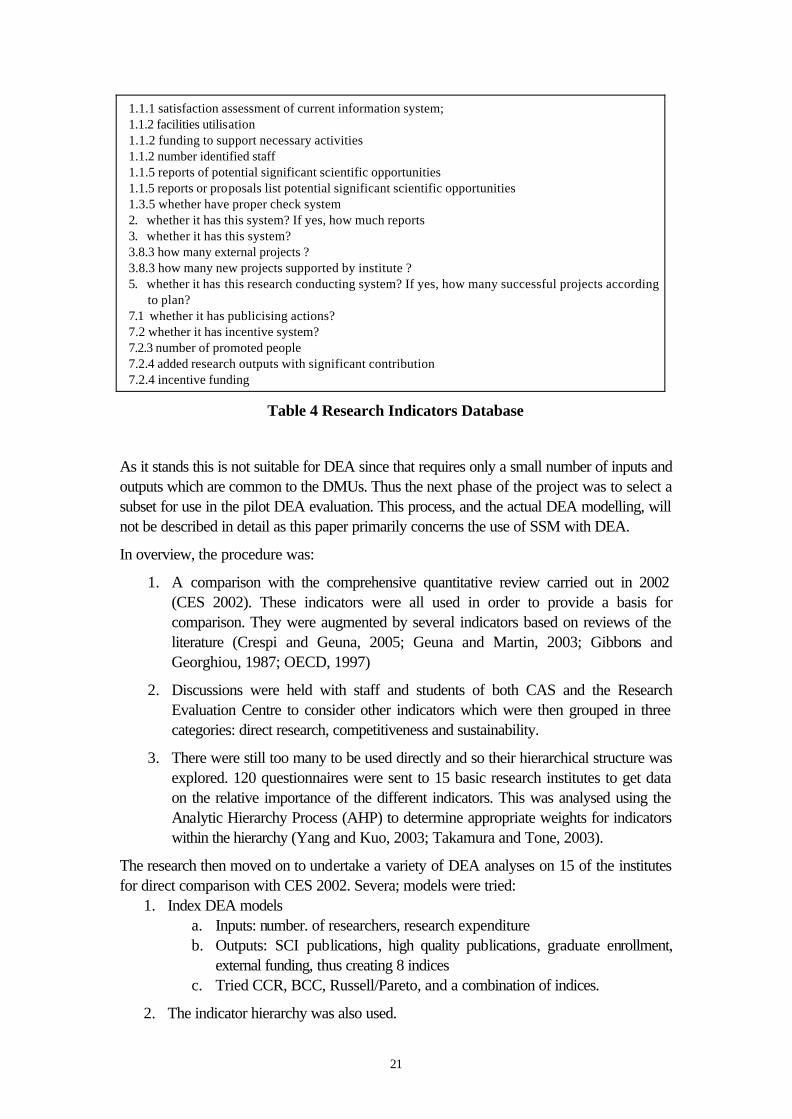
As stated above, the objectives at this time were to develop a comprehensive database of efficiency indicators which would then be used in the pilot DEA trial. The detailed development of the SSM models enabled this to be done very systematically. Each activity, at its most detailed resoultion level, had clear indicators of efficacy from which efficiency could be derived by dividing by resources used. These were gathered for every activity and were grouped into general categories – direct research, communications, sustainability, and organisational management. The complete set is shown in Table 4
1.3.1 allocate necessary funding
1.3.2 provide necessary facilities
1.3.3 create reward system
Discuss and comm
unicate
internal
external •accept exchange graduates
•attend conferences
•organise conferences
•invite academic visitors
•give presentations
•support joint lab establishment
1.3.4.1
1.3.4.2
•provide proper place
•held regular meeting, seminar and discussion
•support cooperation projects 1.3.5 check results
20
Extracted indicators
Direct research outputs 6.4 publications on journals/proceedings 6.4 talks in national and international conference 6.4 published books and chapters 6.4 consultation reports 6.4 national standards formulation 6.4 awards 6.4.2 invention patents 6.4.2 value of intellectual property 6.4.2 joint companies 6.4.3 mega-science construction 6.4.3 potential users attraction 6.4.3 practical new patents 7.2.2 high-quality publications 7.2.2 invited talks on international conferences 7.2.2 awards, prize 7.2.2 high-quality graduates 7.2.2 significant commercialized intellectual property 7.2.2 significant contribution on building large scale research equipment/platform
Academic communications 1.1.3 new academic organisation position 1.1.3 number of conference attending 1.1.3 number of organised conferences 1.1.3 number of presentations 1.1.3.1 funding to support necessary activities 1.1.3.4 number of academic visitors 1.3.1 funding to support communication 1.3.2 facilities utilisation on communication 1.3.3 whether we have reward system to encourage communication 1.3.4.1 cooperation papers within institute 1.3.4.1 internal meetings, seminars 1.3.4.1 cooperation projects/funding with institute 1.3.4.2 joint publications 1.3.4.2 number of academic visitors 1.3.4.2 number of conferences attending 1.3.4.2 number of exchanging students 1.3.4.2 number of joint labs 1.3.4.2 number of joint research groups, 1.3.4.2 number of joint research projects 1.3.4.2 number of organised conferences 1.3.4.2 number of presentations
Sustainability 3.8.3 how many external projects ? 3.8.3 how many new projects supported by institute ? 3.8.3 percentage of institute supported projects in total grants 4.6 external research funding 4.6 new employee 4.6 number of external projects obtained 4.6 other extra investment to improve research infrastructure 6.4 graduates educations;
Organisational management
21
1.1.1 satisfaction assessment of current information system; 1.1.2 facilities utilisation 1.1.2 funding to support necessary activities 1.1.2 number identified staff 1.1.5 reports of potential significant scientific opportunities 1.1.5 reports or proposals list potential significant scientific opportunities 1.3.5 whether have proper check system 2. whether it has this system? If yes, how much reports 3. whether it has this system? 3.8.3 how many external projects ? 3.8.3 how many new projects supported by institute ? 5. whether it has this research conducting system? If yes, how many successful projects according
to plan? 7.1 whether it has publicising actions? 7.2 whether it has incentive system? 7.2.3 number of promoted people 7.2.4 added research outputs with significant contribution 7.2.4 incentive funding
Table 4 Research Indicators Database
As it stands this is not suitable for DEA since that requires only a small number of inputs and outputs which are common to the DMUs. Thus the next phase of the project was to select a subset for use in the pilot DEA evaluation. This process, and the actual DEA modelling, will not be described in detail as this paper primarily concerns the use of SSM with DEA.
In overview, the procedure was:
1. A comparison with the comprehensive quantitative review carried out in 2002 (CES 2002). These indicators were all used in order to provide a basis for comparison. They were augmented by several indicators based on reviews of the literature (Crespi and Geuna, 2005; Geuna and Martin, 2003; Gibbons and Georghiou, 1987; OECD, 1997)
2. Discussions were held with staff and students of both CAS and the Research Evaluation Centre to consider other indicators which were then grouped in three categories: direct research, competitiveness and sustainability.
3. There were still too many to be used directly and so their hierarchical structure was explored. 120 questionnaires were sent to 15 basic research institutes to get data on the relative importance of the different indicators. This was analysed using the Analytic Hierarchy Process (AHP) to determine appropriate weights for indicators within the hierarchy (Yang and Kuo, 2003; Takamura and Tone, 2003).
The research then moved on to undertake a variety of DEA analyses on 15 of the institutes for direct comparison with CES 2002. Severa; models were tried:
1. Index DEA models a. Inputs: number. of researchers, research expenditure b. Outputs: SCI publications, high quality publications, graduate enrollment,
external funding, thus creating 8 indices c. Tried CCR, BCC, Russell/Pareto, and a combination of indices.
2. The indicator hierarchy was also used.
22
a. Output indicators were aggregated (Korhonen et al., 2001) so there were three outputs: direct research, competitiveness, and sustainability.
b. Multi-level DEA was used to maintain the structure of the indicators (Takamura and Tone, 2003). This results in non-linear models.
In brief, the conclusions were firstly, that the index DEA results were quite consistent with the results from the CES 2002 evaluation thus providing a degree of confidence in using DEA for evaluation of CAS . Secondly, that in order to be able to employ more indicators within the analysis multi-level DEA can be used and this improves the discrimination between DMUs.
Conclusions
This paper has shown that SSM can be successfully and effectively combined with DEA and plays a useful role in determining, in a comprehensive and systemic way, possible performance indicators in evaluating DMUs, in this case research institutes. Specific links between SSM and DEA, i.e., input-transformation-output and the 3Es, have been demonstrated and some developments have been made to SSM to enhance the connection. The combined use of DEA and SSM has provided an effective evaluation system for the research institutes of the Chinese Academy of Sciences and could potentially be applied to other systems of higher education and research.
There is still a need for further research application in the following areas:
• Develop SSM in terms of input/resources distinction and the value-added vs. absolute outputs distinction
• In combination with DEA, using several SSM models each representing different viewpoints about the nature and purpose of the operational unit under consideration, for example different views on the type of education a school should provide.
• Developing better ways of moving from the specification of a wide range of possible performance indicators to the smaller subset to be used within the DEA modelling.
• Within DEA, investigate the difference between value-added output measures and absolute output measures both in terms of how to modelling and the effect on the efficiency results.
• Also within DEA, consider the difference between efficacy and effectiveness. Should DEA consider two levels of efficiency, operational efficiency in terms of the direct outputs of the process (efficacy/resources), and strategic efficiency in terms of the achievements of the objectives of the wider system (effectiveness/resources).
References

23
Abbort, M. and Doucouliagos, C. (2003). The efficiency of Australian universities: a data envelopment analysis. Economics of Education Review 22: 89-97.
Beasley, J. (1995). Determining teaching and research efficiencies. Journal of the Operational Research Society 46: 441-452.
Brockett, P., Cooper, W., Lasdon, L. and Parker, B. (2005). A note extending Grosskopf, Hayes, Taylor and Weber "Anticipating the consequences of school reforms: A new use of DEA". Socio-Economic Planning Sciences 39: 351-359.
Burrell, G. and Morgan, G. (1979). Sociological Paradigms and Organisational Analysis. Heinemann: London.
Campbell, P. (2004). Messages to China from the west. Nature 428: 203.
CAS (2005). Chinese Academy of Sciences, http://english.cas.cn/Eng2003/page/home.asp.
Casu, B., Shaw, D. and Thanassoulis, E. (2005). Using a group support system to aid input-output identification in DEA. J. Operational Research Society 56: 1363-1372.
Checkland, P. (1999). Systems Thinking, Systems Practice: Includes a 30-Year Retrospective. Wiley: Chichester.
Checkland, P., Forbes, P. and Martin, S. (1990). Techniques in soft systems practice part 3: monitoring and control in conceptual models and evaluation studies. J. Applied Systems Analysis 17: 29-37.
Checkland, P. and Scholes, J. (1990). Soft Systems Methodology in Action. Wiley: Chichester.
Checkland, P. and Wilson, B. (1980). 'Primary task' and 'issue-based' root definitions in systems studies. J. Applied Systems Analysis 7: 51-55.
Cooper, W., Seiford, L., Kaoru, T., and Publishers, K. A. (2000). Data Envelopment Analysis. Kluwer: New York.
Crespi, G. and Geuna, A. (2005). Modelling and measuring scientific production:results for a panel of OECD countries. SEWPS 133, SPRU, Brighton.
Geuna, A. and Martin, B. (2003). University Research Evaluation and Funding: An International Comparison Minerva 41: 277-304.
Gibbons, M. and Georghiou, L. (1987). Evaluation of research. A selection of current practices. OECD, Paris.
Grosskopf, S., Hayes, K., Taylor, L. and Weber, W. (1999). Anticipating the consequences of school reform: A new use of DEA. Management Science 45: 608-620.
Hogan, P., Jaska, P. and Raja, M. (2003). Combining soft systems methodology techniques (SSM) and data envelopment analysis in an exploratory analysis of the use of technology consultants for IS implementation. Int. J. Computers, Systems, and Signals 4: 5-21.
24
Jackson, M. (2000). Systems Approaches to Management. Kluwer Academic: Dordrecht.
Korhonen, P., Tainio, R. and Wallenius, J. (2001). Value efficiency analysis of academic research European Journal of Operational Research 130: 121-132.
Li, X. (2005). Practice and thoughts on performance evaluation in China’s state-run institutes of scientific research. Bulletin of Chinese Academy of Sciences 20: 395-398.
Meng, W., Liu, W. and Hu, Z. (2006). Efficiency evaluation of basic research in China. Scientometrics 69: forthcoming.
Midgley, G. (2000). Systemic Intervention: Philosophy, Methodology, and Practice. Kluwer.Plenum: New York.
Mingers, J. (1997). Multi-Paradigm Multimethodology. In Mingers, J. and Gill, A. (Eds), Multimethodology: Theory and Practice of Combining Management Science Methodologies. Wiley, Chichester, pp. 1-20.
Mingers, J. (2000). The contribution of critical realism as an underpinning philosophy for OR/MS and systems. Journal of the Operational Research Society 51: 1256-1270.
Mingers, J. (2003). A classification of the philosophical assumptions of management science methods. Journal of the Operational Research Society 54: 559-570.
Mingers, J. (2006). Realising Systems Thinking: Knowledge and Action in Management Science. Springer: New York.
Mingers, J. and Gill, A. (Eds) (1997). Multimethodology: Theory and Practice of Combining Management Science Methodologies. Wiley: Chichester.
Munro, I. and Mingers, J. (2002). The use of multimethodology in practice - results of a survey of practitioners. Journal of the Operational Research Society 59: 369-378.
OECD (1997). The evaluation of scientific research: selected experiences. OCDE/GD(97)194, OECD, Paris.
Stowell, F. (Ed.) (1995). Information Systems Provision: the Contribution of Soft Systems Methodology. McGraw Hill: London.
Takamura, Y. and Tone, K. (2003). A comparative site evaluation study for relocating Japanese government agencies out of Tokyo. Socio-Economic Planning Sciences 37: 85-102.
Thanassoulis, E. (2001). Introduction to the Theory and Application of Data Envelopment Analysis. Kluwer: New York.
Yang, T. and Kuo, C. (2003). A hierarchical AHP/DEA methodology for the facilities layout design problem. European Journal of Operational Research 147: 128-136.

25

26
http://www.kent.ac.uk/kbs/research-information/index.htm