Embed Size (px)
Citation preview
Combined Heat and Power (CHP) Policy Review for the Kingdom of Saudi Arabia
Volume I: Final Report
PREPARED FOR
The Electricity and Co-generation Regulatory Authority
PREPARED BY The Brattle Group Navigant Consulting EcoSolutions Pierce Atwood LLP
May 2015

This report was prepared for the Electricity and Co-Generation Regulatory Authority. All results
and any errors are the responsibility of the authors and do not represent the opinion of The
Brattle Group, Inc. or its clients.
Acknowledgement: We acknowledge the valuable contributions of many individuals to this
report and to the underlying analysis, including members of The Brattle Group for peer review.
Copyright © 2015 The Brattle Group, Inc.
Authors:
The Brattle Group
Jurgen Weiss
Ahmad Faruqui
Ryan Hledik
Neil Lessem
Navigant Consulting
Greg Wikler
Surya Swamy
Keith Downes
Jon Strahl
EcoSolutions
Amjad Alkam
Pierce Atwood LLP
John Gulliver
i | brattle.com
Table of Contents
I. Executive Summary ..................................................................................................................... 1
II. Introduction ............................................................................................................................... 10
III. The Technical Assessment ........................................................................................................ 11
A. CHP Overview ................................................................................................................. 12
B. Primary Research ............................................................................................................. 13
1. Industrial Sector Primary Research ....................................................................... 14
2. Commercial Sector Primary Research ................................................................... 15
C. The CHP Performance Database ..................................................................................... 17
D. Findings of Technical Assessment ................................................................................... 18
IV. Economic and Market Assessment ........................................................................................... 20
A. The Modeling Framework ............................................................................................... 21
B. Establishing Steam and Waste Heat Demand in the KSA ............................................. 25
1. Methodology – Industrial Sector ........................................................................... 25
2. Methodology – Commercial Sector ....................................................................... 26
3. Steam and Waste Heat Demand Projections ......................................................... 27
C. Technical Potential .......................................................................................................... 29
D. Economic Potential .......................................................................................................... 31
E. Market Potential .............................................................................................................. 36
F. Summary of Conclusions from Economic/Market Potential Analysis .......................... 41
V. Barriers Assessment ................................................................................................................... 43
A. International Barriers Assessment .................................................................................. 43
1. Economic and Financial Barriers ........................................................................... 43
2. Regulatory Barriers ................................................................................................. 46
3. Informational/Behavioral Barriers ......................................................................... 47
B. Specific CHP Barriers in the KSA ................................................................................... 48
C. Conclusions from Barriers Assessment ........................................................................... 49
VI. Policy Recommendations .......................................................................................................... 51
A. Appropriate Scope of Policy Given Economic/Market Potential .................................. 51
B. International Policy Options ........................................................................................... 52
C. Policy Recommendations in the Broader Context of Energy Sector Reform ............... 57
D. Specific Policy Recommendations .................................................................................. 61

1 | brattle.com
I. Executive Summary
Background
The Brattle Group and its partners, Navigant Consulting, EcoSolutions and Pierce Atwood LLP,
were retained by the Electricity Cogeneration and Regulatory Authority (ECRA) to assess the
technical and economic potential for combined heat and power (CHP) applications in the
Kingdom of Saudi Arabia (KSA) between now and 2040. We were also asked to assess what
barriers exist to enhanced deployment of CHP in the KSA and what policy solutions might be
pursued to overcome these barriers.
This report summarizes our findings. It is based on the application of a number of approaches
including desk research, numerous meetings in the KSA with ECRA, the National Team
responsible for the development of a uniform long-term energy plan for the KSA (“National
Team”), and multiple stakeholders, in-person interviews and surveys of potential CHP clients as
well as stakeholders, and the application of economic-engineering models.1
CHP is widely recognized as a means of increasing the overall efficiency of an energy system by
taking advantage of waste heat/steam from power generation to provide inputs to other processes
such as the provision of process steam, which, absent CHP, would have to be procured using fuel
and dedicated boilers (topping cycle), or to use the waste steam from industrial processes to
generate electricity (bottoming cycle).
The value of increasing energy efficiency increases with the cost of producing usable energy such
as electricity or process steam, where the cost can be understood as either the private or societal
cost. Private (or participant) costs may differ from societal costs because prices charged for
energy to participants may not reflect the full costs to society and/or because societal costs don’t
fully reflect all relevant costs, in particular those associated with potential externalities such as
greenhouse gases.
Consequently, efforts to increase the use of CHP are particularly prominent in countries with
significant steam demand, relatively high energy production costs and/or ambitious greenhouse
gas reduction targets such as Northwestern Europe (Denmark, Germany), the United States,
Canada, and Kazakhstan, where waste heat from power generation is used for district heating.
Given the KSA’s climate, there is not much demand for district heating but a case could
potentially be made for the use of CHP for district cooling.
1 The full National Team includes ECRA, the Ministry of Petroleum, Saudi Aramco, the Saline Water
Conversion Company (SWCC), the National Water Company (NWC), the Saudi Electricity
Corporation (SEC) and the Ministry of Finance
2 | brattle.com
A Review of the Technical Opportunities
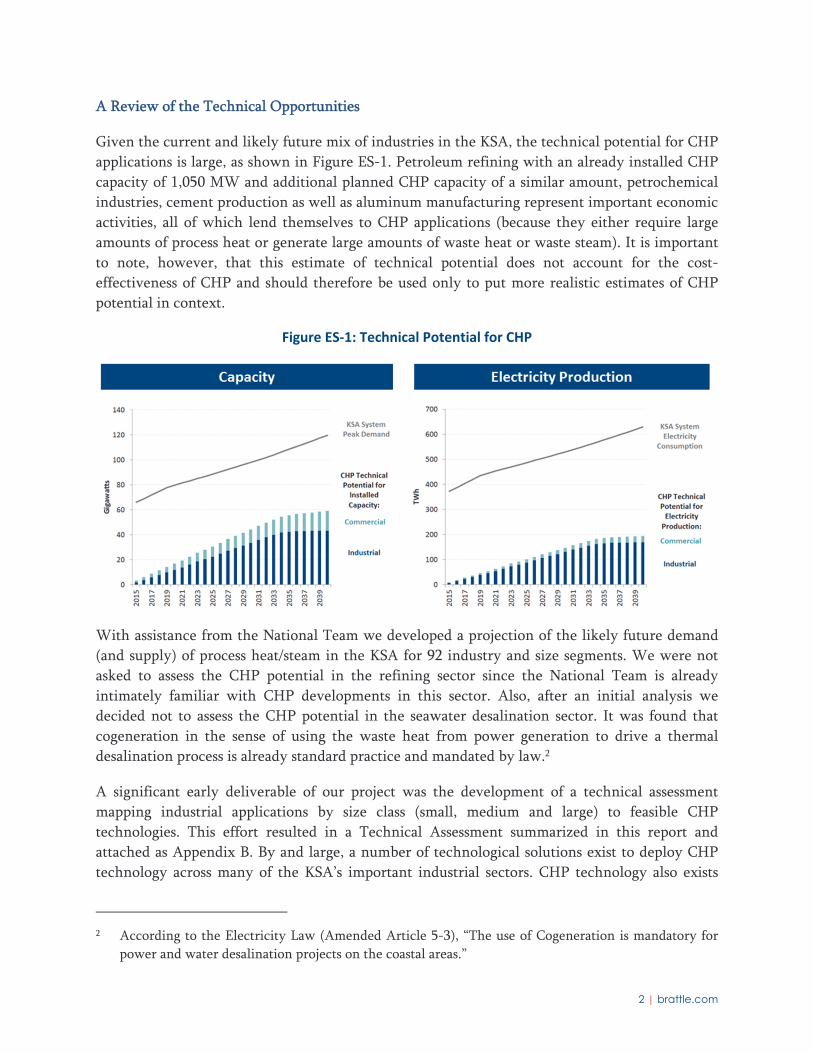
Given the current and likely future mix of industries in the KSA, the technical potential for CHP
applications is large, as shown in Figure ES-1. Petroleum refining with an already installed CHP
capacity of 1,050 MW and additional planned CHP capacity of a similar amount, petrochemical
industries, cement production as well as aluminum manufacturing represent important economic
activities, all of which lend themselves to CHP applications (because they either require large
amounts of process heat or generate large amounts of waste heat or waste steam). It is important
to note, however, that this estimate of technical potential does not account for the cost-
effectiveness of CHP and should therefore be used only to put more realistic estimates of CHP
potential in context.
Figure ES‐1: Technical Potential for CHP
With assistance from the National Team we developed a projection of the likely future demand
(and supply) of process heat/steam in the KSA for 92 industry and size segments. We were not
asked to assess the CHP potential in the refining sector since the National Team is already
intimately familiar with CHP developments in this sector. Also, after an initial analysis we
decided not to assess the CHP potential in the seawater desalination sector. It was found that
cogeneration in the sense of using the waste heat from power generation to drive a thermal
desalination process is already standard practice and mandated by law.2
A significant early deliverable of our project was the development of a technical assessment
mapping industrial applications by size class (small, medium and large) to feasible CHP
technologies. This effort resulted in a Technical Assessment summarized in this report and
attached as Appendix B. By and large, a number of technological solutions exist to deploy CHP
technology across many of the KSA’s important industrial sectors. CHP technology also exists
2 According to the Electricity Law (Amended Article 5-3), “The use of Cogeneration is mandatory for
power and water desalination projects on the coastal areas.”
3 | brattle.com
that could be used to apply CHP in the commercial sector, most notably to use waste heat to
generate air conditioning in large buildings or in district cooling applications. The main
conclusion of the technical assessment was that it is possible to apply CHP applications for a large
portion of industrial and commercial activities.
Market Potential and the Economics of CHP
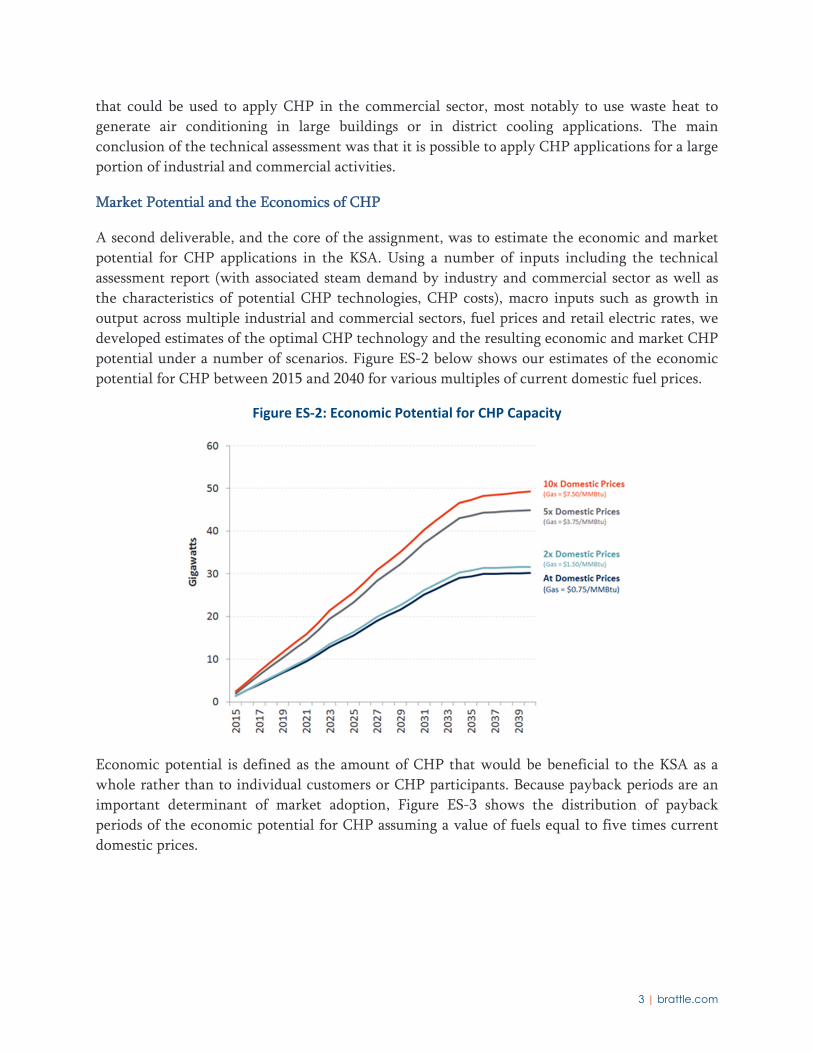
A second deliverable, and the core of the assignment, was to estimate the economic and market
potential for CHP applications in the KSA. Using a number of inputs including the technical
assessment report (with associated steam demand by industry and commercial sector as well as
the characteristics of potential CHP technologies, CHP costs), macro inputs such as growth in
output across multiple industrial and commercial sectors, fuel prices and retail electric rates, we
developed estimates of the optimal CHP technology and the resulting economic and market CHP
potential under a number of scenarios. Figure ES-2 below shows our estimates of the economic
potential for CHP between 2015 and 2040 for various multiples of current domestic fuel prices.
Figure ES‐2: Economic Potential for CHP Capacity
Economic potential is defined as the amount of CHP that would be beneficial to the KSA as a
whole rather than to individual customers or CHP participants. Because payback periods are an
important determinant of market adoption, Figure ES-3 shows the distribution of payback
periods of the economic potential for CHP assuming a value of fuels equal to five times current
domestic prices.
4 | brattle.com
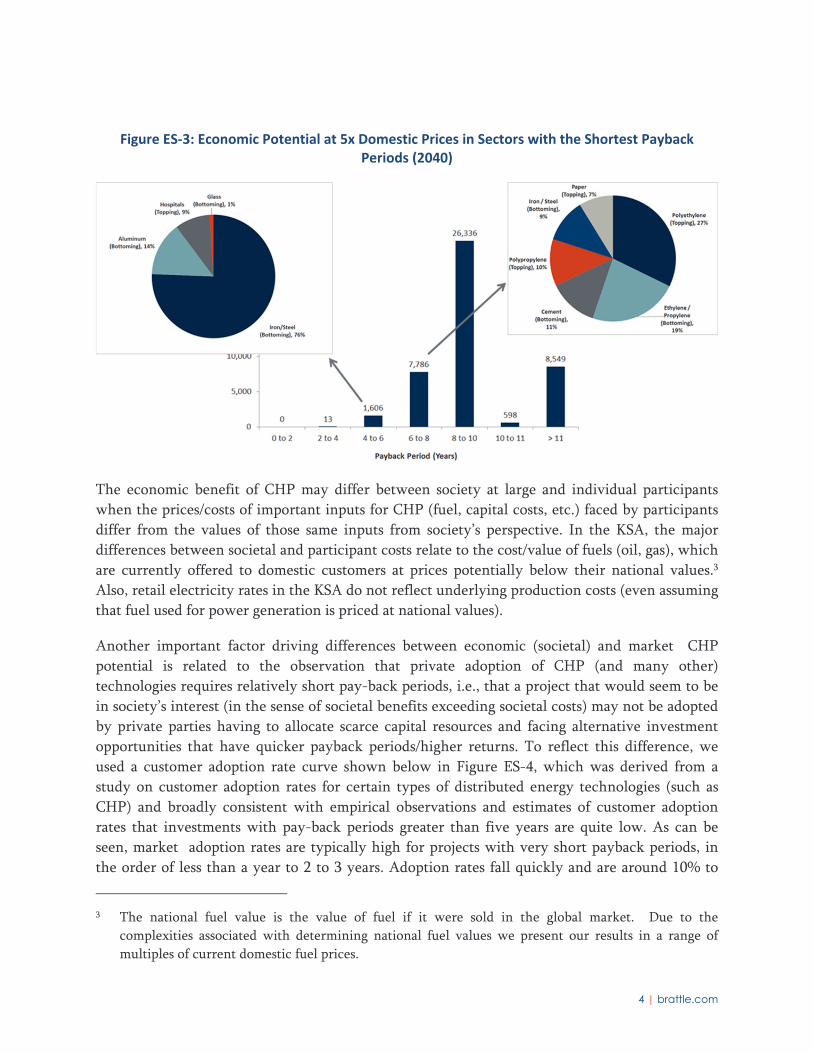
Figure ES‐3: Economic Potential at 5x Domestic Prices in Sectors with the Shortest Payback Periods (2040)
The economic benefit of CHP may differ between society at large and individual participants
when the prices/costs of important inputs for CHP (fuel, capital costs, etc.) faced by participants
differ from the values of those same inputs from society’s perspective. In the KSA, the major
differences between societal and participant costs relate to the cost/value of fuels (oil, gas), which
are currently offered to domestic customers at prices potentially below their national values.3
Also, retail electricity rates in the KSA do not reflect underlying production costs (even assuming
that fuel used for power generation is priced at national values).
Another important factor driving differences between economic (societal) and market CHP
potential is related to the observation that private adoption of CHP (and many other)
technologies requires relatively short pay-back periods, i.e., that a project that would seem to be
in society’s interest (in the sense of societal benefits exceeding societal costs) may not be adopted
by private parties having to allocate scarce capital resources and facing alternative investment
opportunities that have quicker payback periods/higher returns. To reflect this difference, we
used a customer adoption rate curve shown below in Figure ES-4, which was derived from a
study on customer adoption rates for certain types of distributed energy technologies (such as
CHP) and broadly consistent with empirical observations and estimates of customer adoption
rates that investments with pay-back periods greater than five years are quite low. As can be
seen, market adoption rates are typically high for projects with very short payback periods, in
the order of less than a year to 2 to 3 years. Adoption rates fall quickly and are around 10% to
3 The national fuel value is the value of fuel if it were sold in the global market. Due to the
complexities associated with determining national fuel values we present our results in a range of
multiples of current domestic fuel prices.

5 | brattle.com
40% (depending on assumptions about the propensity of a particular customer to adopt a given
technology) for payback periods of 5 years and are very low for projects with payback periods of
6 years or longer.
Figure ES‐4: Market Adoption as a Function of Payback Period
Using an average adoption rate curve (“Brattle Analysis), we estimate the commercial CHP
potential under current domestic prices to be very low. Even assuming that national fuel values
of five times domestic fuel prices are used to estimate commercial adoption, the resulting
commercial CHP potential would be relatively small and concentrated in a small number of
sectors, as shown in Figure ES-5. As the figure shows, in 2040 the market size of CHP ranges
between 4-5 GW. This assumes that CHP plants are compensated either at the full retail rate or
at prevailing wholesale prices for energy and capacity – essentially receiving the full avoided cost
for their power production. Under current rules for the export of surplus energy, only a very
small amount of CHP would likely be adopted by the market.

6 | brattle.com
Figure ES‐5: Market Potential at Various Export Prices and Price Multiple of 5x (2040)
As these figures suggest, for the market potential for CHP to be substantial when compared to
overall installed electric capacity in the KSA, several important conditions must likely be met.
First, domestic fuel prices likely have to move significantly closer to national fuel values, or at
least CHP hosts have to face incentives similar to what they would face in such an environment.
While we have not made any assumptions about what those values might be, the fact that CHP
potential – economic or market – only becomes significant at approximately five times current
prices suggests that unless domestic prices increase significantly or potential CHP customers
receive financial incentives that reflect such higher values little CHP deployment should be
expected.
Second and somewhat related, since a significant amount of the economic CHP potential in the
KSA is for topping cycle applications (where power produced in a plant results in waste
heat/steam then used in an industrial or commercial application), and since the most cost-
effective CHP in such applications tends to result in significant excess power production relative
to local power needs at the CHP site, the terms for selling excess power to the grid are critical.
Under current conditions for selling excess power, we would expect little additional CHP to be
deployed by the market, as shown above.
Third, as shown in Figure ES-3, the economic potential for CHP in the KSA is limited to a
relatively small set of large customers in a narrow set of industrial sectors. They are mostly in the
petrochemical sector (our study excludes the refining industry, since CHP is already being

7 | brattle.com
deployed there through Saudi Aramco) and several bottoming cycle applications in the iron/steel,
aluminum and cement industry.
Finally, also as shown in Figure ES-3, the economic potential for CHP in the KSA, even at
valuations of fuel five times current levels of domestic fuel prices, is concentrated among projects
with payback periods of five years or longer, with the bulk of projects with “positive” benefit-
cost ratios (i.e., ratios greater than unity, where benefits exceed costs) at those higher national
fuel values having payback periods of 6 to 8 years. Intuitively, this result is the consequence of
the fact that at present the assumed fuel for future baseload power generation will be natural gas
and that CHP units are also assumed to use natural gas. As a consequence, there is relatively little
economic savings to be derived by switching from more to less expensive fuels (as a matter of
fact, on a BTU basis, natural gas would be more expensive than fuel oil, the default fuel for stand-
alone boiler applications). Rather, the primary source of savings from CHP is the avoidance of
fuel, capital and O&M expenses from stand-alone boiler applications to produce steam/heat. On
the other hand, at least in some cases CHP units would not be as efficient as their alternative,
namely the construction of natural-gas fired combined cycle plants for the sole purpose of power
generation. This is because in some cases the most efficient CHP application calls for a less
efficient power generation source, such as a steam turbine or a combustion turbine. For
commercial sector applications, any savings we estimated are in fact the result of capital cost
savings rather than fuel savings. As a matter of fact, fuel consumption in commercial sector CHP
applications tends to be higher than it would be assuming air conditioning is provided with the
help of electric chillers alone. This is because, using today’s technology, electric chillers operate
at very high levels of efficiency. Figure ES-6 summarizes our analysis.
Figure 1: CHP Capacity Potential (2040)
8 | brattle.com
Together, this assessment of the economic and market potential for CHP in the KSA leads us to
conclude that a relatively targeted support of CHP efforts in key industrial sectors and size
segments is likely to be more promising and economically beneficial for the KSA than broad
support strategies for CHP. To the extent broad CHP policies are being pursued in other
countries, they tend to be driven by factors such as lowering greenhouse gas emissions..
The Path Forward: Barriers and Solutions
After a careful review of international experience with both barriers and policy solutions, we
identified several important barriers that likely prevent the most promising CHP applications in
the KSA from being implemented and developed several relatively narrow policy proposals for
the KSA.
As stated earlier, domestic fuel prices are relatively low in the KSA. These yield fuel cost savings
to be low relative to the incremental capital investment for CHP, creating long payback periods.
The situation is exacerbated by the fact that CHP customers will receive low electric prices when
they sell excess power to the grid. These two factors, low fuel prices and low electricity prices,
represent the most important barriers to deployment of cost-effective CHP in the KSA. Our
estimates of economic and market potential for CHP highlighted above show in detail how the
attractiveness of CHP increases as domestic fuel prices and prices for the sale of excess power
increase.
Many of the more general barriers identified internationally also apply in the KSA context.
Among them are the general lack of awareness and knowledge about CHP, lack of skill in
operating CHP for a potential industrial host, and the fact that private parties seem to use higher
discount rates (or require quicker pay-back periods) for CHP projects than a social perspective
suggests should be used.
Based on these barriers, we suggest that a mix of policies aiming at generally improving the
economic conditions for CHP through a mix of broad electric sector reforms improving the
economic incentives for all energy related investment decisions and some broad policies to help
CHP should both be implemented. However, we suggest that the emphasis in the KSA would
likely best be placed on developing a relatively targeted set of initiatives to encourage/support
the deployment of CHP in the relatively small sectors we identify as promising for CHP. In
particular, we propose to use the fuel allocation mechanism already in place and well understood
by all local consumers of allocated fuel to create incentives for CHP. Fuel allocation decisions
could be made conditional on certain industrial customers demonstrating that they have
evaluated the potential for CHP.
We also suggest that unless or until domestic fuel prices are brought more closely in line with
national values it will be necessary to bridge the gap between domestic prices and national values
for potential CHP hosts. This could be accomplished in a number of ways including the provision
of capital grants, soft loans or some form of heat credit, all of which would need to be financed
by an entity realizing the national value of fuel savings resulting from CHP. The former two
9 | brattle.com
options reduce the upfront capital cost of a CHP project and thus reduce the payback period. A
heat credit would likely take the form of a production payment tied to the total electric output
(or the heat output) of a CHP facility. It would lower the variable cost (or increase the income
stream) for a CHP project and thus also reduce the resulting payback period. The size of either of
these should be tied to the difference between prevailing local fuel prices and domestic fuel
values.
We also suggest aligning infrastructure and CHP in the sense of promoting the development of
CHP specifically in areas with existing gas pipeline infrastructure. Since the KSA is a rapidly
developing country, new industrial developments are quite common. Locally, these
developments often take the form of new “industrial cities”, where common infrastructure is
shared by multiple commercial/industrial customers. While it seems tempting to develop CHP in
this context to supply process heat/steam and electricity to a range of customers in new industrial
cities thus potentially avoiding the necessity of an electric grid connection in remote areas, the
pros and cons of this approach should be carefully evaluated since CHP applications for multiple
steam hosts are relatively rare. This is likely at least in part a consequence of CHP applications
typically being quite host-specific and in part due to complex potential liability issues when
steam generation falls short of steam demand, for example during (partial) CHP outages.
To overcome the perceived or actual lack of skill in operating CHP facilities by potential CHP
hosts, we also suggest that the KSA should encourage third party ownership and operation of
CHP facilities. This is quite normal in many countries and we believe there likely already exists
significant expertise amongst existing power generation operators to form a solid basis for safely
and reliably operating CHP facilities.
Finally, to increase awareness and technical competence around CHP, we suggest that a mix of
technical assistance programs and CHP pilots should be developed.

10 | brattle.com
II. Introduction
Combined heat and power (CHP), also known as cogeneration or in some cases trigeneration, is
the simultaneous production of electricity and heat from a single fuel source, such as natural gas,
oil, biomass, biogas, coal, or waste heat. CHP is often viewed not as a single technology, but as
an integrated energy system that can be modified depending upon the needs of the energy end
user. Given the large loads for process heating and cooling in the Kingdom of Saudi Arabia
(KSA), there has been growing interest in whether it would be feasible to adopt policies and
programmatic frameworks that would lead to wider adoption of CHP technology resources in the
country.
ECRA retained a team of consultants (“the team”) led by The Brattle Group and assisted by
Navigant Consulting, EcoSolutions, and Pierce Atwood, to develop a national roadmap for
combined heat and power in the Kingdom of Saudi Arabia (“KSA”). Since April 2014 we have
worked closely with ECRA and the National Team tasked with developing the Long Term Plan
(“LTP”) for energy in the Kingdom to conduct primary and secondary research, analyses and
prepare reports in accordance with the scope of work for this project.
The purpose of our study was to assess the variety of available CHP options and then draw on the
team’s expertise to assess the applicability of those options in the KSA. The analysis considers the
cost-effectiveness of the CHP technologies, the existence of various barriers and the
identification of policies to overcome those barriers, the market potential for CHP adoption, and
regulatory infrastructures that would be needed in order to more firmly establish the resource.
This Final Report summarizes the main elements of our work. It is structured to be consistent
with the various tasks under the SOW and includes the following topics:
Technical Assessment
Economic and Market Assessment
Barriers Assessment
Policy Recommendations
For each of these topics this report contains a summary review, complemented by appendices
with further work product for each of the four topic areas.
11 | brattle.com
III. The Technical Assessment
The purpose of the Technical Assessment was to specify the operational characteristics of a wide
range of CHP technologies that could feasibly be adopted in the KSA. For example, such
characteristics include fixed and variable operations and maintenance costs, up-front capital
costs, incremental heat rate, capacity factor, and other characteristics that are needed to assess
the economics of each CHP facility. This database of CHP technologies, when combined with
an estimate of total demand for steam or waste heat in each industry segment, forms the basis for
our assessment of CHP potential. The deliverable for the Technical Assessment included a
Microsoft Excel database describing CHP technology characteristics (which we refer to as the
“CHP Performance Database”). The CHP Performance Database is provided in Appendix A. An
accompanying report describing the database in more detail is provided in Appendix B.
To develop the KSA-specific inputs for the database, the team conducted primary and secondary
research. The primary research was conducted by Eco Engineering & Energy Solutions
(EcoSolutions), a KSA-based firm with a background in energy efficiency and with numerous
business contacts in the KSA. The secondary research was conducted by Navigant Consulting.
Primary research consisted of visiting and interviewing local industrial and commercial facilities.
The secondary research focused on literature review of internationally recognized CHP sources
and drew on Navigant’s engineering team’s expertise. We incorporated the findings from both
research activities to develop technical, operational, and financial characteristics of CHP
technologies.
CHP is best applied at facilities that have significant and concurrent electric and thermal
demands. Two different types of CHP markets were included in this evaluation of technical
potential: 1) industrial and 2) commercial. In the context of the KSA’s industrial sector, CHP
thermal output is in the form of heat used for industrial processes. For commercial and
institutional users, thermal output is used primarily for providing space cooling with absorption
chillers. Both of these markets were further disaggregated based on industrial processes and
commercial building types, resulting in the analysis of multiple industrial and commercial
distinct market segments. We picked industrial market segments with significant production
capacities. These are determined by analyzing the KSA industrial production data that was
provided to us by the National Team. Internationally cooling with absorption chillers and CHP is
only feasible at facilities with large cooling loads. We therefore limited our analysis to
commercial market sectors that would require at least 1,000 tons of cooling capacity.
The Technical Assessment and the related CHP Performance Database do not address CHP
potential for electric utilities, such as those owned by Saudi Electric Company, desalination
plants in the KSA, or facilities owned by Saudi Aramco. These plants were outside of the scope of
this study and it is our understanding that the Saudi Aramco and desalination plants are already
using or planning to use CHP in the future. However, it should be noted that the CHP potential
in these sectors is quite large and should continue to be explored.

12 | brattle.com
A. CHP OVERVIEW
CHP can be characterized as either “topping cycle” or “bottoming cycle” generation. This is an
important distinction, in part because it determines the fuel requirements of the CHP system. In
a topping cycle application, the CHP plant is used to generate electricity, and the steam that is
the byproduct of this activity is captured as thermal energy to drive the applicable industrial
processes. The CHP plant acts as a substitute for the boiler that would otherwise be used by the
industrial facility to generate steam. This is illustrated in Figure 2.
Figure 2: Illustration of Topping‐Cycle CHP for Industrial Customers
In a bottoming cycle application, waste heat from an existing industrial process is recovered by
the CHP plant and used to generate electricity. In this application, there is no difference in fuel
consumption with or without CHP. The CHP plant simply utilizes as input the heat that would
otherwise be wasted. This is illustrated in Figure 3.
Figure 3: Illustration of Bottoming Cycle CHP for Industrial Customers
In our analysis, industrial CHP applications can be either topping or bottoming cycles depending
on the industry and technology. For the commercial sector, all applications are topping cycles
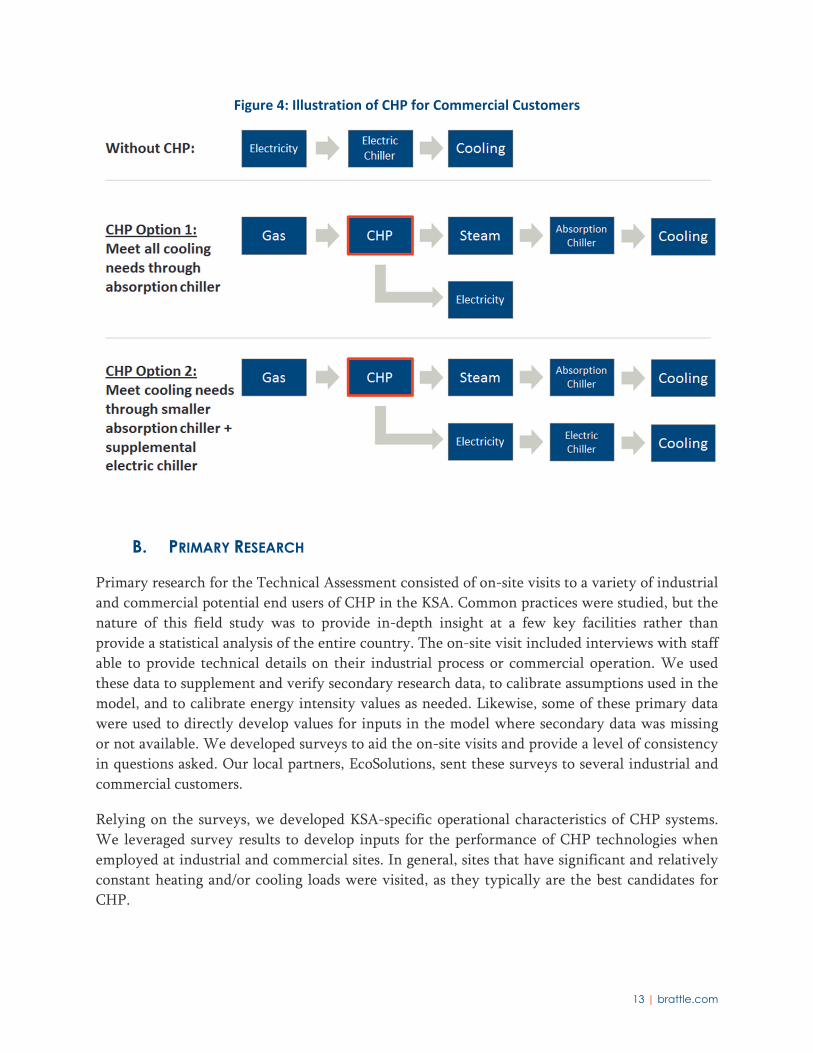
and CHP is used specifically to serve the building’s cooling needs. We considered two common
sizing options for commercial customers. In the first option, the CHP plant is sized to meet all
cooling needs through an absorption chiller. The electricity that is produced by the CHP plant is
used to serve other non-cooling electricity needs on-site or sold to the grid. In the second
option, we assume a smaller sized CHP plant. The plant would meet a portion of the building’s
cooling needs through the absorption chiller, and would utilize the electrical output of the CHP
plant to serve the rest of the cooling needs through a supplemental electric chiller. In this
second option there is no excess electricity available for non-cooling loads or for sale back to the
grid. The commercial CHP sizing options are illustrated in Figure 4.
Oil Combustion HeatIndustrial process
Without CHP:
With CHP: Oil Combustion HeatIndustrial process
Waste Heat CHP Electricity
13 | brattle.com
Figure 4: Illustration of CHP for Commercial Customers
B. PRIMARY RESEARCH
Primary research for the Technical Assessment consisted of on-site visits to a variety of industrial
and commercial potential end users of CHP in the KSA. Common practices were studied, but the
nature of this field study was to provide in-depth insight at a few key facilities rather than
provide a statistical analysis of the entire country. The on-site visit included interviews with staff
able to provide technical details on their industrial process or commercial operation. We used
these data to supplement and verify secondary research data, to calibrate assumptions used in the
model, and to calibrate energy intensity values as needed. Likewise, some of these primary data
were used to directly develop values for inputs in the model where secondary data was missing
or not available. We developed surveys to aid the on-site visits and provide a level of consistency
in questions asked. Our local partners, EcoSolutions, sent these surveys to several industrial and
commercial customers.
Relying on the surveys, we developed KSA-specific operational characteristics of CHP systems.
We leveraged survey results to develop inputs for the performance of CHP technologies when
employed at industrial and commercial sites. In general, sites that have significant and relatively
constant heating and/or cooling loads were visited, as they typically are the best candidates for
CHP.

14 | brattle.com
1. Industrial Sector Primary Research
In the KSA, the petrochemical, steel, and cement industries jointly account for 85 percent of
industrial electricity consumption.4 Furthermore, the petrochemical, steel, paper, and cement
industries jointly account for 90 percent of industrial steam demand and waste heat. As such, we
made sure that the primary research covered these subsectors to a reasonable extent.
Overall, the industrial survey was sent to more than 50 contacts and 14 companies were
successfully interviewed. Table 1 shows the details of our survey sample. The sample represents
approximately 25 percent of the total tons of material production in the KSA with more than 1.5
gigawatts (GW) of electricity demand. From the 14 companies interviewed, six of them have on-
site generators and two of them have CHP units, totaling 600 MW of electricity generation
capacity. The study benefited from the diversity and substantial size of the participants.
Table 1: Summary of Industrial Sample
Industry Type
Total
Inter-
viewed
With On-
Site
Generation
With
CHP
Total
Production
Capacity
(tons)
% of KSA
Production a
Total
MW
Demand
Total On-
Site
Generation
MW
Capacity
Petrochemical 4 0 1 17,500,000 25% 750
MW b 250 MW
Cement 3 3 0 8,500,000 15% 181
MW 259 MW
Iron & Steel 3 1 0 12,000,000 38% 615
MW 16 MW
Paper 1 0 1 200,000 28% 35 MW 12.5 MW
Food Processing 1 1 0 20,000 N/A 20 MW 41.6 MW
Chemical 1 1 0 1,000,000 N/A 6.5 MW 6.5 MW
Glass 1 0 0 7,200 c 2% N/A N/A
Total 14 6 2 40,000,000 25% 1.6 GW 0.6 GW
a The percentage of KSA production was calculated as the ratio between the sum of all the reported annual material
production amounts and Saudi ARAMCO’s annual material production estimates.
b Navigant estimated demand for two of the facilities due to missing information.
c A glass density of 20 kg/m² is used as a conversion factor.
4 Saudi Energy Efficiency Center. “Industrial.”
http://www.seec.gov.sa/2013/03/27/%D8%B5%D9%86%D8%A7%D8%B9%D9%8A/?lang=en

15 | brattle.com
2. Commercial Sector Primary Research
Commercial and government buildings account for over one third of electricity usage in the KSA,
with half of this usage going to cooling.5 Additionally the national team provided insights on the
new developments, such as stadiums, social compounds, and multifamily complexes. Based on
our understanding of the role of CHP (tri-generation) in this sector, we focused primary data
collection efforts on buildings and complexes which have high CHP potential and applicability.
Overall, the commercial survey was sent to more than 100 contacts and 14 companies were
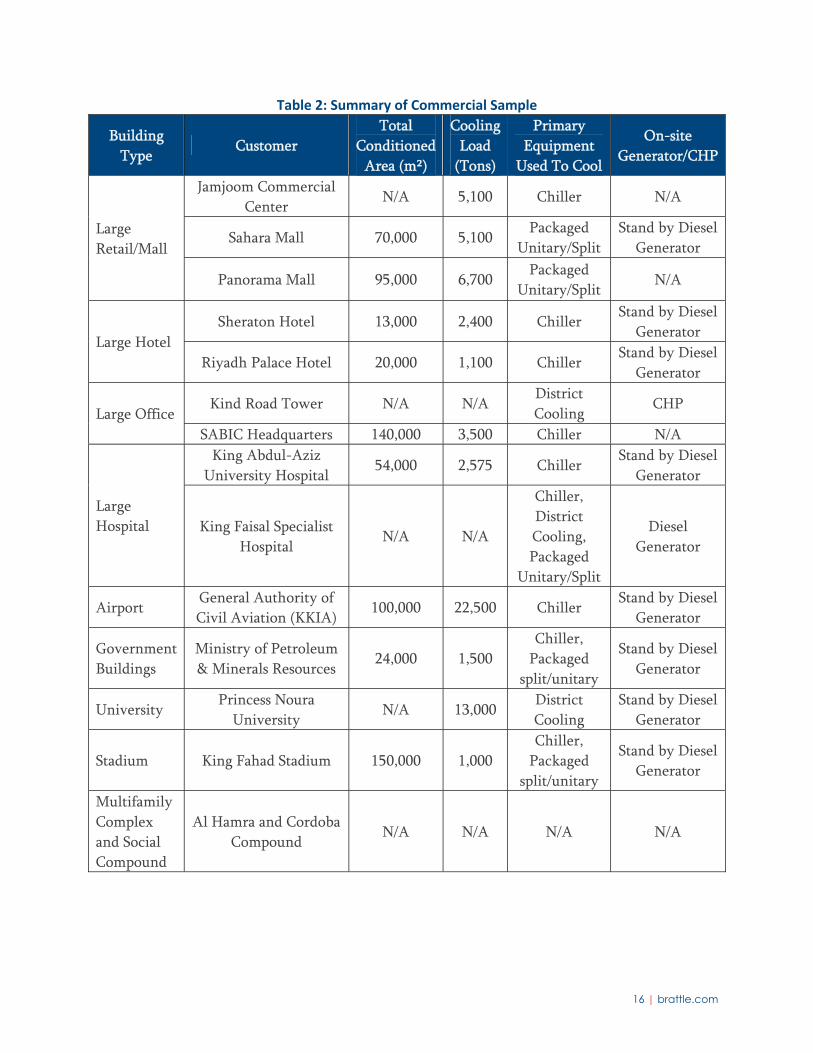
successfully interviewed. Table 2 shows the details of our survey sample. The sample represents
approximately 650,000 square meters (m²) of commercial buildings with more than 64,000 tons
of cooling capacity. This sample covers all the targeted building types except military base
buildings. We were not able to conduct interviews with military buildings due to difficulties in
getting permission to fill out the survey. Of the 14 customers interviewed, two have district
cooling systems, nine have chillers with some support by packaged unitary or split systems, and
two large malls have only packaged unitary or split systems. As with the industrial visits, the
study benefited from the diversity and substantial size of the participants.
5 Based on data collected during the development of a 2011 study of demand-side management
potential in the KSA: The Brattle Group, Global Energy Partners, and PacWest Consulting Partners,
“Bringing Demand Side Management to The Kingdom of Saudi Arabia,” prepared for ECRA, May
2011.
16 | brattle.com
Table 2: Summary of Commercial Sample
Building
Type Customer
Total
Conditioned
Area (m²)
Cooling
Load
(Tons)
Primary
Equipment
Used To Cool
On-site
Generator/CHP
Large
Retail/Mall
Jamjoom Commercial
Center N/A 5,100 Chiller N/A
Sahara Mall 70,000 5,100 Packaged
Unitary/Split
Stand by Diesel
Generator
Panorama Mall 95,000 6,700 Packaged
Unitary/Split N/A
Large Hotel
Sheraton Hotel 13,000 2,400 Chiller Stand by Diesel
Generator
Riyadh Palace Hotel 20,000 1,100 Chiller Stand by Diesel
Generator
Large Office Kind Road Tower N/A N/A
District
Cooling CHP
SABIC Headquarters 140,000 3,500 Chiller N/A
Large
Hospital
King Abdul-Aziz
University Hospital 54,000 2,575 Chiller
Stand by Diesel
Generator
King Faisal Specialist
Hospital N/A N/A
Chiller,
District
Cooling,
Packaged
Unitary/Split
Diesel
Generator
Airport General Authority of
Civil Aviation (KKIA) 100,000 22,500 Chiller
Stand by Diesel
Generator
Government
Buildings
Ministry of Petroleum
& Minerals Resources 24,000 1,500
Chiller,
Packaged
split/unitary
Stand by Diesel
Generator
University Princess Noura
University N/A 13,000
District
Cooling
Stand by Diesel
Generator
Stadium King Fahad Stadium 150,000 1,000
Chiller,
Packaged
split/unitary
Stand by Diesel
Generator
Multifamily
Complex
and Social
Compound
Al Hamra and Cordoba
Compound N/A N/A N/A N/A
17 | brattle.com
C. THE CHP PERFORMANCE DATABASE
The Project Team developed the CHP Performance Database with multiple functions in mind.
First, the database provides a comprehensive overview of the applicable technologies for use in
the KSA, as well as their technical, operational, and financial characteristics. Second, the
database feeds critical inputs into the benefit-cost analysis. Accordingly, we structured the
database such that it provides information on operating characteristics and results for a baseline
scenario and a CHP scenario. In the following discussion, a “facility” is an industrial or
commercial end user that has electricity needs and either thermal power needs or large cooling
loads.
The results of the Technical Assessment, which include the technical, operational, and financial
characteristics of the technologies that would apply in each scenario, are captured within the
CHP Technology Database. The Project Team has classified the results into the categories of fuel
consumption, energy production, and financial costs.
In developing the CHP Technology Database, the primary research provided information on KSA
specific utilization, load factors, and peak coincidence factors. In addition, we were provided data
regarding fuel consumption at the facility level and industrial production at the country level.
For the industrial sector, we used fuel consumption as a proxy for either waste heat or fuel
requirements. We analyzed this data to segment each industry into large, medium, and small
facilities, statistically, and to determine the thermal demand for an average facility in each size
segment. After doing so, we used engineering judgment to determine the appropriate CHP
technology for each combination of industry and size segment.
For the commercial sector, we first estimated building area by square meters using the
commercial survey results and general market knowledge as indicators. We then obtained energy
intensity data for commercial building types from the U.S. Commercial Building Energy
Consumption Survey (CBECS) as well as the U.S. Department of Energy commercial prototype
building models and adjusted this data to better represent the KSA’s climate conditions. After
converting this energy intensity data (in kilowatt-hours per square feet [kWh/ft2]) into power
intensity data (tons of refrigeration/m2), we multiplied that data by building area to obtain
cooling demand estimates (in tons of refrigeration) for different building types and size segments
within the KSA.
The Project Team also conducted secondary research, collected from internationally published
studies, articles, and reports, to determine the critical technical, operational, and financial
characteristics of each technology. These technologies can be bucketed into four categories:
topping cycle CHP units, bottoming cycle CHP units, boilers, and chillers.
18 | brattle.com
We developed a set of five appropriate CHP prime driver technologies for industrial and
commercial applications in the KSA. These five technologies are:
Gas turbines
Combined cycle turbines
Reciprocating engines
Steam turbines (topping cycle)
Steam turbines (bottoming cycle)
While other CHP technologies, like micro turbines, fuel cells, and solar were considered, they
are currently not mature enough to allow a full assessment of their technical potential in the
context of the KSA compared to traditional prime movers that drive large facilities. Additionally,
micro turbines and fuel cells have limited capacity ranges much smaller than other technologies
discussed, while the KSA’s primary opportunities for CHP consist of large systems in heavy
industry or large cooling loads.
The sources include a number of reports from organizations such as the International Energy
Agency (IEA), the Danish Energy Agency, the Indian Renewable Energy Development Agency,
the European Union, the World Bank Group, the EPA, the U.S. Energy Information Agency
(EIA), the U.S. Department of Energy (DOE), and numerous other sources. In addition, we
utilized internal reports from The Brattle Group and Navigant, alongside internal engineering
expertise, to develop relationships between CHP unit size and the previously listed
characteristics. Documentation within the CHP Performance Database provides a full list of the
numerous sources used in this analysis.
All CHP units in the database, in both commercial and industrial sectors, are sized based on
projected thermal demand or recoverable waste heat. In the industrial scenarios, CHP units will
replace boilers and recover the waste heat. In the commercial scenario, there are two sub-
scenarios – the electric chillers will be replaced either by CHP units, electric chillers, and
absorption chillers or by CHP units and absorption chillers, as described previously.
D. FINDINGS OF TECHNICAL ASSESSMENT
CHP has significant technical application options beyond the current CHP technologies deployed
by Saudi Aramco and the desalination sector. Of primary interest is the petrochemical industrial
sector which has many heat intensive and electrical loads that can be simultaneously met by
CHP more efficiently than convention means. Other heavy industries, which are abundant in the
KSA, are also good technical applications of CHP. Industrial applications can be divided in to
topping and bottoming CHP cycles. Topping cycles are best suited to processes where low quality
heat is required and is provided by the exhaust coming out of a steam turbine, a gas turbine or a
reciprocating engine. Bottoming cycles are employed where the industrial process requires high
heat and there are opportunities to recover waste heat for electricity production.

19 | brattle.com
Should the KSA desire to further explore CHP development, the commercial and institutional
sectors have considerable technical opportunities. In these cases the heat is primarily used to
power absorption chillers that provide chilled water for cooling or refrigeration. Additionally,
the heat produced can also be used for any heat or hot water needs; this configuration is
sometimes referred to as tri-generation due to the simultaneous production of heat, chilled water
and electricity. The complexity of using CHP to provide cooling requires a large cooling load to
make the system technically and economically attractive.
The result of the technical study is the CHP Performance Database which pairs technically viable
CHP prime mover technologies with KSA-specific applications. The Microsoft Excel-based tool
combines data from 28 industrial and commercial KSA sites visited for the primary research as
well as 32 referenced sources of secondary data. There are eight tabs detailing the characteristics
of CHP prime drivers, boilers, and chillers. Characteristics include capital costs, operation and
maintenance costs, heat rates and power to heat ratios, lifetimes, and availabilities all adjusted to
capacity sizes. Three calculation tabs are provided that detail how baseline capacities are matched
to CHP capacities as well as how the bottoming cycle thermal demand is calculated. The results
are concluded in two outputs tabs for the industrial section and the commercial sector. The
industrial tab has 127 rows of output matching industrial applications to viable CHP prime driver
technologies, summarizing CHP and baseline characteristics including international costs6 and
technology performance. Similarly the commercial tab has 126 rows of output matching
commercial applications to viable CHP prime driver technologies.
6 The economic study translates international costs to KSA specific costs.
20 | brattle.com
IV. Economic and Market Assessment
Based on the technical assessment, and using inputs from the National Team related to general
data on economic and energy market parameters in the KSA, the team prepared an economic and
market assessment for CHP in the KSA. This task involved three discrete steps. First, the
technical assessment was combined with data on the current or future composition of various
industrial and commercial sectors in the KSA economy to derive an estimate of the maximum
amount of CHP that might be deployed in the KSA between 2015 and 2040, assuming that all
industrial steam load and waste heat and all commercial cooling loads would be met with CHP
applications with the largest possible power to heat ratios (i.e., the technology which, for a given
amount of steam production, produces the largest amount of electricity). We refer to this as
technical potential.7
In a second step, using assumptions about CHP costs gathered by Navigant Consulting and KSA-
specific costs provided by the National Team, the team developed an estimate of the economic
potential for CHP in the KSA between 2015 and 2040. For this purpose, the team developed an
economic model, provided to ECRA as a deliverable under the SOW, to first choose, for a certain
set of assumptions about fuel costs, electricity rates, etc. the most cost-effective CHP technology
for each industry/commercial sector and size segment of the Saudi economy. With the best
technology chosen, the model calculated both costs and benefits to derive net present values
(“NPV”), benefit cost ratios (“B/C ratios”) and payback period for each industry/commercial
sector and size segment to identify projects with net economic benefits to the KSA (and/or to
individual project sponsors). Aggregating projects with KSA-wide net economic benefits resulted
in an estimate of the economic potential for CHP under a variety of assumptions.
Finally, taking into account differences in prices faced by society and individual project sponsors
– such as retail rates differing from marginal production costs or wholesale prices, and using
estimates about adoption rates of projects as a function of payback periods, the team developed
estimates of the market potential. Market potential is the amount of economically beneficial
CHP that would likely be adopted by private parties, for CHP in the KSA.
The following sections describe each of these steps and the resulting estimates of CHP potential
in the KSA in more detail. The results of this assessment of CHP potential were presented to
members of the National Team at meetings in the KSA in January 2015. The final presentation
from those meetings is provided in Appendix C.
7 Since estimates of technical potential are not constrained by economics, there are several somewhat
arbitrary ways in which the most applicable technology for each customer segment can be chosen. In
this case, we have chosen the technology that maximizes electrical output. This differs from estimates
of economic and market potential, which choose the technology that maximizes societal cost-
effectiveness.
21 | brattle.com
A. THE MODELING FRAMEWORK
To assess the potential for CHP in the KSA, we developed a bottom-up market assessment model
which we refer to as the CHP Potential Model.8 The purpose of the CHP Potential Model is to
identify the maximum amount of CHP that would be installed in the KSA under various market
and policy scenarios. We use the model to evaluate three specific types of potential:
Technical potential: The maximum amount of CHP that could be installed in the KSA
regardless of cost-effectiveness. This establishes a technical upper-bound on the amount
of CHP that could be installed; however, it is not a realistic estimate of CHP adoption.
Economic potential: The amount of CHP that would be installed if all cost-effective
projects were pursued, where cost-effectiveness accounts for all societal benefits and costs
at domestic or shadow prices.
Market potential: The amount of cost-effective CHP that would be installed after
accounting for barriers to adoption; this amount changes as new policies are introduced
to overcome the barriers.
The CHP Potential Model consists of two sub-modules. The Technology Cost-Effectiveness
Module evaluates the cost-effectiveness of each available CHP technology option for the average
customer in each customer segment. Inputs to the Technology Cost-Effectiveness Module
include economic market characteristics (such as fuel prices and electricity prices), CHP
characteristics (as codified in the CHP Performance database), boiler characteristics (to establish
the fuel needs and costs associated with the alternative to CHP), customer characteristics (such as
the average thermal load per customer), and policy assumptions (such as any financial incentives
that are provided to promote the adoption of CHP).
The cost-effectiveness of CHP can be considered from two perspectives. One important
perspective in the analysis is that of the CHP owner. The costs to the owner (referred to as the
“participant”) include the cost of installing and running the CHP plant.9 The benefits are
determined largely be the avoided cost of installing and running a boiler or chiller, the avoided
retail electricity rate for on-site electricity consumption, and revenue from selling excess
electricity to the grid. In other words, for the participant, the value of the additional electricity
generated by the CHP facility is largely determined by the retail rate and the compensation
8 The CHP Potential Model is provided in Appendix D.
9 An ECRA decision from January 2014 suggests that customers who cannot provide reserves of 11.5%
of their total CHP capacity must pay $382,000/kW-year for any capacity needed to reach the 11.5%
threshold. We do not include this charge in scenarios where retail rates are assumed to be based on
marginal costs, because it is not clear that this charge is derived from marginal cost estimates. In
scenarios based on existing rates, inclusion of this charge may lead to slightly smaller potential than
we report in this study, but the impact would be minimal given the small size of the charge and would
not change our conclusions.

22 | brattle.com
mechanism that is in place for sales of excess electricity to the grid. This is different from the
societal perspective in the sense that the societal benefits of the CHP facility include all avoided
costs regardless of whether or not they are actually realized by the owner of the CHP facility.
These benefits would include, for example, avoided or deferred need for new generating capacity
and T&D capacity attributable to reductions in system peak demand.10
The customer economics of CHP are illustrated in Figure 5. As an example, the figure details the
economics of a 28 MW gas turbine being used as CHP for a large paper mill. The benefits are
assessed at current domestic prices. For this specific application, total costs are slightly higher
than total benefits over the 20-year useful life of the facility, from the participant’s perspective.
In this example, this project would not contribute to the economic (or market) potential of CHP
since it would not pass an initial benefit-cost screening test, which requires benefits to exceed
costs on an annualized (i.e., discounted) net present value (NPV) basis.
Figure 5: Economics of Gas Turbine CHP for Large Paper Mill at Current Domestic Prices
A comparison of the time pattern of up-front capital cost of the CHP facility to the incremental
annual cost-savings (i.e., fuel, O&M, and electricity) in Figure 5 below shows that the
undiscounted payback period for this specific application is 12.2 years – longer than most private
investors are willing to tolerate as a threshold for investment. Accounting for the time value of
money further illustrates the lack of cost-effectiveness of this particular application and is
consistent with the conclusion in Figure 4 above that the discounted benefits are outweighed by
the discounted costs. Specifically, the discounted cash flows would require 23 years to reach
positive net present value – three years longer than the 20 year life of the facility, demonstrating
that this particular application is not cost-effective at current domestic prices.
10 CHP plants may provide ancillary services benefits as well. In our modeling, we assume that the
ancillary services benefits provided by the CHP plant are the same as those provided by the marginal
power plant that the CHP unit is replacing. In other words, the two cancel each other out and there is
no net gain or loss of ancillary services. This may slightly overstate the ancillary services benefit of
the CHP plant since it is likely to face more significant operating constraints by virtue of being tied to
an industrial process.
USD (thousands)
CHP capital cost, net of financial incentive ($) 30,229
CHP fuel ($/yr) 1,169
CHP variable O&M ($/yr) 807
CHP fixed O&M ($yr) 188
Total annualized cost ($/yr) 4,800
Costs Benefits
USD (thousands)
One‐time avoided boiler/chiller capital cost ($) 1,042
Annual avoided on‐site electricity cost ($/yr) 1,291
Annual revenue from electricity sales to grid ($/yr) 2,586
Annual avoided boiler/chiller variable O&M cost ($/yr) 153
Annual avoided boiler/chiller fixed O&M cost ($/yr) 290
Annual avoided boiler fuel cost ($/yr) 245
Total annualized benefit ($/yr) 4,656

23 | brattle.com
Figure 6: Cash Flows of Investment in Gas Turbine for a Large Paper Mill at Domestic Prices
The Customer Adoption Module then identifies the most cost-effective CHP technology option
for each customer segment and projects KSA-wide adoption of the technology. Inputs to this
module include the technology-specific cost-effectiveness results of the Technology Cost-
Effectiveness Module, an assumed adoption function which expresses the likelihood of
technology adoption as a function of the technology’s payback period, and market size
characteristics (such as the total thermal load per customer segment).
The output of the CHP Potential model is an estimate of the potential CHP adoption by customer
segment and by year for the three potential scenarios described above. The model also reports
financial savings associated with these scenarios (such as avoided costs of new generation
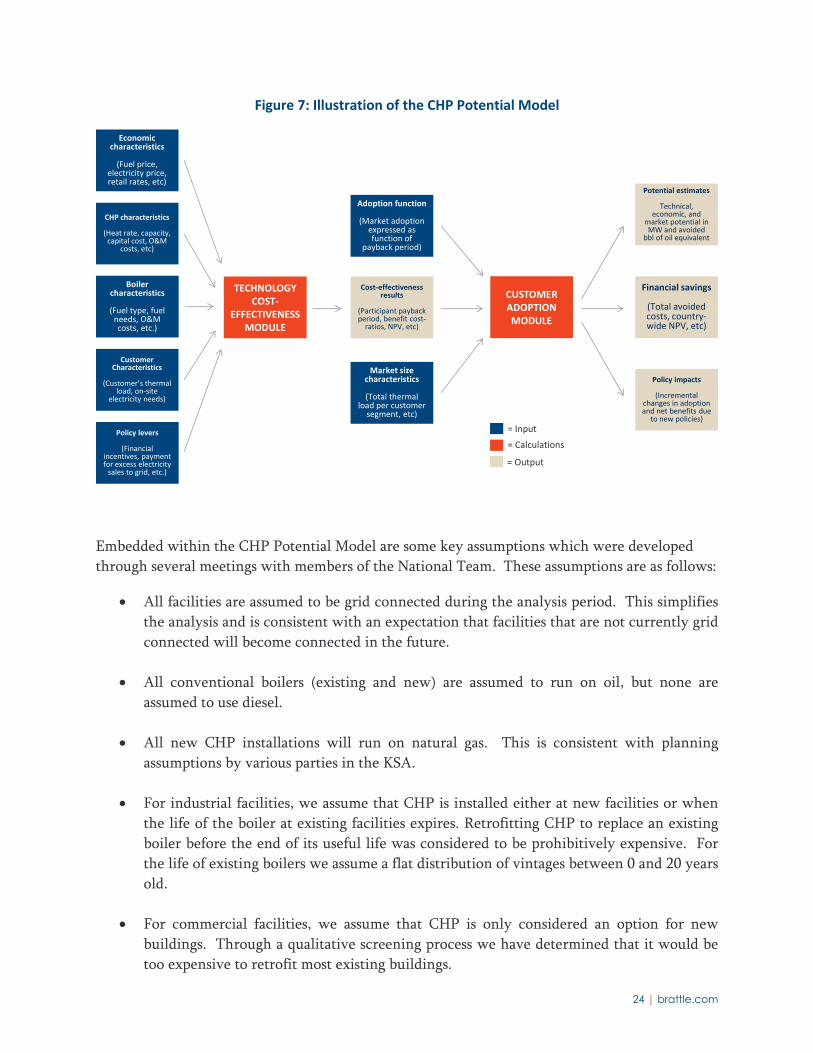
capacity). A flow chart describing the inputs and outputs of the CHP Potential Model is
provided in Figure 7. For more detail on the mechanics of the model, see Appendix C.
24 | brattle.com
Figure 7: Illustration of the CHP Potential Model
Embedded within the CHP Potential Model are some key assumptions which were developed
through several meetings with members of the National Team. These assumptions are as follows:
All facilities are assumed to be grid connected during the analysis period. This simplifies
the analysis and is consistent with an expectation that facilities that are not currently grid
connected will become connected in the future.
All conventional boilers (existing and new) are assumed to run on oil, but none are
assumed to use diesel.
All new CHP installations will run on natural gas. This is consistent with planning
assumptions by various parties in the KSA.
For industrial facilities, we assume that CHP is installed either at new facilities or when
the life of the boiler at existing facilities expires. Retrofitting CHP to replace an existing
boiler before the end of its useful life was considered to be prohibitively expensive. For
the life of existing boilers we assume a flat distribution of vintages between 0 and 20 years
old.
For commercial facilities, we assume that CHP is only considered an option for new
buildings. Through a qualitative screening process we have determined that it would be
too expensive to retrofit most existing buildings.
Economic characteristics
(Fuel price, electricity price, retail rates, etc)
CHP characteristics
(Heat rate, capacity, capital cost, O&M
costs, etc)
Boiler characteristics
(Fuel type, fuel needs, O&M costs, etc.)
Policy levers
(Financial incentives, payment for excess electricity sales to grid, etc.)
TECHNOLOGY COST‐
EFFECTIVENESS MODULE
Cost‐effectiveness results
(Participant payback period, benefit cost‐ratios, NPV, etc)
CUSTOMER ADOPTION MODULE
Adoption function
(Market adoption expressed as function of
payback period)
Financial savings
(Total avoided costs, country‐wide NPV, etc)
Market size characteristics
(Total thermal load per customer segment, etc)
Potential estimates
Technical, economic, and
market potential in MW and avoided
bbl of oil equivalent
Policy impacts
(Incremental changes in adoption and net benefits due to new policies)
Customer Characteristics
(Customer’s thermal load, on‐site
electricity needs)
= Input
= Calculations
= Output
25 | brattle.com
The vast majority of new generation capacity additions in the KSA are likely to be natural
gas-fired combined cycle units. Therefore these units are considered the marginal units
that are avoided through the installation of new CHP capacity. This assumption is our
basis for calculating avoided energy and capacity attributable to new CHP.
B. ESTABLISHING STEAM AND WASTE HEAT DEMAND IN THE KSA
To establish estimates of CHP potential, we first determined the total applicable market for CHP
in the relevant commercial and industrial sectors in KSA. The deliverable associated with this
task includes a Microsoft Excel-based model which identifies total steam and waste heat demand
for industrial and commercial sectors by industry and building type, respectively (which we refer
to as the “Market Characterization Database”). To develop the KSA-specific inputs for the
database, the Project Team leveraged the primary and secondary research conducted by Navigant
and EcoSolutions to inform the CHP Performance Database. Additional secondary research from
internationally recognized sources, combined with data provided by the National Team
supplemented the analysis. The following section details methodology and additional data
sources used to establish thermal load and waste head demand by sector in the KSA. The Market
Characterization Database is provided in Appendix E.
1. Methodology – Industrial Sector
The Project Team identified industrial market segments with significant production capacities by
analyzing the KSA industrial production data provided by the National Team. We developed a
market size and corresponding CHP potential estimate for all industries included in these KSA-
specific industrial production data.
Whether an industry requires a topping or bottoming cycle CHP plant is a key technical
consideration that directly determines CHP market size in a given industry. Therefore, the
Project Team segmented the industrial market sizing analysis into two different methodologies.
In a bottoming cycle, CHP potential is a function of the industrial steam demand of each industry
subsector. However, for a topping cycle, CHP potential is a function of waste heat in each
industry. The Project Team conducted extensive research on energy intensity, waste heat, and
steam demand of each industry in the KSA, using data collected in the field by EcoSolutions
combined with a variety of international sources such as the OECD, IEA, and EIA. Note that the
Market Characterization Database provides a full list of the numerous sources used in this
analysis. Using these energy intensities, the Project Team converted industrial production
forecasts provided by the National Team into steam demand and waste heat estimates, used in
the calculation of CHP potential for topping and bottoming cycles respectively.
Our analysis includes small, medium, and large facilities within each subsector of industry. The
Project Team applied different “best fit” CHP technical performance attributes (e.g. capacity, load
factor, utilization, etc.) to each facility size, based on the analysis conducted in the CHP
Performance Database (described in Task 2). The Project Team analyzed the census of existing

26 | brattle.com
industrial facilities in the Kingdom and their relative production capacities to develop size class
allocations specific to each industrial subsector. 11
In our analysis, the total CHP market is characterized by the number of CHP generators (or
units) that could be installed in a particular sector in a given year. The quantity of CHP units is
based on the industrial waste heat or steam demand of a particular industry combined with
typical CHP size and technology pairings drawn from the CHP Performance Database. The
Project Team developed cumulative CHP potential units for different size classes of facilities in
all subsectors of industry between 2014 and 2040.
To summarize, the industrial market analysis entailed a combination of the following factors to
develop an estimate of the total applicable CHP market for different size classes of facilities in all
subsectors of industry between 2014 and 2040.
1) The conversion of Kingdom industrial production forecasts into waste heat and
steam demand forecasts using factors obtained from onsite research and
secondary sources.
2) Analysis of a census of existing industrial facilities in the Kingdom to provide a
size allocation of “small, medium, or large” facilities as a percent of each
subsector’s industrial production.
3) Application of technical characteristics from the CHP Performance Database to
match “best fit” CHP technologies with particular industries and determine the
number of CHP units necessary to satisfy waste heat or steam demand forecasts.
2. Methodology – Commercial Sector
Cooling with absorption chillers and CHP is only feasible at facilities with large cooling loads.
We therefore limited our analysis to commercial market sectors that would require at least 1,000
tons of cooling capacity. Furthermore, based on data collected from primary research in KSA, we
assumed that retrofit of existing commercial facilities with CHP would be cost-prohibitive due to
the need to install large-scale district heating systems in urban environments. Therefore, the
commercial potential for CHP is limited to new construction of commercial buildings only.
The commercial assessment considered all building types surveyed as part of the primary data
collection effort, as well as buildings known to be conducive to CHP development
internationally. The Project Team estimated the total cooling load in commercial buildings using
KSA-specific past and forecast commercial floor space and electricity consumption data provided
by the National Team. Past research informed the portion of total commercial floor space and/or
electricity consumption allocated to specific building types.12 Finally, to determine the cooling
load as a percent of total electricity load for each building type, the Project Team leveraged U.S.
11 Data provided by the National Team.
12 Brattle (2011): “Bringing Demand Side Management to The Kingdom of Saudi Arabia.”

27 | brattle.com
Department of Energy Commercial Prototype Building Models developed with EnergyPlus
building energy simulation software to run a series of simulations by building type in the Riyadh
climate zone. For certain buildings without a standard prototype model (such as refrigerated
warehouses) the Project Team used secondary research to determine the portion of the facility’s
total electricity load that is typically used for cooling in the Riyadh climate.
As in the industrial sector, the Project Team determined the saturation of different facility sizes
by building type using KSA-specific data from past research13. In some cases, the “small” segment
of each building type did not possess sufficient cooling load (>1000 tons) for a single CHP unit, so
those segments were eliminated from the analysis. For the remaining segments, the size of the
potential CHP market is a function of the annual growth in cooling load in each commercial
sector combined with typical CHP size and technology pairings drawn from the CHP
Performance Database. Because CHP can only feasibly be applied to new construction, we used
electricity growth forecasts to determine additional KSA cooling load in each year, and based our
estimates on annual additional load rather than total existing load.
To summarize, the commercial assessment entailed a combination of the following factors to
develop a cumulative estimate of the applicable market for CHP for different size classes and
types of commercial buildings between 2014 and 2040.
1) The conversion of Kingdom commercial floorspace and electricity consumption
forecasts into cooling load by building type in the Riyadh climate.
2) Analysis of past data on KSA electrical demand14 to provide a size allocation of
“small, medium, or large” facilities as a percent of each commercial sectors’
electricity consumption.
3) Application of technical characteristics from the CHP performance database to
match “best fit” CHP technologies with particular commercial buildings and
determine the number of CHP units necessary to satisfy cooling load
requirements for each building type
3. Steam and Waste Heat Demand Projections
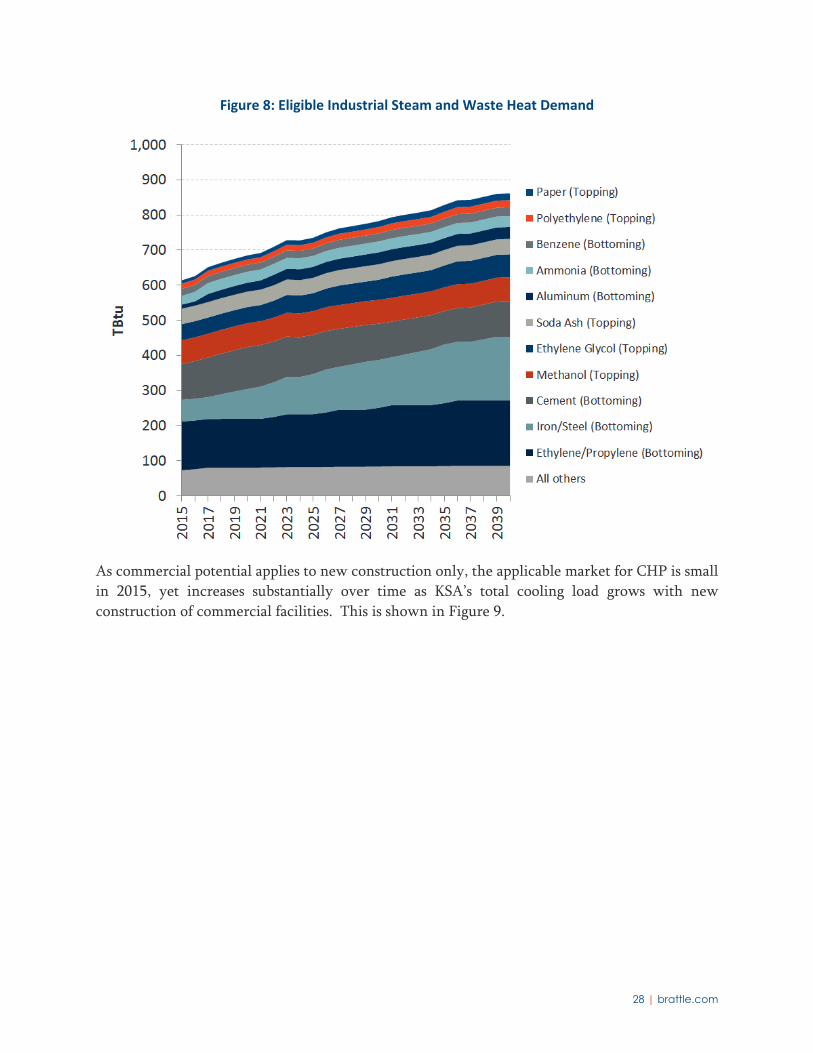
As shown in Figure 8, there is a large demand for steam and waste heat in relevant KSA
industries. The largest are the petrochemical, iron, steel, and cement industrial subsectors.
13 Ibid.
14 Ibid.
28 | brattle.com
Figure 8: Eligible Industrial Steam and Waste Heat Demand
As commercial potential applies to new construction only, the applicable market for CHP is small
in 2015, yet increases substantially over time as KSA’s total cooling load grows with new
construction of commercial facilities. This is shown in Figure 9.

29 | brattle.com
Figure 9: Eligible Commercial Cooling Demand
C. TECHNICAL POTENTIAL
Technical potential is calculated by applying the CHP technology with the largest electric
capacity to total steam or waste heat demand in each customer segment.15 It assumes that 100%
of customers in the segment adopt the technology, regardless of cost-effectiveness. Technical potential is therefore a theoretical upper-bound and its only purpose is to serve as a point of reference against which economic and market potentials, defined below, can be judged.
The technical potential for CHP in the KSA is large. By 2040, it represents roughly 50% of
system peak demand and accounts for nearly 60 GW of capacity.16 Technical potential by year is
15 Since estimates of technical potential are not constrained by economics, there are several somewhat
arbitrary ways in which the most applicable technology for each customer segment can be chosen. In
this case, we have chosen the technology that maximizes electrical output. This differs from estimates
of economic and market potential, which choose the technology that maximizes societal cost-
effectiveness.
16 Throughout this report, our estimates of CHP potential are incremental to existing and planned
installations by Saudi Aramco at its facilities.

30 | brattle.com
summarized in Figure 10. To put the figure in context, it is compared to system wide peak
demand and electricity consumption forecasts from the National Team. These forecasts are for a
future in which moderate reforms significantly reduce demand through targeted demand-side
and supply-side activities
Figure 10: Technical Potential for CHP
Figure 10 shows a “flattening” of the growth in potential around year 2035. This is attributable
to the assumption that the lifetime of existing industrial boilers is evenly distributed over 20
years. Growth in CHP potential prior to 2035 is driven both by the replacement of existing
boilers as their useful life expires and the installation of CHP in new facilities. After 2035, all
existing boilers have been replaced and growth is driven only by the addition of new facilities.
Figure 10 also shows CHP contributing a proportionally higher share of capacity relative to the
KSA peak than of energy relative to KSA energy consumption. This is equivalent to the CHP
capacity factor being lower than the KSA system load factor. This can be partly explained by this
study not considering CHP for residential applications (as long as residential demand contributes
proportionally more to total system energy consumption than to system peak-coincident
demand, which is at least possible given the lack of coincidence in the class and system peaks).
Additionally, CHP units are sized to serve total thermal load of industrial facilities and the
cooling needs of commercial facilities. Both assumptions act as limiting factors for CHP units’
capacity factors - as a result, many of the industrial CHP applications analyzed have an annual
capacity factor of less than 50% and many commercial application have a capacity factor of less
than 20%. It is also apparent than the industrial and commercial sectors contribute different
proportions of CHP capacity and energy potential. This is because industrial CHP applications
tend to have higher capacity factors than commercial applications by virtue of being tied to year-
round industrial processes rather than seasonal cooling needs.
It is possible that these estimates overstate the technical potential to some degree, since CHP
potential could be limited by off-peak electricity demand. If CHP output exceeds system-wide
demand during off-peak hours, it would either have no value or become an export (if feasible).
31 | brattle.com
This effectively caps the domestic CHP economic potential at around 36% of peak, beyond which
electrical output would begin to be exported in some hours (based on the 2013 system load
duration curve for the SEC interconnected grid). This also assumes that CHP is running mostly
to serve base load; to the extent that it is seasonal or has output concentrated more heavily in
peak hours, potential would be higher. In the future, the addition of inflexible resources like
nuclear and renewables could make this constraint more relevant.
We advise against drawing any specific conclusions from estimates of technical potential and
provide it for completeness and as a reference point. Any policy decisions regarding CHP should
account for cost-effectiveness, as is done in the estimates of economic and market potential.
D. ECONOMIC POTENTIAL
Economic potential accounts for the cost-effectiveness of CHP and assumes that CHP
technologies will only be adopted if total societal benefits are greater than total societal costs
over the lifetime of the CHP plant. If more than one CHP technology option is deemed cost-
effective for a given customer segment, the technology with the highest benefit-cost ratio is
chosen for all customers in that segment. While economic potential is less than technical
potential due to this cost-effectiveness screen, it still assumes 100 percent participation for those
technologies that are deemed cost-effective. In other words, economic potential does not account for practical considerations that limit the number of customers who will choose to adopt a cost-effective CHP technology. These considerations, for example, could include limited access
to capital, perceived operational risk associated with self-generation, or uncertainty around
access to fuel for the CHP plant. A comprehensive discussion of barriers to adoption is provided
in Chapter V. Regardless, economic potential is a useful metric because it represents the total
amount of cost-effective CHP potential if all barriers to adoption were overcome.
At current domestic energy prices, economic potential is roughly half of technical potential. By
2040, whereas technical potential is around 60 GW of capacity and close to 200,000 GWh of
annual electricity production, economic potential is around 30 GW of capacity and slightly over
100,000 GWh of electricity production. This is still a large amount of CHP potential,
representing roughly 20 percent of the projected system peak demand.
An important consideration when estimating economic potential is the assumed price of energy.
Domestic fuel prices in the KSA are heavily subsidized, which leads to artificially low electricity
prices. The electricity prices are further depressed through subsidies in retail rates for residential
and industrial customers. Assessing economic potential at a range of multiples of the current
domestic price of energy provides perspective on CHP potential if fuels in the KSA were priced
at a value closer to the international market price. To capture a reasonable range of possible fuel
prices, we have analyzed CHP potential at multiples of 2x, 5x, and 10x the current domestic
price. The fuel costs associated with these price multiples are summarized in Table 3 below.

32 | brattle.com
Table 3: Fuel Prices at Various Multiples of the Current Domestic Price
Economic potential increases considerably as the price of fuel and electricity rises. At 5x the
current domestic price, CHP capacity potential increases by roughly 50% and at 10x the current
domestic price, it increases by more than 60% relative to the analysis at current domestic
prices.17 Figure 11 below summarizes the annual economic potential for CHP capacity at these
price multiples.
Figure 11: Economic Potential for CHP Capacity
While the economic potential for CHP capacity is significant, the fuel savings associated with the
operation of this capacity are quite modest. Even at 10x current domestic fuel prices, oil savings
will only reach a rate of roughly 150,000 bbl/day by 2040. These oil savings are associated
entirely with a reduction in the fuel that is consumed in boilers at industrial and commercial
facilities, which accounts for just a fraction of the total KSA-wide oil consumption. Natural gas
savings are also small and dependent on the assumed energy price. At current domestic energy
17 This highlights that the relationship between price and CHP potential is non-linear.
Price multipleNatural Gas
($/MMBtu)
Fuel Oil
($/MMBtu)
Fuel Oil
($/bbl)
Current domestic 0.75 0.34 1.95
2x current 1.50 0.68 3.89
5x current 3.75 1.70 9.73
10x current 7.50 3.40 19.46
Source of current domestic price: Saudi Aramco
Note: The fuel oil price is approximately 35% to 50% of the price of Arabian Light
Crude (depending on region)

33 | brattle.com
prices, natural gas consumption will actually increase. This is attributable to investment largely
in steam (topping) technology, which has an efficiency disadvantage relative to new gas-fired
combined cycle units that are being added to the KSA’s supply mix. At higher prices,
investments would be made in other more efficient CHP technologies, and reduced line losses
would provide some additional reduction in natural gas consumption. Investment in bottoming
cycle applications would also drive a net reduction in natural gas consumption since these
technologies rely on waste heat and require not additional fuel to generate electricity. The net
change in oil and natural gas consumption for economic potential at various price multiples is
illustrated in Figure 12.
Figure 12: CHP Economic Potential ‐ Change in Fuel Consumption
While all economic potential is by definition cost-effective, a key consideration from a policy
perspective is, by how much do the benefits of CHP outweigh the costs? Projects with a higher
benefit-cost ratio (and, correspondingly, a lower payback period) are more attractive targets for
new policies that promote CHP adoption, relative to projects that are only very marginal in their
cost-effectiveness.
At current domestic prices, the vast majority of cost-effective CHP projects have a benefit-cost
ratio of between 1.1-to-1 and 1.2-to-1. This is a relatively low benefit-cost ratio which suggests
that much of the CHP potential is only marginally cost-effective. At various multiples of the
domestic price, the benefit-cost ratio improves significantly. For example, at a price multiple of
5x, most of the cost-effective CHP potential has a benefit-cost ratio of between 1.2 and 1.5. At a
price multiple of 10x, there is over 5 GW of capacity with a high benefit-cost ratio of between 2
and 3. The distribution of benefit-cost ratios for economic potential at various price multiples is
summarized in Figure 13.

34 | brattle.com
Figure 13: Distribution of Economic Potential Across Benefit‐Cost Ratios (2040)
The economics of CHP can also be assessed based on the payback period for participants. The
payback period is a particularly important metric because, as discussed below in the Market
Potential section of this report, it is the primary driver of a customer’s willingness to invest in
CHP. At current domestic prices, virtually all economic potential has a payback period of more
than 11 years. This means that it would take more than 11 years for a customer who invests in
CHP to recover the investment. However, at higher energy prices, this outcome changes
dramatically. At 5x domestic prices, there is 1.6 GW of capacity with a payback of four to six
years and 7.8 GW of capacity with a payback of six to eight years. These are payback thresholds
at which some customers would be expected to adopt CHP. At a multiple of 10x domestic prices,
there is over 32 GW of economic capacity with a payback of less than six years. This is shown in
Figure 14.

35 | brattle.com
Figure 14: Distribution of Economic Potential Across Payback Periods (2040)
The economic potential can be disaggregated by industry. Of particular interest are those
industries for which CHP is highly cost-effective, with relatively short payback periods. These
are the industries that would experience the greatest cost savings by investing in CHP, and may
therefore be the best targets for new policies to promote cost-effective CHP adoption.
Much of the highly cost-effective CHP potential is concentrated in just a few industries. At a
price multiple of 5x, more than three quarters of the 1.6 GW of CHP capacity with a payback
period of less than six years is concentrated in CHP bottoming applications in the iron/steel
sector. Aluminum, hospitals, and glass account for the remaining potential in this segment. At a
payback period of six to eight years, the 7.8 GW of potential are distributed fairly evenly across
six sectors, but generally concentrated in sectors associated with petrochemicals. This sector-
level disaggregation of the most cost-effective CHP potential is summarized in Figure 15.

36 | brattle.com
Figure 15: Economic Potential at 5x Domestic Prices in Sectors with Shortest Payback (2040)
An important question is, how many of these customers will adopt CHP? That is addressed in
the assessment of market potential.
E. MARKET POTENTIAL
Market potential accounts not only for the economics of CHP technologies but also other
barriers and factors that would prevent all cost-effective CHP from being adopted. In this sense,
market potential is the most realistic estimate of CHP adoption. Examining market potential
under various assumptions is helpful in projecting the likely impact that new policy options
could have on actual CHP adoption.
Estimates of market potential are based on the premise that customer adoption of CHP will be a
function of the investment’s payback period. The shorter the payback period, the more likely the
customer is to adopt CHP. This relationship between payback and adoption is based on prior
empirical research that was conducted specifically in the context of the CHP market,18 and is
further supported indirectly by several studies on customer adoption of energy efficiency
measures. The study on CHP adoption identified several different adoption functions associated
18 ICF, “Combined Heat and Power: Policy Analysis and Market Assessment: 2011-2030,” February 2012
and Primen, “2003 Distributed Energy Market Survey,” May 2004. A number of customer adoption
curves have been developed for different purposes, including for the adoption of electric heat pumps
and distributed solar PV at the residential level (Kastovich et al., Advanced Electric Heat Pump
Market and Business Analysis, Oak Ridge National Laboratory, 1982, and R.W. Beck, Distributed
Renewable Energy Operating Impacts and Valuation Study, January 2009). They come to similar
conclusions, as shown in Drury et al., Modeling the U.S. Rooftop Photovoltaics Market, NREL,
September 2010, Figure 5, which shows that adoption rates drop to levels near zero for projects with
payback periods above 10 years.
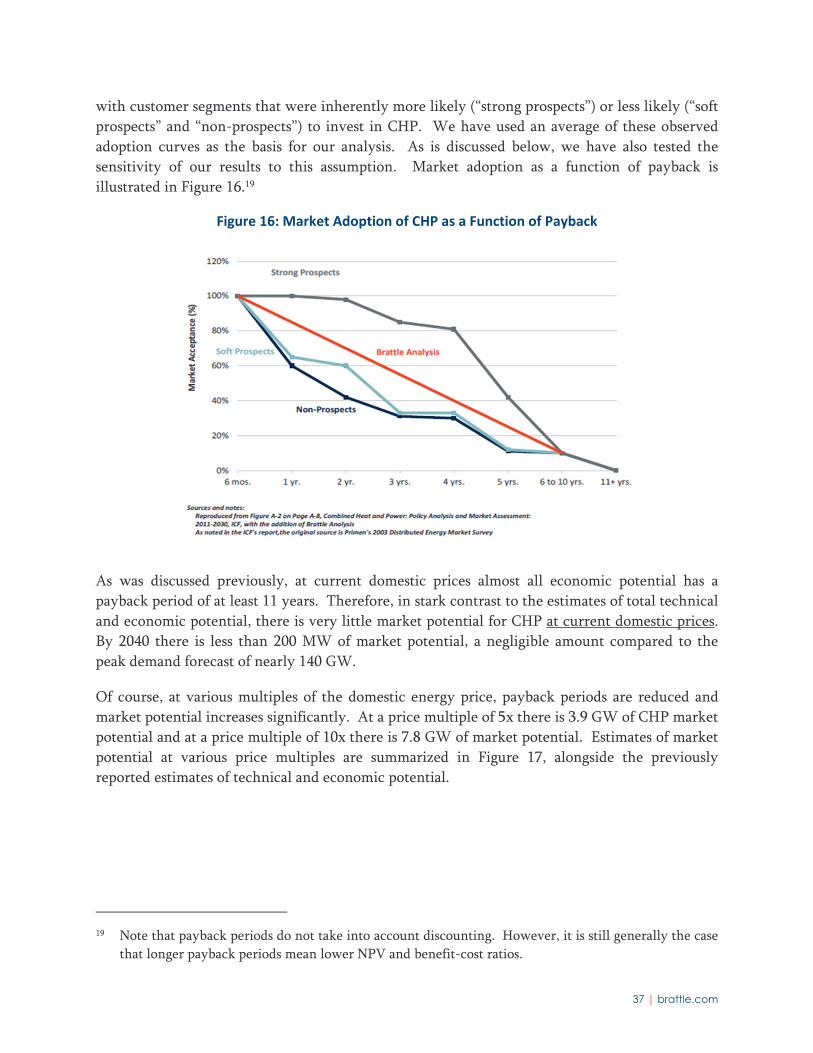
37 | brattle.com
with customer segments that were inherently more likely (“strong prospects”) or less likely (“soft
prospects” and “non-prospects”) to invest in CHP. We have used an average of these observed
adoption curves as the basis for our analysis. As is discussed below, we have also tested the
sensitivity of our results to this assumption. Market adoption as a function of payback is
illustrated in Figure 16.19
Figure 16: Market Adoption of CHP as a Function of Payback
As was discussed previously, at current domestic prices almost all economic potential has a
payback period of at least 11 years. Therefore, in stark contrast to the estimates of total technical
and economic potential, there is very little market potential for CHP at current domestic prices.
By 2040 there is less than 200 MW of market potential, a negligible amount compared to the
peak demand forecast of nearly 140 GW.
Of course, at various multiples of the domestic energy price, payback periods are reduced and
market potential increases significantly. At a price multiple of 5x there is 3.9 GW of CHP market
potential and at a price multiple of 10x there is 7.8 GW of market potential. Estimates of market
potential at various price multiples are summarized in Figure 17, alongside the previously
reported estimates of technical and economic potential.
19 Note that payback periods do not take into account discounting. However, it is still generally the case
that longer payback periods mean lower NPV and benefit-cost ratios.
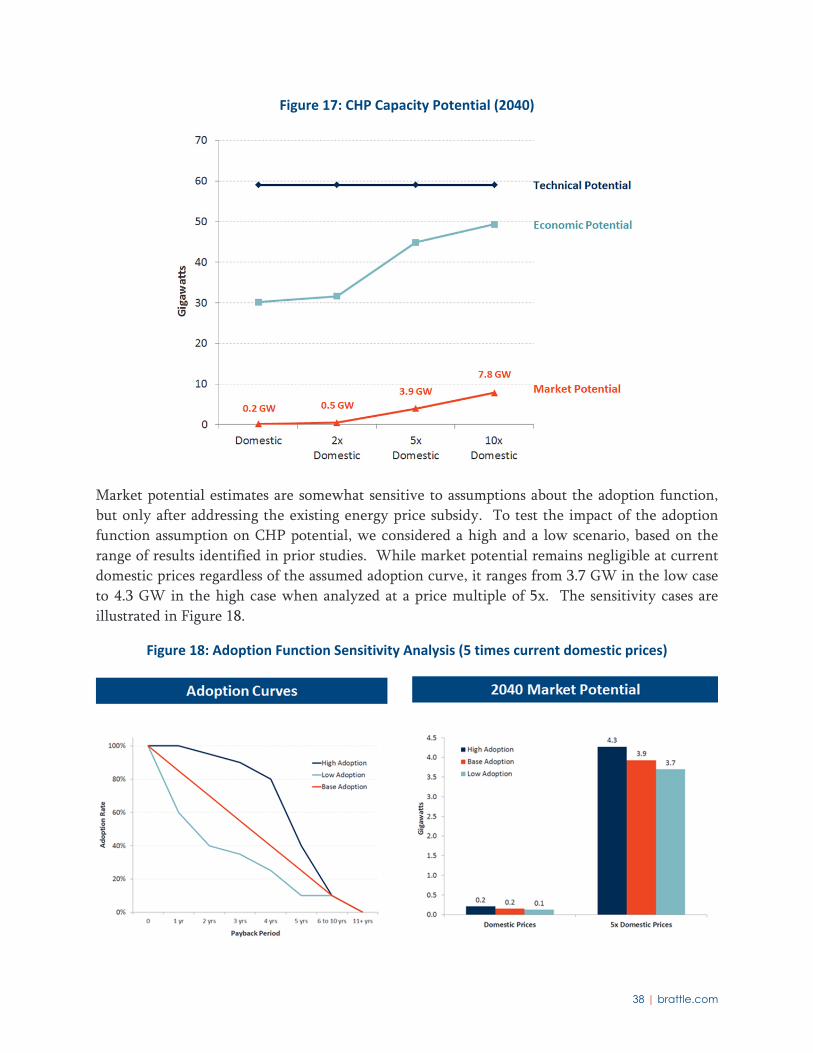
38 | brattle.com
Figure 17: CHP Capacity Potential (2040)
Market potential estimates are somewhat sensitive to assumptions about the adoption function,
but only after addressing the existing energy price subsidy. To test the impact of the adoption
function assumption on CHP potential, we considered a high and a low scenario, based on the
range of results identified in prior studies. While market potential remains negligible at current
domestic prices regardless of the assumed adoption curve, it ranges from 3.7 GW in the low case
to 4.3 GW in the high case when analyzed at a price multiple of 5x. The sensitivity cases are
illustrated in Figure 18.
Figure 18: Adoption Function Sensitivity Analysis (5 times current domestic prices)
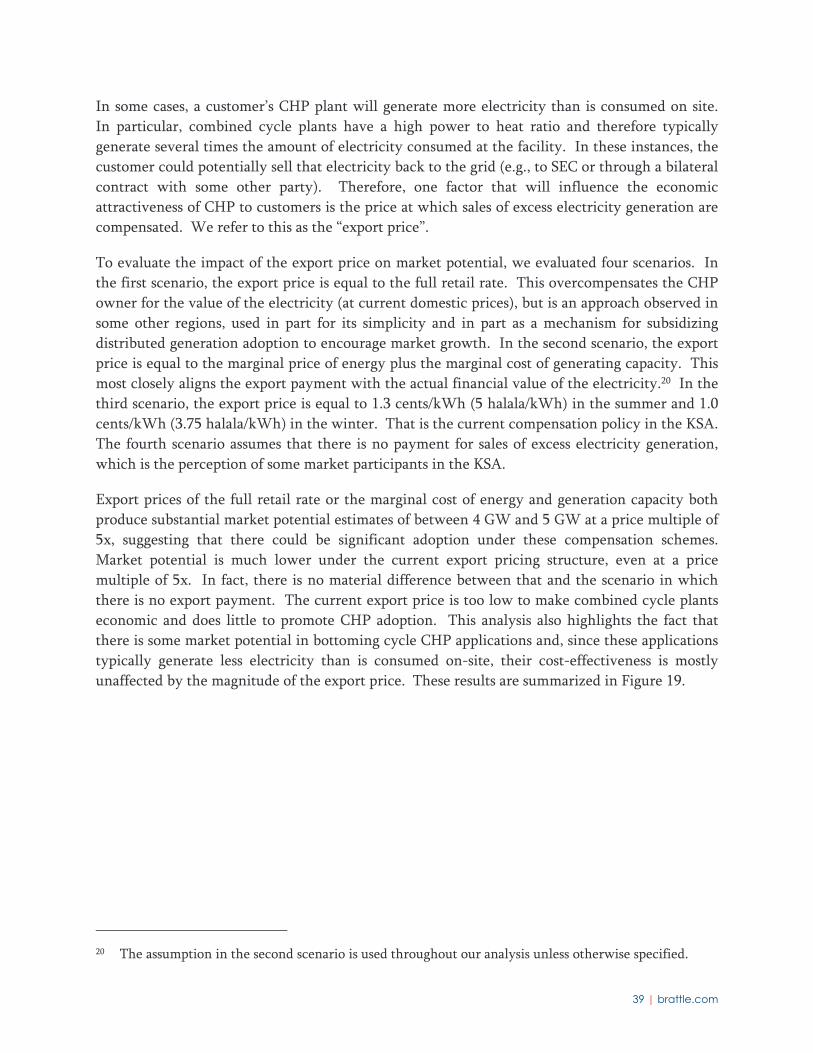
39 | brattle.com
In some cases, a customer’s CHP plant will generate more electricity than is consumed on site.
In particular, combined cycle plants have a high power to heat ratio and therefore typically
generate several times the amount of electricity consumed at the facility. In these instances, the
customer could potentially sell that electricity back to the grid (e.g., to SEC or through a bilateral
contract with some other party). Therefore, one factor that will influence the economic
attractiveness of CHP to customers is the price at which sales of excess electricity generation are
compensated. We refer to this as the “export price”.
To evaluate the impact of the export price on market potential, we evaluated four scenarios. In
the first scenario, the export price is equal to the full retail rate. This overcompensates the CHP
owner for the value of the electricity (at current domestic prices), but is an approach observed in
some other regions, used in part for its simplicity and in part as a mechanism for subsidizing
distributed generation adoption to encourage market growth. In the second scenario, the export
price is equal to the marginal price of energy plus the marginal cost of generating capacity. This
most closely aligns the export payment with the actual financial value of the electricity.20 In the
third scenario, the export price is equal to 1.3 cents/kWh (5 halala/kWh) in the summer and 1.0
cents/kWh (3.75 halala/kWh) in the winter. That is the current compensation policy in the KSA.
The fourth scenario assumes that there is no payment for sales of excess electricity generation,
which is the perception of some market participants in the KSA.
Export prices of the full retail rate or the marginal cost of energy and generation capacity both
produce substantial market potential estimates of between 4 GW and 5 GW at a price multiple of
5x, suggesting that there could be significant adoption under these compensation schemes.
Market potential is much lower under the current export pricing structure, even at a price
multiple of 5x. In fact, there is no material difference between that and the scenario in which
there is no export payment. The current export price is too low to make combined cycle plants
economic and does little to promote CHP adoption. This analysis also highlights the fact that
there is some market potential in bottoming cycle CHP applications and, since these applications
typically generate less electricity than is consumed on-site, their cost-effectiveness is mostly
unaffected by the magnitude of the export price. These results are summarized in Figure 19.
20 The assumption in the second scenario is used throughout our analysis unless otherwise specified.

40 | brattle.com
Figure 19: Market Potential at Various Export Prices and Price Multiple of 5x (2040)
This analysis of market potential raises an important policy question. To the extent that there is
significant untapped economic CHP potential in the KSA but current conditions are preventing
that potential from being realized, what policy options are available to overcome the barriers to
adoption? These policy options are explored in detail in Chapter VI, but we have quantitatively
analyzed one such option - a capital grant for CHP investment – to illustrate the potential impact
of new policy initiatives. The analysis evaluates the impact on market potential of capital grants
that cover different shares of the capital cost of a new CHP plant at current domestic energy
prices.
Capital grants are likely to lead to a significant increase in CHP adoption, but only when they
cover the majority of the capital cost of the CHP facility. A capital grant of 75 percent of the
CHP cost would be required to bring the payback period below six years for most of the
economic potential at current domestic prices. This equates to a payment between $750/kW and
$1,000/kW for large customers (depending on the CHP application). This highlights the need for
careful consideration of the mechanism that is used to promote CHP adoption and also may be an
argument for targeting those specific customer segments that are the best candidates for highly
cost-effective CHP. The results of the assessment of capital grants are summarized in Figure 20.
41 | brattle.com
Figure 20: The Impact of Capital Grants on Market Potential at Current Domestic Prices (2040)
F. SUMMARY OF CONCLUSIONS FROM ECONOMIC/MARKET POTENTIAL ANALYSIS
At current domestic prices, there is a significant amount of economic potential in the KSA but
with only very marginal cost-effectiveness. The benefits of CHP only slightly outweigh costs
and the vast majority of CHP applications have a benefit-cost ratio of less than 1.2-to-1. For
most customers, the payback period associated with CHP investment is long (more than 11 years
in most cases). This will lead to very little adoption of CHP outside the refining sector, as is
currently the case in the KSA.
However, if fuel is valued at multiples of the current domestic price that are more aligned with
the unsubsidized prices of the international market, there is an opportunity for a significant
amount of highly cost-effective CHP adoption. Specifically, at multiples of 5x to 10x current
domestic prices, there are between 1.5 GW and 6 GW of CHP projects with a payback of less
than five years, making these projects attractive candidates for new CHP policy. Most of this
cost-effective potential is concentrated in bottoming cycle applications. Since bottoming cycle
applications typically do not generate more electricity than would be consumed on-site by the
facility, the export price is not an important consideration for these customers. Iron and steel is
the industry segment with the largest share of this potential.
CHP potential is even larger at slightly longer payback periods. At multiples of 5x to 10x
domestic prices, there is more than 30 GW of potential with a payback of six to eight years. This
potential is concentrated largely in the petrochemicals segments and much of it is in topping
cycle applications. For these customers, unlike with bottoming cycle applications, the export

42 | brattle.com
price is a critical factor driving the payback, since the CHP plant is likely to generate
significantly more electricity than will be consumed on-site.
Energy prices are the key driver of these findings. If fuel prices rise, the economic attractiveness
of CHP will improve. This applies not only to the price of fuel but also to the price of electricity.
From the perspective of the private investor in CHP, retail electricity rates that are subsidized
even below the already subsidized cost of producing electricity are further limiting willingness to
invest in the technology. Additionally, the export price will be a key determinant of whether or
not investment is made in large topping-cycle applications. The current export price in the KSA
undercompensates sales of electricity to the grid and is too low to support significant investment
in CHP.
While changing the prices and removing rate subsidies is the economically efficient way to
address these issues, it is not the only option. Policies such as capital grants are another way to
facilitate the adoption of cost-effective CHP. Other non-financial barriers exist and should be
addressed through new policy initiatives. That is the focus of Chapters V and VI.

43 | brattle.com
V. Barriers Assessment
The assessment of barriers to CHP deployment in the KSA represented the third step of our
analysis.
In the context of our overall task of developing a CHP roadmap for the Kingdom of Saudi Arabia
(KSA), this report identifies key barriers to the deployment of cost-effective (either privately or
from the Kingdom’s perspective) CHP applications. Barriers are identified in part based on a
review of international experience with CHP, since it is likely that some of the barriers identified
elsewhere, especially in places with significant economic potential for CHP, will also be
applicable to the KSA. This international barriers benchmarking is complemented with a KSA-
specific barriers assessment, which in turn is based on qualitative stakeholder interviews in the
KSA. The primary conclusions of our barriers assessment were presented in Riyadh in January
2015. Those conclusions are summarized below. The full presentation is included in Appendix F.
A. INTERNATIONAL BARRIERS ASSESSMENT
Since many barriers to deployment of cost-effective CHP will likely be similar across countries
and jurisdictions, we conducted a review of the international literature on CHP barriers (as well
as proposed policy solutions) as a starting point of our KSA CHP barriers assessment. The
multiple studies we reviewed are listed at the end of this report. They broadly reflect the
experience in the United States and many of the key European countries having deployed, or
attempted to deploy, significant amounts of CHP.
Broadly speaking, the barriers identified fall into the following categories:
1. Economic and Financial
2. Regulatory
3. Informational/Behavioral
Below we address each set of barriers in more detail.
1. Economic and Financial Barriers
Several economic and financial barriers to deployment of cost-effective CHP applications have
been identified. They include:
1. Large upfront capital investments
Like many energy efficiency investments, CHP requires significant incremental upfront
investments resulting in cost savings that accrue over sometimes many years. Financing
such upfront investments can be particularly challenging for smaller companies without
full access to capital markets (i.e. without the ability to borrow easily from banks,
especially since the savings from CHP don’t result in an explicit cash flow that can be
used as collateral for bank loans).

44 | brattle.com
2. High Hurdle Rates for CHP
Many CHP projects, even if they have net economic benefits to the project owner (in the
sense of having a positive net present value if discounted at rates reflecting the objective
risks of such projects) do not get pursued because potential project owners require short
payback periods. Short payback periods are essentially equivalent to private CHP owners
applying significantly higher discount rates than those reflecting the objective risks of
such projects. It could of course also be true that actual risks of CHP projects are higher
than those assumed by standard analyses of CHP, which essentially use discount rates
that are similar to discount rates used for similar investments, such as for power
generation sources more broadly. There is considerable evidence that CHP project costs
are highly project specific and can only be known with certainty well into the CHP
development process. A higher range of likely project costs at the point of decision
making could lead to objectively higher project risks. Beyond project specific risk factors,
private CHP owners may also be worried about the risks related to CHP performance
relative to the risks of alternative sources of the same inputs (steam, power). If boilers can
be operated with very high levels of reliability and grid-supplied electricity is also
relatively reliable, CHP may be perceived to cause interruptions in production with
higher probability than using conventional boilers and grid-supplied electricity. The
resulting financial damages could lead to private perceptions of risk related to CHP that
far exceed the risks of conventional operations. Finally, even though economic theory
suggests that firms should pursue all projects with positive net present value, in reality
firms operate with limited organizational capabilities and well defined annual capital
budgets. These constraints mean that CHP projects have to compete both for
organizational attention and money with other projects a company could pursue. This
often legitimately leads to hurdle rates above project-specific discount rates for CHP.
3. Unfavorable economics of financial interactions with the rest of the grid
Beyond capital costs, there are a number of other factors affecting the overall economics
of CHP projects. Unfavorable conditions are generally identified in three areas: rates for
selling excess power from CHP to the grid/market; the design of stand-by rates in ways
that are perceived to discriminate against CHP; and power prices not fully reflecting
various benefits provided by CHP, such as avoided greenhouse gas emissions.
A discussion of the value of CHP power injected into the grid is beyond the scope of this
report. However, internationally, the absence of an attractive rate for excess power sales
is cited as a barrier. Whether or not this barrier is legitimate depends on whether not
terms for selling excess power represent the actual value of such power or not. In some
countries, access to net energy metering (NEM) offers relatively attractive conditions for
selling excess power in that NEM allows CHP customers to avoid the full variable retail
electric rate, which tends to represent more than just the value of energy.21 Often, NEM
21 In particular, in many instances various types of fixed costs for energy, transmission and distribution
are recovered through volumetric rates that can be avoided through NEM.
45 | brattle.com
rates are more attractive than wholesale prices for power (and capacity), so absence of
NEM opportunities is cited as a barrier, even though it is unclear how much the value of
excess sales of CHP power to the grid exceeds wholesale prices (if at all).
A second and more important topic concerns the levels and types of stand-by charges that
are levied on CHP customers for the provision of various services. Stand-by rates, when
properly designed, compensate the electric system for providing services to CHP
customers. However, there is a concern that stand-by rates can be designed in ways that
discriminate against CHP. If this is the case, discriminatory stand-by rates can constitute
an important barriers to CHP development. We discuss stand-by charges as a regulatory
barrier in more detail below.22
Finally, it is argued that as long as market prices don’t fully reflect various externalities
avoided by CHP, compensation for CHP based on market prices does not provide
revenues equivalent to the value of power produced from CHP plants. The most
frequently cited example is greenhouse gas emissions. By increasing the overall efficiency
of electricity and heat production, CHP typically lowers total greenhouse gas emissions
relative to alternative and standard power and heat generation approaches. In many
countries, the value of greenhouse gas emissions is either not or not fully internalized in
electricity prices. In other words, the estimated damaging effect of greenhouse gases is
not reflected as a cost in market prices and therefore CHP is not compensated for helping
avoid these costs.
4. Natural Gas Price Volatility
Another financial barrier for CHP identified internationally is the relatively higher
volatility of natural gas prices when compared to electricity prices. This barrier affects the
riskiness (and hence the implied discount rate) of CHP projects relative to purchasing
power from the grid and making steam conventionally. It is likely true that in general
natural gas prices over the relevant time horizon of several years tend to be more volatile
than electricity prices. This is because in most electric systems electricity is generated
from a portfolio of technologies and thus prices in electricity markets tend to provide
some diversification against the volatility of fuel prices for any one of the several fuels
used in production. As a consequence, the cost of fuel for CHP may be less certain than
the cost of purchasing electricity, which in turn increases the risk, or at least the
perceived risk, of CHP.
5. Cost impact on rest of electric system
One final area of barrier that could be considered economic is that there could be higher
costs to the overall electric system not captured by the economics of CHP alone. In
particular, comparing power generation from CHP with power generation from stand-
alone power generators, CHP generation profiles will be governed by the underlying
22 For a broader discussion of stand-by rates and stand-by rate design, see SEE, Guide to the Successful
Implementation of State Combined Heat and Power Policies, Chapter 2, March 2013.
46 | brattle.com
steam demand of the industrial (or commercial) steam host. This restricts the flexibility of
operating the electric power system overall and hence may create additional costs of
maintaining system reliability, which, at significant levels of CHP penetration and
depending on other constraints on system operations, could become significant.
2. Regulatory Barriers
Beyond economic and financial barriers, there are also a number of regulatory barriers frequently
cited as obstacles to the deployment of cost effective CHP.
Primary regulatory barriers include:
1. Discriminatory Interconnection Practices
Internationally, the complexity of the interconnection process, the time required to
obtain interconnection, and the costs associated with interconnection for CHP are all
cited as significant regulatory barriers for CHP.
2. Unfair stand-by charges and other unfair utility rates
In addition to the economic barrier they represent, internationally, rates/tariffs offered to
CHP plants are also mentioned as a major regulatory barrier to CHP deployment. For the
most part, these rates concern payments other than the volumetric payments per MWh of
electricity consumed. In particular, in most advanced electricity markets, rates for
commercial and industrial customers, i.e. those customer groups most likely to install
CHP systems, are composed of fixed customer charges, some form of a demand charge,
and energy charges. There are also instances where utilities are requiring CHP customers
to be subject to a different rate altogether and, under this rate, are required to pay
additional charges, such as stand-by charges, which in turn tend to be a function of the
maximum demand from the utility during a defined time period. It is important to be
aware of the issues that arise under more complex retail rates as the KSA moves forward
with electricity market reforms.
In general, from a CHP project’s perspective, the benefits of CHP are increased the more
electricity bills are reduced proportionally with the reduced electricity purchases from
the utility/market. The current KSA practice, i.e., a simple volumetric electricity rate,
means that CHP electricity production reduces a CHP customer’s electricity bill
proportionally to the CHP unit’s electricity production. From society’s perspective,
savings may be lower if and when volumetric electricity rates include costs that are not
avoided by the CHP electricity production. For example, stand-by charges attempt to
capture the need by the incumbent utility to provide back-up generation in case of an
unexpected outage by a customer’s CHP unit. As long as the utility is required to provide
a CHP customer with electricity in such an outage event, the costs corresponding to
providing this electricity (and the associated capacity) do not disappear with the
installation of a CHP unit. Hence, rate structures that recover unavoidable system costs

47 | brattle.com
from CHP customers will reduce the incentives to private CHP developers and therefore
are a barrier to CHP deployment, but they are not necessarily the type of barrier that
should be removed since, from society’s perspective and if properly constructed, they
may represent societal costs that reduce the value of CHP.
Differentiating discriminatory rate structures from economically efficient ones is a
complex task beyond the scope of this report. At a high level, the design of rates
including stand-by rates should be based as much as possible on underlying costs and
recognize the ability of both the electric system and a CHP plant to provide services that
may be partial substitutes. Stand-by rates should be guided by actual costs imposed by a
CHP plant on the larger electric system and allow for CHP plants to choose whether to
demand services from the electric system or to either live without or self-provide certain
services typically provided by the electric system – such as back-up power during various
situations such as scheduled or unscheduled outages.
3. Regulatory Treatment of CHP
A hurdle related to standby rates and interconnection involves the treatment of CHP for
purposes of determining interconnection and stand-by rate terms. In particular, in some
states in the United States, CHP facilities are assumed to have no local load when
determining the size of required interconnection or stand-by services. In other words, if a
100 MW CHP plant has a minimum local electricity demand of 50 MW, the
interconnection may be required to sized for a 100 MW plant instead of a 50 MW plant.
This is mentioned as a hurdle since it may increase the cost of interconnecting to the grid.
Whether or not this concern is justified potentially depends on the way the CHP unit is
used as part of the broader electric system.
4. Environmental permitting rules
Finally, CHP units above a certain size tend to require a number of permits, including
various environmental permits (air emissions, noise, etc.). In many countries,
environmental and other permits are determined locally and hence are subject to
significant variation depending on where a CHP project is located. The variation in local
permitting requirements by themselves create a barrier to CHP deployment, since
maneuvering a multitude of local permitting rules leads to significant costs for potential
CHP developers.
3. Informational/Behavioral Barriers
Finally, a number of informational/behavioral barriers have also been cited as obstacles to the
deployment of cost effective CHP. The most often cited informational barrier to CHP is simply
the absence of sufficient knowledge and awareness about the costs and benefits of CHP. This is
sometimes related to the fact that potential CHP host’s core business is not CHP so that
organizational focus is not on CHP opportunities, but on expanding the profitability of core

48 | brattle.com
business operations. A third behavioral barrier mentioned in the literature describing CHP
barriers is general organizational inertia, i.e. the fact that (especially outside the core business)
companies tend to be slow at adopting new technologies and approaches, even if they are cost-
effective.
B. SPECIFIC CHP BARRIERS IN THE KSA
To understand to what extent internationally identified barriers were applicable to the specific
KSA context and to what extent there were KSA specific barriers to CHP deployment in the KSA
we conducted a number of stakeholder interviews. A number of these interviews were
conducted on an individual basis by EcoSolutions. Also, several stakeholder workshops
conducted at ECRA involved sessions identifying perceived KSA specific barriers. In practice
these barriers may or may not accurately reflect true conditions and in themselves could be part
of a wider set of informational barriers.
Among the international barriers identified above, a number do not (currently) apply at a
significant level to the KSA. In particular, the very significant barriers related to stand-by rates
do not currently appear to be a major barrier by themselves as the KSA’s rate structure is largely
volumetric and current stand-by charges relatively modest.23 However, as the KSA reforms its
broader energy system, it is quite possible that stand-by rate design will become a more
significant issue.
Another barrier not currently directly important for the KSA is the concern that various
externalities are not fully priced into wholesale market prices. Not only does the KSA currently
not have a wholesale market for electricity, greenhouse gas emissions currently do not play a
major role in determining either capital investment or the dispatch of power generation.
Nonetheless, the idea that not all social costs are fully priced into electricity prices is a very
important barrier in the KSA, namely in the form of the electricity retail rate not fully capturing
the value of domestic fuel prices and domestic fuel prices not representing national fuel values.
Indeed, as shown in Section IV above, this likely represents the single most important barrier to
CHP development in the KSA.
23 Per ECRA’s Administrative Decision #4 dated December 4, 2013, Transmission Use of System (TUS)
charges for customers fully or partially self-supplying electricity (which would include CHP hosts) are
responsible for providing 11.5% reserve capacity or else pay SEC SAR 382,500/MW of reserves per
year, which translates into a charge of approximately $11.71 per MW of installed CHP capacity per
year. CHP hosts are also responsible for paying SAR 125,000 per MW of peak demand, which is
equivalent to approximately $33.33/kW of peak demand per year. For CHP, peak demand is the
maximum withdrawal from the grid (i.e., the maximum amount needed on-site and not provided by
CHP). In most cases, CHP capacity results to net exports to the grid so that the TUS charge would
typically for an amount of MW less than the CHP capacity.
49 | brattle.com
A second important KSA-specific barrier is the difficulty and uncertainty associated with selling
excess power generated from CHP units to the grid. In the absence of a functioning wholesale
market compensation for electricity injected into the grid by third parties is limited to the prices
currently stipulated in the Transmission Use of System (TUoS) charges. These rates, while
providing some certainty, require further work to better reflect the value that CHP provides to
wider Kingdom objectives such as improving utility sector efficiency and diversifying electricity
supply.
A third important KSA specific barrier identified in stakeholder interviews is the uncertainty
about fuel allocation for fuel needed to power CHP. In the KSA, there is no open market for fuels
such as liquids or natural gas. CHP projects must apply for a fuel allocation. Uncertainty about
whether or not fuel will be allocated significantly increases the risk to a potential CHP project.
A forth KSA specific barrier is related to the existing cross-subsidies between rate classes.
Specifically, at present commercial (and certain industrial and government customers above a
certain size) tend to cross-subsidize customers in other rate classes. Because of this, reduced sales
to commercial customers reduce the revenues required to cover costs while maintaining the rates
to other customer classes. In essence, the revenue shortfall would result in SEC not covering its
costs. Our interviews with key stakeholders suggest that in light of this issue ECRA is being
perceived as being reluctant to grant cogeneration licenses in particular to commercial
applicants.
A final potential barrier cited by our stakeholders was the uncertainty related to the availability
and cost of important CHP replacement parts, many of which would typically need to be
imported.
C. CONCLUSIONS FROM BARRIERS ASSESSMENT
Our barriers assessment suggests that CHP faces a number of barriers, many of which are also
important in the specific context of the KSA. The combination of high upfront capital costs,
relatively high private hurdle rates translating into relatively low adoption rates for projects with
long payback periods, very low domestic fuel prices and additional subsidies embedded in retail
electric rates create a difficult environment for CHP in the KSA and explain the relatively small
market potential we found at current domestic prices.
Additional important barriers to CHP deployment in the KSA, which could further reduce
market adoption, are uncertainties about fuel allocation and the received value of power
exported to the grid.
Also, a number of informational barriers, present in many countries including the KSA, suggest
that the level of information about CHP will need to increase significantly to help CHP projects
become options that are being evaluated on a regular basis.

50 | brattle.com
In the final section of this report, we summarize policy solutions that have been proposed and
applied in the international context and, finally, our own set of policy options we deem most
appropriate in light of the specific circumstances in Saudi Arabia.
51 | brattle.com
VI. Policy Recommendations
Accounting for the economic and market potential for CHP in the KSA as well as typical barriers
to CHP deployment, both from an international and KSA-specific perspective, our final task was
to develop recommendations for policy solutions to support development of CHP opportunities
deemed sufficiently beneficial to the KSA but likely not adopted (or not sufficiently adopted) by
private parties given the presence of barriers to their realization in the KSA. In the context of
these policy solutions, Appendix G includes a review of electricity laws and regulations related to
CHP in the KSA.
A. APPROPRIATE SCOPE OF POLICY GIVEN ECONOMIC/MARKET POTENTIAL
Rather than simply proposing that the KSA adopt policy measures used elsewhere to support the
development of CHP, it is important to base policy recommendations on the specific set of
challenges and opportunities in Saudi Arabia.
Our previous discussion highlighted that many of the barriers identified elsewhere in the world
are also relevant in the KSA. However, in addition, the following KSA-specific factors should
drive the development of policy options:
First, the Kingdom is currently undergoing significant sector reforms. We are in
particular aware of ongoing efforts to create a well-functioning wholesale market for
electric power. Since the issues for CHP in a wholesale market environment are different
in several ways from the issues for CHP under the current, vertically integrated system
(and without a real system of prices), the future design of wholesale markets is likely to
have a significant impact on the incentives for CHP.
Second, since CHP is a technology that in general uses additional capital expenditure to
create a more energy efficient system (and thus save fuel), the cost/value of fuel is a
crucial factor influencing the economics of CHP from the perspective of both a private
party and society. We understand that there are ongoing discussions concerning how
domestic fuel should be priced in the future, given current and expected future
production costs on the one hand, and global market prices on the other hand. As our
CHP potential analysis has shown, whether or not domestic fuel prices rise has a
significant impact on likely private adoption of CHP. In particular, if CHP policies are put
in place to overcome barriers that prevent the deployment of CHP that is beneficial from
society’s perspective while fuel prices remain low, policies will likely be necessary to
change the decisions of private parties facing lower fuel prices.
Third, the assumption that future baseload electricity generation sources will be powered
by natural gas has a significant impact on the benefits of CHP from the Kingdom’s
perspective. Since the most widely used fuel for CHP is also natural gas, assuming that
future central station power generation will be fueled with natural gas implies that CHP
produces less fuel savings than under the assumption that natural-gas fired CHP would
52 | brattle.com
displace some oil-fired generation.24 As a result of this assumption, the economic benefits
of CHP are largely driven by natural gas savings and oil savings due to not having to burn
oil in boilers. These savings are not sufficient under current domestic fuel prices to
overcome the increased capital expenditures due to CHP. Even at multiples of five or ten
times current domestic fuel prices, cost-effective CHP with acceptable payback periods is
limited to a relatively small number of industrial sectors.
This suggests that the focus of policy in the Kingdom should likely be on providing policy
support for CHP deployment in those sectors. In addition, broad power sector reforms should
help improve the economics of CHP in ways described below. Also, as we will suggest, there are
likely some relatively simple policies targeting CHP more generally that could easily be adopted
and which would help CHP development where CHP is economical, now and in the future.
Against this backdrop, we provide a brief overview of policy solutions pursued internationally,
followed by a discussion of how energy-sector level reforms (wholesale and retail) would help
improve the landscape for CHP, and finally discuss specific CHP policy approaches we
recommend for the KSA.
B. INTERNATIONAL POLICY OPTIONS
Before discussing KSA-specific policy proposals, in this section we provide a brief overview of
CHP policies deployed internationally. To the extent KSA barriers to CHP deployment are
similar or identical to barriers encountered elsewhere, these policies represent important options
for the KSA to consider when implementing its own CHP policies.
Broadly speaking, policy choices fall into three categories. They are policy choices to address (a)
financial/economic barriers, (b) regulatory barriers, and (c) information and behavioral barriers.
To address financial and economic barriers, the primary policy tools used internationally include
production subsidies in the form of feed-in-tariffs for CHP, certificates or net metering as well as
capital support, which can take the form of tax incentives, direct capital grants, or access to low
interest rate debt.
In the United States, federal support for CHP includes a 10% investment tax credit for qualifying
CHP facilities with capacity of 50 MW or less.25
States have various local and regional policies to incentivize CHP technology investments.
Primary state level policies that motivate the development of CHP and Waste Heat to Power
(WHP) are: Renewable Portfolio Standards (RPS), Alternative Energy Portfolio Standards (APS)
24 In industrial application, CHP will still save some liquid fuels as CHP will typically displace a boiler
used for steam production, with boilers predominantly burning heavy fuel oil.
25 http://www.dsireusa.org/incentives/incentive.cfm?Incentive_Code=US02F (accessed February 12,
2015)

53 | brattle.com
and Energy Efficiency Resource Standards (EERS). State targets for CHP capacity are usually
determined as a share of quantity of the total renewable generation. About half of the states in
the union include CHP in their policies. Figure 1 and Figure 2 show the states with RPS and
EERS programs with CHP. In general, CHP plants that qualify under a state’s RPS, APS or EERS
earn credits per unit of power generated from the CHP facility. These credits are purchased by
utilities, which by law have to procure a certain number of certificates in any given year. In this
sense, these programs have the effect of providing a per kWh production support similar to a
feed-in bonus (a fixed premium above market revenues), with the amount of the premium
determined by the market price for certificates.
In addition, states also provide capital grants to CHP plants. For example, Massachusetts offers
capital grants of between $750/kW and $1,200/kW for CHP systems smaller than 150kW, with
the amount of the grant depending on the benefit-cost ratio of the project.26 There are also
incentives for both new CHP projects and retrofits, again with grants depending on the
perceived level of benefits relative to costs. Under California’s self-generation incentive program,
which covers CHP and other technologies, CHP units powered by non-renewable fuel receive up
to $480/kW. The maximum incentive to any CHP facility is $5 million and requires a minimum
customer investment of 40% and the payment is capped at 3 MW.27
26 KEMA, 2013. Massachusetts Combined Heat and Power Program Impact Evaluation 2011-2012. See
also Combined Heat and Power (CHP). A Guide to Submitting CHP Applications for Incentives in
Massachusetts 2013 27 See EPA Database of Combined Heat and Power Partnership (dCHPP), 2014. CHP Policies and
incentives database.
(http://www.epa.gov/chp/policies/incentives/caselfgenerationincentiveprogram.html)
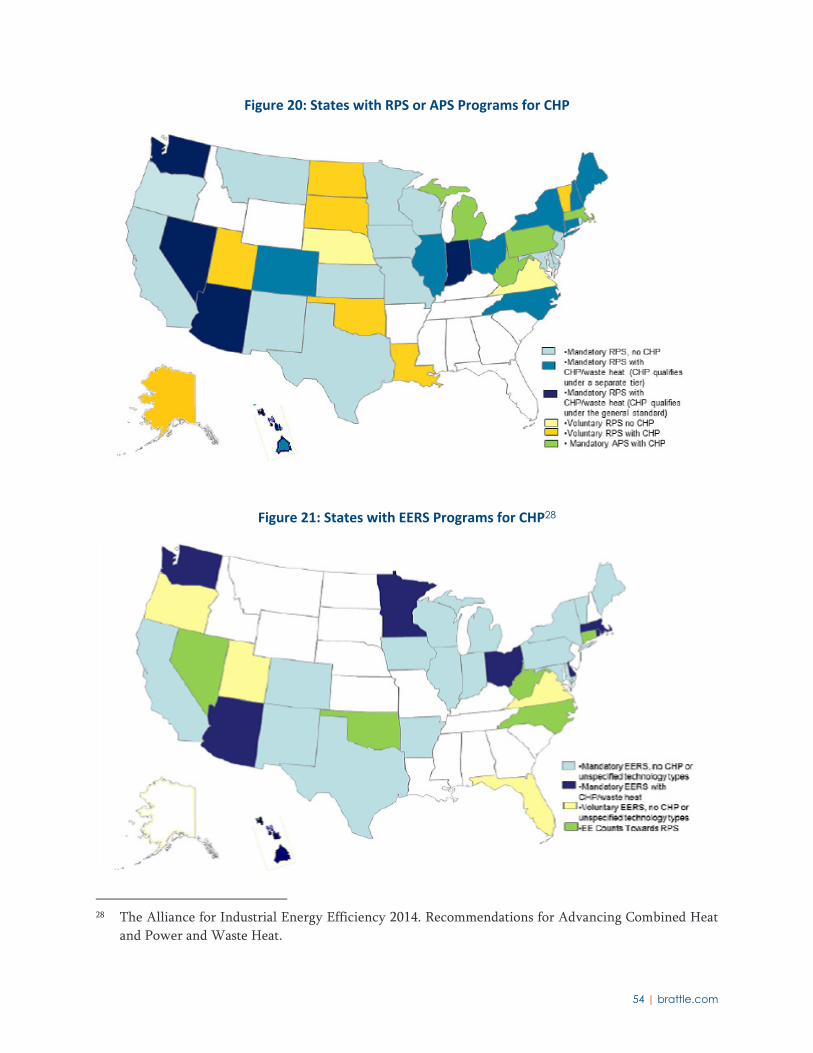
54 | brattle.com
Figure 20: States with RPS or APS Programs for CHP
Figure 21: States with EERS Programs for CHP28
28 The Alliance for Industrial Energy Efficiency 2014. Recommendations for Advancing Combined Heat
and Power and Waste Heat.
55 | brattle.com
Soft loans are an alternative to direct capital grants and have the advantage that they don’t
require large net outlays for the supporting entities. Soft loans are a tool that is often being used
to support infrastructure development deemed in the public interest. For example, major
development banks such as the European Bank for Reconstruction and Development provide low
interest rate loans for a multitude of such projects. Soft loans are often available for certain types
of CHP projects. For example in the United Kingdom, zero interest rate loans are available for
various public sector energy efficiency investments including CHP.29 Similarly, both the World
Bank and the Asian Development Bank have been providing soft loans for CHP and district
heating investments in China and other Asian countries.30 Kreditanstalt für Wiederaufbau
(KfW), Germany’s internal development bank, provides low interest loans for small scale CHP
projects.31
Some U.S. states allow net metering for smaller CHP applications. Under net metering, CHP
customers can offset retail rates (which tend to include various network fees in addition to
energy charges) for all power generated by a CHP unit including power exported to the grid, as
long as total energy production from a CHP unit is less than or equal to total energy consumption
over some time period. Minnesota has an explicit net metering policy in place for CHP systems
smaller than 40 kW.32
Finally, California offers a feed-in tariff for CHP output. The program covers new, small CHP
systems (less than 20 MW) operating above 62% efficiency.33
Feed-in tariffs or rather premiums are used as the primary financial support mechanism for CHP
in Germany. The law governing the support of CHP in Germany has been modified repeatedly.
In its latest version, new CHP projects receive a feed-in premium between 1.8 and 5.4
eurocents/kWh of gross electric production, with the premium smaller for larger projects (1.8
eurocents/kWh for projects above 2 MW). For electricity consumed on-site, CHP units not only
receive the feed-in premium, but also avoid energy and network charges they would otherwise
incur. For electricity exported to the grid, CHP owners also receive the market price for
electricity as determined by the wholesale market. Total support through feed-in premiums is
limited to €750 million per year.34
29 Salix is a publicly funded UK lender providing zero interest rate loans to qualifying CHP projects. See
http://www.salixfinance.co.uk/knowledge-share/technologies.
30 http://www.cospp.com/articles/print/volume-10/issue-5/features/supporting-chp-and-district-energy-
system-development-in-asia.html
31 http://www.blockheizkraftwerk-bhkw.net/foerderung (in German).
32 Minnesota Combined Heat and Power Fact Sheet 2013. Great Plains Institute and American Council
for an Energy-Efficient Economy.
33 http://www.cpuc.ca.gov/PUC/energy/CHP/feed-in+tariff.htm
34 For more details on the German CHP law and its provisions, see IHK Projekte Hannover, Förderung
Von Kraft-Wärme-Kopplungsanlagen (in German).
56 | brattle.com
To address or overcome regulatory barriers, a number of countries have created simpler
permitting processes, interconnection standards and to improve design of standby rates35 (or
exempt certain CHP facilities from such standby rates.
The literature on the proper design of stand-by rates is large and complex, and while a detailed
discussion of the many issues involved in designing stand-by rates is beyond the scope of this
report, a recent report by the State & Local Energy Efficiency Action Network (SEE Action)
provides a detailed overview of stand-by rate design issues as well how to design such rates in
ways that don’t discriminate against CHP.36 In the spirit of creating simpler regulations for
smaller installations, relatively small CHP systems are sometimes exempt from some or all
standby rates. For example, Minnesota exempts CHP systems under 100 kW from any and all
standby rates.37
Streamlining interconnection standards is another element of creating a more favorable
regulatory environment for CHP. As with standby rates, regulatory practice for interconnection
in particular of small CHP systems has evolved significantly. In many cases, very small CHP
systems can be connected for small interconnection fees and using simple and quick
interconnection protocols.38 To name just one example, the state of Maine has implemented a
simplified interconnection standard that also charges very low fees for small CHP units ($50 for
systems smaller than 10 kW).39 It should be noted that most incentive measures in countries with
significant CHP programs target smaller CHP applications since markets are generally deemed to
be well established to provide sufficient signals for larger scale CHP applications. The measures
used to address barriers nonetheless provide useful information for the KSA, where the largest
amount of economic potential is for larger scale CHP plants as described in Section IV above.
In terms of addressing informational barriers, several countries and regions use technical
assistance programs. For example, the United States launched seven regional Technical
Assistance Partnerships (TAPs) to help increase CHP awareness and ultimately deployment.40
Several U.S. states also have CHP pilot programs, which provide cash incentives and are intended
to increase awareness and the understanding of CHP in general or in specific sectors. For
35 Standby rates are rates charged by utilities for services used by CHP and other distributed generation
sources. They include payments for back-up power and capacity during planned and unplanned
outages.
36 See SEE Action, Guide to the Successful Implementation of State Combined Heat and Power Policies,
March 2013, Chapter 2.
37 Minnesota Combined Heat and Power Fact Sheet 2013. Great Plains Institute and American Council
for an Energy-Efficient Economy.
38 For a detailed discussion, see SEE Action, Guide to the Successful Implementation of State Combined
Heat and Power Policies, March 2013, Chapter 3.
39 For a description of Maine’s rationale for picking a standardized interconnection standard, see Todd J.
Griset, Maine’s CHP Interconnection Standards: Lessons and Best Practices, October 8, 2012
40 http://www.energy.gov/eere/amo/chp-technical-assistance-partnerships-chp-taps
57 | brattle.com
example, a CHP pilot program in the state of Illinois provides cash incentives for CHP projects
aimed at increasing energy efficiency of local governments, municipal corporations, public
school districts, community college districts, public universities, and state/federal facilities.41
While not being a complete list of international practices, the above policy solutions represent a
good cross-section of the types of policies applied internationally to overcome identified CHP
barriers. In the next section, we discuss which of these policy approaches are likely most
appropriate for the KSA and to what extent KSA-specific policy solutions should also be
developed. We divide our discussion of policy options for the KSA into a discussion of how
general energy sector reforms could and should include measures that will help address some
barriers to CHP deployment before discussing policy options specifically targeting CHP in the
KSA.
C. POLICY RECOMMENDATIONS IN THE BROADER CONTEXT OF ENERGY SECTOR REFORM
Based on our review of international policy options and our previous work on and current
understanding of ongoing efforts to reform elements of the KSA’s electricity (and larger energy)
sectors, we suggest that elements impacting CHP, in particular in terms of overcoming existing
barriers to the deployment of cost effective CHP, be carefully considered as part of ongoing
reform efforts. The list of recommendations provided below does not apply to CHP alone, but
rather represents steps that will create a more level playing field for CHP alongside other
solutions by removing barriers largely related to KSA-specific circumstances, most notably the
lack of fully developed wholesale markets, relatively simple retail rate structures, and a policy of
pricing fuels domestically at rates likely below national values (and certainly below international
prices).
Simplified Interconnection Process
The vast majority of power supply sources in the KSA are connected to the system at the
transmission level. Internationally CHP tends to be a resource located at the distribution level
and not necessarily based on the optimal network location, but rather based on the location of an
appropriate host for the waste heat or steam of a CHP facility. In Kingdom most of the identified
opportunities are large-scale and as such likely to be connected at higher voltage levels. For
smaller scale plant the required interconnection process is similar to the ongoing efforts to allow
large scale (and potentially distributed) renewable energy resources to connect to the grid. To the
extent there is a broader move away from SEC-led power plant construction and towards an
approach more heavily relying on Independent Power Producers (IPPs), location choices in the
future may also be driven by factors other than those traditionally considered by SEC. As a
consequence, we recommend developing a more general framework guiding new generator
interconnection that appropriately balances the need for detailed information about any new
41 https://www.illinois.gov/dceo/whyillinois/KeyIndustries/Energy/Pages/CHPprogram.aspx
58 | brattle.com
generators impact on the grid and the need by applicants to have clarity about costs and
timelines for interconnection. We understand that proposals for interconnecting renewable
(including DG) sources have been submitted to ECRA and we suggest that these proposals could
serve as a basis for developing more general principles of interconnection. Streamlined
interconnection processes (and inexpensive interconnection for small scale CHP) have been an
international response to a perceived barrier to CHP deployment. Based on our analysis, it is
likely that the near term potential for economic CHP in the KSA is for relatively large-scale CHP
plants. Nonetheless, it is likely that the location of the steam host (or provider in the case of
bottoming cycle applications) will be the primary driver of location choice so that the discussion
underlying the proposed interconnection protocol for grid-connected renewable energy sources
(and for IPPs) should serve as useful guidance.
Sidebar 1: Evidence of Successful CHP Policies
Understanding which CHP policies have proven successful elsewhere is obviously an important basis
for designing CHP policies for the KSA. Unfortunately, the evidence on what policies have been
successful is sparse, in part because success can be measured in many ways and because, to our
knowledge, there has been little effort to understand quantitatively which policies work better than
others.
Perhaps the recent Call for Evidence by the U.K. Department of Energy and Climate Change
regarding tackling non-financial barriers to CHP42 is an indicator of the need for a more empirical
investigation of the success of CHP policies to-date. Also, in a response to this Call for Evidence, the
Association for Decentralised Energy stated that it is unaware of any evidence of the success of
policies in other countries tackling non-financial barriers.43 Two items mentioned in the Association’s
response are the likely beneficial effects of funding feasibility studies and awareness efforts. However,
the Association makes no claims about the evidence of such activities being successful.
In 2009, the International Energy Agency (IEA) published what it termed the most effective CHP
policies, based on a number of country case studies.44 The IEA groups policies into six categories and
identifies best practices for each. For financial and fiscal support (1), capital grants (New York) and
feed-in tariffs (Germany) are identified. For utility supply obligations (2), the green certificate scheme
in Belgium is mentioned. For local infrastructure and heat planning (3), UK building regulations are
mentioned. For climate change mitigation (4), the EU Emissions Trading Scheme is highlighted. For
interconnection measures (5), the United States interconnection standards are picked. And for
capacity building and outreach (6), Japan’s fuel cell CHP Research and Development Programme is
mentioned.45
42 U.K. Department of Energy & Climate Change, Call for Evidence: Tackling Non-Financial Barriers to
Gas CHP, February 2015
43 The Association for Decentralised Energy, Response to non-financial barriers to gas CHP, March 30,
2015, Answer to question 11, page 5.
44 IEA, Cogeneration and District Energy, 2009, page 18.
45 Ibid, pages 18-29, which provide best practice examples in more detail for each category.
59 | brattle.com
Predictable price and terms for excess power sales
An important barrier identified in the KSA (and to some degree internationally) is the absence of
certainty regarding the value exported electricity provides and related conditions of selling
excess power from a CHP plant. Internationally, the issue tends to be that, unlike self-
consumption of electricity generated by the CHP unit, excess sales are not compensated at the
full retail rate and hence tend to have lower value. This relates to some extent to the broader rate
structure including standby rates discussed above.
In the KSA, because of low domestic fuel prices the current price for exports does not accurately
reflect the value that CHP provides and as a consequence, revenues from such excess sales
particularly for CHP technologies with high power to steam ratios (the most efficient ones for
topping cycle applications) are likely to be uneconomical.
In countries with well-established wholesale markets for electricity, it is generally possible for at
least bigger CHP plants to sell excess power directly (or indirectly via some aggregator/broker)
into wholesale markets at prevailing market prices. We understand that efforts are underway in
the KSA to transition towards more competitive wholesale markets over time. Ultimately, these
markets should provide a platform for selling excess power. In the meantime, however,
promising topping cycle CHP applications are unlikely to be implemented (and for that matter
are not economical) in the absence of a mechanism for accurately compensating excess power
sales to the Saudi electric system. For this reason, we recommend reviewing the standard tariff
rates for selling excess power generation from CHP to the grid (SEC/NGSA). To better develop
such a rate, we recommend as a starting point the methodology proposed to ECRA for selling
electricity from renewables to the grid. This methodology recognizes the energy and capacity
value of resources, but also that at this point relatively simple approaches are likely preferable to
more complex tariff designs. For example, sales of excess energy to the grid should be
compensated at SEC’s avoided (variable) costs including the value of both energy and capacity
and to the extent possible be differentiated by time period (peak and off-peak). To provide
consistency, tariffs should be similar or identical for any and all resources proposing to inject
power to the Saudi grid.
Remove cross-subsidization in retail rates
One important KSA-specific issue impacting private incentives for CHP is the current retail rate
structure for electricity. In particular, residential rates are below the average cost of providing
service. On the other hand, commercial and some government/industrial rates are currently
potentially above the average cost of providing service. This means that in practice some rate
classes (commercial, some government/industrial) are cross-subsidizing other rate classes
(residential). In this environment, loss of sales from customer classes that cross-subsidize other
customer classes can lead to a shortfall in total revenues relative to those revenues needed to
cover the total cost of providing service. As described above, our stakeholder interviews suggest
this cross-subsidization is perceived as having likely prevented ECRA from granting cogeneration

60 | brattle.com
licenses in the past – primarily on the grounds of avoiding revenue shortfalls for SEC that would
result from lower sales to commercial customers.
More general reforms to the retail pricing structure would help remove the current impediments
to granting cogeneration licenses due to fears about loss of revenue needed for cross-
subsidization. There are two levels of reforms that would be beneficial:
First, finding ways to remove the cross-subsidization across rate classes would minimize
the impact of losing sales from a rate class cross-subsidizing others as a result of CHP
applications. This can in theory be accomplished by increasing subsidized and decreasing
subsidizing retail rates so that ultimately rates within each rate class represent the average
cost of providing service to that rate class.
A second approach, which is complementary to the first, is to reform the structure of
retail rates to make them more reflective of underlying costs. More specifically, it is our
understanding that at present retail rates in the KSA are entirely volumetric across all rate
classes, i.e. that the only charge for customers is a charge per kWh of electricity
consumed. While simple, this rate design introduces various risks to the provider of
electric service and provides poor incentives for retail customers. The main problem with
purely volumetric rates is that sales below expected sales at a given rate result to revenues
below those needed to cover all costs since some of the costs of providing electric service
are fixed (notably the capital cost of generating plants and the fixed transmission and
distribution infrastructure, plus various fixed costs of operating the electric system). In
many countries industrial and commercial retail rates have a three-part structure, made
up of a monthly fixed payment per customer, a monthly demand charge, which depends
on a customer’s maximum demand during a given period (or the demand during the
system’s peak demand), and a volumetric component. Most residential rates have at least
a monthly fixed charge and a volumetric charge and some do have a form of demand
charge. Moving towards a two-part or three-part tariff would enable the KSA to recover
fixed costs through the types of charges that do not decline with consumption. For
example, a commercial retail rate with a demand charge and a monthly customer charge
would help provide revenues to cover fixed costs even if a commercial customer installs a
CHP unit and thus reduces his volumetric demand from the grid. It is important to point
out that when retail rates are redesigned it is likely that stand-by rates discussed above
will also need to be considered.46
Create retail rates that correspond to domestic fuel prices
A related issue concerns our understanding that that at present average retail rates across all rate
classes are lower than those that would be implied by domestic fuel prices. Put differently, SEC
46 It should be noted that, as described above, Transmission Use of System charges currently in place do
represent a form of fixed cost recovery through a non-volumetric charge. Hence, these TUoS charges
could easily form the basis for further developing more cost-based rate structures that differentiate
between fixed, capacity-based and volume-based (variable) costs.

61 | brattle.com
does not recover enough revenues through sales of electricity to pay for the fuel it needs at prices
equal to the current local prices of fuel. This means that customers in essence receive fuel
transformed into electricity delivered through the grid at a discount relative to the local price of
fuels. Assuming customers have access to fuels directly and that they would have to pay the local
price for such fuel for generating power in a CHP system, they would not have access to the same
subsidy and hence the economics of a CHP unit are made worse. Therefore, removing the
current implicit discount of fuel prices embedded in retail rates would remove this barrier. We
mention this issue here since it similarly affects other measures such as energy efficiency and
distributed generation sources other than CHP.
Align domestic prices with national fuel value
We understand that there are ongoing discussions about how to align domestic fuel prices with
national fuel values over time. While we understand the many complexities associated with such
efforts, it is important to point out that aligning the two would remove a significant KSA-specific
barrier to CHP and many other fuel saving measures in the energy sector. Without alignment,
fuel savings by consumers facing domestic prices will be valued lower than national policy goals
suggest. Therefore, in the absence of fuel price alignment other tools will likely be needed to
create incentives at the individual level that mirror society’s goals. We next discuss some options
for doing so in ways that are targeted to CHP applications in the KSA specifically.
D. SPECIFIC POLICY RECOMMENDATIONS
In this section, we provide some specific policy recommendations to support cost-effective CHP
applications in the KSA (from society’s perspective).
Fuel allocation
Since essentially all industrial customers with high CHP potential require fuel for their
operation, the existing fuel allocation mechanism can and should be used as a tool to incentivize
and potentially provide support for most promising sectors until broader market reforms in place.
Going forward, new industrial projects in certain industries (those identified as potentially
suitable for CHP), independent of whether or not they are suitable for topping or bottoming
cycle applications, could be required to demonstrate that they have studied the economics of
using CHP as part of their operation as part of their fuel allocation request. Even though
theoretically possible, we do not recommend making CHP generally mandatory for certain
categories of facilities, even if our analysis suggests relatively robust societal benefits in excess of
cost.47 The primary reason for not recommending a mandatory approach is that the actual costs
47 We understand that CHP is already mandatory for certain types of situations, in particular for
seawater desalination projects (See Amended Electricity Law Article 5-3). We do not recommend
passing a similar requirement into law for more general industrial sectors since the specific Continued on next page

62 | brattle.com
(and benefits) of CHP are, as mentioned above, often relatively site- and application-specific. To
support such a study and make sure studies across different applicants are comparable, the KSA
(either ECRA, the Ministry of Petroleum, Aramco or some combination of entities with
regulatory oversight and decision rights over fuel allocation) could develop standard assumptions
to be used in such analyses, for example concerning the value of fuel saved and certain
performance characteristics of CHP technologies. An alternative approach would be to require
applicants to present business cases with and without CHP technology taking into account
available incentives for CHP put in place and further discussed next.
It should be noted that using the fuel allocation process will likely not be a feasible mechanism
for fostering the development of commercial CHP applications. This is because most commercial
CHP users in general do not require allocated fuel to operate, but rather would use CHP to
displace electricity purchases for cooling (and occasional heating) demands. We understand that
there are notable exceptions in the KSA where commercial properties use diesel fired distributed
generation for their electricity supply due to difficulties accessing electricity supplies through the
grid. Also, as noted above, cooling CHP applications, which substitute some portion of electric
chillers with thermal chillers (absorption), tend to increase total fuel use rather than “save” fuel –
with CHP savings coming from capital expense savings instead. In that sense, thinking about
CHP through the lens of fuel allocation is inappropriate. However, in the broader context of
exploring under what circumstances commercial CHP may be economically beneficial from the
Kingdom’s perspective, we suggest that a similar process could be used through authorities
granting important permits or licenses to new commercial facilities. In particular, for certain key
commercial sectors (such as large hospitals, large airports, etc.) license approval/permits could be
made conditional on demonstrating the relative economics of “business as usual” versus district
cooling versus district cooling with CHP. Given the significant effort that would have to go into
such studies, we also suggest that only facilities above a significant minimum size level would
have to complete such an assessment. Since electricity is the alternative “fuel” supply for such
entities, SEC (or NGSA) could condition interconnection on such a study being completed.
Continued from previous page
circumstances for each industrial application are likely to create a wide range of economic benefits
from using CHP, not in all cases in excess of costs.
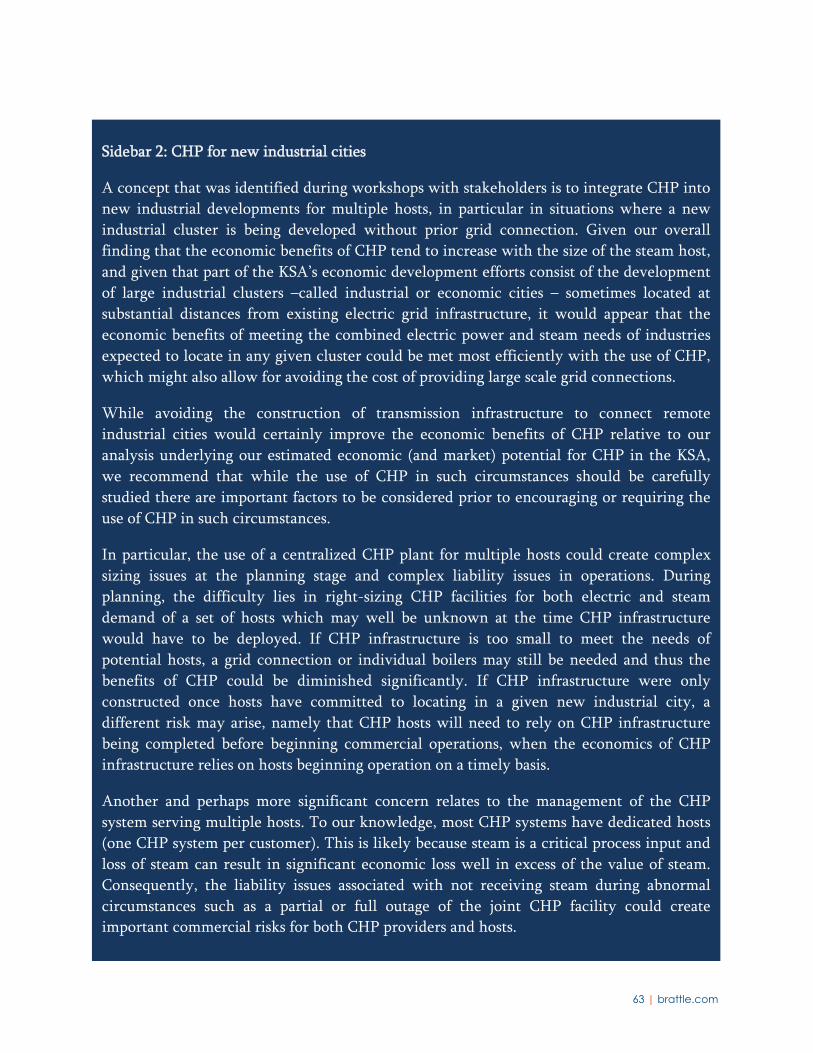
63 | brattle.com
Sidebar 2: CHP for new industrial cities
A concept that was identified during workshops with stakeholders is to integrate CHP into
new industrial developments for multiple hosts, in particular in situations where a new
industrial cluster is being developed without prior grid connection. Given our overall
finding that the economic benefits of CHP tend to increase with the size of the steam host,
and given that part of the KSA’s economic development efforts consist of the development
of large industrial clusters –called industrial or economic cities – sometimes located at
substantial distances from existing electric grid infrastructure, it would appear that the
economic benefits of meeting the combined electric power and steam needs of industries
expected to locate in any given cluster could be met most efficiently with the use of CHP,
which might also allow for avoiding the cost of providing large scale grid connections.
While avoiding the construction of transmission infrastructure to connect remote
industrial cities would certainly improve the economic benefits of CHP relative to our
analysis underlying our estimated economic (and market) potential for CHP in the KSA,
we recommend that while the use of CHP in such circumstances should be carefully
studied there are important factors to be considered prior to encouraging or requiring the
use of CHP in such circumstances.
In particular, the use of a centralized CHP plant for multiple hosts could create complex
sizing issues at the planning stage and complex liability issues in operations. During
planning, the difficulty lies in right-sizing CHP facilities for both electric and steam
demand of a set of hosts which may well be unknown at the time CHP infrastructure
would have to be deployed. If CHP infrastructure is too small to meet the needs of
potential hosts, a grid connection or individual boilers may still be needed and thus the
benefits of CHP could be diminished significantly. If CHP infrastructure were only
constructed once hosts have committed to locating in a given new industrial city, a
different risk may arise, namely that CHP hosts will need to rely on CHP infrastructure
being completed before beginning commercial operations, when the economics of CHP
infrastructure relies on hosts beginning operation on a timely basis.
Another and perhaps more significant concern relates to the management of the CHP
system serving multiple hosts. To our knowledge, most CHP systems have dedicated hosts
(one CHP system per customer). This is likely because steam is a critical process input and
loss of steam can result in significant economic loss well in excess of the value of steam.
Consequently, the liability issues associated with not receiving steam during abnormal
circumstances such as a partial or full outage of the joint CHP facility could create
important commercial risks for both CHP providers and hosts.

64 | brattle.com
Bridging the gap between domestic prices and national values
As long as domestic fuel prices do not closely match national values of fuels, private benefits
from implementing CHP will be lower and in many cases significantly lower than the benefits to
society overall. While in theory CHP could be required to obtain fuel or another license or
permit, we do not recommend requiring the installation of CHP. Rather, we propose that as an
interim strategy (until such time when fuel prices in the KSA might be changed to more closely
approximate national fuel values) limited financial incentives should be used to close the gap
between domestic fuel prices and national fuel values. These incentives would ultimately have to
be provided or backed by an entity that realizes the benefits of cost savings measured as national
fuel values rather than current domestic prices, i.e. likely a government or quasi-government
entity. A number of options exist for doing so. We suggest three potential avenues that could be
used (and which have been used and are being used internationally) to do so: capital grants, soft
loans, and production support in the form of a heat credit or feed-in adder. We discuss each in
turn.
Capital Grants
In theory, capital grants can be structured to approximate the national value of fuel from the
perspective of a private CHP client who is exposed to domestic fuel pricing. While we have not
determined the value of a capital grant – which can be either absolute, in $/kW of CHP capacity
installed, or relative, say 30% of the capital cost of a CHP project – we did analyze the level of
capital grant needed to reduce the payback periods for CHP projects to levels where private
adoption rates would likely be sufficient, given our assumptions about adoptions as a function of
payback discussed earlier.
Soft Loans
Soft loans, or access to low interest rate loans, are another and similar mechanism for lowering
the capital cost of a CHP project to the project owner. Both the ability to obtain a loan and a
relatively low interest rate can be helpful since in some cases merely obtaining third-party
financing can be a challenge (given that much of the benefit stream is in the form of avoided
costs, which cannot easily be secured for the purpose of lowering the risk to lenders). The
amount and conditions of soft loans can be structured to significantly reduce the difference
between private and public benefits of a CHP project facing domestic fuel prices rather than
national values.
Heat Credits
Unlike capital grants or soft loans, output related support does not lower the upfront capital costs
of a CHP project, but can help improve the overall economic benefit of a CHP project to a private
entity, by increasing its overall Net Present Value and reducing payback periods. Heat credits are
structurally identical to feed-in adders like those provided for CHP in Germany and discussed
above in that they pay a premium per kWh of electricity produced by a CHP project. In theory,
the credit could be restricted to net exports in case electricity consumed on-site is harder to
65 | brattle.com
measure, but the basic concept is to provide a credit for the fact that steam/heat is being
produced at the same time as electricity. The heat credit level could in theory be set to exactly
compensate for the difference between domestic fuel prices and national values or to some
portion (smaller or greater). The heat credit would have to be increased if only applied to excess
power sales, which would incidentally make a heat credit unavailable for applications not
resulting in excess power sales, such as for most if not all bottoming cycle applications. Our
recommendation is therefore that heat credits, should they be used, be based on total metered
electricity production from a CHP facility. One major advantage of a heat credit over capital
support is that it creates production incentives over time. In other words, heat credits are only
awarded based on actual production and thus create an incentive to operate and maintain CHP
facilities in ways that maximize output. In this way, heat credits would also create incentives to
produce electricity beyond what is needed to meet on-site steam/heat demands during situations
where incremental electricity from a CHP unit can be supplied at a cost below the cost of grid-
generated electricity.
Aligning infrastructure and CHP
As discussed above, one critical question related to CHP in the KSA is access to natural gas.
Given historic energy supply, natural gas infrastructure is currently limited to various areas and
certainly not widely available at the distribution level. Our assessment of the economic potential
for CHP in the KSA did not consider any costs of expanding natural gas for the sole purpose of
supplying natural gas to CHP units. It is likely that if future power demand will indeed be met
from natural gas fired power generation, some additional infrastructure investments will become
necessary. Both the existing and planned future gas pipeline infrastructure should be used to
support the development of CHP. Clearly, from society’s perspective CHP projects are more
beneficial, all else equal, if they do not require dedicated investments in gas infrastructure. Any
of the financial support mechanisms described above could thus be either available only to
potential CHP hosts located (or planning to locate) in close proximity to existing or planned gas
infrastructure. Alternatively, any support could be lower for projects requiring new gas pipeline
investments (alternatively, CHP projects could be required to finance the gas infrastructure
enhancement needed to provide natural gas to a site, similar to generators having to pay for grid
investments needed to connect new generation sources.
Encourage third party ownership and operation
One of the important barriers identified for the KSA (and more broadly) is a lack of knowledge
and skill related to the operations of CHP. This barrier exists primarily when industrial (and
commercial) customers contemplate the use of CHP and reflects the fact they inside their own
organizations there may be important skill gaps relative to being able to plan, build and operate
CHP facilities. One obvious solution, and one we suggest the KSA contemplate, is to encourage
third parties to build, own and operate customer-sited CHP plant. In many countries, CHP
facilities are owned and operated by either incumbent utilities (as part of their fleet of generating
stations) or by independent subsidiaries of utilities operating CHP facilities outside their
traditional service territories. At present, the KSA is still characterized by the majority of

66 | brattle.com
generating capacity owned and operated by SEC, with IPPs playing an increasing role. We
understand that there are ongoing reform efforts, which may result in a different role for SEC.
Independent of the ultimate results of ongoing reform efforts, the current mix of SEC and IPP
ownership should provide a sufficient basis for allowing both SEC and IPPs to operate CHP
facilities. One approach that could be used is tendering for CHP and allowing both SEC and IPPs
to participate in such tendering processes. Given that most promising CHP applications in the
KSA are for larger scale facilities, the existing experience by both SEC and IPPs in operating
similar facilities should help address concerns about lack of skills and knowledge.
Increase awareness and technical competence
Finally, as is the case even in countries with well-established CHP industries, there remain
important overall awareness gaps with respect to CHP. The most often used approaches to build
awareness and technical competence is through the provision of technical assistance and through
the construction of pilot CHP projects. The KSA could learn from international experience and
adopt best practices for developing and then providing technical assistance programs, which
could be housed in some of the KSA’s existing energy-related public research institutions. We
also propose that a limited number of pilot projects for CHP in various applications (topping
cycle, bottoming cycle, commercial) could help build awareness and technical expertise that
would help kick-start technical assistance programs.
67 | brattle.com
References
The Brattle Group, Global Energy Partners, and PacWest Consulting. “Bringing Demand Side
Management to The Kingdom of Saudi Arabia.” Prepared for ECRA. May 27, 2011.
California Public Utilities Commission. “CHP Feed-in Tariff,” August 21, 2013. Available from:
http://www.cpuc.ca.gov/PUC/energy/CHP/feed-in+tariff.htm
Chittum, Anna and Kate Farley. “Utilities and the CHP Value Proposition,” July 2013.
Combined Heat and Power Partnership. “Catalog of CHP Technologies,” December 2008.
Cooney, Kevin and Stuart Schare. “ Combined Heat and Power in Texas: Status, Potential and
Policies to Foster Investment,” December 10, 2008.
U.S. Department of Energy, Office of Energy Efficiency and Renewable Energy. “CHP Technical
Assistance Partnerships (CHP TAPS).” Available from:
http://www.energy.gov/eere/amo/chp-technical-assistance-partnerships-chp-taps
Drury, Easan, Paul Denholm and Robert Margolis, “Modeling the U.S. Rooftop Photovoltaics
Market”, NREL, September 2010
Great Planes Institute. “Fact Sheet: Minnesota Combined Heat and Power.” 2013. Available
from: http://www.betterenergy.org/publications/fact-sheet-minnesota-combined-heat-
and-power%20
Griset, Todd J. “Maine’s CHP Interconnection Standards: Lessons and Best Practices,” October 18,
2012.
Hayes, David. “Supporting CHP and District Energy System Development in Asia,” January 9,
2009. Available from:
http://www.cospp.com/articles/print/volume-10/issue-5/features/supporting-chp-and-
district-energy-system-development-in-asia.html
Hedman, Bruce, Anne Hampson and Ken Darrow. “The Opportunity for CHP in the United
States,” May 2013.
ICF. “Combined Heat and Power: Policy Analysis and Market Assessment: 2011-2030,” February
2012.
International Energy Agency, Cogeneration and District Energy, 2009
Illinois Department of Commerce and Economic Opportunity. “Public Sector Combined Heat
and Power (CHP) Pilot Program.” 2015. Available from:
68 | brattle.com
https://www.illinois.gov/dceo/whyillinois/KeyIndustries/Energy/Pages/CHPprogram.aspx
Kastovich J.C., R.R. Lawrence, R.R.Hoffman and C. Pavlak, “Advanced Electric Heat Pump
Market and Business Analysis”, Oak Ridge National Laboratory, 1982
KEMA. “Massachusetts Combined Heat and Power Program Impact Evaluation 2011-2012,”
November 2013.
Mass Save. “Combined Heat and Power (CHP): A Guide to Submitting CHP Applications for
Incentives in Massachusetts,” November 7, 2014.
Primen. “2003 Distributed Energy Market Survey,” May 2004.
R.W. Beck, “Distributed Renewable Energy Operating Impacts and Valuation Study”, January
2009
State and Local Energy Efficiency Action Network. “Guide to the Successful Implementation of
State Combined Heat and Power Polices,” March 2013.
Shipley, Anna, Anne Hampson, Bruce Hedman, Patti Garland, and Paul Bautista. “Combined
Heat and Power: Effective Energy Solutions for a Sustainable Future,” December 1, 2008.
The Alliance for Industrial Efficiency. “Carbon Pollution Emission Guidelines for Exicting
Stationary Sources: Electric utility Generating Units, EPA-HQ-OAR-2013-0602, 79 Fed.
Reg. 34830,” November 20, 2014.