Embed Size (px)
Citation preview

Combined Acetone PLIF and IR Laser Absorption Probe Measurements of Fuel
Mixture Fraction Oscillaitons
D.M. Kang
Jet Propulsion Center and Mechanical Engineering, California Institute of Technology, Pasadena,
California, USA
v. Fernandez
Mechanical Engineering, California Institute of Technology, Pasadena, California, USA
A. Ratner
Department of Mechanical and Industrial Engineering, University of Iowa, Iowa City, Iowa, USA
F.E.C. Culick
Jet Propulsion Center and Mechanical Engineering, California Institute of Technology, Pasadena,
California, USA
Abstract
Measurements of the spatial dependence of fuel mixture fraction are made for a non-premixed jet flame in
a combustion chamber with imposed acoustic oscillations at frequencies of 22-55 Hz. As part of a set of
studies on combustion instabilities and the dynamical behavior of combustion systems, this work is
intended to provide a basic understanding of the characteristics of mixing under imposed acoustic
oscillations. Infrared laser absorption and phase-resolved acetone PLIF are used to measure the fuel
mixture fraction throughout the flow field. The degree of fuel/air mixing is then calculated from the
measurements in terms of unmixedness factor, in both temporal and spatial respects. Results show that
the acoustic excitation causes oscillations in fuel/air mixing at the driving frequency, which results in
oscillatory flame behavior in the flame region. The unmixedness factors for the reacting flow cases
exhibit greater overall magnitudes than the cold flow cases, which means that mixing becomes less
effective in the presence of flame. Also the degree of mixing decreases with increasing frequency for
reacting cases, while, for the cold flows, the mixing tends to be enhanced with frequency.

Introduction
Combustion instabilities are pressure oscillations in a combustion chamber caused by coupling between
thermo-acoustic and fluid-dynamic conditions present during the combustion processes. Interfering with
proper operation, such oscillations can cause catastrophic damage in extreme cases. The interaction
between vortices (mixing), sound (acoustic oscillations), and combustion heat release can lead to self
excited oscillations that can cause problems such as increased pollutant production, uneven burning, and,
possibly, structural damage. Any unsteadiness in the process of combustion can be a source of sound,
generating pressure and velocity fluctuations (Dowling 2000). Recently, environmental concerns often
demand the use of lean premixed (LP) combustion schemes which reduce the amount of NOx produced
by the combustion system. The LP scheme does this by lowering the flame temperature, which reduces
thermal NOx. Unavoidably, this lower temperature and low fuel flow-rate result in the more common
occurrence of instabilities since combustion occurs near the lean blow-out limit (Venkataraman et al.
1999).
Several different studies have been undertaken to examine the physical phenomena involved in this
process. A study of the acoustic coupling between fuel injectors and an applied acoustic field was
carried out by Anderson et al. (1998) focusing on cold flow experiments. Chen (1993) studied premixed
flames designed specifically to simulate solid rocket propellants, and produced only one-dimensional
results at two forcing frequencies. Cohen et al. (200 I) studied the impact of mixing on the performance
of a combustor by modulating part of the fuel flow for use in active control. They employed acetone
PLIF to measure the fuel/air mixing and then derived the control effectiveness.
A study of combustion instability involving a series of theoretical and experimental components has
been carried at Caltech over the span of the last 30 years. Culick outlined a theoretical basis for this
approach by formulating Rayleigh's statements on acoustic waves and flame behavior, referred to as the
Rayleigh index, (Culick 1976 & Culick 1987). The main thrust of the last 6 years has been on assessing
the flame dynamics with highly resolved laser-based experiments. The coupled effects of acoustic
forcing with combustion heat release on species concentration inside the flame zone were examined by
Pun et aI. (2002, 2003) with OH-PLIF and chemiluminescence under atmospheric pressure. The flame
base behavior (Ratner et aI., 2002) and NO production (Ratner et aI., 2002a & Ratner et aI., 2002b) were
also studied for these conditions. Flame response functions were computed from the test results.
Good design requires the ability to predict system behavior. Hence, a methodology for predicting and
evaluating the dynamic behavior and stability characteristics of a given combustor is necessary. To
accomplish this, a general framework is required that can be applied to any combustor topology and fuel
injection scheme. The framework chosen here is to characterize individual segments of flame surface
and to measure their response to various applied conditions. The specific objective of this series of
studies is to examine the effect of acoustic oscillations, as sources of unstable dynamics inside the
2

combustion chamber, on the fuel/air mixing. This objective also encompasses study of the link between
flame behavior and mixing behavior under these same conditions. The current work builds on that
previously performed (Pun et al. 2003) by focusing on the fuel-air structure upstream of the flame front.
In the flame region, phase resolved imaging (Pun, 2003) revealed the phase-dependent response of the
combustion process under selective forcing (at frequencies of 22, 27, 32, 37, and 55Hz). Keeping the
experimental apparatus and conditions identical to those previously used, the present work examines how
the local fuel/air mixing is affected by the imposed acoustic excitation. The acoustic forcing produces
bulk acoustic modes (spatially uniform) at the burner location at specific frequencies. These acoustic
waveslbulk modes interact with the flame and affect the heat release from the combustion process, which
causes the combustion process to act as a source of either acoustic excitation or damping. Both reacting
and non-reacting cases are studied for comparison. Acetone planar laser induced fluorescence (PUF) is
used to measure the fuel/air mixing in the region upstream of the flame, along with infrared laser
absorption to measure point-wise fuel concentration at the neck of the burner. Both of these techniques
have been developed and employed by other researchers in similar environments (e.g., Hase et al. 1996,
Mongia et al. 1998, and Lozano et al. 1992).
Temporal non-uniformities in mixture fraction were' first measured by Fric (1993) and Gulati et al.
(1994). These studies employed an argon ion laser to induce fluorescence (UF) in N02, which had been
seeded into the flow as a fuel marker. The drawback of this technique is that N02 is toxic and its
transport properties are different from those of methane. Mongia (1998) and Hase et al. (1996)
combined aspects of previous techniques to develop and demonstrate continuous measurement of
methane concentration. The measurement is performed by methane absorption of a 3.39 micron
wavelength He-Ne laser beam. The continuous nature of the measurement allows for sampling rates of
several kilohertz with no additional chemical markers. Both of those studies developed probes, with
Mongia's probe employing fiber optics as the relay medium. This is one of the techniques employed in
this study for the point-wise measurements with a replica of Mongia's probe as the instrument used to
perform the measurements.
Acetone PLlF is a widely used technique for measuring distributions of species concentrations (with
acetone serving as the marker species) (Lozano et al. 19.92, Ritchie et al. 2001) and temperature (Thurber
et al. 1997, 1998), flow visualization (Bryant et al. 2000), and other purposes. The experimental
configuration is similar to that for PUF of other species, but it is generally less prone to error due to the
high signal levels. The attraction of acetone PLlF is that it is (1) non-intrusive; (2) nearly instantaneous
with very short life time of about 4 ns; (3) very effective in molecular-marking flows of fuel or air with
little possibility of affecting the flow significantly; and (4) allows high spatial and temporal resolution
with a high signal to noise ratio. Also, acetone has a high vapor pressure, so it is simple to seed into a
gaseous stream and is inexpensive and safe to use relative to other fluorescing molecules. Temperature
dependence of the acetone fluorescence signal has been previously characterized (Thurber et al. 1998)
3
and is referred to here for calibration. In general, for a given temperature and pressure, acetone
fluorescence is linear with acetone concentration.
Previous studies of fuel/air mixing using acetone PLIF (Lee et al. 1997, Ratner et al. 2001) all used the
fourth harmonic frequency of an Nd: Y AG laser, at 266 nm, as the fluorescence excitation source. The
LIF study by Lee et al. (1997) was performed using an optical probe. While this Nd: Y AG 4th harmonic
based method produces very high signal levels, the sampling rate is limited by the laser firing rate of
10Hz, which is too low to capture flame oscillations (which often occur at frequencies of lOs to 100s of
Hz).
Experimental configuration
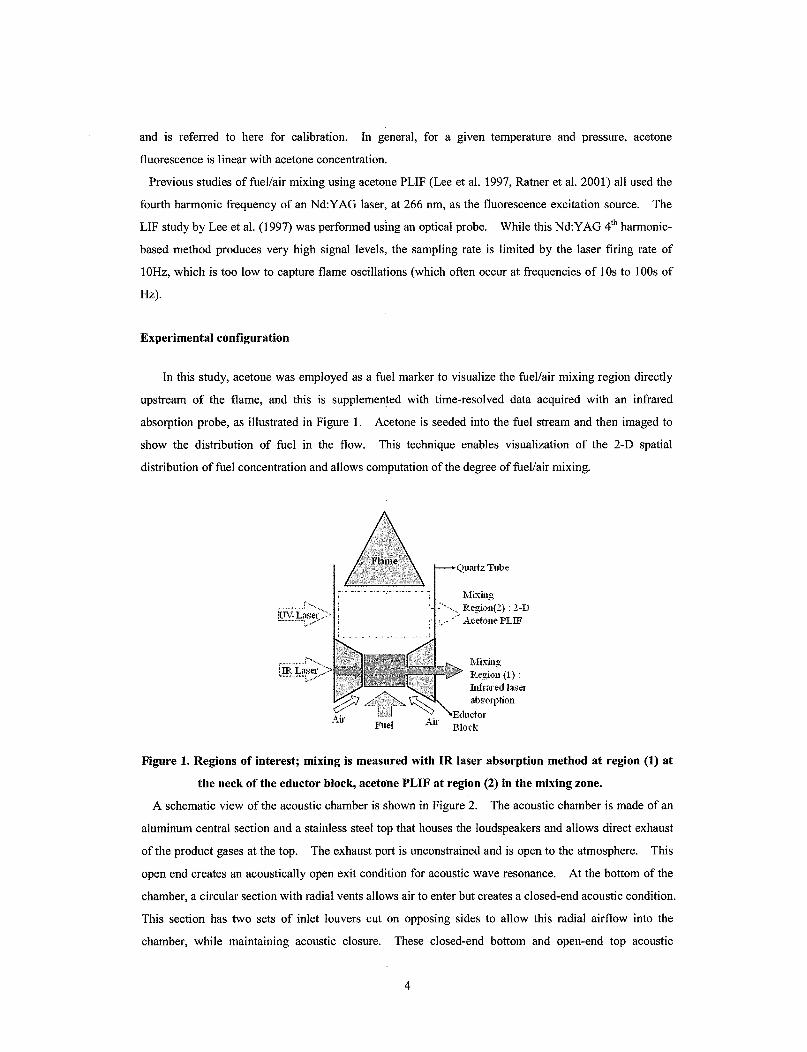
In this study, acetone was employed as a fuel marker to visualize the fuel/air mixing region directly
upstream of the flame, and this is supplemented with time-resolved data acquired with an infrared
absorption probe, as illustrated in Figure 1. Acetone is seeded into the fuel stream and then imaged to
show the distribution of fuel in the flow. This technique enables visualization of the 2-D spatial
distribution of fuel concentration and allows computation of the degree of fuel/air mixing.
I---ClUaltz Tube
_._,_.- _._._.-:- --_._"_.- ... . .
Fuel Air
1Iixing •.•• Region(2) : 2-D
• - .- Acetone PLIF
Mixing Region (1) : Infrared laser absol}Jlion
Block
Figure 1. Regions of interest; mixing is measured with IR laser absorption method at region (1) at
the neck of the eductor block, aceto'ne PLIF at region (2) in the mixing zone.
A schematic view of the acoustic chamber is shown in Figure 2. The acoustic chamber is made of an
aluminum central section and a stainless steel top that houses the loudspeakers and allows direct exhaust
of the product gases at the top. The exhaust port is unconstrained and is open to the atmosphere. This
open end creates an acoustically open exit condition for acoustic wave resonance. At the bottom of the
chamber, a circular section with radial vents allows air to enter but creates a closed-end acoustic condition.
This section has two sets of inlet louvers cut on opposing sides to allow this radial airflow into the
chamber, while maintaining acoustic closure. These closed-end bottom and open-end top acoustic
4

conditions result in natural acoustic resonance well in excess of the test frequencies, insuring pressure
oscillations that are bulk acoustic modes. In essence, the lower portion of the chamber experiences
pressure variations in an effectively spatially uniform fashion. The loudspeakers housed in the upper
portion of the chamber generate the acoustic field. To protect the speakers from heat failure, they are
attached to an air jet film cooling system which is in tum sealed to the steel structure. The loudspeakers
are 12 inches in diameter and can handle 400 W (each) of continuous power. They are powered by lOOO
W power amplifiers along with a function generator that provides the input signal.
Figure 2. The combustion chamber: (a) loud speakers, (b) pressure transducer, (c) fused-silica
burner tube, (d) eductor block (see fig. 1), (e) fuel spud, arrows at the bottom indicate the
air inlet.
The burner, as shown in Figures 1 and 2, is a traditional jet-mixed type burner with flame anchoring
occurring approximately in the middle of the quartz tube, with the exact height depending on the specific
flow conditions such as fueIlair ratio. The fuel jet is 50% methane and 50% nitrogen and air is entrained
and drawn into the jet as the flow moves through the eductor. The quartz tube is 5.72cm wide on each
side and 11.43cm tall and is made of fused silica/quartz to enable observation and measurement of the
flame.
5

(a) Photo-O!.!to.:c tor
(b)
~ ~
Figure 3. Schematics of (a) infrared laser absorption method and (b) acetone PUF.
Schematics of the infrared laser absorption measurement technique and acetone PUF are shown in
Figure 3. The infrared laser probe assembly consists of a He-Ne laser which produces an infrared laser
beam with wavelength of 3.39 J..lm. As shown in Figure 3-(a), the laser beam is channeled down an
optical fiber and into the measurement volume, through the gas mixture, reflects off of a gold, front
surface mirror, passes once more through the measurement volume, enters a receiving optical tiber, and is
routed to a photo-detector. The receiving fiber, illuminating fiber, and mirror are all mounted in a probe
with the measurement volume at the tip. Due to geometric constrains, only a fraction of the energy that
was present in the illuminating beam returns to the receiving fiber. The probe is then inserted through
the eductor block (at the throat) and traversed radially to sample the gas from centerline to the eductor
wall.
Figure 3-(b) shows the layout of the acetone PLIF imaging system. An intensified CCO camera is
used for the image acquisition, whi le a National Instrument data acquisition board (N I PCI 60 14) along
with pressure transducer (PCB 106B50) is used to measure and record the pressure and other signals
(laser intensity, duration, and related parameters). PUF imaging of acetone is performed at the bottom
portion of the quartz tube where no flame is present, as indicated in Figure I. All timing is based off of
to the NO: Y AG laser flash-lamp firing and Q-switch activation. The NO: Y AG laser has internal laser
frequency doubling and outputs a 2nd harmonic high power beam at 532 nm. This beam is used to pump
a dye laser which operates at 560 nm. The output of the dye laser is in tum frequency doubled to 280
nm for excitation of acetone. The laser power entering the test section was 8.4 mJ/pulse, which implies
an intensity of approximately 0.373 mJ/pulse/cm'-
The PUF signal is captured on an intensified CCD camera with a maximum size of 512 by 512 pixels,
although only 300 by 225 camera pixels are uti lized to image the 5.5 by 4.1 cm area of interest. The
PLIF signal passes through a UV high-pass filter which blocks all light lower than 300 nm in wavelength.
This blocks laser beam scatter but passes the fluorescence signal, which occurs mostly between 350 and
6

550 nm. Images are taken at random pressure phases, with the camera gating signal being recorded by
the data acquisition system along with the pressure signal so as to enable appropriate post-processing.
Post-processing involves sorting the images by the pressure phase, creating phase-averaged images, and
normalizing based on laser intensity and other quantities,
The fuel jet speed is approximately 20 mls at the outlet of the 1.0 cm diameter fuel spud, yielding Re ~
10,000-20,000. The Strouhal number is St ~ 0.2-0.6, which makes the expected vortex shedding
frequency for this jet in the range of several hundred Hz, which is significantly above the testing range of
this set of experiments.
Results
To quantify the degree of mixing and the associated mixture fraction oscillations, the degree of
variation in fuel concentrations over some time period (temporal oscillations) or in a region of flow field
(spatial oscillations) must be measured and characterized. One of the ways to characterize this behavior
is through use of the unmixedness factor. The unmixedness is a normalization (Dimotakis et al. 1990) of
the variance O"~ by the maximum possible value for a given average fuel-air ratio <X>g, evaluated by
the variance of the Housdorfrelation
O"~ax =< X > .(1- < X ». (1)
The unmixedness factor is defined in two ways so as to examine different flow phenomena. Temporal
unmixedness will be defined by equation (2), and spatial (global) unmixedness will be defined by
equation (3).
Temporal fluctuation of fuel concentration
When the temporal unmixedness (U) is zero, the fuel is completely mixed and homogeneously
2 distributed; when U is unity, there is no mixing in the flow, even for very low values of O"g.
temporal unmixedness employed here is defined as:
0"2 u=---------
(xmax - < X ».« X > -xmin )
The
(2)
where cr is the standard deviation of the fuel concentration at one pixel over several measurements; x is
the fuel concentration (mole-fraction); and <> is the average at a specific pixel (spatial location). The
min and max subscripts denote the minimum and maximum values occurring at this spatial location. By
definition, this measure is an indication of how much variance exists in the fuel concentration at a certain
point over some period of time, that is, the temporal fluctuation of fuel concentration. Low values of
7

this factor mean that there is only small variation at this location at different instants in time; while a
greater value means that there is more fluctuation in the fuel concentration, and therefore, more mixing.
(a)
0. 15
? 0 1 ~ . :a 15 w
~ z ;;>0.05
- ot. - 22hz - 27h:ao: - 32hz - 37hz
5""
~~-=~~~~~~~=-~W~~ro=--OO=--~M~~IOO NOR~lAliZED RADIAL LOCATION !,/R)
(b)
(e)
Figure 4. (a) Temporal Unmixedness factor at the neck of the eductor block defined by equation
(1) and 2-D maps (adjusted by normalization) from PUP measurements at 37Hz, (b)
reacting case and (c) non.reacting case (for b & c, higher values of temporal
unmixed ness factors are represented by brighter shading).
It can be seen in Figure 4(a) that high values of temporal unmixedness occur in the shear mixing layer of
the flow, in the range of 30·60% of the normalized radial location from the center. There is little
variation in the overall unmixedness structure for excitation at different frequencies, with all plots
8
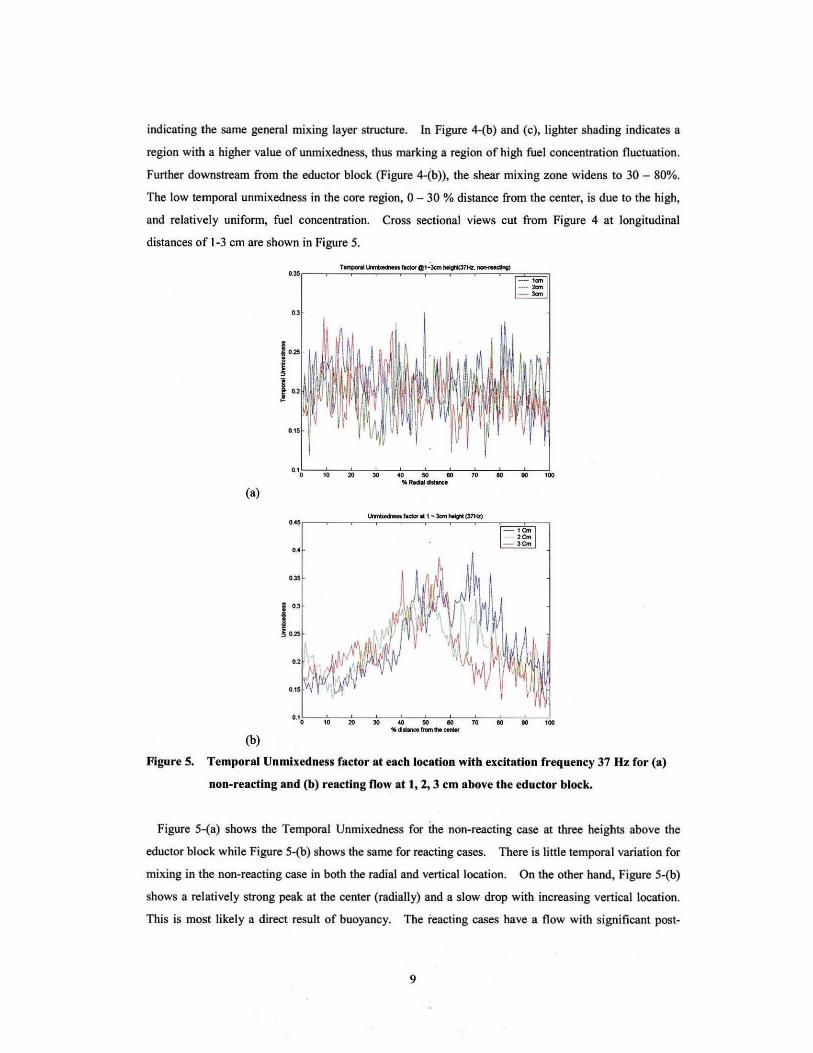
indicating the same general mixing layer structure. In Figure 4-(b) and (c), lighter shading indicates a
region with a higher value of unmixedness, thus marking a region of high fuel concentration fluctuation .
Further downstream from the eductor block (Figure 4-{b)). the shear mixing zone widens to 30 - 80%.
The low temporal unmixedness in the core region, 0 - 30 % distance from the center, is due to the high,
and relatively uniform, fuel concentration. Cross sectional views cut from Figure 4 at longitudinal
distances of 1-3 em are shown in Figure 5.
(a)
(b)
0.' 0 70 eo 80 100
G.45
0.'
0."
i U
i ~,~
0·')-0 - -;':'-0 -~".---"tc---o.:'-·o - -t".---,,". - -;"=---::";--;;;,,.---:!,,. "'dtloncefrcmlhe ....
Figure 5. Temporal Unmixedness factor at each location with excitation frequency 37 Hz for (a)
non-reacting and (b) reacting flow at t, 2, 3 cm above the eductor block.
Figure 5-(a) shows the Temporal Unmixedness for the non-reacting case at three heights above the
eductor block while Figure 5-(b) shows the same for reacting cases. There is little temporal variation for
mixing in the non-reacting case in both the radial and vertical location. On the other hand, Figure 5-(b)
shows a relatively strong peak at the center (radially) and a slow drop with increasing vertical location.
This is most likely a direct result of buoyancy. The reacting cases have a flow with significant post-
9

reaction buoyancy, creating an enhanced verti~al velocity component. This means that for the same
vertical location, the reacting flow cases will resemble lower vertical locations (earlier times) in the non
reacting cases. This is evidenced by the fact that the non-reacting cases are mostly mixed by the time
the flow reaches the imaging area while the reacting flows are still undergoing mixing. It also appears
that the stabilizing presence of the flame (due to gas expansion and inhibition of vorticity) also slows the
mixing process.
Qualitatively, while the fueUair mixing keeps the same structure downstream, the measured gradients
are less, that is, the degree of fluctuation in fueUair mixing is decreasing downstream. In the core region
close to the center, the variation is very small as expected from the results shown in Figure 4. This is
because the fuel core region stin consists mostly of fuel and most mixing occurs at the edges. This is
most easily seen in Figure 6.
Figure 6 shows fuel concentration distribution in that region at the same condition normalized by the
maximum in the reacting case. As the flow goes down stream, less fluctuation in the fueVair mixing
occur giving smaller unmixedness values in the outer flow region, 60-80% of the radial distance from
center. It is evident that acoustic forcing has a significantly smaller impact on the mean methane
concentration than does the presence of combustion. Both reacting and non-reacting cases show the
flow self-similarity that would be expected of a simple jet.
10 "
o 1C1lH'l11c11ng 2cm-relcllng
·1 3cm-mIcllng to- 1cllH'lOlHftcllng
""""""'~ .. -~ ..
30 40 50 60 70 so 90 100 '" chW'ocfI1i'om!he cenler
Figure 6. The fue' concentration distribution
Phase-resolved behavior of mixing
The global unmixedness is defined as
10

(3)
where O'g is the standard deviation and <x> g average of fuel concentration over the entire 2-D region.
As opposed to the definition for the temporal unmixed ness factor where the data are collected many times
at one point, this time a 2-D image collapses to a single. value by this definition. This definition gives a
quantitative measure of the magnitude of variation of fueUair mixing, the degree of fluctuation in fuel
concentration over the entire region.
PII.-. : eo PIIMe : 120 ...... : 150
...... 102030«l~
.0.25 -0.2 -o.l~ ... , .o.OIiI 0 a .OII 0.1 0.15 0.2 0.2:5
Figure 7. Distribution of fuel concentration by phase at 37 Hz, reacting now case Colon indicate
the difference from the average fuel distribution, normalized by the average value at
each point.
Phase dependence of the mixing behavior is briefly shown in Figure 7 above. Here colors tagged with
positive values indicate regions with higher than average fuel concentration (red and yellow), while the
negative-valued contours indicate regions with lower than the average (dark and light blue). The
II

domain size shown here is 55 mm by 42 mm and the entire field is subtracted and normalized by the
mean. The values indicate the relative deviation of fuel concentration at that location from the mean
fuel concentration. The phase is that of excitation acoustic wave. For 37 Hz, the highest overall fuel
concentration occurs at the pressure node (0, 180 degree), then decreases subsequently through 30(210)
and 60(240) degrees until the pressure anti-nodes (90, 270 degree), and so on.
Figure 8. Power density spectrum of fuel mixture fraction for 32Hz, reacting flow
Figure 8 is a 3-D view of the power density spectrum; radial location versus the Fourier transforms of
the time series data at each location versus intensity of each frequency at each radial location. This
shows that there is a very strong peak in the mixture fraction oscillations in response to an imposed
acoustic field. This particular plot is for a 32 Hz, reacting flow.
Across the mixing layer (30% to 60% of distance) and in the region where frequency is lower than 40
Hz, small ripples can be seen corresponding to flow structures of various sizes. Of particular interest is
the very strong peak at 32 Hz, the driving frequency for this case. Similar peaks are evident in all of the
acoustically forced cases, corresponding to the driving frequency employed. This indicates that strong
coupling occurs between the acoustic field and the mixing layer.
Also, since no strong frequency preference is seen in the outer portion of the flow, the coupling is not a
strong function of the vortex shedding from the fuel tube exit. The vortices are expected to be larger in
size and playa role in producing oscillations in the local equivalence ratio in the outer flow region.
In Figure 9-(a), the phase-resolved unmixedness at each phase for 37Hz is shown. The curve was
fitted by eighth order polynomial with I-(J error bounds (68%) indicated in dots along with raw data
points. As shown, the overall value of unmixedness is a lot higher for the reacting case, while the
magnitude of unmixedness fluctuations is about the same. This is true for all other excitation
frequencies, too, showing that the effect of the presence of flame is to cause less effective mixing and
more uncertainty. The first mode of unmixed ness fluctuation is clearly shown by the curve for the 'non
reacting' case in Figure 9-(a), and the second mode is riding the first mode as shown by the 'reacting'
12

case. This is observed at all other excitation frequencies as wel1. It seems that the frequency of the
second mode is about two periods (or more) per 360 degrees thus twice the excitation frequency.
(a)
(b)
0.011
O.0I550!--'M'--""m-"""";!oM-~~""-~""-"*'-~~'----.!~ --, " . ..
I .. f~ • I : • I: I m
" • -" ~
"
FFTd ........ __ .. J1 HE_
1: ="1
I !
~ ~ ~ 1~ 1~ _ 1~
f.-y(HI>
Figure 9. (a) Behavior of mixing in term of global unmixedness (eq. 2) at 37Hz of excitation with
offset of 0.012 added to non.reacting case. Dotted lines indicate 1..,- error bounds
(68%). (b) Measured pressure signal at 37 Hz of excitation.
The role of combustion processes in causing higher uncertainties in fuel mixing is obvious from
comparison with the non·reacting case, where the difference is only due to the existence of the heat
source, and the interaction of the acoustic field and combustion process. Given that all other
experimental conditions are the same, there exists a region of irregular pressure fluctuations only for the
reacting cases (see fig 9-(b» due to the generation of sound waves by the irregular burning of the
turbulent flame. This phenomenon, whose name, t~e 'YI error', derives from the shape of
, f(x) = Yx ' graph in the frequency range lower than the excitation frequency (the first peak in Figure
13

9-(b)), is observed in a wide variety of experimental researches, where random processes, such as the
turbulent mixing and. burning affected by acoustic perturbations, have significant contributions. The
amplitude of waves generated by the turbulent burning of fuel is significant. This is due to fluctuations
in the local equivalence ratios in the flame area, caused by irregularities in the fuel/air mixing in the
upstream.
In the latter part ofthe phase, the fluctuation seems a little bit smeared by higher modes which are hard
to see clearly at present phase resolution. The phase lead and lag are different for each frequency
(Figure 10).
The global unmixedness is plotted versus excitation frequency and phase during a cycle of excitation at
each frequency in Figure 10-(a). Much less effective mixing in terms of global unmixedness is observed
in the presence of flame. Also the mixing at higher frequencies (32 - 55Hz) is much more affected by
the presence of flame than at lower frequencies (22, 27Hz).
According to Figure lO-(a), the combustion process alone causes large differences in the degree of
mixing, lifting the unmixedness values up to a factor of 3 of those for the unexcited case. The increase
in unmixedness with frequency for the reacting flow case seems to be due to interaction between the
combustion process and the acoustic excitation; it is obvious when compared to the non-reacting case
where the tendency is just the opposite.
While the effect of combustion process has a great effect on the behavior of mixing, mixing is affected
by the phase of excitation as well, though not so much as by the combustion itself. Figures 10-(b) and
(c) show how mixing behaves according to the excitation frequency and phase. All curves are fitted by
polynomials of order 8. For reacting flow cases (b), the curves for frequencies 22 and 27Hz are shifted
up for better comparing the qualitative behavior of mixing.
Direct comparison of the curve shapes clearly shows that in reacting flow cases, the mixing fluctuates
at higher frequencies than the imposed acoustic ·oscillations while still oscillating mainly at the imposed
frequencies. On the other hand, non-reacting flow cases show only the oscillations at the imposed
acoustic frequencies. Differences in the mixing behavior are caused by the thermo-acoustic coupling.
The flame behavior is, in turn, expected to be affected by fluctuations in the mixing, or fluctuations in the
equivalence ratio, in the mixing zone.
14

(a)
(b)
(c)
0.02 .••• •
0.11.
0.01'
0.01 ' •
IUI12 I ·· .~
.~
•. -.~
10.0 ••
t···
" » " •
I .. , '-..--><c:=::-<, 0.01'
• _ Co..wl
o.ol~, L_-.»;-_" •• .------; .... »_---._:.-_,,~.---~_.:._._:.! --,
• I 4' I I' - .... "
• •• .» ----, -Figure 10. (a) 3-D representation of global unmixedness vs. excitation frequency and phase, and
(b) Reacting cases with orrset added to 22 and 27Hz, (c) non-reacting cases. (b) and
(c) are curve-fitted by polynomials or order 8. For no excitation (OHz), there' s no
phase dependence on the global unmixedness and they (0.0075 ror reacting, and 0.0027
for non-reacting) are lower than the minimum of other values, so they are not
indicated here.
15

Conclusion
Laser-based measurement techniques (IR-absorption and acetone PLIF) were performed to measure the
distribution of fuel in the mixing region upstream of a non-premixed jet flame. As a way of analyzing the
behavior in the mixing zone, the unmixedness factors were calculated to quantify the degree of mixing
based on the measurements.
According to the power density (Figure 8), there exists a strong coupling between mixing and the
acoustic field imposed. The phase-resolved global unmixedness shows the first mode of oscillation, the
same frequency as the excitation, with different phases from the flame base oscillations for corresponding
frequencies observed in previous works (Pun et a!., 2003), and also the second and seemingly higher
modes of oscillations for the reacting flow cases. It is clear that the acoustic forcing causes a strong
periodicity in the mixing layer at the driven frequency. And it is the main cause of fluctuations in local
equivalence ratio in the flame region, which, in tum, induce the periodic flame motion observed in the
previous work (Pun et a!. 2002, 2003).
The temporal unmixedness pattern reveals that the breakdown of fuel/air distribution structure slower
in the reacting flow cases, because the flow velocities in the mixing region, affected by the buoyancy of
the hot product gases, are higher than in the non-reacting cases, which results in higher uncertainties in
the mixing zone. This causes an overall high variation in the mixing for the reacting flows. The mean
flow patterns keep the same structure downstream of the mixing region and as the flow progresses
downstream, subsequent mixing reduces the variation in the distribution of fuel/air mixing.
The phase difference between the flame behavior (flame base movement) and the mixing behavior is a
subject yet to be studied for more analysis on the relationships between the two. The response of the
mixing zone, and therefore the flame, to critical excitation frequencies and higher, in the range where
vortex shedding occurs due to the flow geometry (such as the tip of the nozzle or other backward facing
steps) is an important issue to be covered in future works.
Acknowledgements
This work was supported in part by the California Institute of Technology and partly by the Air Force
Office of Scientific Research (AFOSR) under Grant No. F49620-03-1-0384 (Dr. Mitat Birkan, Program
Manager). The authors are grateful to the assistance of Carlos Pinedo for his help in the setting up of the
experiments.
16

References
Anderson TJ; Kendrick DW; Cohen JM (1998) Measurements of spray/acoustic coupling in gas
turbine fuel injectors. 36th aerospace Sciences Meeting & Exhibit Reno NV AIAA 98-0718
Bryant RA; Donbar JM; Driscoll JF (2000) Acetone laser induced fluorescence for low pressure/low
temperature flow visualization. Exp Fluids 28: 471-476 .
Chen TY; Hedge UG; Daniel BR; Zinn BT (1993) Flame radiation and acoustic intensity
measurements in acoustically excited diffusion flames. J Prop Power 9(2):210-216
Cohen JM; Stufflebeam JH; Proscia W (2001) The effect of fuel/air mixing on actuation authority in
an active combustion instability control system. J Eng Gas Turbines and Power 123:537-542
Culick F.E.C. (1976) Nonlinear Behavior of Acoustic Waves in Combustion Chambers, Parts I and II.
Acta Astronautica 3: 714-757
Culick FEC (1987) A note on Rayleigh's criterion. Combust Sci and Tech 56:159-166
Demayo TN; Leong MY; Samuelsen GS; Holdeman.fD (2003) Assessing jet-induced spatial mixing in
a rich, reacting crossflow. J of Prop and Power 19(1): 14-21
Dimotakis PE; Miller PL (1990) Some consequences of the boundedness of scalar fluctuations. Phys
Fluids A2: 1919-1920
Dowling AP (2000) Vortices, sound and flames - a damaging combination. The Aeronautical Journal
105-116
Fric TF (1993) Effects of fuel-air unmixedness on NOx emissions. J Prop Power 9(5) 708-713
Gulati A; Warren RE (1994) N02-based laser-induced fluorescence technique to measure cold-flow
mixing. J Prop Power 10(1 ):54-61
Hase K; Kori Y (1996) Effect of premixing offuel gas and air on NOx formation. Fuel 75(13):1509-
1514
Lee J; Santavicca DA (1997) Fiber-optic probe for laser-induced fluorescence measurements of the fuel
air distribution in gas-turbine. J Prop Power 13(3):384-387
Lozano A; Yip B; Hanson RK (1992) Acetone-a tracer for concentration measurements in gaseous
flows by planar laser-induced fluorescence. Exp fluids 13:369-376
Mongia RK (1998) Ph.D. Thesis, University of California Berkeley
Pun W; Ratner A; Culick FEC (2002) Phase-resolved chemiluminescence of an acoustically forced jet
flame at frequencies < 60 Hz. 40th AlAA Aerospace Sciences Meeting & Exhibit AIAA-2002-0194
Pun W; Palm SL; Culick FEC (2003) Combustion dynamics of an acoustically forced flame. Combust
Sci and Tech. 175:499-521
Ratner A; Driscoll JF; Huh H; Bryant RA (2001) Combustion efficiencies of supersonic flames. AIAA
J Prop and Power 17(2):301-307
17

Ratner A; Palm SL; Pun W; Ramirez B; Culick FEC (2002a) Flame response to excitation at
frequencies <60 Hz as measured by phase-resolved NO PLIF. 40th AIAA Aerospace Sciences Meeting &
Exhibit AlAA -2002-0195
Ratner A; Palm SL; Pun W; Culick FEC (2002b) Phase-Resolved NO Planar Laser-Induced
Fluorescence of a Jet Flame in an Acoustic Chamber with Excitation at Frequencies <60 Hz. Proceedings
of the Combustion Institute 29:85-90
Ritchie BD; Seitzman JM (2001) Quantitative acetone PLIF in two-phase flows. AlAA-2001-0414
Stufflebeam JH; Kendrick DW; Sowa WA; Snyder TS (2002) Quantifying fuel/air unmixedness in
premixing nozzles using an acetone fluorescence technique. J Eng Gas Turbines and Power 124:39-45
Thurber MC; Grisch F; Hanson RK (1997) Temperature imaging with single- and dual-wavelength
acetone planar laser-induced fluorescence. Opt Letters 22(4):251-253
Thurber MC; Grisch F; Kirby BJ; Votsmeier M; Hanson RK (1998) Measurements and modeling of
acetone laser-induced fluorescence with implications for temperature-imaging diagnostics. Appl Opt
37(21 ):4963-4978
Venkataraman KK; Preston LH; Simons DW; Lee BJ; Lee JG; Santavicca DA (1999) Mechanism of
combustion instability in a lean premixed dump combustor. AIAA J Prop and Power 15(6):909-918
Yip B; Miller MF (1994) A combined OR/acetone PLIF imaging technique for visualizing combusting
flows. Exp Fluids 17(5):330-336
18