Embed Size (px)
Citation preview
Combating Social Loafing Performance Reductions in Virtual Groups With Increased Cohesion, Reduced Deindividuation, and Heightened Evaluation Potential Through Self-Disclosure.
CitationHagen, Matthew Howard. 2015. Combating Social Loafing Performance Reductions in Virtual Groups With Increased Cohesion, Reduced Deindividuation, and Heightened Evaluation Potential Through Self-Disclosure.. Master's thesis, Harvard Extension School.
Permanent linkhttp://nrs.harvard.edu/urn-3:HUL.InstRepos:24078371
Terms of UseThis article was downloaded from Harvard University’s DASH repository, and is made available under the terms and conditions applicable to Other Posted Material, as set forth at http://nrs.harvard.edu/urn-3:HUL.InstRepos:dash.current.terms-of-use#LAA
Share Your StoryThe Harvard community has made this article openly available.Please share how this access benefits you. Submit a story .
Accessibility

Combating Social Loafing Performance Reductions in Virtual Groups with Increased
Cohesion, Reduced Deindividuation, and Heightened Evaluation Potential Through Self-
Disclosure.
Matthew H. Hagen
A Thesis in the Field of Psychology
for the Degree of Master of Liberal Arts in Extension Studies
Harvard University
November 2015

©2015 Matthew H. Hagen

Abstract
Over 100 years of research have shown that social loafing is a real and material
psychological phenomenon that reduces performance among humans in groups. It is
known that increasing evaluation potential, decreasing deindividuation, and cohesion all
lead to reduced social loafing in physical environments. What has not yet been well
researched is whether or not the findings associated with many of these variables also
apply to virtualized working environments.
In the present study, 200 individuals were recruited through Amazon Mechanical
Turk (an online work community) and were split into experimental and control groups.
While both sets of participants engaged in identical alphabetization tasks and were
informed that they were the final member of a five-person team, only the experimental
subjects were asked to read the short biographies of their teammates and write a short
biography of themselves for their teammates to read. By having experimental
participants engage in self-disclosure it was expected they would experience reduced
deindividuation (which is common with virtual teams), increased perceived evaluation
potential, and increased feelings of cohesion.
Differences in quantity and quality of performance, and differences in morale
(although not cohesion itself), were all in the expected direction, though none achieved
levels of statistical significance driven largely by material performance variances within
the datasets. Experimental subjects produced, on average, 1.9% additional correct
alphabetization groupings (averaging 16.64 of 50 among experimental participants and
iv
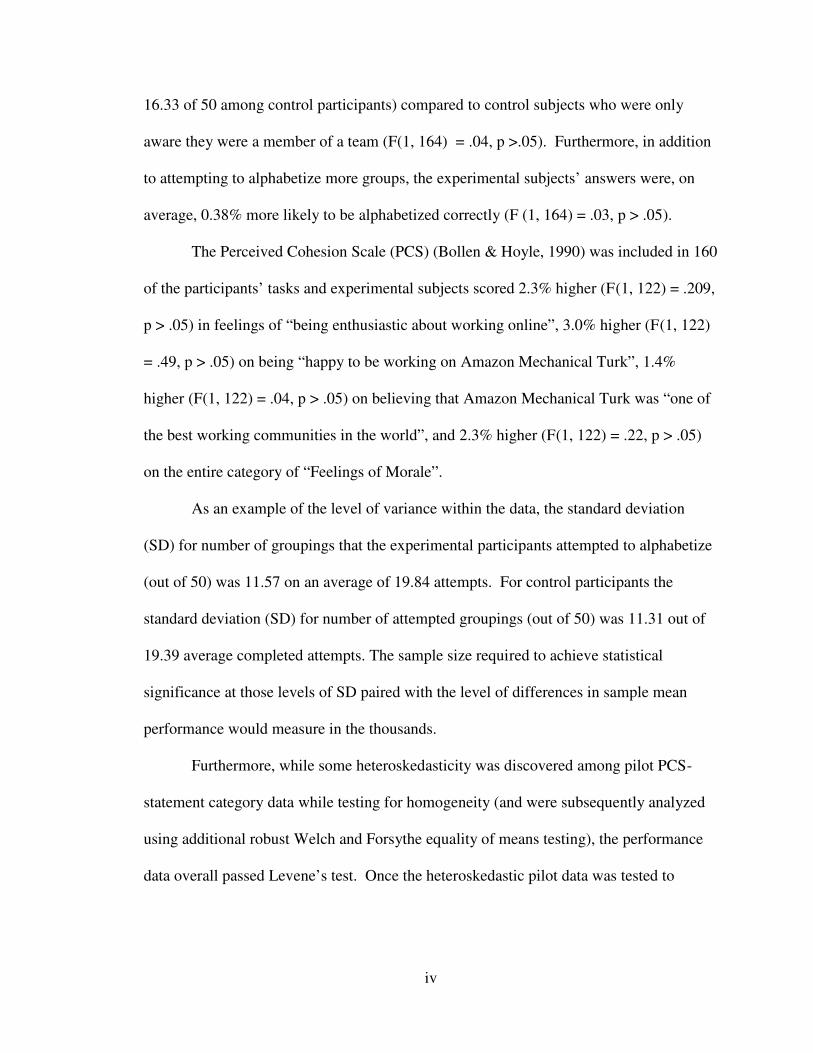
16.33 of 50 among control participants) compared to control subjects who were only
aware they were a member of a team (F(1, 164) = .04, p >.05). Furthermore, in addition
to attempting to alphabetize more groups, the experimental subjects’ answers were, on
average, 0.38% more likely to be alphabetized correctly (F (1, 164) = .03, p > .05).
The Perceived Cohesion Scale (PCS) (Bollen & Hoyle, 1990) was included in 160
of the participants’ tasks and experimental subjects scored 2.3% higher (F(1, 122) = .209,
p > .05) in feelings of “being enthusiastic about working online”, 3.0% higher (F(1, 122)
= .49, p > .05) on being “happy to be working on Amazon Mechanical Turk”, 1.4%
higher (F(1, 122) = .04, p > .05) on believing that Amazon Mechanical Turk was “one of
the best working communities in the world”, and 2.3% higher (F(1, 122) = .22, p > .05)
on the entire category of “Feelings of Morale”.
As an example of the level of variance within the data, the standard deviation
(SD) for number of groupings that the experimental participants attempted to alphabetize
(out of 50) was 11.57 on an average of 19.84 attempts. For control participants the
standard deviation (SD) for number of attempted groupings (out of 50) was 11.31 out of
19.39 average completed attempts. The sample size required to achieve statistical
significance at those levels of SD paired with the level of differences in sample mean
performance would measure in the thousands.
Furthermore, while some heteroskedasticity was discovered among pilot PCS-
statement category data while testing for homogeneity (and were subsequently analyzed
using additional robust Welch and Forsythe equality of means testing), the performance
data overall passed Levene’s test. Once the heteroskedastic pilot data was tested to

v
accommodate for the heteroskedasticity within, one PCS statement category (HTB, where
experimental participants expressed a happiness to be working on AMT) approached the
.05 alpha of statistical significance (p = .08).
Despite the lack of statistical significance, this work should be considered
valuable as a reference point. Finding any difference at all, in the expected direction, is
within itself notable given how tiny the actual cohesion-inducing treatment was (i.e., a
self-statement of only a few lines) and how short-term the perceived association with
their teammates was (i.e., less than half an hour).

vi
Author’s Biographical Sketch
Matthew H. Hagen was born and raised in West Des Moines, IA. He was a Phi
Beta Kappa undergraduate of Luther College and an F.W. Olin Scholar at Babson
College where he earned his MBA.
He has thus far spent the majority of his adult life on the East Coast working for
IBM where he has received the honor of being elected to IBM’s elite Business &
Technical Leadership Program. Over the course of his career he has served as the
Planning Coordinator for IBM’s Software Solutions Group worldwide, the Senior
Financial Analyst in charge of pricing & investment strategy for IBM’s Social Portfolio
worldwide, and as a Senior Product Line Manager & IBM Thought Leader for IBM’s
Commerce Group worldwide.
During this period he simultaneously pursued a Masters of Liberal Arts in
Psychology at Harvard University through its Division of Continuing Education.
In addition to his various corporate and academic achievements, Matthew had the
honor of performing in Carnegie Hall at age 17, being a recipient of the Gold Medal of
Achievement for early adulthood achievement (2002), awardee of the Erdman Prize for
Entrepreneurship (2006), winner of the HEBS “Personal Brand Elevator Pitch”
Competition (2012), winner of IBM’s “Trusted Business Advisor” Business Case
Competition for his “US Operations Cash Model” (2013), and currently sits on the Board
of Directors for the Nature Walks Conservation Society (a federally recognized 501c3
non-profit).

vii
Dedication
To those who stood by me through thick and thin.

viii
Acknowledgements
I want to take this moment to acknowledge the countless individuals who have
played invaluable roles in helping me get to where I stand today. I have been blessed
with the good fortune of having spent the majority of my life surrounded by incredibly
gifted people and have been luckier still to have been able to do so across a myriad of
subject matter. I would first and foremost like to thank my Thesis Director Professor
Robert Kegan and the Harvard ALM Program’s Behavioral Sciences Research Advisor
Dante Spetter. Without their tireless patience, guidance, and steadfast devotion to my
success this wouldn’t have been possible. I would also like to thank all the faculty (across
my scholastic background) who consistently went out of their way to make the most of
my educational experience, my mentors, my friends, my girlfriend, and my family, as
well as The IBM Corporation, for helping kindle my intellectual curiosity and for their
continuous support. Many incredible people have gone to painstaking lengths to help me
along my journey as I strive towards becoming a better businessman, scholar, and human
being. And I thank you all again (as always).

ix
Table of Contents
Author’s Biographical Sketch.……………………………………………………………vi
Dedication………………………………………..……..…………………………..…....vii
Acknowledgements………………………………………………………………….….viii
List of Tables………………..……………………………………………….…………...xi
I. Introduction………………………………………………………………………….1
Motivation & Demotivation……………………………………………………….2
Social Loafing………………………………………………………….………….5
Virtual Collaboration…………………………………………………………….11
II. Research Method..…………………………………………………………………..17
Definition of Terms………..…………………………………………………….17
Participants……………………………………………………………………….18
Procedure…………………………………..…………………………………….19
Design……………………………………………………...…………………….20
Measures….. …………………………………………………………………….24
Analysis Plan ……………………………………………………………………24
III. Results………………………………………………………………………………26
Pilot (n = 18)………………………………………………….………………….27
Experimental vs. Control (n = 166)…………………………………………..….33
Perceived Cohesion Scale (PCS) (n = 124)………………………………...……35

x
IV. Discussion…………………………………………………………………………..41
Hypothesis, Brief Supportive Argument Overview, & Results in Context..…….41
Conclusions & Implications………………………………………………..…….47
New Questions Raised & Future Research Opportunities………………….……49
Research Limitations…………………………………………………………….51
Appendices…………………….……………………………………………………...…55
Appendix A: IRB Approval…………………………………………………..…55
Appendix B: Amazon Mechanical Turk HIT Description for Control Pilot/PCS….
……………………………………………………………………………………56
Appendix C: Amazon Mechanical Turk HIT Description for Experimental
Pilot/PCS…………………………………………………………………………72
Appendix D: Amazon Mechanical Turk HIT Description for Control (non-
PCS)………………………………………………………………………...…....74
Appendix E: Amazon Mechanical Turk HIT Description for Experimental (non-
PCS)……………………………………………………………………………...76
Appendix F: Bollen & Hoyle’s Perceived Cohesion Scale (PCS)……..….…….78
Appendix G: Debriefing…..…………………………………………….……….80
References………………………………………………………………………………..82

xi
List of Tables
Table 1 “Results of Individual and Group Conditions” (Kravitz & Martin, 1986, page
938)…………………………………………………………………………………...…...5
Table 2 Perceived Cohesion Scale (PCS) (Bollen & Hoyle, 1990)…...………...........23
Table 3 Perceived Cohesion Scale (PCS) for Amazon Mechanical Turk………...…...24
Table 4 Definitions of PCS Data Abbreviations in Tables……...…………..……..…..29
Table 5 Descriptive Statistics of Pilot Experimental Subjects.………….………..…...29
Table 6 Descriptive Statistics of Pilot Control Subjects…..……….……………..…...30
Table 7 ANOVA of Experimental Pilot vs. Control Pilot Subjects (n=20)………........30
Table 8 Test of Homogeneity of Variances among Pilot Experimental and Pilot Control
Subject population ………………………………………………………………….…...32
Table 9 Robust Tests for Equality of Means for “Happy To Be on the Team” (H2B),
“Perceive Working Community as One Of the Best” (OOB), & “Feelings Of Morale
Category” (EAW+H2B+OOB)………………………………………………………...….…...32
Table 10 Descriptive Statistics of all Experimental Subjects..…………….……..…...33
Table 11 Descriptive Statistics of all Control Subjects..………………….……...…...34
Table 12 Test of Homogeneity of Variances of all Experimental vs. all Control
Subjects…………………………………………………………………………………..34
Table 13 ANOVA of all Experimental vs. all Control Subjects ……………….……...35
Table 14 Descriptive Statistics of Experimental with PCS…………………….….…...38
Table 15 Descriptive Statistics of Control Subjects with PCS…………….……….…...38

xii
Table 16 Tests of Homogeneity of Variances of Experimental with PCS vs. Control
Subjects with PCS……….………………………………………………….……….…...39
Table 17 ANOVA of Experimental with PCS vs. Control Subjects with PCS…..…….40

1
Chapter I
Introduction
“Social Loafing” (as an unintended byproduct of team-oriented tasks) has been
researched for well over 100 years originating with the work of Max Ringelmann in the
1880’s (Kravitz & Martin, 1986). It is a psychological phenomenon associated with
reductions of motivation and productivity relative to increases in group size and a
multitude of other variables to be discussed (Karau & Williams, 1993) and it is a crucial
psychological dimension required for understanding human behavior in group settings.
Virtual environments have brought about a new platform to research this
behavior. One Stanford University study examined performance outcomes of a
population of 249 Chinese telemarketers from the Chinese firm CTrip Corporation over
9-months by bifurcating the sample population and comparing the work of individual
contributors working from home vs. those working in traditional settings (Bloom, Liang,
Roberts, & Ying, 2013). Among those who worked remotely performance increased by
13% (22% in self-selecting groups) and attrition dropped by 50%, but career
advancement (promotions, etc.) also dropped by half (Bloom et al., 2013). Collaborative
human efforts and technology are quickly merging but through increased self-disclosure
(resulting in heightened cohesion and identifiability) it may be possible to ameliorate
issues of both.

2
Motivation & Demotivation
“Social loafing…describes a person (sic) who provides less than maximum
possible participation or effort due to motivation and circumstance…In other words, the
motivational reason for reducing effort has been associated with individuals’ perceptions
that their contributions do not make a difference, while the circumstantial reason for this
phenomenon has been linked to environmental difficulties in identifying individual
contributions.” (Chidambaram & Tung, 2005, page 150).
Motivation, or more precisely the reduction of motivation, has been the primary
focus of much of the social loafing research to date (Karau & Williams, 1993). There is
evidence that individuals need groups in order to engage in self-observation and fulfill
inherent needs such as the need for belonging (Karau & Williams, 1993). These needs are
used as components in many of the theories used to explain loafing itself. Therefore it is
important to understand the motivating factors when attempting to understand social
loafing.
While some dimensions of motivation are stable, motivation can be influenced by
environment. Research by Amabile and colleagues using Factor Analysis of responses of
student and working adults to the Work Preference Inventory (which uses intrinsic vs.
extrinsic based questions to assess motivational orientations) suggests that some
dimensions of motivation are trait-like (total n= 13,351, with df of 399 and 404 for 2-
factor and 4-factor models respectively) (Amabile, Hill, Hennessey, & Tighe, 1994).
However, Kyndt and colleagues found motivation overall is not an unwavering
personality trait by using stepwise regression to evaluate the changes in 128 second-year
educational sciences students’ learning motivation relative to varied levels of perceived
workload/complexity (n =128 [122 females, 6 males], t-levels ranging from -3.944 to

3
6.478 when using stepwise regression for the variables high workload, high vs. low task
complexity, and the deep vs. surface levels of learning motivation that resulted) (Kyndt,
Dochy, Struyven, & Cascaller, 2013).
Participation motives are often thought of in two categories: personal and social
(Sun, Fang, & Lim, 2012). Social motives include advancing the community or
organization, creating a sense of belonging, and helping craft one’s social identity (Sun et
al., 2012). This has been explored by researchers such as Sun and colleagues who found
that among participants in transactional online communities representing wide-ranging
demographics, task complexity, self-efficacy, and intrinsic vs. extrinsic motivation can
play material mediating and moderating roles (2012). They used moderated multiple
regression (MMR) and Chi-Square analysis to analyze the results of a field survey of 700
randomly selected Chinese subjects (205 of whom participated and whose responses were
usable) who participated in IT-related tasks posted to Taskcn.com (a Chinese equivalent
of Amazon’s Mechanical Turk) (with model R2s ranging from .161 to .397 and t-statistics
for these variables ranging from 7.68 to 16.12) (Sun et al., 2012). Personal motives are
often subdivided into extrinsic motives (such as monetary gains, preservation/improving
of one’s image/reputation, other external motivators) and intrinsic motives where the act
is engaged in because it is enjoyable, leads to learning/improvement, and/or helps
improve one’s sense of self-worth (Sun et al., 2012).
Many factors influence motivation and effort. Roets and colleagues used the
WHO’s Likert-Type 5-item General Well-Being Index to analyze Chinese (n = 218),
European (n = 263), and American (n = 307) cultural groups to show that having
numerous choices increases the chances that a superior solution can be obtained and

4
increases feelings of well-being and autonomy but can be diminished by individual
attributes such as a quest for perfectionism (Roets, Schwartz, and Guan, 2012). It is
known from Iyenger and Lepper that too many choices can be demotivating; one example
cited was when Proctor & Gamble decreased the number of shampoos it had available for
sale from 26 to 15 their global sales of shampoo increased by 10% (Iyengar & Lepper,
2000).
In terms of productivity, being a member of a group or project team has varying
outcomes. For example, in decision making situations some have argued that the
inclusion of all group members is an ethical imperative, while others have argued that not
only is it not an ethical imperative but that in many instances it is detrimental (both to
group and individual) to include all participants in decision making (Lock, Schweiger, &
Latham, 1984). For instance, it does not make sense to include individuals in decision
making outside of their expertise, or in which they lack proficiency and/or knowledge
about the subject at hand, or where their input will lead to poorer quality decisions (Lock
et al., 1984).
Lastly, although an increase in satisfaction may be expected relative to an
individual’s ability to participate in planning and decision making, there is actually no
direct relationship between job satisfaction and job performance or productivity (Lock et
al., 1984). After reviewing performance data, researchers found that the greatest means
of increasing a group’s productivity was to fire the least motivated members (Lock et al.,
1984), which also led the remaining employees to fear potentially losing their jobs (Lock
et al., 1984).

5
Motivation and social loafing are inseparable as loafing is itself a byproduct of
reduced motivation, and its study is a measured examination of the reductions in
performance that result from individuals operating in groups. These reductions in
motivation are driven by a myriad of factors. Therefore identifying variables that change
motivation itself is also crucial to the investigation of social loafing.
Social Loafing
Max Ringelmann in the 1880s (Kravitz & Martin, 1986) evaluated work
efficiency of various work contributors, from horses and oxen to people and machines, in
different work positions and combinations (Kravitz & Martin, 1986). He had men,
ranging from a single individual to groups as large as 28 men, pull on a 5 meter rope
attached to a dynamometer to measure the peak force exerted (Kravitz & Martin, 1986).
He discovered that the force exerted by a group of men was consistently less than the sum
of the individual men’s exertion and that this delta increases with increases in group size
(Kravitz & Martin, 1986; Suleiman & Watson, 2008).
He observed a similar phenomenon with other tasks also, such as when turning a
large circular mill crank. Initially it seemed these must be coordination losses but despite
attempts to overcome them through the addition of harnesses, joined singing, etc., they
persisted (Kravitz & Martin, 1986).
Steiner (1972) suggested that reduced motivation due to diffusion of
responsibilities might better explain the reduced productivity (Karau & Williams, 1993;
Suleiman & Watson, 2008). Ingham, Levinger, Graves and Peckham (1974) tested this
hypothesis using ANOVA, a rope-pulling task, and six-member pseudogroups of subjects

6
ranging from young boys (n = 4), to college students (n = 17), and men (n = 7) and found
that there are motivational losses beyond coordination losses and diffusion of
Table 1
“Results of Individual and Group Conditions”
Individuals in
Group
Individual Efforts
(Sum)Group Effort
Group/Individual
Ratio
01-07 764.0 480.0 0.628
08-14 516.0 432.0 0.837
15-21 533.7 435.4 0.815
22-28 575.5 471.2 0.818
15-28 1,109.2 858.9 0.774
Note. “These are the data as presented by Ringelmann (1913b). Effort exerted is given inkilograms. Note that the number of significant digits given varies, and in two cases thegroup/individual ratio is off by .001.” (Kravitz & Martin, 1986, page 938)
responsibility (F = 26.36, p < .01) (Ingham, Levinger, Graves, & Peckham, 1974). They
blindfolded the participants and led them to believe that just as with Ringelmann’s study
they were pulling a rope with a group of peers (Ingham et al., 1974). But, in reality, they
were engaged in the activity by themselves and, just as was experienced in the actual
groups, performance in the pseudogroups dropped with increases to perceived group size
(Ingham et al., 1974).
Attempts to explain why individual effort declines in groups have encompassed
theoretical accounts of social loafing that are wide ranging. They include Latané’s
“Social Impact Theory” (Latané, 1981) where participants and those around them are
participating in the greater exchange of “social impact” by simultaneously serving as
targets and/or sources of social impact. As well as models such as Jackson and Williams’

7
“Arousal Reduction” theory which suggests that in situations when more individuals are
engaged in an activity it actually disproportionately reduces the arousal that would
motivate the individual onward had he been the only participant and the rest were instead
observers (Jackson & Williams, 1985). Other researchers attribute this arousal reduction
to a reduction in “evaluation potential” where the individual’s performance is partially
concealed by the presence of the group.
Social Loafing has been found to be consistent and generalizable across a large
number of populations and both physical and mental tasks including brainstorming,
running, signal detection, rowing, reacting to proposals, pumping air, evaluation /
judgment tasks (Hardy & Crace, 1991), quality ratings of editorials, quality ratings of
clinical therapists, quality ratings of poems, vigilance tasks on a computer screen,
negotiating mazes, and swimming (Karau & Williams, 1993), rope pulling and mill
churning (Kravitz & Martin, 1986), work tasks, shouting, and clapping (Suleiman &
Watson, 2008). Results have been consistent across a broad range of tasks, group
formats, and locations.
One variable that consistently influences the degree of social loafing is group size
(Kravitz & Martin, 1986). As group size increases so does social loafing (Karau &
Williams, 1993; Hardy & Crace, 1991). When Suleiman and Watson examined social
loafing in technology-supported teams in 2008 they had 332 undergraduate business
students broken into groups of 8 to 16 members and used ANOVA and a 3 x 2 x 2
factorial design paired with a modified General Management In-Basket Task (GMIB).
Participants were faced with a scenario where they were to assume the position of VP –
General Manager of the Space Electronics Division of a major research organization and

8
work their way through a series of in-basket correspondences with various business
deliverables and determine what actions they and their staff should take to complete
them. The researchers found that the incremental change in loafing relative to group size
is not linear, rather it continues to rise albeit at a slower rate as group size increases (p <
.0001) (Suleiman & Watson, 2008).
The evaluation potential of the individual participant, which reflects the degree to
which their contributions are identifiable, also mediates social loafing (Williams,
Harkins, & Latané, 1981) and is crucial to the proposed investigation. Williams, Harkins,
and Latané used a 5-second shouting task with college males (as individuals and in
groups of two and six) and paired this data with a 3 x 3 x 2 ANOVA to show a marked
difference between dyads who could easily identify the contributions of their partner (and
shouted at 59% of their potential) vs. those shouting in groups of six and whose efforts
were partially obscured by the scale of the group (and who shouted at 31% of potential);
with p < .01 and F-values ranging from 5.25 to 16.4. The effect of individual
identifiability is so powerful that in some studies evaluation, or even the perception of
evaluation, eliminated social loafing altogether (Karau & Williams, 1993). This is
attributed in part to the reduction of “deindividuation” (Miller, 2002; Hardy & Crace,
1991; Chidambaram & Tung, 2005).
Group cohesion (sometimes referred to as “group valence” in the literature), also
plays a role. Suleiman and Watson’s 2008 research also found that unlike the
preponderance of prior co-located group studies, identifiability didn’t impact the loafing
rate (F = 1.73, p = 0.19). They attributed their findings to the transient nature of the
groups (lack of familiarity, cohesiveness, and respect among the members, etc.)

9
(Suleiman & Watson, 2008). Karau and Williams conducted a meta-analysis in 1993 to
look at variables most influential to social loafing. One of the major categories for their
review was group valence, which included cohesion, the perceived prestige of the group’s
membership, and the strength of social ties within the various studies. They found that
loafing was lower when valence was high (p < .01, mean weighted effect size = -0.17,
95% CI for d of -0.41 to 0.08) and moderate (p < .001, mean weighted effect size = 0.25,
95% CI for d of 0.08 to 0.42), concluding that when “taken together, these findings
suggest that enhancing group cohesiveness or group identity might reduce or eliminate
social loafing” (Karau & Williams, 1993, page 696). Shiue, Chiu, and Chang found
through confirmatory factor analysis, convergent validity testing, and Chi-Square
analysis that the absence of cohesion was correlated with higher levels of social loafing
(average variance extracted for social loafing x cohesion was 0.62) (2010). Several other
authors have noted the presence of cohesion reduces social loafing (Karau & Williams,
1993; Hardy & Crace, 1991; Suleiman & Watson, 2008). And Evans and Dion, looking
specifically at the relationship of cohesion and performance, performed a Chi-square
based meta-analysis to show, over 27 studies selected from 317 studies reviewed,
cohesion has been found to materially impact performance outcomes (Chi-Square =
28.01, p < .05 with upper and lower limits of 0.643 and 0.085 respectively) (2012). They
found that cohesive groups will, on average, be at the 68th percentile of performance,
outperforming the typical non-cohesive group by 18 percentage points (Evans & Dion,
2012). Results of Karau and Williams’ (1993) meta-analysis of over 150 studies, which
coded for group cohesiveness ranging from acquaintances to teammates and friends to
couples, similarly showed that social loafing was completely eliminated when group

10
cohesion was high (p < .001) (Karau & Williams, 1993, page 696). Similarly,
commitment to a group goal positively predicted performance outcomes (Evans & Dion,
2012). However, Evans and Dion found that very high cohesion, which can be a
byproduct of extended group tenure, can be counterproductive, and was a predictor of
poor performance (2012). In summary, there appears to be an optimal level of cohesion
that will reliably result in superior team performance outcomes.
Hardy & Crace (1991) and Hardy & Latané (1988) compared standing vs. ad hoc
groups. Hardy and Latané had forty-eight 15 to 17-year old cheerleaders with two to five
years’ cheerleading experience engage in a shouting/clapping task while outfitted with
blindfolds and earphones and found that pre-existing teams of cheerleaders, who were
more likely to have already established a level of cohesion and who would continue to
work together in the future, displayed lower levels of social loafing (the differences in
group means were 0.96 vs. 0.91; note however that while, given their small sample size
of n = 48 girls split into dyads, statistical significance was not achieved, p = 0.15, this
material difference in average loafing is still a relevant finding and likely to have been
found significant with proper sample size and power) (1988).
A broad range of other variables have also been investigated, ranging from task
valence (which is the perceived prestige of the task), goal setting, making the
performance ratings of individuals available to the group, intrinsic importance / personal
significance (Suleiman & Watson, 2008), feedback, incentive value, task commitment,
group interaction, task difficulty, perceived necessity of efforts (Hardy & Crace, 1991),
expectations of co-worker performance (through the phenomenon of “social
compensation”) (Chidambaram & Tung, 2005), and task complexity (Sun et al., 2012) to

11
the uniqueness of each group member’s task and participant testing insight (Karau &
Williams, 1993). All of which decrease social loafing. Perceived participant skill on the
other hand has been found to increase it (Hardy & Crace, 1991). Age (Karau &
Williams, 1993), gender, and culture (Hardy & Crace, 1991; Karau & Williams, 1993;
Suleiman & Watson, 2008) also play roles in the degree to which social loafing takes
place.
Virtual Collaboration
Research on social loafing in virtual environments is just emerging, has largely
taken place in lab settings and thus lacks ecological validity, and has yet to be generalized
across most virtual work variables and settings (Chidambaram & Tung, 2005; Karau &
Williams, 1993; Liang, Lee, & Jang, 2013; Suleiman & Watson, 2008; Zoghbi-Manrique-
de-Lara, 2012). For example Suleiman & Watson (2008), in a 3 x 3 x 2 factorial design
considered group size using the General Management In-Basket Task (GMIB) discussed
examining social loafing in “virtual teams”. However they used co-located the
“virtualized” team (ie they were all in the same room). It is well established that the mere
presence of others changes behavior (Guerin, 1985).
Chidambaram & Tung (2005) also investigated social loafing in virtualized teams,
specifically investigating performance in co-located vs. dispersed groups, and did so in a
manner where the participants were truly isolated from one another, albeit still all in the
same building on campus (they were placed into different offices). They did this with an
idea-generation task using an Electronic Brainstorming (EBS) software to help
participants generate and record potential solutions to a problem their organization was

12
facing. The ideas generated by members (regardless of whether co-located or dispersed)
were seen in real time and were tagged with the contributor’s ID. The only differences
between the co-located and dispersed groups were whether or not the members were in
the same room and whether or not they could speak to each other in person (the dispersed
team members could only speak electronically through the EBS tool). Ultimately it was
the responsibility of the teams to cull ideas down to finalized lists of agreed upon
potential solutions. Chidambaram and Tung found no difference in performance between
virtual and co-located teams engaged in idea generation tasks, but that virtual teams
accomplished the tasks more efficiently as they didn’t have the same social pressures to
engage in unproductive overt work (which is activity that appears to be productive but
adds no value and is done just to appear productive). However, the study’s participants
were selected from a homogeneous population of undergraduate business students.
Chidambaram and Tung also observed that while group size was a predictor of
perceived cohesion (using the 5-item Seashore’s Index of Cohesiveness) in both types of
groups (p = .006), participants reported no significant difference in perceived cohesion
between the two group types (p = 0.273). These results were counterintuitive given
Chidambaram and others had found earlier that “greater geographic distance among
members has been shown to alter a group’s circumstances in many ways, including the
time needed to develop relational ties…[and]…the speed with which trust develops”
(Chidambaram & Tung, 2005, page 152). Research has also shown that human
participants interact with computers differently based upon variables such as the
participant’s mood and the sex of the computer’s voice (Liang, Lee, & Jang, 2013). This
shows the mixed findings in virtual group research to date and what Liang, Lee, and Jang

13
refer to as the “mindlessness” of humans in how they treat computers as social actors (or
at least facilitators of social actors). Humans’ perception of computers as social actors
was thought to potentially give additional support to this thesis’ experiment’s ability to
develop perceived cohesion to reduce loafing and therefore increase performance in
virtual groups (even though in reality that cohesion may not yet exist).
Neither Suleiman and Watson nor Chidambaram and Tung attempted to improve
performance by manipulating cohesion (although Chidambaram & Tung, 2005, did
measure cohesion using Seashore’s Index of Cohesion) and both these studies utilized a
limited, hypothetical task.
Given its nascence as a field, research of social loafing in virtual environments is
still uncovering unique nuances and discovering new challenges. Research results have
often been mixed. For instance, Suleiman and Watson (2008) found that, unlike with
other prior co-located group research, those participants in virtualized settings seemed
indifferent to identifiability (p = 0.34) and to loaf “significantly more” when they
received feedback (p < .0001) (Suleiman & Watson, 2008). They however discovered “a
sizeable and significant interaction” among their variables and “urge[d] interpretation
with caution” (Suleiman & Watson, 2008, page 302). It should be noted that their
identifiability was solely a participant’s name and nothing else. They suggest that under
certain circumstances, identifiability in virtual environments may not mitigate loafing in
the same way as physical teams but this may be due to lack of cohesion (Suleiman &
Watson, 2008). Perhaps this is driven by the transitory nature of virtualized relationships
or maybe without building any form of identity in the context of team cohesion the
identifiability does not mean much to the participant.

14
Despite the potential application of social loafing research to virtual groups, no
research to date has examined social loafing in virtualized groups of geographically
dispersed heterogeneous participants (i.e., how virtualized teams are often structured in
reality in the field). While it can be expected that the same factors that influence social
loafing in co-located groups will affect virtual groups, no study has experimentally
manipulated group cohesion in virtualized collaborative groups.
Research on virtualized collaboration looked solely at participants in individual
contributor roles (as call-center associates) and their findings were remarkable. For
example, Bloom, Liang, Roberts, and Ying (2013) wanted to address Senior Managers’
fears about “shirking” (a corporate loafing synonym) because of a concern that
employees would be beyond the watchful eye of their supervisors when afforded the
ability to work from home. A sample of 249 individuals from the employees of a 16,000
person Chinese call center were randomized to work from home for a 9-month trial
experiment and their individual changes in performance were measured (Bloom et al.,
2013). Compared to those who continued working from the call center site (the control)
those who were allowed to work from home (the experimental population) experienced a
13% increase in performance with no impact to work quality and a 50% decrease in
attrition (Bloom et al., 2013). Those who worked from home also reported higher
satisfaction with their work (Bloom et al., 2013). These results were replicated with a
second Chinese call-center and results were essentially identical (Bloom et al., 2013).
After the completion of the initial study, the entire workforce of this company was
allowed to select where they worked from and the performance of those choosing to
work-from-home rose 22% over the in-office population (Bloom et al., 2013).

15
Many virtual communities are commercial in nature (designated as “TVC’s” or
“Transactional Virtual Communities”) (Sun et al., 2012) and serve as marketplaces for
services such as Taskcn.com and Amazon’s Mechanical Turk, where individuals of
varied backgrounds come together as individual contributors to take part in work tasks,
posted by companies all over the world, to earn monetary rewards (Sun et al., 2012).
Given increasing costs of employing people the latter of these formats is growing in
popularity in a movement referred to as “crowdsourcing”, which “is a new outsourcing
approach that takes tasks as an open call to an undefined, large group of people” (Sun et
al., 2012). Modern experimenters have found that these communities, when used as
experimental data sources, produce data consistent with those collected from traditional
undergraduate lab settings (Buhrmester, Kwang, & Gosling, 2011; Bates & Lanza, 2013).
The benefits of virtual collaboration, including the cost savings of working
remotely, are numerous. Technology has been shown to bring about a more global
perspective and enhance the ability to think critically (Huffman, Whetten, & Huffman,
2013). As richer channels are used (that is to say mediums with more robust dimensions
such as teleconferencing instead of just instant message chatting) participants generally
had lower motivation loss and higher decision-making efficiency (Sin, 2011) so there is
an economic incentive for the technology to progress.
Ten percent of US citizens work from home at least one day a week. While
remote workers used to see income impairment, compensation differences disappeared by
the year 2000 (Bloom et al., 2013). Technology affords researchers, employers, and
instructors a way of increasing identifiability and ease of rendering feedback (Suleiman
& Watson, 2008). These factors conveniently give one an opportunity to potentially

16
reduce deindividuation by increasing individual evaluation potential and therefore
decrease loafing.
In conclusion, in virtual groups, as in co-located groups, cohesion, increased
evaluation potential, and decreased deindividuation reduce social loafing and increase
productivity. Therefore it was expected that participants who believed they had been
introduced to their co-workers would perceive the groups to be more cohesive, and that
they as individuals had become more identifiable, and that they therefore would work
harder and be more productive.

17
Chapter II
Research Method
The following sections include a review of the definition of terms and highlight
the details of participant selection, procedure, design, measures, and analysis plan that
went into preparation of the experiment discussed herein. They are intended to provide
the reader with the ability to better understand and, if needed, replicate this study in the
future.
Definition of Terms
A Virtual Community: is “an aggregation of individuals or business partners who interact
around a shared interest, where the interaction is at least supported and/or mediated by
technology and guided by some protocols or norms” (Sun et al., 2012, page 13).
Coactive Task: is a task in which the performance of individuals within a group (as well
as the group as a whole) is measured (Karau & Williams, 1993).
Collective Task: is a task in which the performance of the group (but not the individuals
within it) is measured (Karau & Williams, 1993).
Deindividuation: is a state in which “individuals are extricated from responsibility for
their actions simply because they no longer have an acute awareness of the identity of
18
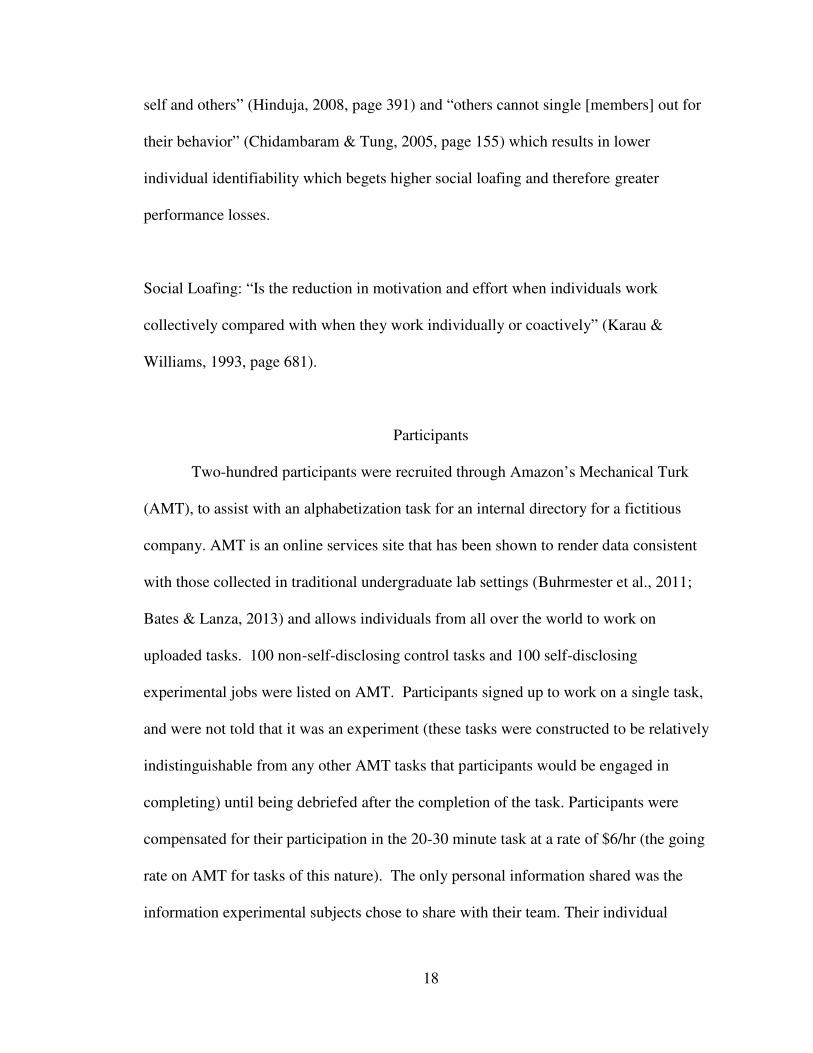
self and others” (Hinduja, 2008, page 391) and “others cannot single [members] out for
their behavior” (Chidambaram & Tung, 2005, page 155) which results in lower
individual identifiability which begets higher social loafing and therefore greater
performance losses.
Social Loafing: “Is the reduction in motivation and effort when individuals work
collectively compared with when they work individually or coactively” (Karau &
Williams, 1993, page 681).
Participants
Two-hundred participants were recruited through Amazon’s Mechanical Turk
(AMT), to assist with an alphabetization task for an internal directory for a fictitious
company. AMT is an online services site that has been shown to render data consistent
with those collected in traditional undergraduate lab settings (Buhrmester et al., 2011;
Bates & Lanza, 2013) and allows individuals from all over the world to work on
uploaded tasks. 100 non-self-disclosing control tasks and 100 self-disclosing
experimental jobs were listed on AMT. Participants signed up to work on a single task,
and were not told that it was an experiment (these tasks were constructed to be relatively
indistinguishable from any other AMT tasks that participants would be engaged in
completing) until being debriefed after the completion of the task. Participants were
compensated for their participation in the 20-30 minute task at a rate of $6/hr (the going
rate on AMT for tasks of this nature). The only personal information shared was the
information experimental subjects chose to share with their team. Their individual

19
performance and all individual identifiers (such as Worker ID and any information the
subject chose to share) were kept confidential.
Procedure
After receiving approval from the Harvard Committee on the Use of Human
Subjects, participants were recruited through AMT as discussed above. Amazon
Mechanical Turk workers are tiered into recreational and elite level workers referred to as
“Masters”. For purposes of ensuring quality submissions, tasks were posted in a manner
that all workers recruited were of a “Masters” designation.
Given the goal of maintaining ecological validity (McCreery, Schrader, Krach, &
Boone, 2013), AMT was an appropriate platform for participant recruitment and task
completion. Participants’ tasks in this experimental protocol were indistinguishable from
any other task they would complete on AMT.
Each of the experiments were uploaded to AMT as a Writing task that had
Categorization and Alphabetization advertised as key words. The recruiting
advertisement specified that each participant could only sign up once. Upon selection of
one of the tasks they were asked to sort short lists of companies alphabetically using
acronyms composed of the first initials to the company’s full name.
As the tasks were completed the protocol data was downloaded from the AMT
dropbox and scored by hand. All responses were screened to ensure quality submissions,
that instructions were followed, that no individual completed more than one task, that the
time taken was consistent with instruction, etc. Following screening, payment was
rendered to participants and the data was analyzed.

20
Design
Pseudogroups are those where the participant believes s/he is working in a group
when in reality there is no group (Suleiman & Watson, 2008). Pseudogroups were
utilized to remove any chance of conflating loafing with coordination losses (which are
performance drops as a byproduct of inefficiencies of working together) (Karau &
Williams, 1993). Hypothetical group size was small (in this case five participants) in
order to mimic the size of a typical working group and because self-disclosure was
believed to carry a higher perception of evaluation potential in a small group.
The assigned task was appropriate for this investigation because it could not be
automated easily and participants had little incentive to build formulas rather than
complete the task manually. Furthermore, instructions specified that no automation was
allowed. Each participant was given the same task list of 50 groups with five company
names apiece. This length (50 x 5) was constructed by this researcher to be an impossible
task to complete in its entirety in 20 minutes without automation; therefore participants
who completed all 50 groups correctly in the 20 minute allotment were removed to
guarantee the task had been done manually as instructed. A 20-minute deadline is
consistent with AMT working culture as many assignments (referred to as “HITS”) are
designed to be 10 to 30 minutes in duration and all HITS have specified time allotments.
Company names were generated by taking a list of US companies from
http://en.wikipedia.org/wiki/List_of_companies_of_the_United_States and then breaking
them into one word components and subsequently mixing and matching them randomly
using an Excel algorithm designed by this researcher. Therefore, all company names
were fictional and they were always three words long.

21
The instructions varied by group (control vs. experimental) and in addition to the
methodology explained above contained the following guidance…
Control Condition Instructions:
You’re the final member of a five-person team engaged in this type of task. The
work you do, while tied to you, will be combined with theirs in the final product and any
remaining groupings you don’t get to in the time allotted will be finished off by one of
them.
In the text box at the bottom, alphabetize of as many of the following group lists
as you can within 20 minutes. Set a timer, it is vital that you do not exceed 20 minutes on
the activity itself (it's okay if you don't get all the way through the lists; just mark with an
asterisk (*) where you stop). Absolutely no automation (formulas, macros, VBA, etc.)
allowed.
Experimental participants received the same instructions except that they had to
prepare a quick introduction (i.e., engage in self-disclosure) and read the introductions of
their other four “Group” members in advance of the 20 minute exercise (these
introductions were drafted in advance and were standard among Experimental Group
recipients):
But first, before beginning the 20-minute task activity, please take a moment to
share a little about yourself for your teammates to read. Here are what your four
teammates posted, please take a moment to read and familiarize yourself with your team:
I’m Jack. I’m tall (over 190cm) and live in Sweden,, I love football and handball
and orienteering.
My name is Samantha. I’m a stay-at-home-mom and I live in the US. I love MTK
because it allows me to pick up some extra cash on the side. I <3 it!
Georrig – Wie gehts. Germany checking in. Plugging away as always.
Greetings. I’m Pallavi. While I wrote my MBA in the US I’m based out of
Mumbai.
Before beginning the task please insert a little about yourself for your teammates
to read:

22
In this experiment self-disclosure was the experimental variable expected to lead
to differences in performance through reduced social loafing and therefore the
performance was the dependent variable being measured.
To assess experimental validity of the cohesion manipulation, this researcher
conducted a pilot test of 10 participants from each group (experimental, control) to
evaluate the effectiveness of the introduction manipulation on scores of the Perceived
Cohesion Scale (PCS) (Bollen & Hoyle, 1990). PCS has been shown to successfully
measure perceived cohesion in small transient groups like those in this thesis’ experiment
(Chin, Pearson, & Stollak, 1999) and was included as an additional 5-minute final
requirement at the bottom of the pilot tasks.
In accordance with the originating 1990 work of Kenneth Bollen and Rick Hoyle,
this study used the Perceived Cohesion Scale (PCS), a six-question, Likert-based (0-10,
with 10 representing the highest agreement) questions:
Table 2
Perceived Cohesion Scale (PCS)
r¡‹†¡?›¢?a¡“›‹£ƒ‹£
h?¢¡¡“?\?†¡‹†¡?›¢?‘¡“›‹£ƒ‹£?‡›?M
h?¢¡¡“?‡⁄\‡?h?\«?\?«¡«‘¡–?›¢?‡⁄¡?ǀ›««·‹ƒ‡„M
h?†¡¡?«„†¡“¢?\†?\?fi\–‡ ›¢ ‡⁄¡ ǀ›««·‹ƒ‡„M
e¡¡“ƒ‹£†?›¢?l›–\“¡
h?\«?¡‹‡⁄·†ƒ\†‡ƒǀ?\‘›·‡?M
h?\«?⁄\fifi„?‡›?‘¡?\‡?z“ƒ¶¡?ƒ‹|?M
ƒ†?›‹¡?›¢?‡⁄¡?‘¡†‡?†ǀ⁄››“†?zǀƒ‡ƒ¡†|?ƒ‹?‡⁄¡?‹\‡ƒ›‹M
Note. (Bollen & Hoyle, 1990). Used with permission from Kenneth Bollen and Rick Hoyle.

23
Given Amazon Mechanical Turk is a transactional online work community thequestions was tailored accordingly:
Table 3
Perceived Cohesion Scale (PCS) for Amazon Mechanical Turk
r¡‹†¡?›¢?a¡“›‹£ƒ‹£
h?¢¡¡“?\?†¡‹†¡?›¢?‘¡“›‹£ƒ‹£?‡›?l„?s¡\«M
h?¢¡¡“?‡⁄\‡?h?\«?\?«¡«‘¡–?›¢?‡⁄¡?«\”›‹?l¡ǀ⁄\‹ƒǀ\“?s·–¤ǀ›««·‹ƒ‡„M
h?†¡¡?«„†¡“¢?\†?\?fi\–‡?›¢?‡⁄¡? «\”›‹?l¡ǀ⁄\‹ƒǀ\“?s·–¤ǀ›««·‹ƒ‡„M
e¡¡“ƒ‹£†?›¢?l›–\“¡
h?\«?¡‹‡⁄·†ƒ\†‡ƒǀ?\‘›·‡?v›–¤ƒ‹£?n‹“ƒ‹¡ M
h?\«?⁄\fifi„?‡›?‘¡?\‡?«\”›‹?l¡ǀ⁄\‹ƒǀ\“?s·–¤M
«\”›‹?l¡ǀ⁄\‹ƒǀ\“?s·–¤ƒ†?›‹¡?›¢?‡⁄¡?‘¡†‡ •›–¤ƒ‹£?ǀ›««·‹ƒ‡ƒ¡† ƒ‹?‡⁄¡ •›–“~M
It was delivered in context as follows:
s⁄\‹¤†?¢›–?⁄¡“fiƒ‹£?·†?›·‡?•ƒ‡⁄?‡⁄ƒ†?‡\†¤M??o“¡\†¡?ƒ‹~ƒǀ\‡¡?„›·–?¢¡¡“ƒ‹£†?›‹?\?†ǀ\“¡?›¢?O?‡›
PO?G•ƒ‡⁄?O?–¡fi–¡†¡‹‡ƒ‹£?‡⁄¡?⁄ƒ£⁄¡†‡?~ƒ†\£–¡¡«¡‹‡?•ƒ‡⁄?‡⁄¡?†‡\‡¡«¡‹‡?\‹~?PO?–¡fi–¡†¡‹‡ƒ‹£?‡⁄¡
⁄ƒ£⁄¡†‡?\£–¡¡«¡‹‡?•ƒ‡⁄?‡⁄¡?†‡\‡¡«¡‹‡H?‹¡‚‡?‡›?‡⁄¡?¢›““›•ƒ‹£?†‡\‡¡«¡‹‡†Y
r¡‹†¡?›¢?a¡“›‹£ƒ‹£
h?¢¡¡“?\?†¡‹†¡?›¢?‘¡“›‹£ƒ‹£?‡›?«„?‡¡\«M?
h?¢¡¡“?‡⁄\‡?h?\«?\?«¡«‘¡–?›¢?‡⁄¡?«\”›‹ l¡ǀ⁄\‹ƒǀ\“s·–¤?ǀ›««·‹ƒ‡„M?
h?†¡¡?«„†¡“¢?\†?\?fi\–‡?›¢?‡⁄¡?«\”›‹?l¡ǀ⁄\‹ƒǀ\“?s·–¤?ǀ›««·‹ƒ‡„M?
e¡¡“ƒ‹£†?›¢?l›–\“¡
h?\«?¡‹‡⁄·†ƒ\†‡ƒǀ?\‘›·‡?•›–¤ƒ‹£?›‹“ƒ‹¡M?
h?\«?⁄\fifi„?‡›?‘¡?\‡?«\”›‹?l¡ǀ⁄\‹ƒǀ\“s·–¤M?
«\”›‹?l¡ǀ⁄\‹ƒǀ\“s·–¤?ƒ†?›‹¡?›¢?‡⁄¡?‘¡†‡?•›–¤ƒ‹£?ǀ›««·‹ƒ‡ƒ¡†?ƒ‹?‡⁄¡?•›–“~M??
s⁄\‹¤†?¢›–?„›·–?ƒ‹fi·‡@
This researcher received written permission to use the PCS from both the authors.

24
Measures
Each participant was given a standardized list of 50 sets of names with each set
containing five different three-word company names to alphabetize by the names’
acronyms. Responses were scored as receiving 1 point for each set of names that is
correctly alphabetized with a maximum of 50 points in the event that all 50 sets of names
are alphabetized correctly. Given all participants were afforded 20 minutes to complete
as many grouping as possible, an individual’s performance was defined as the total
number of points earned from correctly alphabetizing the sets. All participants’ task
times were recorded by AMT and therefore could be screened for general compliance
with total allotted time instructions.
Analysis Plan
Upon completion of data collection, a Between Groups One-Way Analysis Of
Variance (ANOVA) was used to compare the mean task performance of the experimental
vs. control groups as well as differences in their responses to the Perceived Cohesion
Scale (PCS) among the participants it was collected for. It was expected that
experimental group participants would have higher average task scores than control
participants and that experimental participants would perceive a greater sense of
cohesion.
As with the collection of any set of data there were anomalies in some of the
responses received from participants who did not follow instructions. Several
participants misunderstood the meaning of “alphabetization” and confused it with the act
of creating acronyms. Others responded to the Likert-Scale-based (0-10 point) Perceived

25
Cohesion Scale with “yes” / “no” responses. Given the placement of only one text box
for purposes of providing responses, some participants completed the alphabetization task
to the best of their ability but then failed to respond to the Perceived Cohesion Scale
component, submitting a response to a pilot posting in a manner that was consistent with
the non-pilot postings (i.e. without the PCS survey). In these events the submissions
were categorized (for purposes of analysis) as the type of task they were completed as
(i.e. a Control PCS condition submitted without a PCS survey was treated as a Control
submission). This was deemed an appropriate approach given the alphabetization task
itself was strictly limited to 20 minutes regardless of the task the participant was involved
in (Experimental Pilot (EP), Control Pilot (CP), Experimental (E), or Control (C)).

26
Chapter III
Results
Differences in quantity and quality of performance, and differences in morale
(although not cohesion itself), were all in the expected direction, though none achieved
levels of statistical significance driven largely by large variances in performance within
the datasets. The standard deviation (SD) for number of correct answers out of 50 for
experimental and control subjects was 9.73 and 9.566 on average attempts of 19.8442 and
19.393 alphabetized groupings respectively. A sample size required to achieve statistical
significance at these levels of performance differences and these levels of standard
deviation would measure in the thousands. However, even in the absence of statistical
significance this research should be considered a valuable point of reference for future
researchers.
Of the 200 total tasks (100 experimental, 100 control) posted to Amazon
Mechanical Turk, 166 remained (77 experimental, 89 control) in the analysis after
removing submissions that didn’t follow instructions (e.g. submissions with acronyms
only, attempts made at alphabetizing the individual pieces of each of the 3-piece
company names, alphabetizing entire list of 250 entries regardless of groups, mixing
company names among the groups, second attempts made by a couple participants).

27
Pilot (n = 18)
In an effort to evaluate both the proposed experiment and to test for cohesion
manipulation, the initial pilot tasks also included a survey with the Perceived Cohesion
Scale. The results of this pilot (n=18), while not statistically significant, directionally
supported both the hypothesis and the effectiveness of the cohesion manipulation. EP
plot participants averaged 21.38 correct responses on the alphabetizing task vs. the CP
participants’ 14.80 of 50, a full 44.4% difference (F(1, 16) = 1.38, p > .05). Furthermore,
because participants accomplished different numbers of attempts at alphabetizing the
potential 50 groups, it became evident that EP participants were also outperforming CP
participants in the number of correct answers per task attempt by 4.275% (21.38 correctly
alphabetized groupings out of 23.63 group alphabetization attempts on average, or
90.00% accuracy, among EPs vs. 14.81 correct out of 16.70 group alphabetization
attempts on average, or 86.31% accuracy, among CPs; F(1, 16) = 1.48, p > .05) in
addition to surpassing them in number of correct submissions overall. Not only were
experimental (i.e., self-disclosing) subjects outperforming control subjects in number of
correct answers, they were also more efficient at creating those numbers by making fewer
mistakes.
In the “Sense of Belonging” category (SOB+MOC+POC) (composed of
responses to statements of “I feel a sense of belonging to my team” (SOB), “I feel that I
am a member of Amazon Mechanical Turk community” (MOC), and “I see myself as a
part of the Amazon Mechanical Turk community” (POC)), EP participants scored 4.07%
higher than CP participants with responses cumulatively averaging scores of 23.00 of 30
among EP participants vs. 22.10 of 30 among CP participants (F(1, 16) = .19, p > .05).

28
Within the three statements comprising the “Sense of Belonging” category the
SOB+MOC+POC the "I feel a sense of belonging to my team” (SOB) statement itself
saw EP participants underperforming by 11.02% with an average 5.25 of 10 vs. 5.90
among CP participants (F(1, 16) = .21, p > .05). In the "I feel that I am a member of the
Amazon Mechanical Turk community” (MOC) statement EP subjects outscored CP
participants subjects by 10.94% with averages of 8.88 of 10 vs. 8.00 among CP
participants (F(1, 16) = 1.56, p > .05). In the "I see myself as a part of the Amazon
Mechanical Turk community" (POC) statement, EP subjects once again outperformed
CPs, this time by 4.07%, with an average statement score of 8.88 of 10 vs. 8.20 of 10
among CP participants (F(1, 16) = 1.14, p > .05).
In the “Feelings of Morale” category (EAW+H2B+OOB) (composed of responses
to statements of “I am enthusiastic about working online” (EAW), “I am happy to be at
Amazon Mechanical Turk” (H2B), and “Amazon Mechanical Turk is one of the best
working communities in the world” (OOB)), EP participants again outperformed CPs and
did so by 14.88% with an average cumulative score of 26.25 of 30 vs. 22.85 of 30 among
CP participants (F(1, 16) = 1.64, p > .05). In the “I am enthusiastic about working
online” (EAW) statement EP participants outperformed CP participants by 12.75% with
average scores of 8.63 of 10 vs. 7.65 among CP participants (F(1, 16) = 1.25, p > .05). In
the “I am happy to be at Amazon Mechanical Turk” (H2B) statement again EP
participants outperformed CP participants by 18.67% with average scores of 9.38 of
10.00 vs. 7.90 of 10 among CP participants (F(1, 16) = 3.05, p > .05). In the “Amazon
Mechanical Turk is one of the best working communities in the world” (OOB) statement
EP participants outperformed CP participants by 13.01% with average scores of 8.25 of

29
10 vs. 7.3 among pilot control participants (F(1, 16) = .70, p > .05). The potential reasons
behind these outcomes will be discussed in detail in the discussion section to follow.
Table 4
Definitions of PCS Data Abbreviations in Tables
Abbreviation In Tables PCS Statement Subjects Responded To
Sense Of Belonging Category (SOB+MOC+POC) "Sense of Belonging" Category sum of components; SOB + MOC + POC
Sense Of Belonging to My Team (SOB) "I feel a sense of belonging to my team."
Feeling Like a Member Of AMT Community (MOC) "I feel that I am a member of the Amazon Mechanical Turk community."
See Self as Part Of AMT Community (POC) "I see myself as a part of the Amazon Mechanical Turk community."
Feelings Of Morale Category (EAW+H2B+OOB) "Feelings of Morale" Category Sum of components; EAW + H2B + OOB
Enthusiastic About Working (EAW) "I am enthusiastic about working online."
Happy To Be on the Team (H2B) "I am happy to be at Amazon Mechanical Turk."
Perceive Working Community as One Of the Best "Amazon Mechanical Turk is one of the best working communities
(OOB) in the world."
Note. All scores are on a Likert 0-10 Scale with 0 = lowest & 10 = highest)
Table 5
Descriptive Statistics of Pilot Experimental Subjects
Variable (n = 8) Range Min. Max. Mean Std. Dev.
Performance Data
Percent of Correct Answers 0.84 14.0% 98.0% 47.3% 0.27
Number of Correct Answers (of 50) 42.00 7.00 49.00 21.38 13.46
Number of Groups Attempted (of 50) 43.00 7.00 50.00 23.63 13.54
Number of Attempted Groups Correct (of 50) 42.00 7.00 49.00 21.37 13.46
Percent of Group Attempts Correct 0.26 74.0% 100.0% 90.0% 0.10
PCS Data
Sense Of Belonging to My Team (SOB) 9.00 1.00 10 5.25 2.92
Feeling as a Member Of AMT Community (MOC) 3.00 7.00 10 8.88 1.36
See Self as Part Of AMT Community (POC) 3.00 7.00 10 8.88 1.13
Sense Of Belonging Category (SOB+MOC+POC) 13.00 17.00 30 23.00 4.41
Enthusiastic About Working (EAW) 5.00 5.00 10 8.63 1.85
Happy To Be on the Team (H2B) 2.00 8.00 10 9.38 0.92
Perceive Working Community as One Of the Best (OOB) 4.00 6.00 10 8.25 1.58
Feelings Of Morale Category (EAW+H2B+OOB) 10.00 20.00 30 26.25 3.69

30
Table 6
Descriptive Statistics of Pilot Control Subjects
Variable (n = 10) Range Min. Max. Mean Std. Dev.
Performance Data
Percent of Correct Answers 0.62 8.0% 70.0% 29.6% 0.21
Number of Correct Answers (of 50) 31.00 4.00 35.00 14.80 10.30
Number of Groups Attempted (of 50) 29.00 6.00 35.00 16.70 10.63
Number of Attempted Groups Correct (of 50) 31.00 4.00 35.00 14.81 10.31
Percent of Group Attempts Correct 0.33 67.0% 100.0% 86.3% 0.13
PCS Data
Sense Of Belonging to My Team (SOB) 10.00 0.00 10 5.90 3.11
Feeling as a Member Of AMT Community (MOC) 4.00 6.00 10 8.00 1.56
See Self as Part Of AMT Community (POC) 4.00 6.00 10 8.20 1.48
Sense Of Belonging Category (SOB+MOC+POC) 14.00 16.00 30 22.10 4.41
Enthusiastic About Working (EAW) 5.00 5.00 10 7.65 1.83
Happy To Be on the Team (H2B) 6.00 4.00 10 7.90 2.23
Perceive Working Community as One Of the Best (OOB) 8.00 2.00 10 7.30 2.87
Feelings Of Morale Category (EAW+H2B+OOB) 19.00 11.00 30 22.85 6.72
When testing these pilot data for homogeneity using a Levene’s test, some of the
data representing scored responses to PCS statements were found to be statistically
significant (suggesting that the variances between the groups was heteroskedastic).
Therefore a “Robust Tests of Equality of Means” (containing both Welch and Forsythe
tests) was included for those categories. Even after correcting for heteroskedasticity of
the data, both Welch and Forsythe these data did not result in statistical significance (p >
.05).

31
Table 7
ANOVA of Experimental Pilot vs. Control Pilot Subjects (n=18)
Variable (n = 18) SS MS F(1, 16) p
Performance Data
Percent of Correct Answers
Between 0.077 OMOVV PMRWR OMQTV
Within 0.889 OMOTU
Number of Correct Answers (of 50)
Between 192.136 PXQMPRU PMRWR OMQTV
Within 2223.48 PRWMXUV
Number of Groups Attempted (of 50)
Between 213.136 QPRMPRU PMSWR OMQSP
Within 2299.98 PSRMVSW
Number of Attempted Groups Correct (of 50)
Between 191.217 PXPMQPV PMRVU OMQTW
Within 2223.76 PRWMXWT
Percent of Group Attempts Correct
Between 0.006 OMOOU OMSST OMTPS
Within 0.22 OMOPS
PCS Data
Sense Of Belonging to My Team (SOB)
Between 1.878 PMWVW OMQOT OMUTV
Within 146.4 XMPT
Feeling as a Member Of AMT Community (MOC)
Between 3.403 RMSOR PMTUP OMQQX
Within 34.875 QMPW
See Self as Part Of AMT Community (POC)
Between 2.025 QMOQT PMPRW OMROQ
Within 28.475 PMVW
Sense Of Belonging Category (SOB+MOC+POC)
Between 3.6 RMU OMPWT OMUVR
Within 310.9 PXMSRP
Enthusiastic About Working (EAW)
Between 4.225 SMQQT PMQTS OMQVX
Within 53.9 RMRUX
Happy To Be on the Team (H2B)
Between 9.669 XMUUX RMOSV OMP
Within 50.775 RMPVR
Perceive Working Community as One Of the Best (OOB)
Between 4.011 SMOPP OMVOP OMSPT
Within 91.6 TMVQT
Feelings Of Morale Category (EAW+H2B+OOB)
Between 51.378 TPMRVW PMURU OMQPX
Within 502.525 RPMSOW

32
Table 8
Test of Homogeneity of Variances among Pilot Experimental and Pilot Control Subject
populations
Variable (n = 18) Lavene Statistic p
Performance Data
Percent of Correct Answers OMQUR OMUPT
Number of Correct Answers (of 50) OMQUR OMUPT
Number of Groups Attempted (of 50) OMSUR OMTOU
Number of Attempted Groups Correct (of 50) OMQTV OMUPX
Percent of Group Attempts Correct QMSOW OMPSO
PCS Data
Sense Of Belonging to My Team (SOB) OMOPO OMXQO
Feeling as a Member Of AMT Community (MOC) OMOPS OMXOW
See Self as Part Of AMT Community (POC) OMWPW OMRVX
Sense Of Belonging Category (SOB+MOC+POC) OMOOR OMXTW
Enthusiastic About Working (EAW) OMOPS OMXOW
Happy To Be on the Team (H2B) POMQPS OMOOU
Perceive Working Community as One Of the Best (OOB SMXST OMOSP
Feelings Of Morale Category (EAW+H2B+OOB) VMOWR OMOPV
Table 9
Robust Tests for Equality of Means for “Happy To Be on the Team” (H2B), “Perceive
Working Community as One Of the Best” (OOB), & “Feelings Of Morale Category”
(EAW+H2B+OOB)
Variable (n = 18) Statistic p
Happy To Be on the Team (H2B)
Welch RMUOR OMOWP
Brown-Forsythe RMUOR OMOWP
Perceive Working Community as One Of the Best (OOB)
Welch OMVXT OMRWV
Brown-Forsythe OMVXT OMRWV
Feelings Of Morale Category (EAW+H2B+OOB)
Welch PMWTU OMPXS
Brown-Forsythe PMWTU OMPXS
33
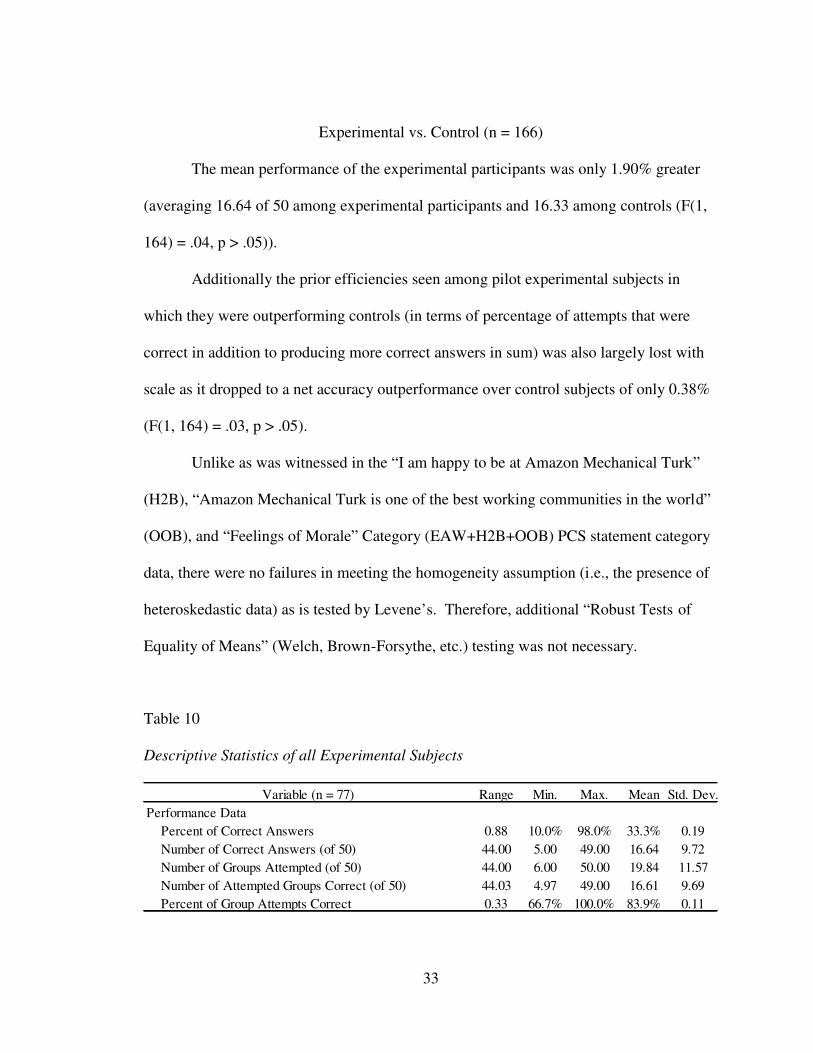
Experimental vs. Control (n = 166)
The mean performance of the experimental participants was only 1.90% greater
(averaging 16.64 of 50 among experimental participants and 16.33 among controls (F(1,
164) = .04, p > .05)).
Additionally the prior efficiencies seen among pilot experimental subjects in
which they were outperforming controls (in terms of percentage of attempts that were
correct in addition to producing more correct answers in sum) was also largely lost with
scale as it dropped to a net accuracy outperformance over control subjects of only 0.38%
(F(1, 164) = .03, p > .05).
Unlike as was witnessed in the “I am happy to be at Amazon Mechanical Turk”
(H2B), “Amazon Mechanical Turk is one of the best working communities in the world”
(OOB), and “Feelings of Morale” Category (EAW+H2B+OOB) PCS statement category
data, there were no failures in meeting the homogeneity assumption (i.e., the presence of
heteroskedastic data) as is tested by Levene’s. Therefore, additional “Robust Tests of
Equality of Means” (Welch, Brown-Forsythe, etc.) testing was not necessary.
Table 10
Descriptive Statistics of all Experimental Subjects
Variable (n = 77) Range Min. Max. Mean Std. Dev.
Performance Data
Percent of Correct Answers 0.88 10.0% 98.0% 33.3% 0.19
Number of Correct Answers (of 50) 44.00 5.00 49.00 16.64 9.72
Number of Groups Attempted (of 50) 44.00 6.00 50.00 19.84 11.57
Number of Attempted Groups Correct (of 50) 44.03 4.97 49.00 16.61 9.69
Percent of Group Attempts Correct 0.33 66.7% 100.0% 83.9% 0.11

34
Table 11
Descriptive Statistics of all Control Subjects
Variable (n = 89) Range Min. Max. Mean Std. Dev.
Performance Data
Percent of Correct Answers 0.74 6.0% 80.0% 32.7% 0.19
Number of Correct Answers (of 50) 37.00 3.00 40.00 16.33 9.57
Number of Groups Attempted (of 50) 46.00 4.00 50.00 19.39 11.31
Number of Attempted Groups Correct (of 50) 37.00 3.00 40.00 16.26 9.54
Percent of Group Attempts Correct 0.41 59.0% 100.0% 83.6% 0.12
Table 12
Test of Homogeneity of Variances of all Experimental vs. all Control Subjects
Variable (n = 18) Lavene Statistic p
Performance Data
Percent of Correct Answers OMOOO OMXWQ
Number of Correct Answers (of 50) OMOOO OMXWQ
Number of Groups Attempted (of 50) OMOTQ OMWQO
Number of Attempted Groups Correct (of 50) OMOOP OMXVQ
Percent of Group Attempts Correct OMVXQ OMRVT

35
Table 13
ANOVA of all Experimental vs. all Control Subjects
Variable (n = 166) SS MS F(1, 164) p
Performance Data
Percent of Correct Answers
Between 0.002 OMOOQ OMOSR OMWRU
Within 6.096 OMORV
Number of Correct Answers (of 50)
Between 3.981 RMXWP OMOSR OMWRU
Within 15,239.4 XQMXQR
Number of Groups Attempted (of 50)
Between 8.393 WMRXR OMOUS OMWOO
Within 21,443.4 PROMVTQ
Number of Attempted Groups Correct (of 50)
Between 4.958 SMXTW OMOTS OMWPV
Within 15,135.8 XQMQXP
Percent of Group Attempts Correct
Between 0.000 OMOOO OMORR OMWTU
Within 2.116 OMOPR
Perceived Cohesion Scale (n = 124)
While only originally intending to collect cohesion data for the first 20 subjects
(i.e. the pilot) it was determined that a larger PCS sampling was needed in order to
achieve statistical power. Therefore, after 40 participants (20 Experimental and 20
Control) completed the alphabetization protocol without the PCS this researcher
ultimately decided to collect PCS data for the remaining 140 subjects. After removing
those who didn’t follow the directions, there were 124 usable cohesion surveys.
However, even with the larger sample size, the results were not significant largely
driven by the large variances within the sample data.

36
Interestingly, these results differed from the pilot sample. On the “Sense of
Belonging” category (SOB+MOC+POC), which is composed of responses to statements
of “I feel a sense of belonging to my team” (SOB), “I feel that I am a member of Amazon
Mechanical Turk community” (MOC), “I see myself as a part of the Amazon Mechanical
Turk community” (POC), experimental subjects scored cumulatively 4.21% worse in the
category on average than control participants with scored responses cumulatively
averaging 19.48 of 30 among experimental participants vs. 20.34 of 30 among control
participants (F(1, 122) = .53, p > .05). Within the three statements comprising the “Sense
of Belonging” category (SOB+MOC+POC) the “I feel a sense of belonging to my team.”
(SOB) statement itself saw experimental pilot participants underperforming by 7.59%
with an average 4.61 of 10 vs. 4.99 among control participants (F(1, 122) = .45, p > .05).
In the "I feel that I am a member of the Amazon Mechanical Turk community” (MOC)
statement experimental pilot subjects were outscored by pilot subjects by 2.39% with
averages of 7.46 of 10 vs. 7.65 among control participants (F(1, 122) = .20, p > .05). In
the "I see myself as a part of the Amazon Mechanical Turk community" (POC) statement,
experimental subjects were outscored by controls, by 3.95%, with an average statement
score of 7.40 of 10 vs. 7.71 of 10 among control participants (F(1, 122) = .53, p > .05).
While also not statistically significant, in the “Feelings of Morale” category
(EAW+H2B+OOB) which is composed of responses to statements of “I am enthusiastic
about working online” (EAW), “I am happy to be at Amazon Mechanical Turk (H2B),
and “Amazon Mechanical Turk is one of the best working communities in the world”
(OOB), experimental subjects outperformed controls and did so by 2.26% with an
average cumulative score of 22.82 of 30 vs. 22.32 of 30 among control participants (F(1,

37
122) = .22, p > .05). In the “I am enthusiastic about working online” (EAW) statement
experimental subjects outperformed control participants by 2.26% with average scores of
7.86 of 10 vs. 7.68 of 10 among control participants (F(1, 122) = .21, p > .05). In the “I
am happy to be at Amazon Mechanical Turk” (H2B) statement experimental subjects
outperformed control subjects by 3.01% with average scores of 8.20 of 10 vs. 7.96 of 10
among control participants (F(1, 122) = .49, p > .05). In the “Amazon Mechanical Turk
is one of the best working communities in the world” (OOB) statement experimental
subjects outperformed control subjects by 1.37% with average scores of 6.77 of 10 vs.
6.68 among control participants (F(1, 122) = .04, p > .05). The potential reasons behind
these outcomes will be discussed in detail in the discussion section to follow.
In conclusion, despite lacking statistical significance, these data in sum bring
forth directional affirmation of some hypothesized dimensions and raise some questions
for future research.

38
Table 14
Descriptive Statistics of Experimental with PCS
Variable (n = 56) Range Min. Max. Mean Std. Dev.
Performance Data
Percent of Correct Answers 0.88 10.0% 98.0% 33.8% 0.21
Number of Correct Answers (of 50) 44.00 5.00 49.00 16.89 10.26
Number of Groups Attempted (of 50) 44.00 6.00 50.00 20.14 12.17
Number of Attempted Groups Correct (of 50) 44.00 5.00 49.00 16.92 10.27
Percent of Group Attempts Correct 0.33 67.0% 100.0% 84.2% 0.11
PCS Data
Sense Of Belonging to My Team (SOB) 10.00 0.00 10 4.61 2.85
Feeling as a Member Of AMT Community (MOC) 10.00 0.00 10 7.46 2.26
See Self as Part Of AMT Community (POC) 10.00 0.00 10 7.41 2.24
Sense Of Belonging Category (SOB+MOC+POC) 30.00 0.00 30 19.48 6.51
Enthusiastic About Working (EAW) 7.00 3.00 10 7.86 1.93
Happy To Be on the Team (H2B) 7.00 3.00 10 8.20 1.79
Perceive Working Community as One Of the Best (OOB) 8.00 2.00 10 6.77 2.47
Feelings Of Morale Category (EAW+H2B+OOB) 19.00 11.00 30 22.82 5.62
Table 15
Descriptive Statistics of Control Subjects with PCS
Variable (n = 68) Range Min. Max. Mean Std. Dev.
Performance Data
Percent of Correct Answers 0.74 6.0% 80.0% 33.1% 0.19
Number of Correct Answers (of 50) 37.00 3.00 40.00 16.54 9.65
Number of Groups Attempted (of 50) 46.00 4.00 50.00 19.29 11.06
Number of Attempted Groups Correct (of 50) 37.00 3.00 40.00 16.47 9.62
Percent of Group Attempts Correct 0.41 59.0% 100.0% 84.8% 0.12
PCS Data
Sense Of Belonging to My Team (SOB) 10.00 0.00 10 4.99 3.32
Feeling as a Member Of AMT Community (MOC) 10.00 0.00 10 7.65 2.28
See Self as Part Of AMT Community (POC) 10.00 0.00 10 7.71 2.27
Sense Of Belonging Category (SOB+MOC+POC) 30.00 0.00 30 20.34 6.53
Enthusiastic About Working (EAW) 8.00 2.00 10 7.68 2.23
Happy To Be on the Team (H2B) 7.00 3.00 10 7.96 1.99
Perceive Working Community as One Of the Best (OOB) 9.00 1.00 10 6.68 2.52
Feelings Of Morale Category (EAW+H2B+OOB) 24.00 6.00 30 22.32 6.26

39
Table 16
Tests of Homogeneity of Variances of Experimental with PCS vs. Control Subjects with
PCS
Variable (n = 18) Lavene Statistic p
Performance Data
Percent of Correct Answers OMPWX OMUUS
Number of Correct Answers (of 50) OMPWX OMUUS
Number of Groups Attempted (of 50) OMTPS OMSVT
Number of Attempted Groups Correct (of 50) OMQWV OMTXR
Percent of Group Attempts Correct PMVQU OMPXP
PCS Data
Sense Of Belonging to My Team (SOB) QMVUU OMOXX
Feeling as a Member Of AMT Community (MOC) OMOUX OMVXR
See Self as Part Of AMT Community (POC) OMOXS OMVUO
Sense Of Belonging Category (SOB+MOC+POC) OMOUS OMWOP
Enthusiastic About Working (EAW) OMRWS OMTRV
Happy To Be on the Team (H2B) PMVSS OMPWX
Perceive Working Community as One Of the Best (OOB OMOOT OMXST
Feelings Of Morale Category (EAW+H2B+OOB) OMQSP OMUQS

40
Table 17
ANOVA of Experimental with PCS vs. Control Subjects with PCS
Variable (n = 124) SS MS F(1, 122) p
Performance Data
Percent of Correct Answers
Between 0.001 OMOOP OMORW OMWSU
Within 4.81 OMORX
Number of Correct Answers (of 50)
Between 3.735 RMVRT OMORW OMWSU
Within 12024 XWMTTX
Number of Groups Attempted (of 50)
Between 22.122 QQMPQQ OMPUT OMUWT
Within 16343 PRRMXU
Number of Attempted Groups Correct (of 50)
Between 6.229 UMQQX OMOUR OMWOQ
Within 12000 XWMRUR
Percent of Group Attempts Correct
Between 0.001 OMOOP OMOXT OMVTW
Within 1.677 OMOPS
PCS Data
Sense Of Belonging to My Team (SOB)
Between 4.391 SMRXP OMSTR OMTOQ
Within 1182.3 XMUXP
Feeling as a Member Of AMT Community (MOC)
Between 1.026 PMOQU OMPXW OMUTV
Within 631.46 TMPVU
See Self as Part Of AMT Community (POC)
Between 2.676 QMUVU OMTQV OMSUX
Within 619.67 TMOVX
Sense Of Belonging Category (SOB+MOC+POC)
Between 22.507 QQMTOV OMTQX OMSUX
Within 5193.2 SQMTUV
Enthusiastic About Working (EAW)
Between 0.923 OMXQR OMQOX OMUSX
Within 539.31 SMSQP
Happy To Be on the Team (H2B)
Between 1.777 PMVVV OMSXP OMSWT
Within 441.71 RMUQP
Perceive Working Community as One Of the Best (OOB)
Between 0.256 OMQTU OMOSP OMWS
Within 762.86 UMQTR
Feelings Of Morale Category (EAW+H2B+OOB)
Between 7.84 VMWS OMQPX OMUSP
Within 4368.7 RTMWOX

41
Chapter IV
Discussion
Over 100 years of research have shown that social loafing is a real and material
psychological phenomenon that reduces performance among humans in groups. It is
known that increasing evaluation potential, decreasing deindividuation, and cohesion all
lead to reduced social loafing in physical environments. What has not yet been well
researched is whether or not the findings associated with many of these variables also
apply to virtualized working environments. The intention of this study was to examine
impacts to social loafing by modifying the aforementioned variables in the context of a
virtual work environment and thereby begin to shine a light into how applicable the
extensive body of research about social loafing in physical environments might translate
into virtual ones.
Hypothesis, Brief Supportive Argument Overview, & Results in Context
The original hypothesis of this study was: Does self-disclosure lead to improved
performance in virtualized teams? History has shown that when humans work together
in groups, social loafing occurs (Karau & Williams, 1993). Social Loafing “is the
reduction in motivation and effort when individuals work collectively compared with
when they work individually or coactively” (Karau & Williams, 1993, page 681).
The performance losses that come as a result of this social loafing are large and
costly (Chidambaram & Tung, 2005). People are expected to work in groups in diverse

42
settings including academic, government, and business environments (Chidambaram &
Tung, 2005). Collaborative work will continue to be essential in these environments and
others.
Computing technology over the past generation has expanded rapidly and with
this expansion has come increased use of “virtualized collaborative environments”
(Suleiman & Watson, 2008; Chidambaram & Tung, 2005) which are “an aggregation of
individuals or business partners who interact around a shared interest, where the
interaction is at least supported and/or mediated by technology and guided by some
protocols or norms” (Sun et al., 2012, page 13). Computing technology resulted in new
mediums of collaborative exchange and began a burgeoning migration to virtualized
settings from physical ones (Suleiman & Watson, 2008) for both social and professional
collaboration. 10% of US citizens work from home at least one day a week (Bloom et al.,
2013). Virtual collaboration saves money and offers both companies and workers
flexibility and as the technology improves so does the quality and frequency of its usage
(Sin, 2011). As technology improves, competitive pressures will continue to drive work
into formats that include virtual collaboration.
While there are over 100 studies on social loafing in co-located groups (Karau &
Williams, 1993; Suleiman & Watson, 2008) little data regarding social loafing in
virtualized environments have been published (Suleiman & Watson, 2008); “researchers
have neglected examination into the influence of technology on social loafing” (page
292). However, the existing research suggests that social loafing also occurs in virtual
groups (Suleiman & Watson, 2008).

43
One variable that reduces social loafing in co-located groups is evaluation
potential (Karau & Williams, 1993; Suleiman & Watson, 2008) sometimes referred to as
increased individual identifiability (Miller, 2002; Hardy & Crace, 1991; Chidambaram &
Tung, 2005) or reduced deindividuation (Chidambaram & Tung, 2005).
Revealing personal details in co-located groups leads to greater perceptions of
cohesion (Stokes, Fuehrer, & Childs, 1983). An example of this can be seen in online-
dating research which has shown that the more information online daters disclose the
more they trust one another (Lo, Hsieh, & Chiu, 2013). If more virtual self-disclosure
leads to increased trust with potential dates, it would seem possible that self-disclosure
may also increase cohesion in virtual groups.
Most importantly, group cohesion is associated with lower levels of social loafing
(Karau & Williams, 1993; Suleiman & Watson, 2008; Evans & Dion, 2012) and the
presence of weak social ties has been shown to increase social loafing (Shiue, Chiu, &
Chang, 2010). Reduced loafing predicts greater performance. Self-disclosure should
lead to reduced deindividuation and increased evaluation potential, resulting in decreased
social loafing and greater performance. Therefore it was thought that self-disclosure may
be beneficial in a virtual work environment as it’s also been suggested that teams are
rarely given the opportunity to build cohesion (Karau & Williams, 1993).
Therefore it was expected (just as self-disclosure increases evaluation potential in
co-located groups and increases trust in online dating, etc.), that in having subjects
engage in self-disclosure there would be a reduction in the deindividuation, increased
perceived evaluation potential, and increased feelings of cohesion, all of which have been
shown to decrease social loafing. This reduction in social loafing was to be evinced

44
through improvements in experimental subjects’ performances relative to those of
controls.
While not statistically significant, from a performance perspective (and therefore
a social loafing perspective) the data supported this hypothesis as being directionally
correct. Experimental subjects outperformed controls by 1.9% (averaging 16.64 vs.
16.33 correct responses among control participants) (F(1, 164) = .04, p > .05). As people
felt more identifiable through self-disclosure, they likely felt increases in evaluation
potential and reductions and deindividuation as predicted, and therefore worked harder as
a result thereby increasing the number of answers rendered.
Furthermore, despite not achieving statistical significance, experimental subjects
were also more accurate in their responses by 0.38% (F(1, 164) = .03, p > .05). While this
finding wasn’t part of the original set of expectations it is consistent with the spirit of the
hypothesis and provides further strength to the argument’s theme. It is reasonable to
assume that as people felt they were more identifiable and therefore worked harder on a
given task that they would also strive to better understand the instructions and nuances of
the specific requirements. The design of this alphabetization task was deliberately
structured to add the challenge of making the alphabetization process about ordering the
first letter of each of the three-word company names as opposed to traditional
alphabetization which would have dictated the order would be relative to the arrangement
of the letters starting from the left (in the first word and so on).
Also consistent with the hypothesis was the fact that experimental participants
outscored controls on the entire “Feelings of Morale” category (EAW+H2B+OOB) of the
Perceived Cohesion Scale (albeit, again, not statistically significantly) by 2.26% with an

45
average cumulative score of 22.82 of 30 vs. 22.32 of 30 among control PCS participants
(F(1, 122) = .22, p > .05). Within this category this researcher observed experimental
participants outscore control participants in each of the three statements around their
enthusiasm for their working medium (depicted via the “I am enthusiastic about working
online” (EAW) statement where experimental PCS subjects outperformed control PCS
participants by 2.26% with average scores of 7.86 of 10 vs. 7.68 of 10 among pilot
control participants (F(1, 122) = .21, p > .05)), in their happiness (depicted through the “I
am happy to be at Amazon Mechanical Turk” (H2B) statement where experimental PCS
subjects outperformed control PCS subjects by 3.01% with average scores of 8.20 of 10
vs. 7.96 of 10 among control PCS participants (F(1, 122) = .49, p > .05)) and in the
statement where they identified their place of work as being “one of the best” (as was
represented by the “Amazon Mechanical Turk is one of the best working communities in
the world” (OOB) statement where the experimental PCS subjects outscored control PCS
subjects by 1.37% with average scores of 6.77 of 10 vs. 6.68 among control PCS
participants (F(1, 122) = .04, p > .05)). These findings make intuitive sense as people
who are afforded the ability to introduce themselves to their teammates likely feel more
welcomed by their working environment than those who are merely notified that they are
on a team.
Recall that in the pilot some of this “Feelings of Morale” section of the PCS
statements had a couple instances of heteroskedasticity in having failed Lavene’s test and
that, when tested for equality of means to accommodate said heteroskedastic data that “I
am happy to be at Amazon Mechanical Turk” (H2B) approached the statistical
significance threshold of alpha = .05 (p = .08). While ultimately “I am happy to be at

46
Amazon Mechanical Turk” (H2B) in the larger sample didn’t achieve statistical
significance (or have heteroskedastic issues) there may be some individuals for whom
increased evaluation potential reduces their ability to perform and therefore may result in
greater variance at one end of the spectrum. For example, there were three instances in
which an individual participant attempted more than one posted task despite the
instructions and in two of those instances the individuals did the experimental condition
task after the control condition task and yet they performed worse on the experimental
condition task.
In both instances the subjects’ performance was worse (8 correct vs. 10 correct,
i.e., down 20% and 11 correct vs. 18 correct, i.e., down 38.8%) on the experimental task
(i.e., having experience with the task and being primed to more rapidly go through the
task with the exact same groupings). There may have been re-orientation costs (i.e., lack
of focus, increased anxiety, or that the time required to complete them exceeded the
incremental time allotted for them) associated with completing the self-disclosure
statement in the experimental condition. This suggests that the difference in performance
may be even greater if researchers were able to control for those factors.
An unexpected outcome arose in the “Sense of Belonging” category of the
Perceived Cohesion Scale. Experimental participants scored worse than controls by
4.21% with scored responses cumulatively averaging 19.48 of 30 among experimental
pilot participants vs. 20.34 of 30 among control PCS participants (F(1, 122) = .53, p >
.05). Recall from the results section that this was comprised of responses to statements of
“I feel a sense of belonging to my team” (SOB), “I feel that I am a member of Amazon
Mechanical Turk community” (MOC), “I see myself as a part of the Amazon Mechanical

47
Turk community” (POC), which were worse among experimental subjects by 7.59%
(F(1, 122) = .45, p > .05), 2.39% (F(1, 122) = .20, p > .05), and 3.95% (F(1, 122) = .53, p
> .05) respectively.
It was assumed increasing self-disclosure would be successful in increasing
performance through reduced social loafing because it was expected that by reading
biographies of teammates and writing one of their own for their teammates to read that
the subject would feel a heightened bond in the form of heightened cohesion to their
teammates relative to controls who simply knew they were on a team. In practice,
however, several different variables could explain this result. First, these teams were
incredibly transient. Participants knew they were only going to be working on this one
task together (and for just 20 minutes) so there may have been little perceived value to
formulating cohesion. In fact, it may have come across as being strange, maybe even off-
putting, to be introduced to teammates that they would never work with again. And
perhaps by laying out so boldly the fact that there was no real sense of team or any degree
of the permanence that is typically associated with the creation of cohesion among
individuals of a team it reduced their perception of a sense of belonging to said team.
Second, and likely, control subjects may not have associated with the “team” they
were being assigned to and therefore they interpreted the sense of belonging statements
more broadly to AMT as a whole (note that the “Feelings of Morale” category
(EAW+H2B+OOB) scores were on average higher than the “Sense of Belonging”
category scores in both groups). Thus, the cohesion manipulation may have led
experimental vs control participant to interpret “their team” on the PCS differently.

48
Conclusions & Implications
While it would be unwarranted to draw conclusions (given the lack of statistical
significance) from the results of this research, these data do suggest that certain
dimensions of the existing social loafing research may translate into a virtual
environment.
The lack of statistical significance was largely due to the extreme variability in
participants’ performances relative to sample size (n) and differences in sample means. If
expanded in scale this experiment may eventually achieve statistical significance but
doing so would require an extremely large sample size. Despite the absence of statistical
significance this study revealed both the possible implications if these differences held
over a larger sample size and what modifications and additional research could be
undertaken to better understand how to reduce social loafing in virtualized teams to
increase their performance.
In practice it may be that adding simple elements of humanity into virtual
environments (both work and academic), such as moments of self-disclosure, may result
in the addition of material value over time if only as far as increasing participants’
feelings of morale (which will likely decrease attrition) and reducing social loafing
(which will increase performance).
Although a 1.9% increase in performance with 0.38% greater accuracy may seem
minute, small differences matter, particularly over time and scale. It is often cited that
there are incredibly small differences between the deoxyribonucleic acid sequences
composing chimp and human DNA and yet these minute differences have extreme

49
impacts on outcome. Furthermore, one need not watch any competitive endeavor long to
realize how small the differences are in performance among elite athletes, etc. Similarly
“small” differences make the difference between winning and losing in hypercompetitive
environments like business and academia. Small differences matter and it is reasonable to
think that if this research were carried out over a sample size of tens of thousands that
this aforementioned hypothesis (that something as simple and costless as encouraging
self-disclosure in virtual teams changes performance outcomes) could eventually achieve
statistical significance.
Lastly, finding any difference at all, in the expected direction, is within itself
notable given how tiny the actual cohesion-inducing manipulation was (i.e., a self-
statement of only a few lines) and how incredibly short-term the perceived association
with their teammates was (i.e., less than half an hour).
New Questions Raised & Future Research Opportunities
These findings raise a myriad of questions. For instance, to what degree were the
differences in performance limited by how transient team membership was? It is known
that cohesion exists on a curve (teams that are too cohesive actually perform worse than
those that are only moderately cohesive (Evans & Dion, 2012)) so are these findings
representative of the most extreme left tail of that cohesion curve? If so, could one
expect to see larger performance gains with more stable teams?
And at what point does self-disclosure trump the transient nature of a team? If
this researcher were to have asked participants to give increasingly personal information
would it have reached a point where the heightened intimacy outweighs the short-lived

50
duration of the team? This researcher’s impression is yes, and one could imagine this is
consistent up the team-life duration spectrum (so that as a participant traverses the
cohesion bell curve, along the duration spectrum, the performance of the individual at
each stop along the cohesion bell is influenced by the degree of intimacy shared at that
point). This would be fascinating to test and is ripe with opportunities for statistical
analysis.
And at what point does a team spend enough time interacting to stop being
considered transient? Does whether or not a team is transient depend upon the type of
team and/or task at hand? Standardized definitions will become increasingly important as
this field continues to expand.
Does cohesion itself take on a different form among team members in virtualized
environments? As companies and schools continue to migrate to online environments do
researchers need to start thinking differently about what cohesion is in practice? Is it
possible for individuals who have never met or have only met once to ever develop the
level of cohesion that people who have worked side-by-side for lengthy periods of time
do? What is the difference in rate of development of that cohesion?
The same question ought to be asked about self-disclosure, deindividuation, and
their respective impacts on participants. Does self-disclosure matter when a participant
knows he or she will never meet this teammate in person? It likely does in instances
where grades and paycheck vulnerability are concerned but even then it would be
interesting to see if performance varies at the same level of self-disclosure to a given
audience relative to medium of exchange.

51
Another intriguing alternative version of this paper’s experiment would be to have
participants meet their "team" across an experiential gradient. In the baseline you have
them "meet" in the same way the experimental participants in the present study did (in
writing), then in the next level of experiment you have them instant message with each
other, then in another tier have participants exchange video introductions, then another
tier with live video interaction, and then a final experimental level where researchers
could have a group of actors that all participants meet in person and return to their virtual
environments to complete the task. The researcher could then map the gradient and see
the degree to which performance was enhanced through reduced social loafing across the
spectrum.
Another dimension worthy of consideration is the task itself. Perhaps this
alphabetization task was within itself too impersonal to allow any real cohesion to occur.
Those few attempts that have taken place around the subject of social loafing in virtual
environments leveraged far more complex tasks like Electronic Brainstorming (EBS)
software (Chidambaram & Tung, 2005) and the General Management In-Basket Task
(GMIB) (Suleiman & Watson, 2008) as their tasks, which are much more interactive and
cerebral. Future research may show that the more complex the task, the greater the
impact to reduction of social loafing as the importance of team, the likelihood of
cohesion, the opportunities for evaluation by peers, etc., rise.
The research opportunities in this field are numerous because so little has been
done regarding social loafing in virtual environments despite its magnitude on today’s
businesses, governments, and schools.

52
Research Limitations
As with all research there are some noteworthy things to consider when applying
learnings from the research contained herein.
First, while the directionality of the findings was relatively consistent throughout
the course of the data collection, none of the findings achieved statistical significance at
the preselected alpha of .05.
Second, the virtualized component of this research was ideal in maximizing
accessibility, generalizability, and cost effectiveness. However it’s possible during self-
disclosure participants may have lied. Deception is a frequent dimension of human
interaction and is particularly present in online settings given the complete absence of
nonverbal cues (Lo et al., 2013). This might have limited increases that otherwise would
have occurred in cohesion and evaluation potential, as well as any decreases in
deinvididuation. However, the AMT program requires standardized profiles which
hopefully minimized this risk.
Third, while all sets of instructions clearly stated only 20 minutes were to be
allotted to complete the task, in theory some participants may take longer. For instance,
some participants in the pilot tasks (both Control and Experimental) may have
erroneously taken more than the specified time by leveraging time that was to be allotted
to filling out the PCS, etc. AMT measures the total time utilized by a participant during
the completion of their task but in instances where the task also includes filling out the
PCS the ability to determine where the time was used becomes obfuscated. Differences in
mean times however suggested this likely wasn’t a systemic problem but it may have

53
impacted a small handful and in a sample population with such wide performance
variance that can influence outcomes.
Fourth, results from this study also likely cannot be generalized to other types of
tasks. There are many types of tasks that teams in the real world complete and this
experiment only leverages a relatively simple alphabetization task. As discussed in the
above section, it may eventually be found that the more complex the task the greater the
impact to reduction of social loafing.
Fifth, the social pressures typically associated with identifiability in co-located
groups may have less effect with virtual groups given their disparate and transient
structure: “the use of groups without any prior or expected future work history can
contribute to a lack of motivation since there are no potential threats of retaliation in the
future for poor performance” (Suleiman & Watson, 2008, page 307). We also know from
social psychology research that relationships are often just as much about proximity as
similarity (Preciado, Snijders, Burk, Stattin, & Kerr, 2012) and thus some participants
may have been indifferent to having other people be aware of who they are as they will
likely never work with these people again. One potential solution suggested by Suleiman
and colleagues is leveraging standing project teams, however this would likely create
more research problems than it would resolve as researchers would have to quantify and
take into account the various pre-existing differences in cohesion and abilities of
participants who, by definition of being a member of a standing team, would not have
been randomly selected.
Lastly, research on working adults detects lower rates of social loafing than
research using students (Karau & Williams, 1993) and Master’s thesis and dissertation

54
work tends to result in findings of lower rates of loafing than research conducted for
journal inclusion (Karau & Williams, 1993) as social loafing rates may be too low in
either group to detect measurable differences. Thus, as was suggested might be the case
in the proposal, this experiment’s results ended up aligned with other social loafing
research in that it found differences but they were ultimately not large enough to achieve
statistical significance.
Nonetheless, despite these limitations this study aimed to provide a crucial first
step towards addressing productivity concerns often perceived as being associated with
virtual groups, and ultimately, these findings may speak to the challenges to be faced by a
humanity subsumed within an increasingly virtualized and transient world.

55
APPENDICES
Appendix A
IRB Approval

56
Appendix B
Amazon Mechanical Turk HIT Description for Control Pilot/PCS
DESCRIBE YOUR HIT TO WORKERS:
Title: Writing & Categorization/Alphabetization
Description: Please alphabetize as many of the following groups as you can in 20minutes. No Automation Allowed.
Keywords: Writing, Categorization, Alphabetization
SETTING UP YOUR HIT:
Reward Per Assignment: $2.50
Number of Assignments Per HIT: 1
Time Allotted Per Assignment: 25 Minutes
HIT Expires In: 1 Day
Auto-Approve and Pay Workers In: 24 Hours
DESIGN LAYOUT:
You’re the final member of a five-person team engaged in this type of task The work youdo, while tied to you, will be combined with theirs in the final product and any remaininggroupings you don’t get to in the time allotted will be finished off by one of them.
Alphabetize of as many of the following group lists as you can within 20 minutes. Set atimer, it is vital that you do not exceed 20 minutes on the activity itself (it's okay if youdon't get all the way through the lists just mark with an asterisk (*) where you stop).Absolutely no automation (formulas, macros, VBA, etc.) allowed.
After you’ve completed your 20 minute attempt at the task please then take theremainder of the time to complete a very quick five-question survey attached at the end.
Example

57
Vic's Automation Shops
Ashland Express Systems
Quantrix Hughes Anixter
The Paper Arrow
Estwing Roper Resources
Should be alphabetized (using the first letter of each word) as:
Ashland Express Systems (AES)
Estwing Roper Resources (ERR)
Quantrix Hughes Anixter (QHA)
The Paper Arrow (TRA)
Vic's Automation Shops (VAS)
Group 1
Chesapeake Marine Technologies
National Aircraft Holdings
Visteon Lansing Collins
Altra Crown Corporation
International Lennox Group
Group 2
Loom Farms Insurance
Callaway Industries Company
Las Audio Company
Communications Products Union

58
Firestone Celgene Silicon
Group 3
Lifesciences Network Corporation
Schlumberger Oaktree Aluminum
Intersil Bemis Group
DC Entertainment Corporation
Interpublic Products Automation
Group 4
LabCorp Bushmaster Company
Comic Markets Company
Six Lee Inc.
BorgWarner Regal Systems
Foot Resources Industries
Group 5
Intercontinental Marketing Group
Delta Energy Intelligence
Rockford Global Technologies
Paychex Land Systems
Burpee World Entertainment
Group 6
Robert Callender's Pizza
Union Company Manufacturing

59
Networks' Lifesciences Brands
CSX Netc.ordia Corporation
Meyer Carlson Company
Group 7
Luby's Supermarkets Bank
Brookdale Flowers Company
Warburg Depot Services
Salem Waters Associates
Wahl Specialized Cooperative
Group 8
Bell Corporation Systems
Denbury Controls Solutions
Honeywell McGee Group
Vic's Automation Products
Paramount Steel Inc
Group 9
Altera Bose Management
Associated Bronco Industries
Ideal Ruby Corporation
Sunoco Momentive Monitors
Lee Inc. Network
Group 10
60
Sun Group Electronics
Morgan Forest Corporation
Emerson Fruit Inc.
Western Arrow Inc.
Alexion Gulfstream Systems
Group 11
Russell Worldwide Corporation
The Motion Beam
Taylor Lincoln International
Regis Technology Inc.
Bollinger Bass Company
Group 12
Hilton Intertechnology Centers
Whitney Genuine Networks
Meyer Carlson Mutual
Kaiser Omni Oshkosh
Vantec Services Corporation
Group 13
Leviton Pinnacle Industries
Bose Management Holdings
Oil Wizards Company
Gibson Group Company

61
Martin Zions Resources
Group 14
Blackstone Ashland Express
Hughes Anixter Steelcase
Gordon Corporation Inc.
Aerospace Textron Schwan
Intuitive Mead Financial
Group 15
Union Communications Company
Micro Corp. Airlines
Vivitar Progressive Railway
Belk International Software
Boise Mesa International
Group 16
Maritime Kaiser Omni
American Pioneer Parts
Sur United Resources
Sears Works Corporation
Wahl Industries Brands
Group 17
Danaher Strayer Corporation
Seagate Dart Imation

62
Alaskan Exchange Industries
Bauer Technology Corporation
Cecillia Pinnacle Petroleum
Group 18
Pep Infinity Railcorp
Ralph Torry Machines
Callender's Pizza Solutions
Liberty Inc. Media
Collins Murphy Ariba
Group 19
Roush AnaSpec Corporation
Mohawk Syntel Pharmaceuticals
Grill Hughes Corporation
Cima Aircraft Corporation
Ethan Affiliated Inc.
Group 20
Mission Steel Partners
Burton Communications Corporation
Zenith Steel Partners
American Arts Worldwide
Vulcan Papa Corporation
Group 21

63
Columbia Pacific Railroad
International Riceland Company
Apogee Fragrances Company
Johnson Wakefern Air
Russell American Parts
Group 22
LabCorp Venus Company
CHS XIM America
Speedway International Inc.
Roush AnaSpec Inc.
International Seeds Corporation
Group 23
Eastman Company Sons
Inc. Company Media
Helicopter Perdue Corporation
Dick's Arryx Corporation
Watkins Owens Company
Group 24
Flags Corporation Graham
Arms Axle Group
California Farms LLC
New Western Biggby

64
Syntel Pharmaceuticals Company
Group 25
Kimber Freeze Towers
Systems FileMaker Company
Koch Steel Corporation
Aircraft PSSC Inc.
Columbia Lennar Group
Group 26
Ethan Inc. Industries
Time Meritor Corporation
Mesa International Homes
Gordon Mitchel Steel
Hot Bank Arts
Group 27
Marathon World News
Alcoa Energy Group
Abbott Applied Sciences
Herman Global Co.
Ralph Arms Axle
Group 28
Dart Imation Whitney
Meijer Technology Company

65
Mead Financial Bank
Dana Molex, Albemarle
Benihana Seagate Company
Group 29
Burton Emerson Communications
Protective Solutions Inc.
Oshkosh Fenway Aerospace
Netc.ordia Erickson Corporation
Hobbico, Birdwell, Church
Group 30
Global Technologies Group
Gardner Corporation International
Works Corporation Networks
Bemis Bushmaster Organization
Western Grill Restaurants
Group 31
Murphy Ariba Company
Bealls Weis Systems
Marlin Fluor Corporation
Networks Quantrix Hughes
Mars Technologies Group
Group 32

66
DaVita Systems Industries
Crown Financial Corporation
AnaSpec Fruit Inc.
Arms Liberty Inc.
Boyer Denbury Controls
Group 33
Celgene Silicon Products
Avon Mills Holdings
Ben Brands Corporation
Caremark Alliant Express
Sierra Farms Entertainment
Group 34
Meyer Paper Company
Bain DaVita Systems
American Flag Corporation
Bebo Ross Corporation
Company Sur United
Group 35
Peso Brothers Inc.
Media Brands Company
Cognizant Analytics Corporation
Rockstar Holdings Corporation

67
Liberty Petroleum Company
Group 36
Pioneer Interactive International
Altria Technology Corporation
Ground Midland Corp.
Maxim Companies Associated
Metro Air Electronica
Group 37
Bradley Foods Products
Johnson Eli Leonard's
Paramount Inc. Airways
Cbeyond Visteon Lansing
Seattle's Coffee Zoo
Group 38
Church Speedway International
Bell Sturm, Affiliated
Ball Soda Factory
Edison International Airlines
Zenith Markets Foods
Group 39
Panda Pinnacle Insurance
Jackson Paper Company

68
AMC Marlin Company
Western Taser Company
International Studios Corporation
Group 40
Pizza Solutions L&L
Liberty Loral Holdings
Aspry International Aerospace
Radio Marathon Association
Amway Uniphase Semiconductors
Group 41
World Regions Corporation
Infinity Railcorp Companies
General Crane Corporation
Regis Technology Machines
Aspyr Life Sciences
Group 42
Legg Hyland Company
Lifesciences Brands Company
Carnival Manufacturing Company
Russell Marsh Inc.
Paper Arrow Templeton
Group 43
69
McIlhenny Maidenform Arms
Tree Vertex Inc.
Lincoln Chemical Enterprises
Cardinal General Inc.
Vertex Inc. Systems
Group 44
Electronic Air Communications
Benihana Seagate Dart
Hunt Group Solutions
Biomet Safeway Inc.
XIM America General
Group 45
Cerberus Zune Systems
Birdwell Church Speedway
Kramer International Inc.
Biggby Rockford Global
Hut Industries Corporation
Group 46
Ariba Company Airlines
Otis Emcor Air
Maxim Corporation Company
Caesars Soyo Inc.

70
Lansing Collins Murphy
Group 47
Hamilton Waters Corporation
GlobalFoundries Games Corporation
Jack Craft Parts
Amy's New Company
Urban Winery Shop
Group 48
Drilling Inc. Group
NCR Foods Hillerich
Dean Hughes Corporation
Intersil Shipyards Group
Semiconductor Airways Comics
Group 49
Atmel Grumman Partners
Tupperware Columbia Group
Dover Group Homes
Steelcase, Kodak, Watkins
Schnucks Luby's Supermarkets
Group 50
Beckman Airways Systems

71
Laserfiche Integrated Robotics
Standard Caremark Inc.
Regal Avon Mills
Bauer Williams Technology
Thanks for helping us out with this task. Please indicate your feelings on a scale of 0 to10 (with 0 representing the highest disagreement with the statement and 10 representingthe highest agreement with the statement) next to the following statements:
Sense of Belonging
I feel a sense of belonging to my team. ____
I feel that I am a member of the Amazon MechanicalTurk community. ____
I see myself as a part of the Amazon Mechanical Turk community. ____
Feelings of Morale
I am enthusiastic about working online. ____
I am happy to be at Amazon MechanicalTurk. ____
Amazon MechanicalTurk is one of the best working communities in the world. ____
Thanks for your input!
Please note that while this alphabetization task has been posted multiple times, we wouldask that you only attempt this task once. Thank you again for your help.

72
Appendix C
Amazon MechanicalTurk HIT Description for Experimental Pilot/PCS
DESCRIBE YOUR HIT TO WORKERS:
Title: Writing & Categorization/Alphabetization
Description: Please alphabetize as many of the following groups as you can in 20minutes. No Automation Allowed.
Keywords: Writing, Categorization, Alphabetization
SETTING UP YOUR HIT:
Reward Per Assignment: $3.00
Number of Assignments Per HIT: 1
Time Allotted Per Assignment: 30 Minutes
HIT Expires In: 1 Day
Auto-Approve and Pay Workers In: 24 Hours
DESIGN LAYOUT:
You’re the final member of a five-person team engaged in this type of task The work youdo, while tied to you, will be combined with theirs in the final product and any remaininggroupings you don’t get to in the time allotted will be finished off by one of them.
Alphabetize of as many of the following group lists as you can within 20 minutes. Set atimer, it is vital that you do not exceed 20 minutes on the activity itself (it's okay if youdon't get all the way through the lists just mark with an asterisk (*) where you stop).Absolutely no automation (formulas, macros, VBA, etc.) allowed.
After you’ve completed your 20 minute attempt at the task please then take theremainder of the time to complete a very quick five-question survey attached at the end.
But first, before beginning the 20-minute task activity, please take a moment to share alittle about yourself for your teammates to read. Here are what your four teammates

73
posted, please take a moment to read and familiarize yourself with your team:
I’m Jack. I’m tall (over 190cm) and live in Sweden,, I love football and handball and
orienteering.
My name is Samantha. I’m a stay-at-home-mom and I live in the US. I love MTK
because it allows me to pick up some extra cash on the side. I <3 it!
Georrig – Wie gehts. Germany checking in. Plugging away as always.
Greetings. I’m Pallavi. While I wrote my MBA in the US I’m based out of Mumbai.
PLEASE INSERT SELF-STATEMENT (MANDATORY):
Now that you've introduced yourself, please alphabetically organize as many of the
following three-word company names in as many of the five-phrase groupings as you can
in 20 minutes:
[NOTE: Task redacted for preservation of space; see Appendix ## - for complete tasklist]
Thanks for helping us out with this task. Please indicate your feelings on a scale of 0 to10 (with 0 representing the highest disagreement with the statement and 10 representingthe highest agreement with the statement) next to the following statements:
Sense of Belonging
I feel a sense of belonging to my team. ____
I feel that I am a member of the Amazon MechanicalTurk community. ____
I see myself as a part of the Amazon Mechanical Turk community. ____
Feelings of Morale
I am enthusiastic about working online. ____
I am happy to be at Amazon MechanicalTurk. ____
Amazon MechanicalTurk is one of the best working communities in the world. ____
Thanks for your input!
Please note that while this alphabetization task has been posted multiple times, we wouldask that you only attempt this task once. Thank you again for your help.

74
Appendix D
Amazon Mechanical Turk HIT Description for Control (non-PCS)
DESCRIBE YOUR HIT TO WORKERS:
Title: Writing & Categorization/Alphabetization
Description: Please alphabetize as many of the following groups as you can in 20minutes. No Automation Allowed.
Keywords: Writing, Categorization, Alphabetization
SETTING UP YOUR HIT:
Reward Per Assignment: $2.00
Number of Assignments Per HIT: 1
Time Allotted Per Assignment: 20 Minutes
HIT Expires In: 1 Day
Auto-Approve and Pay Workers In: 24 Hours
DESIGN LAYOUT:
You’re the final member of a five-person team engaged in this type of task The work youdo, while tied to you, will be combined with theirs in the final product and any remaininggroupings you don’t get to in the time allotted will be finished off by one of them.
Alphabetize of as many of the following group lists as you can within 20 minutes. Set atimer, it is vital that you do not exceed 20 minutes on the activity itself (it's okay if youdon't get all the way through the lists just mark with an asterisk (*) where you stop).Absolutely no automation (formulas, macros, VBA, etc.) allowed.
[NOTE: Task redacted for preservation of space; see Appendix ## - for complete tasklist]

75
Thanks for your input!
Please note that while this alphabetization task has been posted multiple times, we wouldask that you only attempt this task once. Thank you again for your help.

76
Appendix E
Amazon MechanicalTurk HIT Description for Experimental (non-PCS)
DESCRIBE YOUR HIT TO WORKERS:
Title: Writing & Categorization/Alphabetization
Description: Please alphabetize as many of the following groups as you can in 20minutes. No Automation Allowed.
Keywords: Writing, Categorization, Alphabetization
SETTING UP YOUR HIT:
Reward Per Assignment: $2.50
Number of Assignments Per HIT: 1
Time Allotted Per Assignment: 25 Minutes
HIT Expires In: 1 Day
Auto-Approve and Pay Workers In: 24 Hours
DESIGN LAYOUT:
You’re the final member of a five-person team engaged in this type of task The work youdo, while tied to you, will be combined with theirs in the final product and any remaininggroupings you don’t get to in the time allotted will be finished off by one of them.
Alphabetize of as many of the following group lists as you can within 20 minutes. Set atimer, it is vital that you do not exceed 20 minutes on the activity itself (it's okay if youdon't get all the way through the lists just mark with an asterisk (*) where you stop).Absolutely no automation (formulas, macros, VBA, etc.) allowed.
But first, before beginning the 20-minute task activity, please take a moment to share alittle about yourself for your teammates to read. Here are what your four teammatesposted, please take a moment to read and familiarize yourself with your team:

77
I’m Jack. I’m tall (over 190cm) and live in Sweden,, I love football and handball and
orienteering.
My name is Samantha. I’m a stay-at-home-mom and I live in the US. I love MTK
because it allows me to pick up some extra cash on the side. I <3 it!
Georrig – Wie gehts. Germany checking in. Plugging away as always.
Greetings. I’m Pallavi. While I wrote my MBA in the US I’m based out of Mumbai.
PLEASE INSERT SELF-STATEMENT (MANDATORY):
Now that you've introduced yourself, please alphabetically organize as many of the
following three-word company names in as many of the five-phrase groupings as you can
in 20 minutes:
[NOTE: Task redacted for preservation of space; see Appendix ## - for complete tasklist]
Thanks for your input!
Please note that while this alphabetization task has been posted multiple times, we wouldask that you only attempt this task once. Thank you again for your help.

78
Appendix F
Bollen & Hoyle’s Perceived Cohesion Scale (PCS)
In accordance with the originating 1990 work of Kenneth Bollen and Rick Hoyle,I will be using the Perceived Cohesion Scale, which leverages the following six-question,Likert-based (0-10, with 10 representing the highest agreement) questions:
(Excerpted from the original 1990 “Perceived Cohesion: A conceptual and Empirical
Examination” work by Bollen and Hoyle; used with permission.)
Sense of Belonging
I feel a sense of belonging to _________.
I feel that I am a member of the _________community.
I see myself as a part of the __________community.
Feelings of Morale
I am enthusiastic about _________.
I am happy to be at [live in] _________.
_________is one of the best schools [cities] in the nation.
Given Amazon Mechanical Turk is a transactional online work community the questionswill be tailored accordingly:
Sense of Belonging
I feel a sense of belonging to ___My Team___.I feel that I am a member of the ____Amazon Mechanical Turk___community.I see myself as a part of the __ Amazon Mechanical Turk_____community.
Feelings of Morale
I am enthusiastic about ___Working Online ______.I am happy to be at ____Amazon Mechanical Turk_____.__Amazon Mechanical Turk__is one of the best working communities in the
world.
It will be delivered in context as follows:
Thanks for helping us out with this task. Please indicate your feelings on a scale
of 0 to 10 (with 0 representing the highest disagreement with the statement and 10
representing the highest agreement with the statement) next to the following statements:

79
Sense of Belonging
I feel a sense of belonging to my team. ____
I feel that I am a member of the Amazon MechanicalTurk community. ____
I see myself as a part of the Amazon Mechanical Turk community. ____
Feelings of Morale
I am enthusiastic about working online. ____
I am happy to be at Amazon MechanicalTurk. ____
Amazon MechanicalTurk is one of the best working communities in the world.
____
Thanks for your input!

80
Appendix G
Debriefing
Thank you again for choosing to participate in the Alphabetization task.
The task you just completed was a part of a study looking at the performance of
individuals working in teams in virtual work environments. It was specifically looking at
seeing what variables reduce the psychological phenomenon of “social loafing” (which
often results in lower performance of individuals in teams relative to the performance
they otherwise would have achieved through their individual contribution).
The hope is that by better understanding how to help people maximize their work
potential we can help individuals and the leaders of organizations (academic,
governmental, and commercial) differentiate themselves and bring about a better world
with the limited time and resources we have.
Your contributions will be completely anonymized, all identifiers (such as your Worker
ID) will be cleansed from the data, and the data itself will be deleted upon completion of
the study. Given the nature of the study, outcomes likely would have been biased had we
let you know this was a study and asked for your consent in advance of your completing
the task, so, if (in the light of now knowing this was for purposes of research) you’d like
to have your input deleted entirely (ie not used in the study) let me know by sending me
an email with your Task ID and we’ll delete the corresponding data before we aggregate
and anonymize the data of the participants. Otherwise, thank you for participating and
helping us try to make the world a better place.
Matt Hagen
(212) 256 - 1655
And please don’t hesitate to reach out in the event that you have any questions or
concerns.
Thanks again.
This research has been reviewed by the Committee on the Use of Human Subjects in
Research at Harvard University. They can be reached at 617-496-2847, 1414

81
Massachusetts Avenue, Second Floor, Cambridge, MA 02138, or [email protected]
if your questions, concerns, or complaints are not being answered by the research team,
if you cannot reach the research team, if you want to talk to someone besides the
research team, or if you have questions about your rights as a research participant.

82
References
Amabile, T. M., Hill, K. G., Hennessey, B. A., & Tighe, E. M. (1994). The WorkPreference Inventory: Assessing intrinsic and extrinsic motivational orientations.Journal Of Personality And Social Psychology, 66(5), 950-967.
doi:10.1037/0022-3514.66.5.950
Bloom, N., Liang, J., Roberts, J., Ying, Z.J. (2013) Does Working from Home Work?Evidence from a Chinese Experiment. Stanford University. Retrieved Dec 21,2013: http://www.stanford.edu/~nbloom/WFH.pdf
Bollen, K. A., & Hoyle, R. H. (1990). Perceived cohesion: A conceptual and empiricalexamination. Social Forces, 69(2), 479-504. doi:10.2307/2579670
Buhrmester, M., Kwang, T., & Gosling, S.D. (2011). Amazon’s Mechanical Turk: A
New Source of Inexpensive, Yet High-Quality, Data? Perspective On
Psychological Science (Sage Publications Inc.), 6(1), 3-5.Doi:101177/1745691610393980
Chidambaram, L., & Tung, L. (2005). Is Out of Sight, Out of Mind? An Empirical Studyof Social Loafing in Technology-Supported Groups. Information Systems
Research, 16(2), 149-168. doi:10.1287/isre.1050.0051
Chin, W. W., Salisbury, W., Pearson, A. W., & Stollak, M. J. (1999). Perceived cohesionin small groups: Adapting and testing the Perceived Cohesion Scale in a small-group setting. Small Group Research, 30(6), 751-766.
doi:10.1177/104649649903000605.
Evans, C. R., & Dion, K. L. (2012). Group cohesion and performance: A meta-analysis.Small Group Research, 43(6), 690-701. doi:10.1177/1046496412468074
Guerin, B. 1986. Mere presence effects in humans: A review. J. Experiment. Soc. Psych.
22, 38-77.
Hardy, C. J., & Crace, R. K. (1991). The effects of task structure and teammatecompetence on social loafing. Journal Of Sport & Exercise Psychology, 13(4),372-381.
Hardy, C. J., & Latané, B. (1988). Social loafing in cheerleaders: Effect of teammembership and competition. Journal Of Sport & Exercise Psychology, 10, 109-114.

83
Hinduja, S. (2008). Deindividuation and Internet software piracy. Cyberpsychology &
Behavior, 11(4), 391-398. doi:10.1089/cpb.2007.0048
Huffman, A.H., Whetten, J., Huffman, W.H. (2013). Using technology in highereducation: The influence of gender roles on technology self-efficacy. Computer in
Human Behavior, 29, 1779-1786.
Ingham, A. G., Levinger, G., Graves, J., & Peckham, V. (1974). The Ringelmann effect:Studies of group size and group performance. Journal Of Experimental Social
Psychology, 10(4), 371-384. doi:10.1016/0022-1031(74)90033-X.
Iyengar, S. S., & Lepper, M. R. (2000). When choice is demotivating: Can one desire toomuch of a good thing? Journal Of Personality And Social Psychology, 79(6), 995-1006. doi:10.1037/0022-3514.79.6.995
Jackson, J.M., & Williams, K.D. (1985). Social loafing on difficult tasks: Workingcollectively can improve performance. Journal of Personality and Social
Psychology, 49, 937-942.
Karau, S. J., & Williams, K. D. (1993). Social loafing: A meta-analytic review andtheoretical integration. Journal Of Personality And Social Psychology, 65(4), 681-706. doi:10.1037/0022-3514.65.4.681
Kravitz, D. A., & Martin, B. (1986). Ringelmann rediscovered: The original article.Journal Of Personality And Social Psychology, 50(5), 936-941.doi:10.1037/0022-3514.50.5.936
Kyndt, E., Dochy, F., Struyven, K., Cascallar, E. (2013). The direct and indirect effect ofmotivation for learning on students’ approaches to learning through the
perceptions of workload and task complexity. Higher Education Research &
Development, 30:2, 135-150.
Latene, B (1981). The psychology of social impact. American Psychologist, 36. 343-356.
Liang, Y., Lee, S.A., Jang, J. (2013). Mindlessness and gaining compliance in Computer-Human Interaction. Computers in Human Behavior, 29, 1572-1579.
Lock, E.A., Schweiger, D.M., Latham, G.P. (1984). Participation in Decision Making:When Should It Be Used? Social Psychology and Organizational Behavior.
Lo, S.K., Hsieh, A.Y., Chiu, Y.P. 2013. Contradictory deceptive behavior in onlinedating. Computers in Human Behavior, 29, 1755-1762.
McCreery, M.P., Schrader, P.G., Krach, S.K., Boone, R. (2013). A sense of self: The roleof presence in virtual environments. Computers in Human Behavior, 29, 1635-1640.

84
Miller, J. (2002). Individual motivation loss in group settings: An exploratory study ofthe social-loafing phenomenon. Dissertation Abstracts International Section A,62, (9-A).
Preciado, P., Snijders, T. B., Burk, W. J., Stattin, H., & Kerr, M. (2012). Does proximitymatter? Distance dependence of adolescent friendships. Social Networks, 34(1),
pp. 18-31.
Roets, A., Schwartz, B., & Guan, Y. (2012). The tyranny of choice: A cross-culturalinvestigation of maximizing-satisficing effects on well-being. Judgment And
Decision Making, 7(6), 689-704.
Shiue, Y., Chiu, C., & Chang, C. (2010). Exploring and mitigating social loafing inonline communities. Computers In Human Behavior, 26(4), 768-777.doi:10.1016/j.chb.2010.01.014
Sin, K. (2011). Social loafing in virtual collaborative decision making: Relationshipamong media richness, media synchronicity, group performance, and individualeffort. Dissertation Abstracts International, 71.
Stokes, J. P., Fuehrer, A., & Childs, L. (1983). Group members' self-disclosures: Relationto perceived cohesion. Small Group Behavior, 14(1), 63-76.doi:10.1177/104649648301400106
Suleiman, J., & Watson, R. T. (2008). Social loafing in technology-supported teams.Computer Supported Cooperative Work (CSCW), 17(4), 291-309.doi:10.1007/s10606-008-9075-6
Sun, Y., Fang, Y., Lim, K.H. (2012). Understanding sustained participation intransactional virtual communities. Decision Support Systems, 52, 12-22.
Williams, K.D., Harkins, S.G., & Latané, B. (1981). Identifiability as a deterrent to socialloafing: Two cheering experiments. Journal of Personality & Social Psychology,
40, 303-311.
Zoghbi-Manrique-de-Lara, P. (2012). Reconsidering the boundaries of the cyberloafingactivity: The case of a university. Behaviour & Information Technology, 31(5),469-479. doi:10.1080/0144929X.2010.549511

85
Works Consulted
Aarts, H., Dijksterhuis, A. P., & Midden, C. (1999). To plan or not to plan? Goalachievement of interrupting the performance of mundane behaviors. European
Journal Of Social Psychology, 29(8), 971-979. doi:10.1002/(SICI)1099-0992(199912)29:8<971::AID-EJSP963>3.0.CO;2-A
Anand, B. (2013, March 21st). Harvard Business School Launches HBX. Harvard
Magazine. Retrieved 3/21/14 from http://harvardmagazine.com/2014/03/harvard-business-school-launches-online-hbx.
Bates, J.A., & Lanza, B.A. (2013). Conducting Psychology Student Research via theMechanical Turk Crowdsourcing Service. North American Journal ofPsychology, 15(2). 385-394.
Byrne, J.A. (2013, March 21st). Harvard Business School Goes Online. Poets And
Quants. Retrieved 3/21/14 from http://poetsandquants.com/2014/03/21/hbs-bold-entry-into-the-digital-market/2/.
Correia, A.M.R., Paulos, A., Mesquita, A., Lopes, J. (2010). Virtual Communities ofPractice: Investigating Motivations and Constraints in the Process of KnowledgeCreation and Transfer. The Electronic Journal of Knowledge Management, vol. 8,
issue 1, pp. 11-20.
Dai, X., Dong, P., & Jia, J.S. (2013). When does playing hard to get increaseromantic attraction? Journal of Experimental Social Psychology: General.
Advance online publication. doi: 10.1037/a0032989
Gamito, P., Oliveira, J., Morais, D., Baptista, A., Santos, N., Soares, F., Saraiva, T., Rosa,P. (2010). Training Presence: The Importance of Virtual Reality Experience onthe “Sense of Being There”. Annual Review Of Cybertherapy And Telemedicine,8103-106.
Geen, R. G. (1991). Social motivation. Annual Review Of Psychology, 42377-399.doi:10.1146/annurev.ps.42.020191.002113
Hassouneh, D., Bregman, M. (2013). A motivation-based typology of social virtual worldusers. Computers in Human Behavior, ISSN 0747-5632.
Huang, W.H.D., Han, S.H., Park, U.Y., Seo, J.J. (2013). Managing Employees’

86
Motivation, Cognition, and Performance in Virtual Workplaces: The Blueprint ofa Game-based Adaptive Performance Platform (GAPP). Advances in Developing
Human Resources, vol. 12, no. 6, p.700-714.
Joo, B.K., Lim, T. (2009). The Effects of Organizational Learning Culture, Perceived JobComplexity, and Proactive Personality on Organizational Commitment and
Intrinsic Motivation. Journal of Leadership & Organizagional Studies, 16: 48.
Labroo, A. A., & Kim, S. (2009). The “instrumentality” heuristic: Why metacognitive
difficulty is desirable during goal pursuit. Psychological Science, 20(1), 127-134.doi:10.1111/j.1467-9280.2008.02264.x
Locke, E. A., Shaw, K. N., Saari, L. M., & Latham, G. P. (1981). Goal setting and taskperformance: 1969–1980. Psychological Bulletin, 90(1), 125-152.doi:10.1037/0033-2909.90.1.125
Mangos, P. M., & Steele-Johnson, D. (2001). The role of subjective task complexity ingoal orientation, self-efficacy, and performance relations. Human Performance,14(2), 169-186. doi:10.1207/S15327043HUP1402_03
Peck, J., & Shu, S. B. (2009). The effect of mere touch on perceived ownership. Journal
Of Consumer Research, 36(3), 434-447. doi:10.1086/598614
Schwartz, B. (2004). The paradox of choice: Why more is less. New York, NY US:HarperCollins Publishers.
Sträfling, N., Fleischer, I., Polzer, C., Leutner, D., & Krämer, N. C. (2010). Teachinglearning strategies with a pedagogical agent: The effects of a virtual tutor and itsappearance on learning and motivation. Journal Of Media Psychology: Theories,
Methods, And Applications, 22(2), 73-83. doi:10.1027/1864-1105/a000010