Embed Size (px)
Citation preview

Columbia University’s Green Data Center Winter Workshop Agenda – January 7, 2011
9:00am Registration & Breakfast
9:30 – 10:15 Welcome and Opening Remarks
10:30 – 11:15 Data Center Best Practices - Electrical and Cooling Overview
11:30 – 12:30 Columbia University’s Advanced Concepts Data Center Pilot
12:30– 1:30pm Lunch
1:30 – 2:15 Syracuse University’s Data Center
2:30 – 3:15 New York University’s Data Center
3:30 – 5:00 Closing Comments/Open Discussion
5:00pm Meeting Adjourned
1

Columbia University’s Green Data Center Winter Workshop
Measuring and Validating Attempts to Green Columbia’s Data Center
January 7, 2011
Columbia University Information Technology

33
Agenda
• Opportunities to “Go Green”
• Columbia University’s Advanced Concepts Datacenter Demonstration project
• Challenges and Successes
• Lessons Learned
• Questions & Answers
IBM 7090 in University Computer Center, 1966
Opportunities to “Go Green”
4
• Data centers consume 3% of all electricity in New York State (1.5% nationally - estimated in 2006 which translates to $4.5 billion annually)
• Centralizing research computing saves energy, space and money
• Columbia’s commitment to Mayor Bloomberg’s PlaNYC 30% carbon footprint reduction by 2017.
• NYS Gov. Paterson’s 15 x15 goal - 15% electrical demand reduction by 2015
• National Save Energy Now 25% energy intensity reduction in 10 yrs.

CU Data Center Improvement Program
• Begun with an assessment and recommendation performed by Bruns-Pak, Inc. in 2009.
• Columbia Facilities Operations HVAC (Heating, Ventilation, Air Conditioning) study by Horizon Engineering.
• Generator overload mitigation study by Rowland Engineering.
• JB&B, Gensler & Structuretone developed a master plan which was used to develop:– DOE ARRA grant application for HVAC improvements (not awarded).– NIH ARRA grant application for electrical improvements (awarded
04/15/10 Core Research Computing Facility). – NYSERDA grant application awarded 04/01/2009.– Future funding opportunities
• Syska Hennesy developing detailed plans for NIH Grant
5

Columbia’s NYSERDA project• New York State Energy Research & Development Authority is a public benefit
corporation funded by NYS electric utility customers. http://www.nyserda.org
• Columbia competed for and was awarded an “Advanced Concepts Data Center Demonstration Project”
24 months starting April 2009 ~ $1.2M ($447K Direct costs from NYSERDA)
• Goals:
Learn about and test some industry best practices in an operational datacenter Measure and verify claimed energy efficiency improvements Share lessons learned with our peers
6

77
Scope of Work
• Inventory– Create detailed physical inventory of existing servers
• Measure server power consumption– Install network-monitored power distribution units (PDUs) for each server
• Measure server input air temperature and data center chilled water– Install input ambient air temperature monitors for each server – Install BTU metering on data center supply and return lines
7

Scope of Work Cont’d
• Establish overall data center power consumption profile– Utilize equipment load results to establish baselines– Develop Power Usage Effectiveness ratio for entire data center
• Implement 9 high density racks with in-row cooling
• Replace 30 “old” servers and measure efficiency improvement– Consolidate the replacement servers into high density racks and re-implement
the same IT services– Take measurements of before-and-after power consumption – Document expected and actual efficiency improvement
8

99
Scope of Work Cont’d
• Compare old and new high performance research clusters– Document changes in energy consumption
• Implement server power management features– BIOS- and operating system-level tweaks
• Increase chilled water set point and measure– Document measured before-and-after energy consumption
9

Installation Summary of Monitoring and Measurement Tools
Ian Katz, Data Center Facilities Manager, CUIT
10

Accomplishments
• Installed power meters throughout Data Center– Established overall data center power usage ~ 290kW
• Installed metered PDU’s and plugged in inventoried hosts
• Installed chilled water flow meters– Established overall data center heat load ~ 120tons
• Established CU Data Center PUE (Power Usage Effectiveness)
• Other Data Center Improvements
11
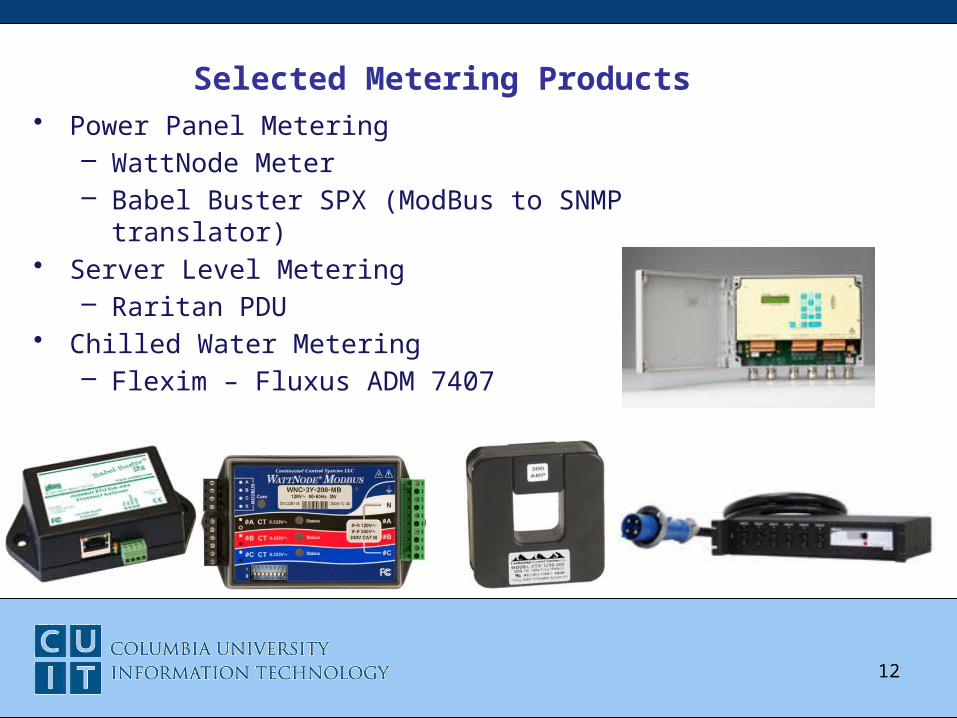
Selected Metering Products• Power Panel Metering
– WattNode Meter– Babel Buster SPX (ModBus to SNMP translator)
• Server Level Metering– Raritan PDU
• Chilled Water Metering– Flexim – Fluxus ADM 7407
12

Power Meter Installation
• Installed WattNodes in 20 Power Panels• 17 Panels in Data Center• 3 Main Feeder Panels in Mechanical room
– ATS 2 & 3 - HVAC Load– ATS 4 - IT Load
13
• 290kW IT load read from PP1,2,3,4,5,6,16,26,27
• 120kW HVAC load read from ATS 2 & 3

Chilled Water Meter Installation• Flexim meters installed in Mechanical Room• Sensors installed to measure flow rate and
temperature• Result is Heat Flow Rate in tons• HF (tons) = Vol Flow (gpm) * ∆T / 24
14
• Sensors installed in 3 locations– Liebert CRACs 1 – 6
– AC 1 & 2– Dry Coolers
• Meters tied into same Modbus network as Wattnodes

Server Level Metering• Meter many different hardware types with Raritan PDU’s
– Sun: NetraT1, V100, V210, V240, 280R, V880, T2000– HP: DL360G4p, DL360G5p, DL380G5
• 30 Servers Identified to:– Establish Active/Idle Benchmark– Investigate service usage comparisons
• Blade chassis (HP c7000) and blade servers (HP BL460c) metered with built-in tools.
15
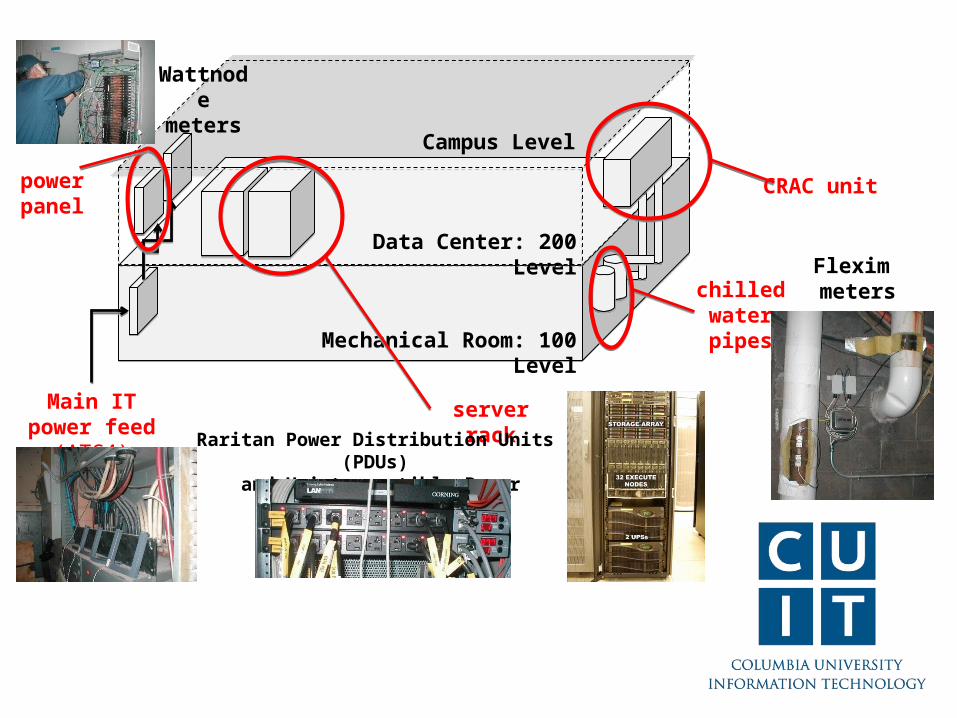
Mechanical Room: 100 Level
Data Center: 200 Level
Campus Level
server rackRaritan Power Distribution Units (PDUs)
and Uninterruptible Power Supplies (UPSs)
Wattnode meters
chilled water pipes
Main IT power feed (ATS4)
power panel
CRAC unit
Flexim meters

Data Center PUE (Summer) – PUE = 2.26
17

More Data Center Improvements
• Installed Overhead Cable Trays– Will allow us to remove network
cabling under raised floor
• Began Implementation of New Data Center Layout– Hot Aisle / Cold Aisle Format
• *Future* – Duct CRAC units & use ceiling as
plenum to return hot air from hot aisles to CRACs
– Install overhead power bus to further reduce airflow obstructions under raised floor
18

Measurement Plan and Initial Results
Peter Crosta, Research Computing Services, CUIT
19

Server Power Analysis
• Comparing power consumption of old and new(er) hardware
• High performance computing (HPC) cluster power consumption comparison
• Power management and tuning
20

Out with the old, in with the new
• If we replace old servers with new servers, how will power consumption change?
IBM 7090 in University Computer Center, 1966
Microsoft’s Chicago data center, 2009
21
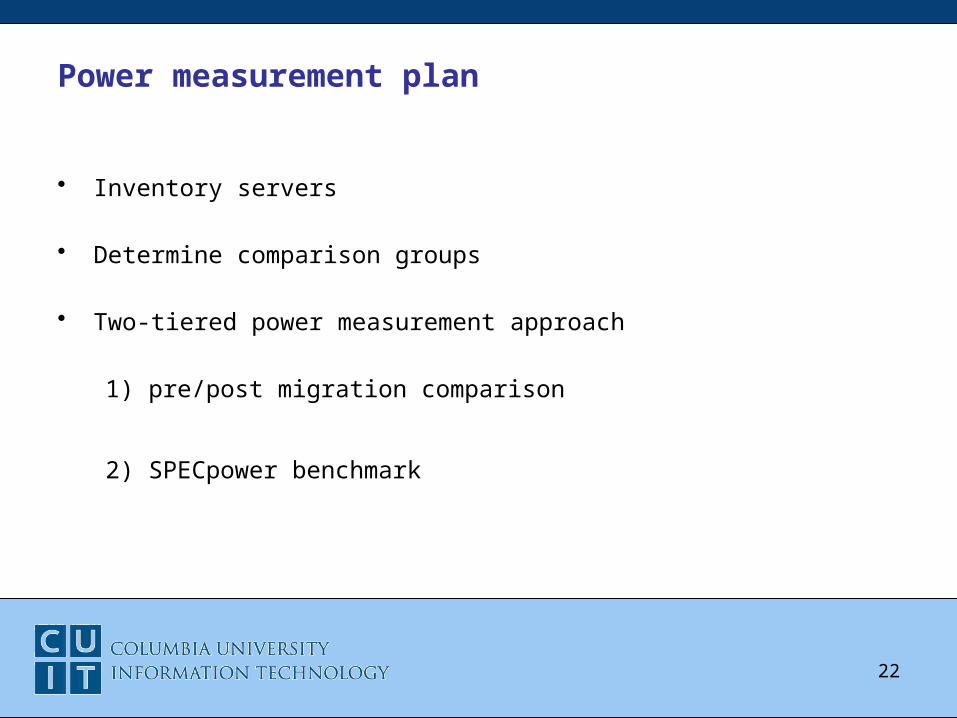
Power measurement plan
• Inventory servers
• Determine comparison groups
• Two-tiered power measurement approach
1) pre/post migration comparison
2) SPECpower benchmark
22

Pre/post migration comparisons
• Power consumption of same IT services on different hardware
MigrationTime
Old server New server
Linux-Apache-MySQLP-PHP (LAMP) Example:
23
Old Server Standalone DL360 G5p
New Server Blade BL460 CG6
Old Watts (Week Avg) 478 W
New Watts (Week Avg) 330 W


SPECpower benchmark
• Industry standard benchmark to evaluate performance and power
• Addresses the performance of server side Java
• Finds maximum ssj_ops (server side Java operations per second)
• With simultaneous power measurement, allows calculation of ssj_ops / watt (performance per watt)
25

Example SPECpower comparison
Standalone server
Blade
SPECpower benchmarks only valid for internal CUIT comparisons. Results were smoothed for visual clarity.
• DL360 G5p standalone server• Max: 255 W• Idle: 221 W• Overall ssj_ops/W: 139
• BL460 G6 Blade• Max: 266 W• Idle: 150 W• Overall ssj_ops/W: 600
26

Not all SPECpower results look like that: Sun Sunfire V880
27

Power measurement summary
• Designed plan to measure old and new server power consumption in multiple ways.
– Energy consumed while running the same IT services – Performance per watt of power used (SPECpower)
• Power usage improvements noted in most cases of moving a service from older to newer hardware – especially when moved to blades.
• We can use these measurements to determine future hardware changes and purchases.
28

Cluster comparison
• Can a new, larger research cluster be more energy efficient than an older, smaller research cluster?
HotfootBeehive
29

The clusters
Beehive• Built in 2005• 16 cores• 8 standalone servers• Dual-core 2.2 GHz AMD Operton• 2 to 8 GB RAM• 10 TB SATA storage• OpenPBS scheduler
• Theoretical Peak GFlops: 61 • IDLE POWER IN WATTS: 2.7 kW
Hotfoot• Built in 2009• 256 cores• 16 high-density blades (2 servers each)• Dual quad-core 2.66 GHz Intel Xenon• 16 GB RAM• 30 TB SATA storage• Condor scheduler
• Theoretical Peak GFLops: 2724• IDLE POWER IN WATTS: 4.1 kW
30

Cluster comparison plan
• Power use in active idle state– Beehive = 2.7 kW– Hotfoot = 4.1 kW
• Energy consumption while running research tasks or proxies– Counting to one billion– Summing primes from 2 to 2 million (MPI)– Summing primes from 2 to 15 million (MPI)
31

Cluster energy use while running jobs
New cluster uses less energy to run research jobs than old cluster.
32
Job Cluster RuntimeTime
Difference EnergyEnergy
Difference
Beehive 3.33 minutes 0.15 kWhHotfoot 2.87 minutes 0.46 minutes 0.20 kWh 133%
Beehive 13.02 minutes 0.61 kWhHotfoot 4.93 minutes 8.09 minutes 0.35 kWh 57%
Beehive 8.92 hours 24.2 kWhHotfoot 3.87 hours 5.05 hours 16.3 kWh 67%
Hotfoot 15.85 minutes 8.66 hours 1.3 kWh 5%
Count to one billion on 1 core
Sum primes between 2 and 2 million on 14 cores
Sum primes between 2 and 15 million on 14 cores
Sum primes between 2 and 15 million on 256 cores

Cluster comparison summary
• Older cluster consumes less power and uses less energy at baseline
• Advantages of newer cluster are evident as utilization increases
33

Power tuning
• Implement server-, BIOS-, OS-level power tuning and power management
• Re-run benchmarks and service group comparisons to collect additional power usage data
34
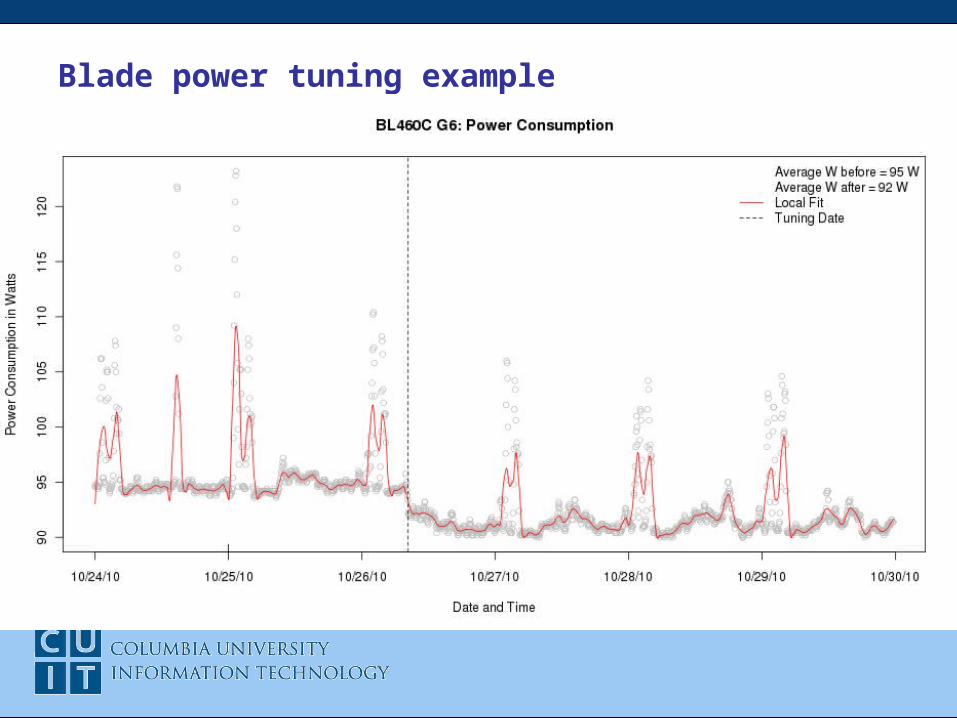
Blade power tuning example

Overall Challenges to the Data Center Pilot Project
• Operational data center
• Communication between IT and Facilities
• Identification of what to measure
• Implementing and storing measurements
• High-density, chilled rack infrastructure complexity and cost
36

High-density Chilled Racks
• Preliminary design with assistance of engineering firm• RFP issued
– stressed energy efficiency as well as facilities operational standards• Finalists selected• Complications due to dual mode cooling plant
– Nominal 45 degree chilled water operation vs. 100 degree dry-cooler operation
– No “off-the-shelf” products work in both modes• Possible solution identified• Currently finalizing peer review of engineering design • Risk - High cost impact
37

Project Successes
• Measurement Infrastructure– Installed power meters throughout data center
• 20 Power Panels (17 in DC, 3 feeders panels in machine room)• Established overall data center IT load ~ 247kW
– Installed metered PDUs and plugged in servers– Installed chilled water flow meters
• Sensors installed to measure flow rate and temperature• Established overall data center heat load ~ 120tons
• General Infrastructure– Hardware Consolidation– Cable Tray– Revised Layout (Hot & Cold aisle) format
• Estimated Columbia data center PUE (Power Usage Effectiveness)
38
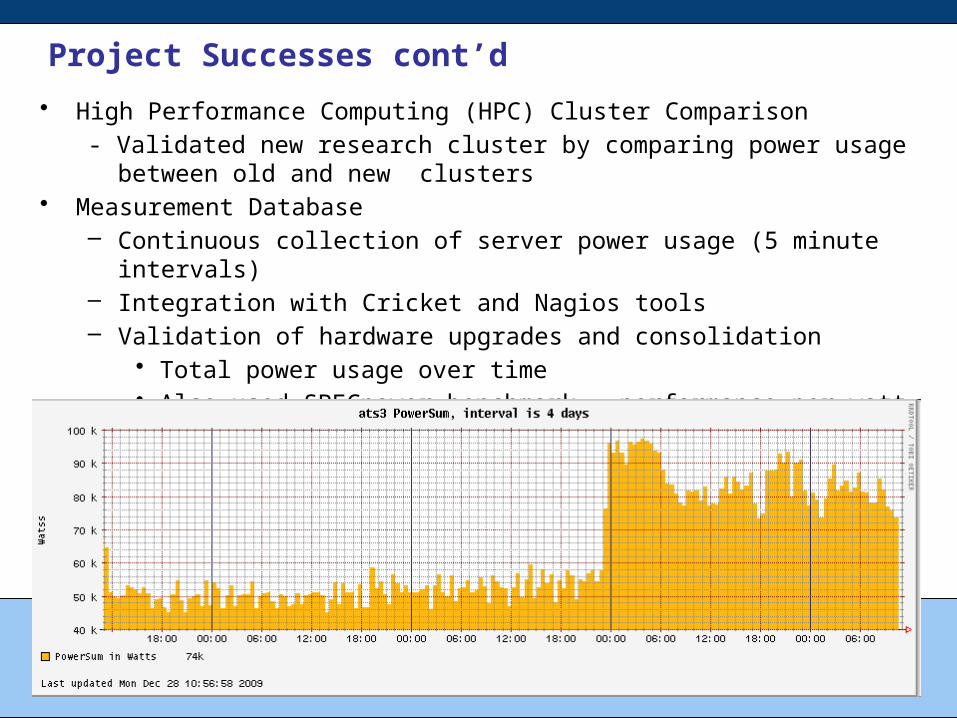
Project Successes cont’d
• High Performance Computing (HPC) Cluster Comparison
- Validated new research cluster by comparing power usage between old and new clusters
• Measurement Database– Continuous collection of server power usage (5 minute intervals)– Integration with Cricket and Nagios tools– Validation of hardware upgrades and consolidation
• Total power usage over time• Also used SPECpower benchmark – performance per watt
39
40
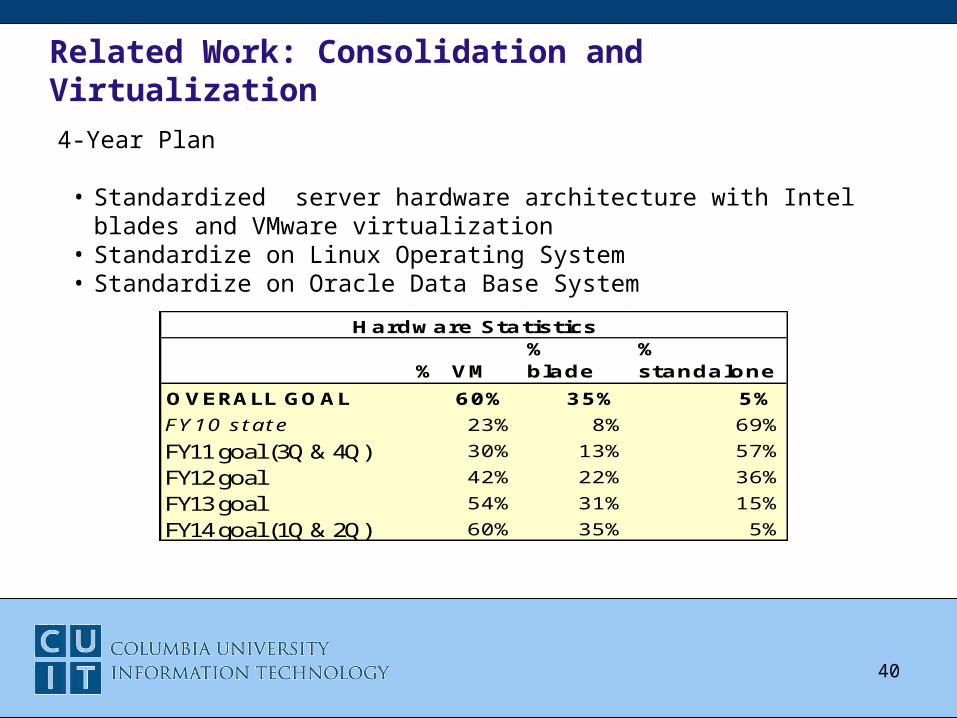
Related Work: Consolidation and Virtualization
% VM% blade
% standalone
OVERALL GOAL 60% 35% 5%
FY10 state 23% 8% 69%FY11 goal (3Q & 4Q) 30% 13% 57%FY12 goal 42% 22% 36%FY13 goal 54% 31% 15%FY14 goal (1Q & 2Q) 60% 35% 5%
Hardware Statistics
4-Year Plan
• Standardized server hardware architecture with Intel blades and VMware virtualization
• Standardize on Linux Operating System• Standardize on Oracle Data Base System

Lessons Learned
• Work with facilities early to anticipate dependencies– Chilled water set point change– Installation of high-density self-cooled racks
• Low-hanging fruit of power tuning servers not as promising as we thought
• Latest server hardware not always necessary for green improvement
• Measuring every piece of hardware is expensive - extrapolate
41

Future Considerations
• Post-project monitoring, measurement, and data collection
• Integrating data with hardware retirement and purchase decisions
• Effective dissemination of information
42

Thank You!
This work is supported in part by the New York State Energy Research and Development Authority (NYSERDA agreement number 11145). NYSERDA has not reviewed the information contained herein, and the opinions expressed do not necessarily reflect those of NYSERDA or the State of New York.
43
Questions
More info: http://blogs.cuit.columbia.edu/greendc/