Embed Size (px)
Citation preview
Colorado Family Resource Center Association Family Pathways & CFSA 2.0 Evaluation Report
- Office of Early Childhood Family Support Services Grantees
July 1, 2017 – June 30, 2018
Submitted to Family Resource Center Association August 30, 2018
Colorado Family Resource Center Association Family Pathways & CFSA 2.0 Evaluation Report
-Office of Early Childhood Family Support Services (FSS) Grantees
July 1, 2017 – June 30, 2018
For more information about Family Resource Center Association, please contact:
Teri Haymond, LCSW
Program Director
Family Resource Center Association
1888 Sherman Street, Suite 100, Denver, CO 80203
[email protected]; 303-388-1001, Ext. 102
www.cofamilycenters.org
For more information about OMNI Institute, please contact:
Melissa Richmond, PhD
Director of Research and Evaluation
OMNI Institute
899 Logan Street, Suite 600, Denver, CO 80203
[email protected]; 303-839-9422, Ext. 166
www.omni.org
Acknowledgements: Funding for this report was provided in part by the Colorado Department of
Human Services’ Office of Early Childhood.
Table of Contents Executive Summary ......................................................................................................................................................... i
Introduction ...................................................................................................................................................................... 1
Standards of Quality .................................................................................................................................................. 3
Family Pathways Framework ................................................................................................................................. 4
Family Development Core Service Components ............................................................................................ 6
Colorado Family Support Assessment, V. 2.0 ................................................................................................... 7
FRCA Training Model ................................................................................................................................................ 8
Evaluation Methods ....................................................................................................................................................... 9
Pathway Determination ........................................................................................................................................... 9
Data Preparation ..................................................................................................................................................... 10
CFSA 2.0 Data Preparation and Scale Scores ........................................................................................... 10
Data Considerations .......................................................................................................................................... 11
Results .............................................................................................................................................................................. 12
Section 1. Family Characteristics ....................................................................................................................... 12
Demographic Characteristics of Individuals Served .............................................................................. 12
Services Received ............................................................................................................................................... 16
Section 2. Family self-sufficiency and protective factors .......................................................................... 16
Baseline CFSA 2.0 ............................................................................................................................................... 17
Analysis of Change on the CFSA 2.0 ............................................................................................................. 20
Conclusions .................................................................................................................................................................... 27
References ...................................................................................................................................................................... 28
Appendix A. Number Served by Program ............................................................................................................ 29
Appendix B. Total Number of Services by Service Type ................................................................................. 30
Appendix C. Collective Impact Model ................................................................................................................... 33
Appendix D. Multiple Domain Matrix Results ................................................................................................... 35
Appendix E. CFSA 2.0 ................................................................................................................................................. 45
Appendix F. Common Demographics and Screen Survey Form .................................................................. 53
Figures
Family Pathways .............................................................................................................................................................. 5
Figure 2.1. Percentage of Families Scoring at Each CFSA 2.0 Category at Baseline ............................ 18
Figure 2.2 Percentage of Families Selecting Area for Change ..................................................................... 19
Figure 2.3. Mean Changes from Baseline to Follow-up on Each CFSA 2.0 Domain .............................. 21
Figure 2.4. Percentage of Families Above Prevention Line at Baseline and Follow-Up ...................... 23
Figure 2.5. Mean Scores in Economic Self-Sufficiency and Health Scales ................................................ 24
Figure 2.6. Mean Changes from Baseline to Follow-up in Protective Factor Scales ............................ 25
Figure 2.7. Mean Changes from Baseline to Follow-up in Knowledge of Parenting/Child
Development Protective Factor Items ................................................................................................................. 26
Tables
Table 1.1. Demographic Characteristics of Individuals Served ................................................................... 12
Table 1.2. Family Size .................................................................................................................................................. 13
Table 1.3. Annual Income .......................................................................................................................................... 13
Table 1.4. Family Screening Results ....................................................................................................................... 14
Table 1.5. Family Screening Results – Frequency of Need Responses ...................................................... 15
Table 1.6. Services Received .................................................................................................................................... 16
Table 2.1. Number of Follow-up Assessments Within Each Time Period ................................................ 20
Table A.1. Number Served by Program ................................................................................................................ 29
i
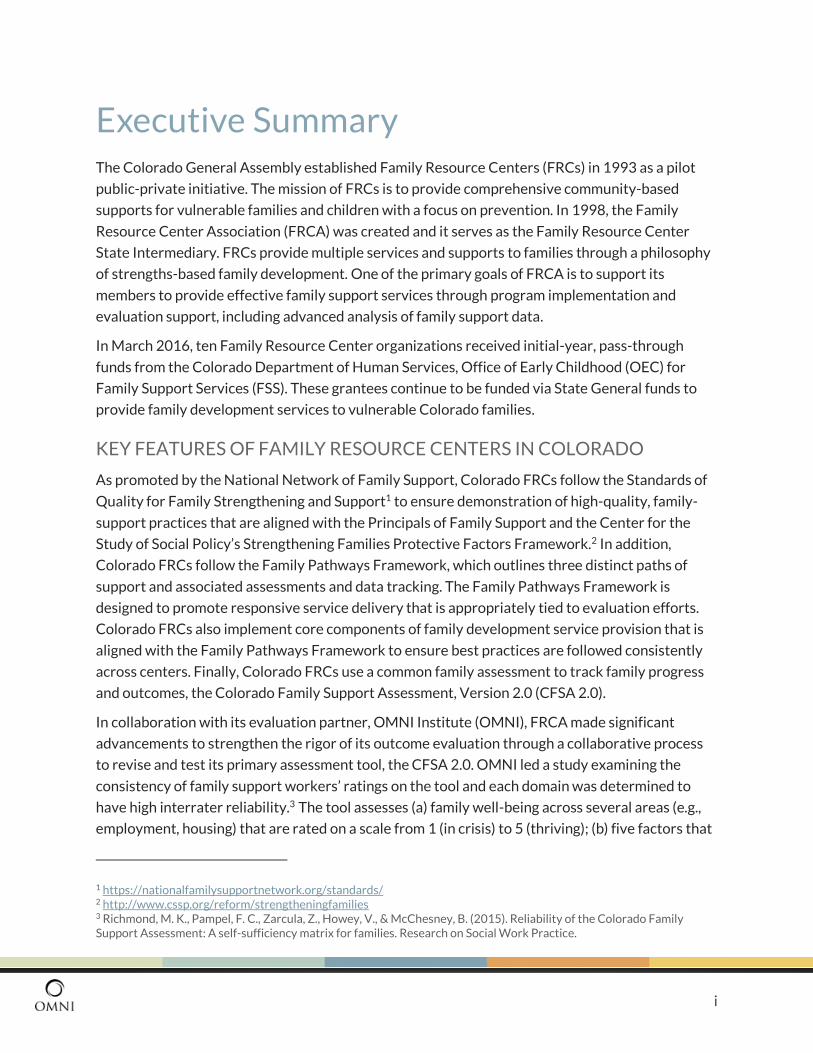
Executive Summary The Colorado General Assembly established Family Resource Centers (FRCs) in 1993 as a pilot
public-private initiative. The mission of FRCs is to provide comprehensive community-based
supports for vulnerable families and children with a focus on prevention. In 1998, the Family
Resource Center Association (FRCA) was created and it serves as the Family Resource Center
State Intermediary. FRCs provide multiple services and supports to families through a philosophy
of strengths-based family development. One of the primary goals of FRCA is to support its
members to provide effective family support services through program implementation and
evaluation support, including advanced analysis of family support data.
In March 2016, ten Family Resource Center organizations received initial-year, pass-through
funds from the Colorado Department of Human Services, Office of Early Childhood (OEC) for
Family Support Services (FSS). These grantees continue to be funded via State General funds to
provide family development services to vulnerable Colorado families.
KEY FEATURES OF FAMILY RESOURCE CENTERS IN COLORADO
As promoted by the National Network of Family Support, Colorado FRCs follow the Standards of
Quality for Family Strengthening and Support1 to ensure demonstration of high-quality, family-
support practices that are aligned with the Principals of Family Support and the Center for the
Study of Social Policy’s Strengthening Families Protective Factors Framework.2 In addition,
Colorado FRCs follow the Family Pathways Framework, which outlines three distinct paths of
support and associated assessments and data tracking. The Family Pathways Framework is
designed to promote responsive service delivery that is appropriately tied to evaluation efforts.
Colorado FRCs also implement core components of family development service provision that is
aligned with the Family Pathways Framework to ensure best practices are followed consistently
across centers. Finally, Colorado FRCs use a common family assessment to track family progress
and outcomes, the Colorado Family Support Assessment, Version 2.0 (CFSA 2.0).
In collaboration with its evaluation partner, OMNI Institute (OMNI), FRCA made significant
advancements to strengthen the rigor of its outcome evaluation through a collaborative process
to revise and test its primary assessment tool, the CFSA 2.0. OMNI led a study examining the
consistency of family support workers’ ratings on the tool and each domain was determined to
have high interrater reliability.3 The tool assesses (a) family well-being across several areas (e.g.,
employment, housing) that are rated on a scale from 1 (in crisis) to 5 (thriving); (b) five factors that
1 https://nationalfamilysupportnetwork.org/standards/ 2 http://www.cssp.org/reform/strengtheningfamilies 3 Richmond, M. K., Pampel, F. C., Zarcula, Z., Howey, V., & McChesney, B. (2015). Reliability of the Colorado Family Support Assessment: A self-sufficiency matrix for families. Research on Social Work Practice.
ii
protect against child abuse and neglect (e.g., Family Functioning/Resiliency) using the Protective
Factors Survey;4 and (c) readiness to change.
This executive summary contains highlights from evaluation findings for families who were served
by FSS-supported family advocates between July 1st 2017 to June 30th 2018 for nine of the 10
OEC-FSS grantees.5
FSS GRANTEES SERVED OVER 1,100 FAMILIES WITH SUPPORTIVE
SERVICES ACROSS COLORADO
• 1,118 families were served by nine OEC-funded, FRCA-member FRCs.
• FRCs provided 16,808 services to families – over 9,800 basic needs services, over 4,300
parenting services, over 980 adult education services, and over 950 ECE services. 6
• 621 families (56%) had at least one follow-up CFSA 2.0 recorded.
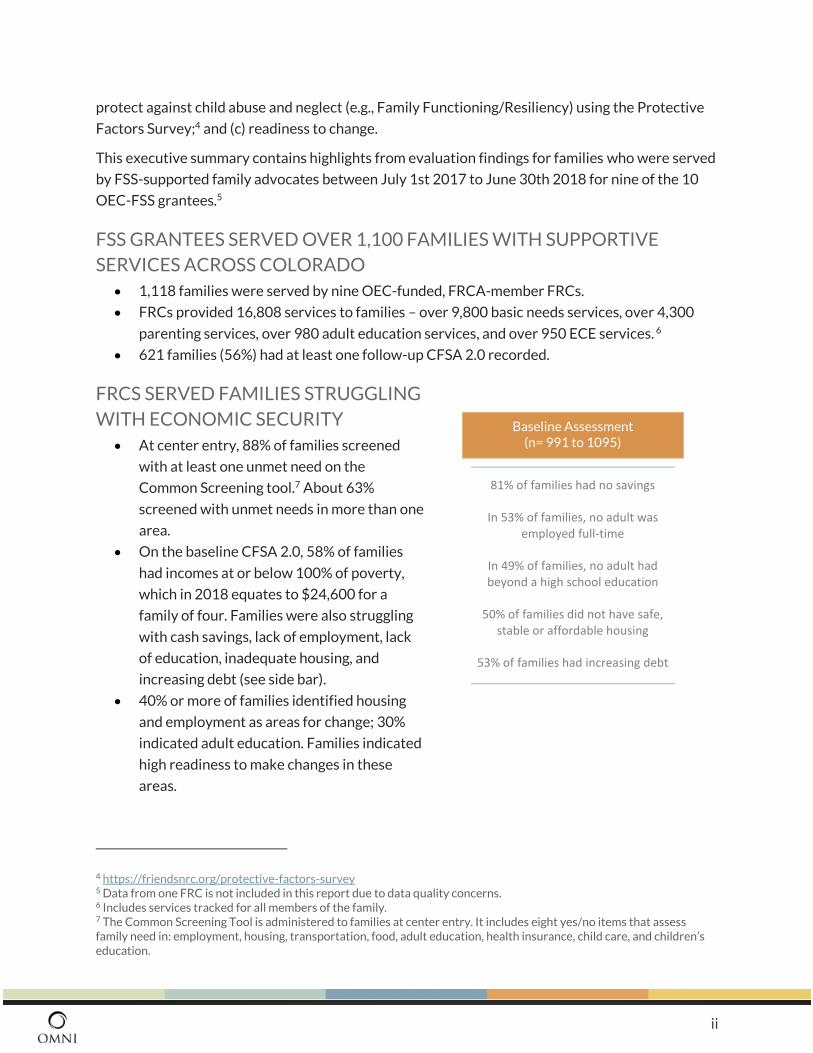
FRCS SERVED FAMILIES STRUGGLING
WITH ECONOMIC SECURITY
• At center entry, 88% of families screened
with at least one unmet need on the
Common Screening tool.7 About 63%
screened with unmet needs in more than one
area.
• On the baseline CFSA 2.0, 58% of families
had incomes at or below 100% of poverty,
which in 2018 equates to $24,600 for a
family of four. Families were also struggling
with cash savings, lack of employment, lack
of education, inadequate housing, and
increasing debt (see side bar).
• 40% or more of families identified housing
and employment as areas for change; 30%
indicated adult education. Families indicated
high readiness to make changes in these
areas.
4 https://friendsnrc.org/protective-factors-survey 5 Data from one FRC is not included in this report due to data quality concerns. 6 Includes services tracked for all members of the family. 7 The Common Screening Tool is administered to families at center entry. It includes eight yes/no items that assess family need in: employment, housing, transportation, food, adult education, health insurance, child care, and children’s education.
Baseline Assessment (n= 991 to 1095)
81% of families had no savings
In 53% of families, no adult was employed full-time
In 49% of families, no adult had beyond a high school education
50% of families did not have safe, stable or affordable housing
53% of families had increasing debt
iii
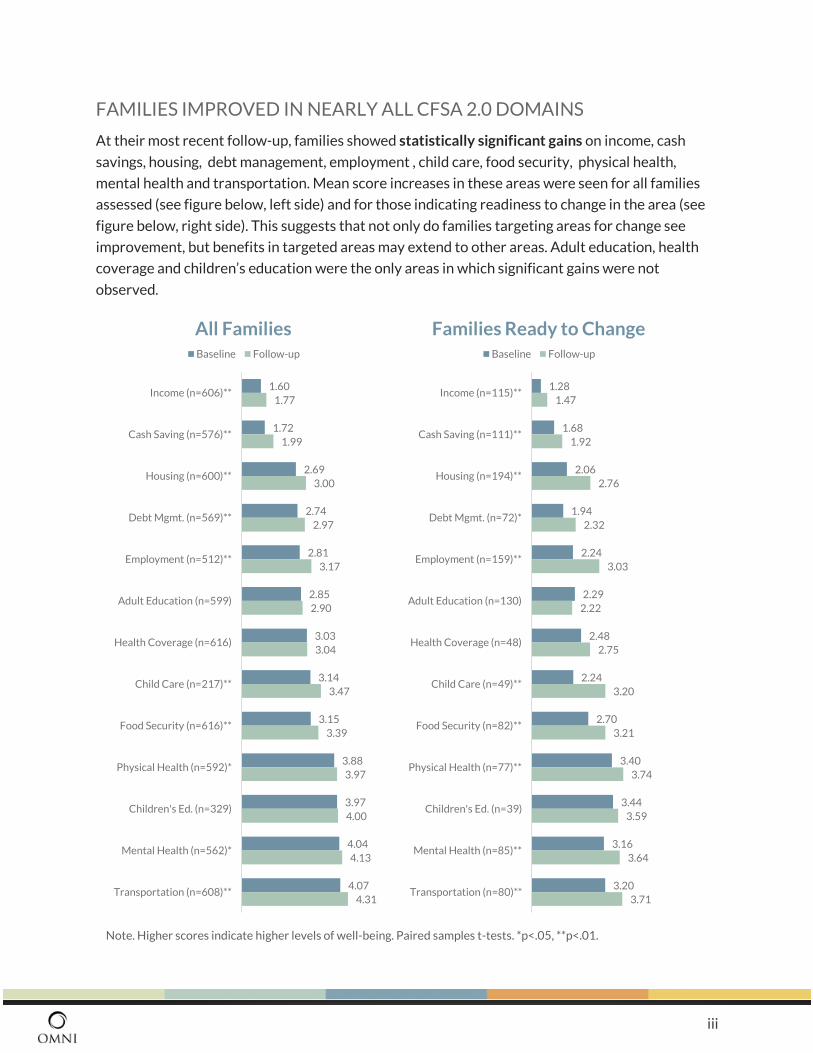
FAMILIES IMPROVED IN NEARLY ALL CFSA 2.0 DOMAINS
At their most recent follow-up, families showed statistically significant gains on income, cash
savings, housing, debt management, employment , child care, food security, physical health,
mental health and transportation. Mean score increases in these areas were seen for all families
assessed (see figure below, left side) and for those indicating readiness to change in the area (see
figure below, right side). This suggests that not only do families targeting areas for change see
improvement, but benefits in targeted areas may extend to other areas. Adult education, health
coverage and children’s education were the only areas in which significant gains were not
observed.
1.60
1.72
2.69
2.74
2.81
2.85
3.03
3.14
3.15
3.88
3.97
4.04
4.07
1.77
1.99
3.00
2.97
3.17
2.90
3.04
3.47
3.39
3.97
4.00
4.13
4.31
Income (n=606)**
Cash Saving (n=576)**
Housing (n=600)**
Debt Mgmt. (n=569)**
Employment (n=512)**
Adult Education (n=599)
Health Coverage (n=616)
Child Care (n=217)**
Food Security (n=616)**
Physical Health (n=592)*
Children's Ed. (n=329)
Mental Health (n=562)*
Transportation (n=608)**
All FamiliesBaseline Follow-up
1.28
1.68
2.06
1.94
2.24
2.29
2.48
2.24
2.70
3.40
3.44
3.16
3.20
1.47
1.92
2.76
2.32
3.03
2.22
2.75
3.20
3.21
3.74
3.59
3.64
3.71
Income (n=115)**
Cash Saving (n=111)**
Housing (n=194)**
Debt Mgmt. (n=72)*
Employment (n=159)**
Adult Education (n=130)
Health Coverage (n=48)
Child Care (n=49)**
Food Security (n=82)**
Physical Health (n=77)**
Children's Ed. (n=39)
Mental Health (n=85)**
Transportation (n=80)**
Families Ready to ChangeBaseline Follow-up
Note. Higher scores indicate higher levels of well-being. Paired samples t-tests. *p<.05, **p<.01.
iv
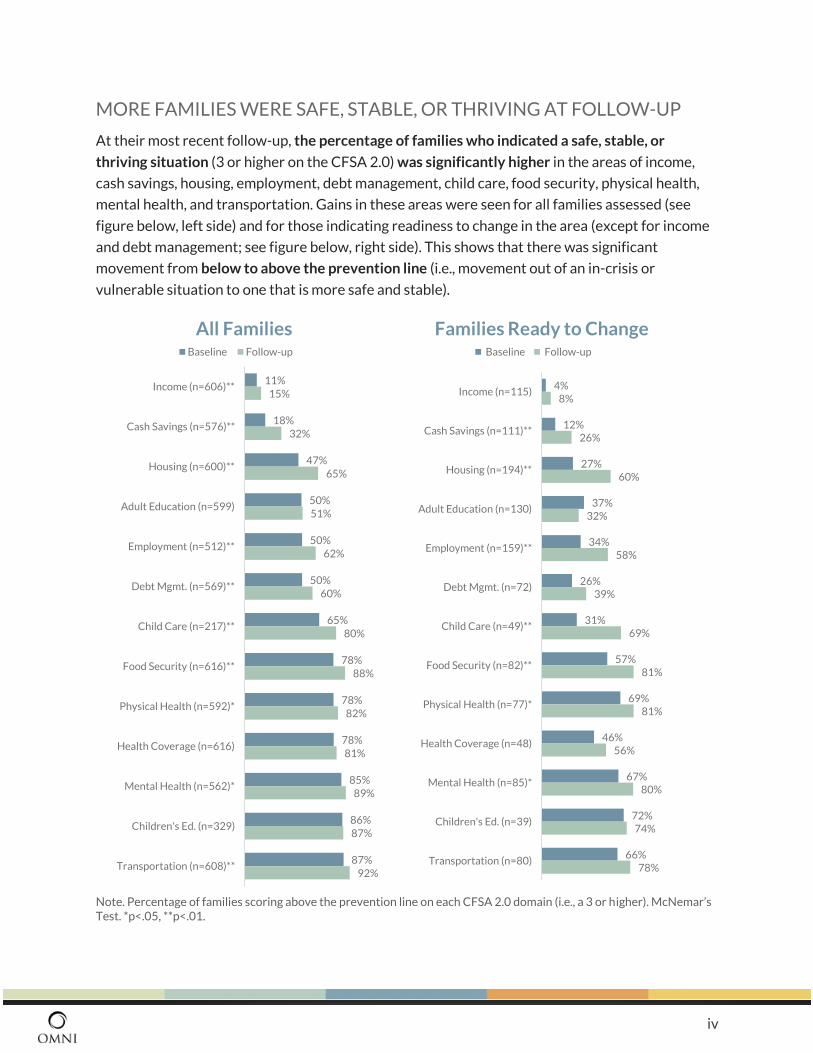
MORE FAMILIES WERE SAFE, STABLE, OR THRIVING AT FOLLOW-UP
At their most recent follow-up, the percentage of families who indicated a safe, stable, or
thriving situation (3 or higher on the CFSA 2.0) was significantly higher in the areas of income,
cash savings, housing, employment, debt management, child care, food security, physical health,
mental health, and transportation. Gains in these areas were seen for all families assessed (see
figure below, left side) and for those indicating readiness to change in the area (except for income
and debt management; see figure below, right side). This shows that there was significant
movement from below to above the prevention line (i.e., movement out of an in-crisis or
vulnerable situation to one that is more safe and stable).
Note. Percentage of families scoring above the prevention line on each CFSA 2.0 domain (i.e., a 3 or higher). McNemar’s Test. *p<.05, **p<.01.
11%
18%
47%
50%
50%
50%
65%
78%
78%
78%
85%
86%
87%
15%
32%
65%
51%
62%
60%
80%
88%
82%
81%
89%
87%
92%
Income (n=606)**
Cash Savings (n=576)**
Housing (n=600)**
Adult Education (n=599)
Employment (n=512)**
Debt Mgmt. (n=569)**
Child Care (n=217)**
Food Security (n=616)**
Physical Health (n=592)*
Health Coverage (n=616)
Mental Health (n=562)*
Children's Ed. (n=329)
Transportation (n=608)**
All FamiliesBaseline Follow-up
4%
12%
27%
37%
34%
26%
31%
57%
69%
46%
67%
72%
66%
8%
26%
60%
32%
58%
39%
69%
81%
81%
56%
80%
74%
78%
Income (n=115)
Cash Savings (n=111)**
Housing (n=194)**
Adult Education (n=130)
Employment (n=159)**
Debt Mgmt. (n=72)
Child Care (n=49)**
Food Security (n=82)**
Physical Health (n=77)*
Health Coverage (n=48)
Mental Health (n=85)*
Children's Ed. (n=39)
Transportation (n=80)
Families Ready to Change Baseline Follow-up
v
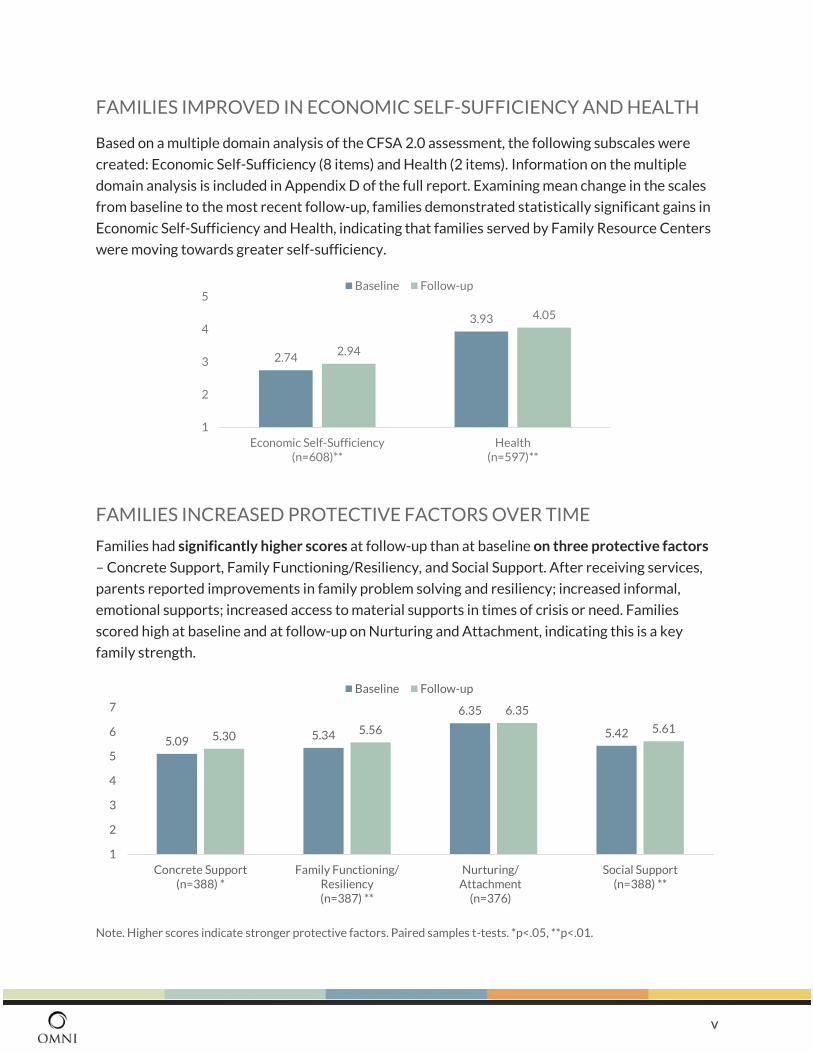
FAMILIES IMPROVED IN ECONOMIC SELF-SUFFICIENCY AND HEALTH
Based on a multiple domain analysis of the CFSA 2.0 assessment, the following subscales were
created: Economic Self-Sufficiency (8 items) and Health (2 items). Information on the multiple
domain analysis is included in Appendix D of the full report. Examining mean change in the scales
from baseline to the most recent follow-up, families demonstrated statistically significant gains in
Economic Self-Sufficiency and Health, indicating that families served by Family Resource Centers
were moving towards greater self-sufficiency.
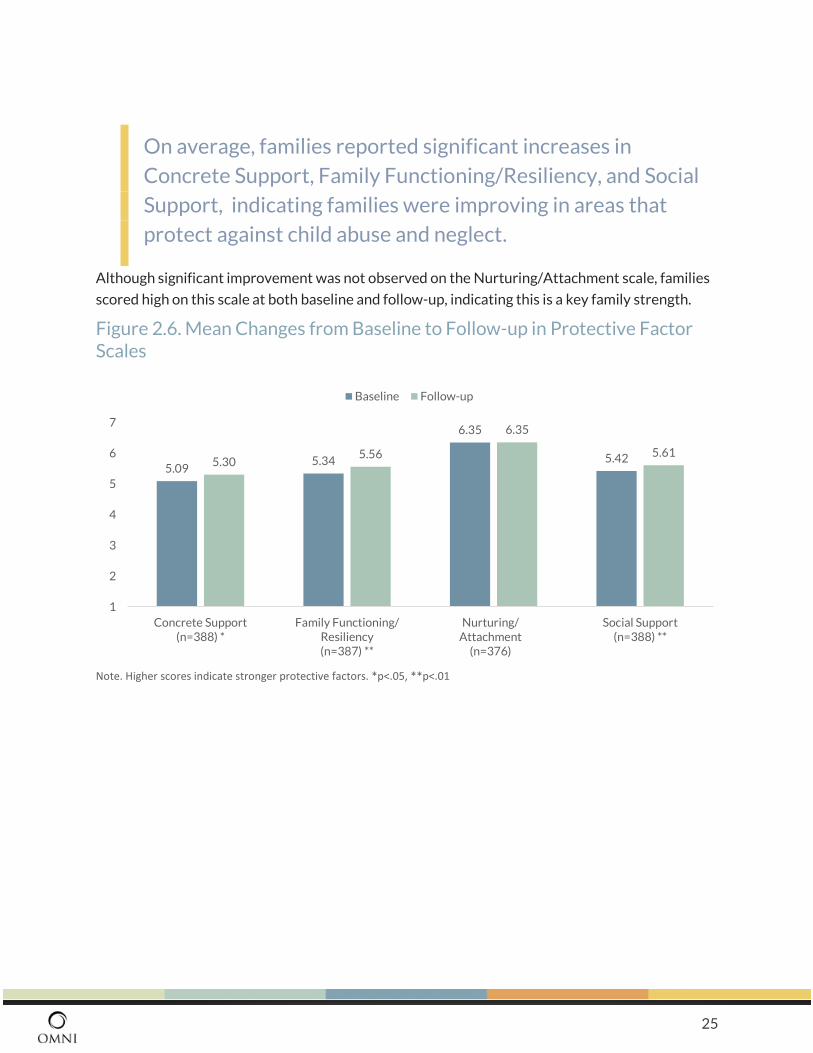
FAMILIES INCREASED PROTECTIVE FACTORS OVER TIME
Families had significantly higher scores at follow-up than at baseline on three protective factors
– Concrete Support, Family Functioning/Resiliency, and Social Support. After receiving services,
parents reported improvements in family problem solving and resiliency; increased informal,
emotional supports; increased access to material supports in times of crisis or need. Families
scored high at baseline and at follow-up on Nurturing and Attachment, indicating this is a key
family strength.
Note. Higher scores indicate stronger protective factors. Paired samples t-tests. *p<.05, **p<.01.
2.74
3.93
2.94
4.05
1
2
3
4
5
Economic Self-Sufficiency(n=608)**
Health(n=597)**
Baseline Follow-up
5.095.34
6.35
5.425.305.56
6.35
5.61
1
2
3
4
5
6
7
Concrete Support(n=388) *
Family Functioning/Resiliency(n=387) **
Nurturing/Attachment
(n=376)
Social Support(n=388) **
Baseline Follow-up
vi
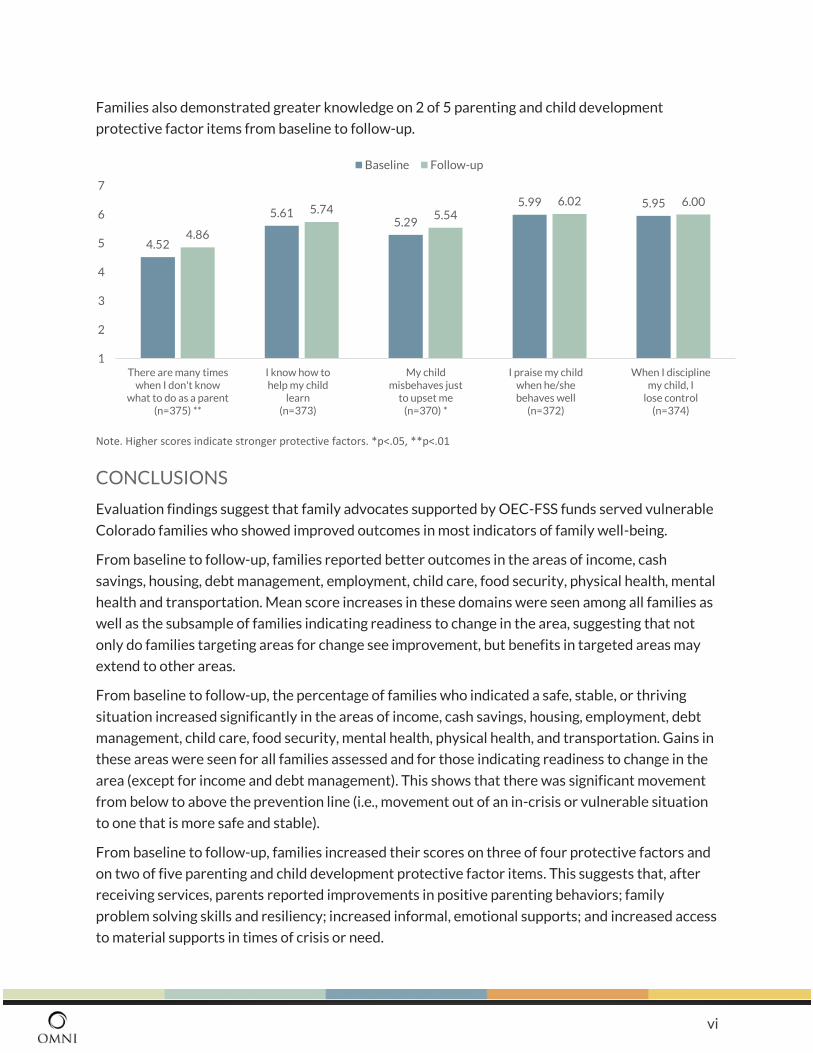
Families also demonstrated greater knowledge on 2 of 5 parenting and child development
protective factor items from baseline to follow-up.
Note. Higher scores indicate stronger protective factors. *p<.05, **p<.01
CONCLUSIONS
Evaluation findings suggest that family advocates supported by OEC-FSS funds served vulnerable
Colorado families who showed improved outcomes in most indicators of family well-being.
From baseline to follow-up, families reported better outcomes in the areas of income, cash
savings, housing, debt management, employment, child care, food security, physical health, mental
health and transportation. Mean score increases in these domains were seen among all families as
well as the subsample of families indicating readiness to change in the area, suggesting that not
only do families targeting areas for change see improvement, but benefits in targeted areas may
extend to other areas.
From baseline to follow-up, the percentage of families who indicated a safe, stable, or thriving
situation increased significantly in the areas of income, cash savings, housing, employment, debt
management, child care, food security, mental health, physical health, and transportation. Gains in
these areas were seen for all families assessed and for those indicating readiness to change in the
area (except for income and debt management). This shows that there was significant movement
from below to above the prevention line (i.e., movement out of an in-crisis or vulnerable situation
to one that is more safe and stable).
From baseline to follow-up, families increased their scores on three of four protective factors and
on two of five parenting and child development protective factor items. This suggests that, after
receiving services, parents reported improvements in positive parenting behaviors; family
problem solving skills and resiliency; increased informal, emotional supports; and increased access
to material supports in times of crisis or need.
4.52
5.615.29
5.99 5.95
4.86
5.74 5.546.02 6.00
1
2
3
4
5
6
7
There are many timeswhen I don't know
what to do as a parent(n=375) **
I know how tohelp my child
learn(n=373)
My childmisbehaves just
to upset me(n=370) *
I praise my childwhen he/shebehaves well
(n=372)
When I disciplinemy child, I
lose control(n=374)
Baseline Follow-up
1
Introduction The Colorado General Assembly established family resource centers (FRCs) in 1993 as a five-year
pilot project, a public-private initiative, to establish FRCs in local communities to serve as a “single
point of entry for providing comprehensive, intensive, integrated, and collaborative community-
based services for vulnerable families, individuals, children, and youth.”
In 1998, after the pilot initiative concluded, the Family Resource Center Association (FRCA) was
established as a strategic statewide network for Family Resource Center advocacy and funding.
Since that time, FRCA has worked to improve systems, capacity, and outcomes for family support
and Colorado FRCs. Providing public advocacy, capacity building, and resource development to
strengthen its statewide network of FRCs, the FRCA’s vision is for a Colorado in which every
family is thriving and self-sufficient. Today, headquartered in Denver,
FRCA supports 30 Family Resource Center members that
collectively serve 45 of the 64 Colorado counties. The FRCs
continue to meet the original statutory requirement by
providing multiple services and supports to families through a
philosophy of strengths-based family development services.
Using a collective impact model (see Appendix C), FRCA strengthens and expands Colorado FRCs
through program fidelity standards; program quality monitoring; outcome measurement and
reporting; state and national level advocacy; resource development; and organizational technical
assistance and trainings, including capacity building for all its members. This includes promoting a
common agenda; continuous communication within and outside of its network to break down silos
and share best practices; shared database and measurement systems; and fostering collaboration
and system-level supports and strategies for partnerships across public, private and nonprofit
sectors.
One of the primary goals of FRCA is to support its members to provide effective family support
services through program implementation and evaluation support, including advanced analysis of
family support data that is tracked in a common data system. In 2015, FRCA, in collaboration with
its evaluation partner, OMNI Institute (OMNI), made significant advancements in its family
development service model and evaluation efforts by 1) further defining Colorado’s approach to
family services through implementation of Colorado FRCs – Family Pathways (Family Pathways)
and 2) strengthening the rigor of its outcome evaluation through a collaborative process to revise
and test its primary assessment tool, the Colorado Family Support Assessment, Version 2.0 (CFSA
2.0). A reliability study of the revised assessment confirmed that the CFSA 2.0 is highly reliable.
2
The study was published in the journal Research on Social Work Practice in July 2015 (Richmond,
Pampel, Zarcula, Howey & McChesney, 2015; see below for more information on The CFSA 2.0).
In 2016, FRCA began two initiatives to further define the family development service model and
support its implementation with fidelity across its network members. The first initiative is to
follow the National Implementation Research Network’s Implementation Science Framework to
guide the development of Intermediary- and Practice-Level Implementation Drivers. An aggregate
assessment of center-level fidelity by FRCA indicates that for the majority of indicators, data-
entry practice aligns with FRCA guidance regarding the Family Pathways Framework. Goal setting
with each family on their specific areas of indicated change and the data-entry of goal progress are
areas needing additional implementation support for the 2018-19 year. All centers are finalizing
their respective implementation plans, which will guide their implementation focus this year.
Second, a partnership was forged with the Center on the Developing Child at Harvard University
and the University of Oregon to integrate their Frontiers of Innovation’s (FOI) rapid-cycle learning
to test for effective intermediary- and practice-level strategies that improve long-term family and
child outcomes through caregiver support and engagement. FRCA is interested in understanding
which families engage in more intensive family development services and which families do not,
and why, as well as which families engage at baseline but not at follow-up intervals, and why. At
the one-year point of this initiative, the project completed pilot testing family engagement
strategies through the Rapid-cycle Learning Cohort #1 using five data collectors at three centers.
Part of rapid-cycle learning is to apply lessons learned to future decision making. Lessons learned
from FRCA’s FOI Cohort #1 included:
• Perceptions that help is not needed, time commitment to engage in services, and lack of
correct service matching to family needs were common reasons identified for why families
opt out of deeper engagement in service delivery;
• Motivational Interviewing strategies, a core component of FRCA’s model of family
development service delivery, facilitated the development of trusted relationships with
families; and
• Family progress in self-sufficiency appeared unrelated to parent/caregivers’ level of
executive functioning and past adverse childhood experiences, suggesting that services
similarly help those with high and low levels of executive functioning and those who have
and have not experienced multiple traumas during childhood
Additional rapid-cycle testing will continue through 2018 and progress on this initiative, as well as
FRCA’s work assessing intermediary and practice-level implementation can be found at
www.cofamilycenters.org.
In March 2016, ten Family Resource Center organizations received initial-year, pass-through
funds from the Colorado Department of Human Services, Office of Early Childhood (OEC) for
Family Support Services (FSS) “to increase the number of families receiving coordinated case
management services and to increase commitment to quality practice.” These grantees continue
3
to be funded via State General funds to provide family development services to vulnerable
Colorado families. In this report, we present evaluation findings for the funding period of July 1,
2017 through June 30, 2018 for nine of the 10 OEC-FSS grantees.8
The purpose of this evaluation report is to present information on:
• Families served by FRCs through the Family Pathways, including their demographic
characteristics and services received; and
• Family outcomes following family development services, including gains in areas vital for safe,
stable and thriving families and that protect children from child abuse and neglect.
Before presenting evaluation findings, we briefly describe key features of FRCs in Colorado. First,
as promoted by the National Network of Family Support, Colorado FRCs follow the Standards of
Quality for Family Strengthening and Support9 to ensure demonstration of high-quality, family-
support practices that are aligned with the Principals of Family Support and the Center for the
Study of Social Policy’s Strengthening Families Protective Factors Framework.10 Second, Colorado
FRCs follow the Family Pathways Framework, which outlines three distinct paths of support and
associated assessments and data tracking. The Family Pathways Framework is designed to
promote responsive service delivery that is appropriately tied to evaluation efforts. Third,
Colorado FRCs implement core components of family development service provision that is
aligned with the Family Pathways Framework to ensure best practices are followed consistently
across centers. Fourth, Colorado FRCs use a common family assessment to track family progress
and outcomes, the Colorado Family Support Assessment, Version 2.0 (CFSA 2.0). Finally, FRCA
provides a training model to support FRCs in strong implementation. Each of these areas is briefly
outlined below. For more information on any component, please contact FRCA.
STANDARDS OF QUALITY
FRCs provide family-centered services that are strengths-based; coordinated to meet families’
unique needs; and focused on prevention and long-term growth. FRCs serve diverse populations;
are family-friendly and inclusive; develop strong collaborative relationships between families and
staff; and involve peers, neighbors and community members in service provision (Pampel & OMNI
Institute, 2013). FRCs create environments that offer family-friendly, family-centered, and
culturally diverse programs and services. To ensure strong practice, Colorado FRCA-member
FRCs follow the Standards of Quality for Family Strengthening and Support. There are 17
standards, with minimum and high-quality indicators, grouped into five areas of practice as
described in the Quality Standards:
8 One Center’s data was excluded due to data quality concerns, which have since been addressed. 9 https://nationalfamilysupportnetwork.org/standards/ 10 http://www.cssp.org/reform/strengtheningfamilies
4
• Family Centeredness - Working with a family-centered approach that values and
recognizes families as integral to the Program;
• Family Strengthening - Utilizing a family strengthening approach to support families to be
strong, healthy, and safe, thereby promoting their optimal development;
• Embracing Diversity - Acknowledging and respecting families’ diversity, supporting their
participation in a diverse society, as well as engaging in ongoing learning and adaptation to
diversity;
• Community Building - Contributing to building a strong and healthy community by
facilitating families’ social connections, developing their leadership skills, and by
collaborating with other Programs; and
• Evaluation - Looking at areas of Program strength, as well as areas for further
development, in order to guide continuous quality improvement and achieve positive
results for families.
Family surveys and program and staff assessments are used to measure quality of services; results
from assessments are used to improve program strategies and service delivery.
FAMILY PATHWAYS FRAMEWORK
In Colorado, FRCs also follow the Colorado Family Pathways Framework to guide family service
provision and consistent tracking of information. The Family Pathways outlines three primary
paths through which families receive services from FRCs, each with increasing intensity of service
provision and required data tracking. Figure 1 provides a visual of the three paths and is followed
by a brief description of each path. For more information on Family Pathways, please contact
FRCA.
5
Family Pathways
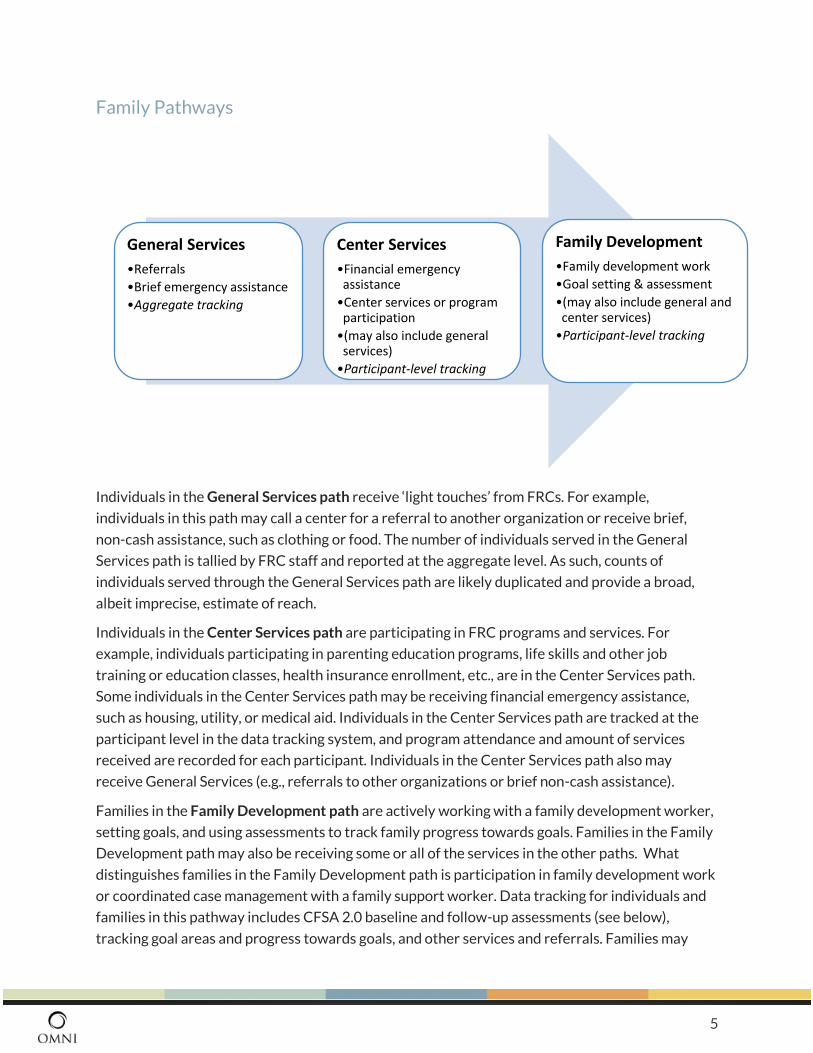
Individuals in the General Services path receive ‘light touches’ from FRCs. For example,
individuals in this path may call a center for a referral to another organization or receive brief,
non-cash assistance, such as clothing or food. The number of individuals served in the General
Services path is tallied by FRC staff and reported at the aggregate level. As such, counts of
individuals served through the General Services path are likely duplicated and provide a broad,
albeit imprecise, estimate of reach.
Individuals in the Center Services path are participating in FRC programs and services. For
example, individuals participating in parenting education programs, life skills and other job
training or education classes, health insurance enrollment, etc., are in the Center Services path.
Some individuals in the Center Services path may be receiving financial emergency assistance,
such as housing, utility, or medical aid. Individuals in the Center Services path are tracked at the
participant level in the data tracking system, and program attendance and amount of services
received are recorded for each participant. Individuals in the Center Services path also may
receive General Services (e.g., referrals to other organizations or brief non-cash assistance).
Families in the Family Development path are actively working with a family development worker,
setting goals, and using assessments to track family progress towards goals. Families in the Family
Development path may also be receiving some or all of the services in the other paths. What
distinguishes families in the Family Development path is participation in family development work
or coordinated case management with a family support worker. Data tracking for individuals and
families in this pathway includes CFSA 2.0 baseline and follow-up assessments (see below),
tracking goal areas and progress towards goals, and other services and referrals. Families may
General Services
•Referrals
•Brief emergency assistance
•Aggregate tracking
Center Services
•Financial emergency assistance
•Center services or program participation
•(may also include general services)
•Participant-level tracking
Family Development
•Family development work
•Goal setting & assessment
•(may also include general and center services)
•Participant-level tracking
6
begin services in this path or they may enter this path after receiving assistance or services in the
General or Center Services paths.
FAMILY DEVELOPMENT CORE SERVICE COMPONENTS
Colorado FRCs apply the following core components when providing family development services.
Common screening at FRC-entry: Colorado FRCs implement a brief screening to identify family
needs during initial contact. The tool asks yes/no questions about a family’s current situation (e.g.,
Do you have stable housing?). It also includes a question about family interest in speaking with
someone to learn more about family support services. Responses are used to help staff quickly
understand the level of family need; direct families to needed services; and identify families who
may be ready to set goals and benefit from meeting with a family development worker.
Concrete/emergency services to meet immediate needs: Colorado FRCs provide referrals and
basic services to meet families’ immediate needs. FRCs play a crucial role in ensuring that families
have access to resources and financial supports for which they are eligible and that can help them
in times of crisis and beyond. Programs that provide financial and in-kind support are critical to
support fragile families (Kalil & Ryan, 2010) and have been linked to improved child health and
wellbeing (Berger & Font, 2015).
Assessment, goal setting, and matching services to families: Family development workers
administer a comprehensive family assessment to identify family strengths and needs to set
family-driven goals. FRCs use the CFSA 2.0 tool, which includes objective indicators of family well-
being in 14 areas; an assessment of family protective factors based on the Strengthening Families
Protective Factors Framework,11 and family readiness to change (for more information on the
CFSA 2.0, please see below). As part of the process, families create and set SMART goals – goals
that are specific, measurable, attainable, realistic and time-based. SMART goals lead to the
identification of referral or direct service delivery opportunities that meet families’ unique, and
often complex, needs, and are tied to specific family goals. “Right matching of services” is
considered one of the six indicators of quality in case management practices seeking to end
homelessness, and includes the use of “consistent and relevant” assessments (Milaney, 2012). FRC
staff use motivational interviewing, an effective strategy to change behavior (Hettema, Steele, &
Miller, 2005; Ruback et al., 2005), to initiate strength-based relationships that facilitate trust and
elicit readiness to set goals that address priorities identified through the interview. Programs that
include client-choice and personal goal-setting; ongoing, motivational meetings with program
staff; and services and referrals can lead to increased self-sufficiency and improved outcomes
(Dunst et al., 2007; Martin, Wu, Wolff, Colantonio, & Grady, 2013).
Follow-up and Evaluation (required within 30-90 days and approximately every 90 days
thereafter): For clients with identified need, FRC staff provide ongoing family-goal meetings to
11 http://www.cssp.org/reform/strengtheningfamilies/about
7
assess goal progress, identify and address barriers to goal progress, affirm strengths and set new
goals based on family readiness to change.
COLORADO FAMILY SUPPORT ASSESSMENT, V. 2.0 The CFSA 2.0 is a family-level index of family functioning used by FRCA-member FRCs.12 Its
purpose is to obtain an objective assessment of family well-being in multiple areas. Family
development workers administer the tool using an interview format to identify family strengths
and areas for growth and change. Development of the CFSA 2.0 involved reviewing the research
literature and other publicly available self-sufficiency outcome matrices; obtaining feedback from
FRC staff on strengths and challenges with the prior version of the CFSA; utilizing national
organizations’ materials to help guide definitions in certain categories (e.g., USDA definitions of
food security); and a vetting and collaborative review process with FRC Directors, family
advocates, and other family support stakeholders.
The CFSA 2.0 includes the following three sections:
• Part A, the domain matrix, assesses family stability in 14 categories critical to family self-
reliance (income, employment, housing, transportation, food security, child care, child
education, adult education, cash savings, debt management, health coverage, physical
health, mental health, and substance abuse). Each domain is rated on a scale of 1 to 5 using
domain-specific indicators. OMNI led a study examining the consistency of family support
workers’ ratings on the tool and each domain was determined to have high interrater
reliability (Richmond, Pampel, Zarcula, Howey, & McChesney, 2015). Furthermore, in
spring 2017, OMNI conducted a multiple domain analysis examining the factor structure of
the tool. Using confirmatory factor analytic techniques, a two-factor structure was
identified: 1) Economic Self-Sufficiency is comprised of the income, employment, housing,
transportation, food security, adult education, cash savings, and health coverage domains;
and 2) Health is comprised of physical health and mental health domains. Three domains,
debt management, child education, and child care, did not consistently load onto a factor
and are thus analyzed separately. The substance abuse domain displayed very little
variability; 88% of participants with valid responses indicated the highest level of
functioning (i.e., a score of 5). This indicates that the domain is not meaningfully
differentiating between respondents, and therefore the substance use domain was
excluded from analyses due to insufficient variability in responses across families. As a
result, factor analyses were conducted with a maximum of 13 (rather than 14) domains. A
full report of the findings is included in Appendix D.
• Part B, the Protective Factors Survey (PFS), assesses five factors that protect against child
abuse and neglect (Family Functioning/Resiliency, Social Support, Concrete Support,
12 For more information on or permission to use the CFSA 2.0, please contact FRCA at [email protected].
8
Nurturing and Attachment, and child development/knowledge of parenting). The PFS is a
product of the FRIENDS Network in collaboration with the University of Kansas Institute
for Educational Research and Public Service. The instrument was developed with the
advice and assistance of researchers, administrators, workers, and experts specializing in
family support and maltreatment and psychological measurement. The survey has
undergone three national field tests. Content validity, construct validity, and criterion
validity were also examined and provide evidence that the PFS is a valid measure of
multiple protective factors against child maltreatment (Counts, Buffington, Chang-Rios,
Rasmussen, & Preacher, 2010).
• Part C, family readiness to change, assesses areas in which families would like to change
and how ready, on a scale of 1 to 10, they are to make a change in the identified areas.
Specifically, families are asked to identify the areas in which they would MOST like to make
a change (ideally no more than three or four) and then rate each selected area on a scale of
1 to 10, with 1 indicating ‘not at all ready’ and 10 indicating ‘extremely ready’
The CFSA 2.0 is typically administered within the first two weeks of working with a family
(baseline assessment) and at three to six month intervals thereafter (follow-up assessments). FRC
staff began administering the CFSA 2.0 in July 2015.
FRCA TRAINING MODEL FRCA offers an interactive, in-person family-development training package that includes the
following trainings:
• Quality Standards for Family Strengthening and Support Programs (8 hrs),
• Motivational Interviewing Skills (12 hrs) and
• CFSA 2.0 (4 hrs).
These trainings are the minimum required to ensure consistent implementation of the core
components of family development work. A brief description of each training is provided below.
The Quality Standards training covers the outreach and initial engagement core component by
training from the family support principles, one of the pillars of FRCA’s foundation. Motivational
Interviewing (MI) skills training covers the research behind MI, introduction and role-play
practice of the MI skills, and practice support exercises. MI training covers the core components
of change focused intervention. CFSA 2.0 training has four modules for FRC direct service staff: 1)
Creation and administration of the assessment; 2) Domain scoring (Part A); 3) Protective Factor
Survey (Part B) and Readiness to Change (Part C); and 4) Family Pathways document. CFSA 2.0
modules 1, 2, and 3 provide training on these core components: assessment and case planning and
case plan evaluation/follow-up. The Pathways training is an encompassed module within the CFSA
2.0 training. The module covers: 1) the history of the Family Pathways (FP) document including
rationale for its creation; 2) logistics of the document and an in-depth explanation of the columns
(three distinct pathways) and rows (administration guidelines); and 3) provides training on
9
assessment tools (FRCA Common Demographics & Screening Form, Participant Survey)
referenced within. The module provides training on these core components: common screening
tool, concrete/emergency services, and service matching/supportive services. Ongoing, bi-
monthly coaching sessions are available to support reliable administration of the CFSA 2.0.
Evaluation Methods Staff at FRCs enter data into a centralized data system, Efforts to Outcomes (ETO™), developed by
Social Solutions, Inc. and managed by OMNI Institute. The system was configured for FRCA to
track data on screenings, services, goal-setting, and referrals consistently across member FRCs. In
addition, FRCs are able to pull data reports on the individuals and families that they serve.
Data were extracted from ETO for individuals and families that engaged with a FSS family support
worker, as evidenced by:
• Having completed a Program Enrollment TouchPoint during the reporting period,
indicating enrollment in FSS program service delivery.13
• Having completed a CFSA 2.0 baseline or follow-up assessment between 07/01/2016-
06/30/2017.
Only individuals and families who provide consent to have their data entered into ETO are
included in the evaluation.
PATHWAY DETERMINATION
The Family Pathways outlines the level of services families are receiving and associated data
tracking requirements. As noted above, FRCs enter aggregate-level information for individuals in
the General Services path. As such, the evaluation cannot report on unduplicated numbers of
families who received very brief non-cash emergency assistance (e.g., clothing), were quickly
referred to another program, or attended an outreach event such as an early childhood screening.
However, the evaluation has rich data on individuals and families who received services through
the Center Services and Family Development path, as FRCs enter participant-level information on
these families. The indicator to determine whether a family was served through the Family
Development path is administration of the CFSA 2.0 as it signals that an interview between a
family support worker and a family occurred, and that the conversation included assessment,
readiness to change, and goal setting.
13 OMNI provided FRCA with a list of the family members with a CFSA 2.0 attached to their record from the OEC-FSS- funded centers. FRCA contacted centers to identify which families had been served by FSS-supported family advocates.
10
Families who received at least one CFSA 2.0 during the year
were in the Family Development path. These families received
assessment, family support, and goal setting services.
Families are determined to be in the Family Development path when they were administered a
CFSA 2.0 baseline or follow-up assessment in the past fiscal year.
DATA PREPARATION In early 2017, to increase data quality, OMNI added an ‘audit’ tab to each report in the ETO data
system. Each audit tab provides information on missing data and identifies possible
inconsistencies or inaccuracies in the data, such as head of households under 18 years of age;
participants with very similar names and birthdates; missing demographic information; etc. Each
FRC has been tasked to check their data audit tabs at least quarterly to correct any errors. This
process provides ongoing review of data and helps to ensure the data are of the highest quality
possible.
MISSING DATA
In some instances, values were incorrectly entered and these were recoded as missing (e.g.,
birthdates that occurred after program entry or such that the individual would be over 105 years
of age; very large family sizes [greater than 35]. The sample sizes with valid data are noted
throughout the report using the notation n=sample size. Percentages are calculated using the
valid percent, excluding all missing data.
CFSA 2.0 Data Preparation and Scale Scores
CFSA 2.0 scores for each category are coded 1 to 5, with higher scores indicating higher levels of
well-being and generally align with the following classifications: 1=in crisis, 2=vulnerable, 3=safe,
4=stable, and 5=thriving. Scores of 1 or 2 indicate that the family is in crisis or is vulnerable with
respect to well-being in the area. Specifically, the tool indicates a ‘prevention line’ between a score
of 2 and 3 on each domain to delineate the transition from vulnerability to a safer situation (see
Appendix C for the specific indicators for each level by domain). Thus, for each domain, in addition
to examining mean scores using the 1 to 5 scaling, we also examine the percentage of families that
score below and above the prevention line, and movement across this line.
For each domain, staff are allowed the response option ‘NI – Not enough information’, for instances
in which there was insufficient time or ability to gather the necessary information to score the
indicator. Across all responses and all domains, only 3.5% of items were coded as NI. Three
domains, Employment, Child Care, and Child Education, also include a ‘NA – Not applicable’ response
option for instances in which the domain does not apply to the family (e.g., the family does not
11
have a child in the appropriate age range). Items coded as NI or NA were excluded from analyses
and only items with valid scores (i.e., a score of 1 through 5) are included.
As mentioned above and described in detail in Appendix D a multi-domain analysis identified a
two-factor structure of Part A of the CFSA 2.0. To create the Economic Self-Sufficiency Scale, the
mean of the following items was calculated: income, employment, housing, transportation, food
security, adult education, cash savings, and health coverage. To be included in the scale, at least 6
items had to have a valid score. To create the Health Scale, the mean of physical health and mental
health was calculated. To be included in the scale, at least one of the two domains had to have a
valid score.
For the PFS, OMNI followed the scoring guidelines in the PFS User Manual14 to develop scales for
each area, except for knowledge of parenting/child development, for which the developers
recommend examination at the item level.
Data Considerations
The following should be taken into consideration when interpreting the findings presented in this
report.
• The number of families served varies by center. As such, results may be weighted towards
those centers with greater numbers of families served and assessed.
• Some centers have developed customized touchpoints to track services that are unique to
their centers. When extracting data from ETO, we included only those individuals who
received services tracked through touchpoints that are common to all centers. Thus, the
numbers of individuals served by centers is likely higher than what is reported here.
• In this report, we report on the number of families served through FSS funding using
information from the individual to whom the CFSA 2.0 was attached. As such, all data
reflects the number of families served rather than individuals.15
• All families in this report received a CFSA 2.0 and are thus receiving services consistent
with the Family Development path.
• When reporting changes over time in family outcomes, when appropriate, we calculate the
statistical significance by finding the probability-value (p-value). The p-value is the
probability that the difference in scores is due to chance rather than a “real” difference.
When a p-value equals less than .05, there is less than a 5% chance that the difference
between the participant mean scores from baseline to follow-up, for example, is due to
chance. Lower p-values increase confidence that the observed difference is real, but p-
values do not provide information on the strength or magnitude of the difference. In
14 http://friendsnrc.org/jdownloads/attachments/pfs_user_manual_revised_2012.pdf 15 The one exception is services received. All members of the family are included in the services received numbers.
12
addition, the larger the sample size, the more likely a small effect will be statistically
significant.
Results Results are organized into two sections. The first section presents information on the
characteristics of families served and the services that they received, and includes the following
components:
• Demographic characteristics.
• Results of the screening survey.
• Services received from FRCs.
In the second section, we focus on family strengths and needs, readiness to change, and progress
towards family well-being as assessed on the CFSA 2.0. We focus on outcomes in two areas:
• Economic Self-Sufficiency, as measured by the CFSA 2.0 Domain Matrix.
• Child Abuse Prevention, as measured by the Protective Factors Survey.
SECTION 1. FAMILY CHARACTERISTICS
This section provides results of the following evaluation questions:
• How many families were served through the Family Development path?
• What are their demographic characteristics?
• What was the level of need at FRC entry?
• How many and what types of services did individuals receive?
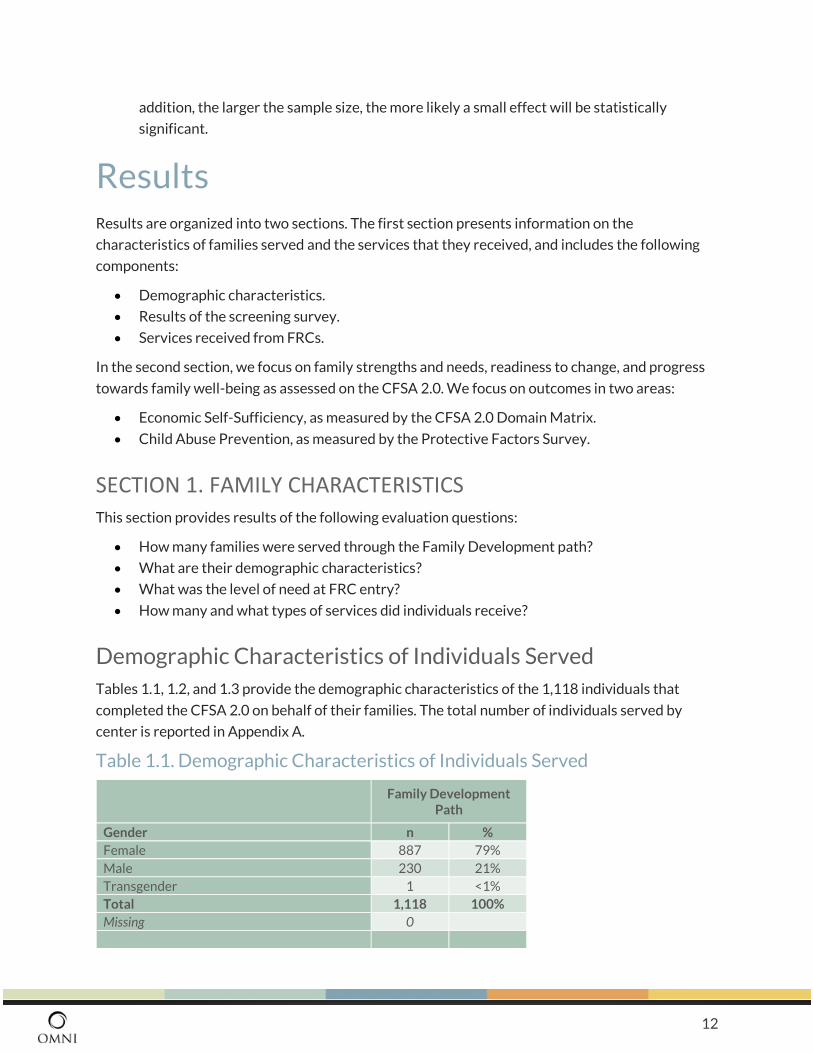
Demographic Characteristics of Individuals Served
Tables 1.1, 1.2, and 1.3 provide the demographic characteristics of the 1,118 individuals that
completed the CFSA 2.0 on behalf of their families. The total number of individuals served by
center is reported in Appendix A.
Table 1.1. Demographic Characteristics of Individuals Served
Family Development
Path
Gender n %
Female 887 79%
Male 230 21%
Transgender 1 <1%
Total 1,118 100%
Missing 0
13
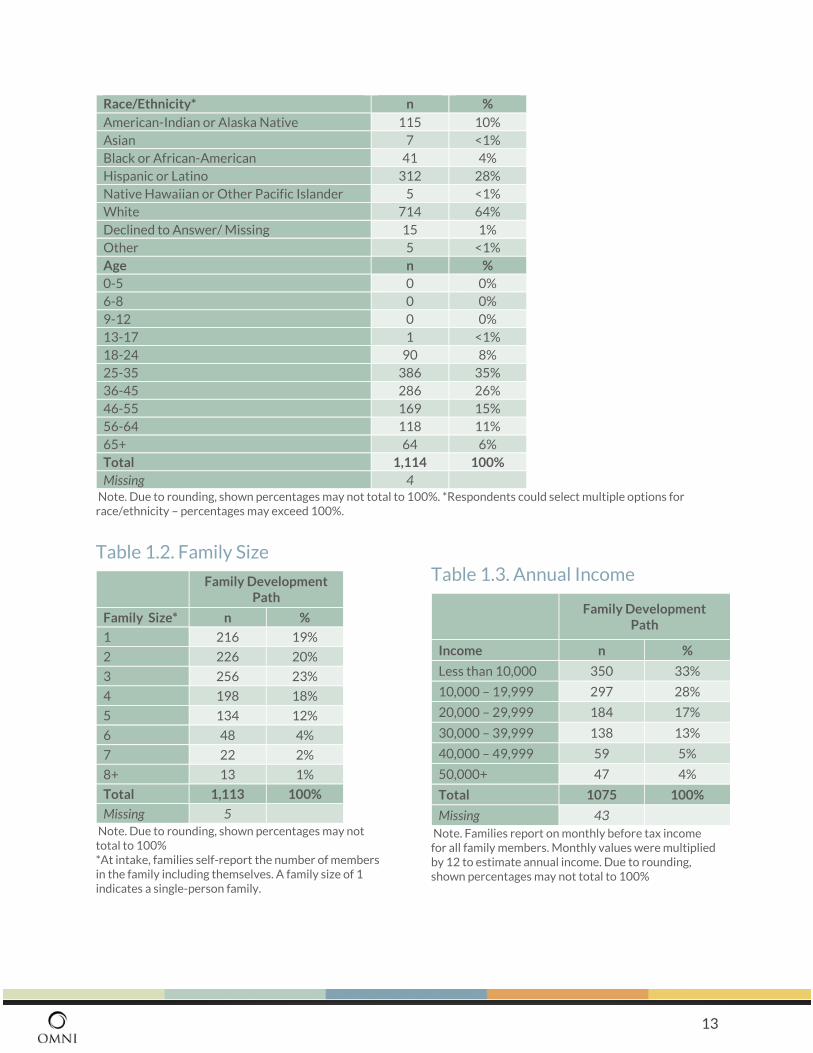
Race/Ethnicity* n %
American-Indian or Alaska Native 115 10%
Asian 7 <1%
Black or African-American 41 4%
Hispanic or Latino 312 28%
Native Hawaiian or Other Pacific Islander 5 <1%
White 714 64%
Declined to Answer/ Missing 15 1%
Other 5 <1%
Age n %
0-5 0 0%
6-8 0 0%
9-12 0 0%
13-17 1 <1%
18-24 90 8%
25-35 386 35%
36-45 286 26%
46-55 169 15%
56-64 118 11%
65+ 64 6%
Total 1,114 100%
Missing 4 Note. Due to rounding, shown percentages may not total to 100%. *Respondents could select multiple options for race/ethnicity – percentages may exceed 100%.
Table 1.2. Family Size
Family Development Path
Family Size* n %
1 216 19%
2 226 20%
3 256 23%
4 198 18%
5 134 12%
6 48 4%
7 22 2%
8+ 13 1%
Total 1,113 100%
Missing 5
Note. Due to rounding, shown percentages may not total to 100% *At intake, families self-report the number of members in the family including themselves. A family size of 1 indicates a single-person family.
Table 1.3. Annual Income
Family Development
Path
Income n %
Less than 10,000 350 33%
10,000 – 19,999 297 28%
20,000 – 29,999 184 17%
30,000 – 39,999 138 13%
40,000 – 49,999 59 5%
50,000+ 47 4%
Total 1075 100%
Missing 43
Note. Families report on monthly before tax income for all family members. Monthly values were multiplied by 12 to estimate annual income. Due to rounding, shown percentages may not total to 100%

14
Table 1.4 presents results of family screening questions asked of families at intake. In total, 655 families had a common screening assessment entered into ETO.
Table 1.4. Family Screening Results
Family Development
Path
n %
Are you or is another adult in your household employed full time?
Yes 271 42%
No 374 58%
Total 645 100%
Missing 10
Do you have stable housing?
Yes 421 65%
No 226 35%
Total 647 100%
Missing 8
Are you generally able to get where you need to go using a personal vehicle or public transportation?
Yes 557 86%
No 87 14%
Total 644 100%
Missing 11
Are you able to access enough food to feed yourself and your family?
Yes 359 56%
No 278 44%
Total 637 100%
Missing 18
Have you finished high school or obtained your GED?
Yes 498 78%
No 140 22%
Total 638 100%
Missing 17
Does everyone in your family have health insurance?
Yes 485 76%
No 150 24%
Total 635 100%
Missing 20
15
Family Development
Path
n %
Do you have quality child care, if needed?
Yes 194 57%
No 145 43%
Total 339 100%
N/A 241
Missing 75
Are all of your school-aged children enrolled in school?*
Yes 319 90%
No 34 10%
Total 353 100%
N/A 231
Missing 71
Note. NA indicates that the question did not apply to the family. *10% of respondents indicating ‘No’ to the question on school-aged children are enrolled in school seems high. It is possible that some chose ‘No’ rather than ‘NA’ or that some completing the assessment in the summer may have considered children not enrolled in school. FRCA has replaced this questions with a new question - ‘Are all of your school-aged children (aged 7-16) enrolled in school during the school year?’. Due to rounding, shown percentages may not total to 100%
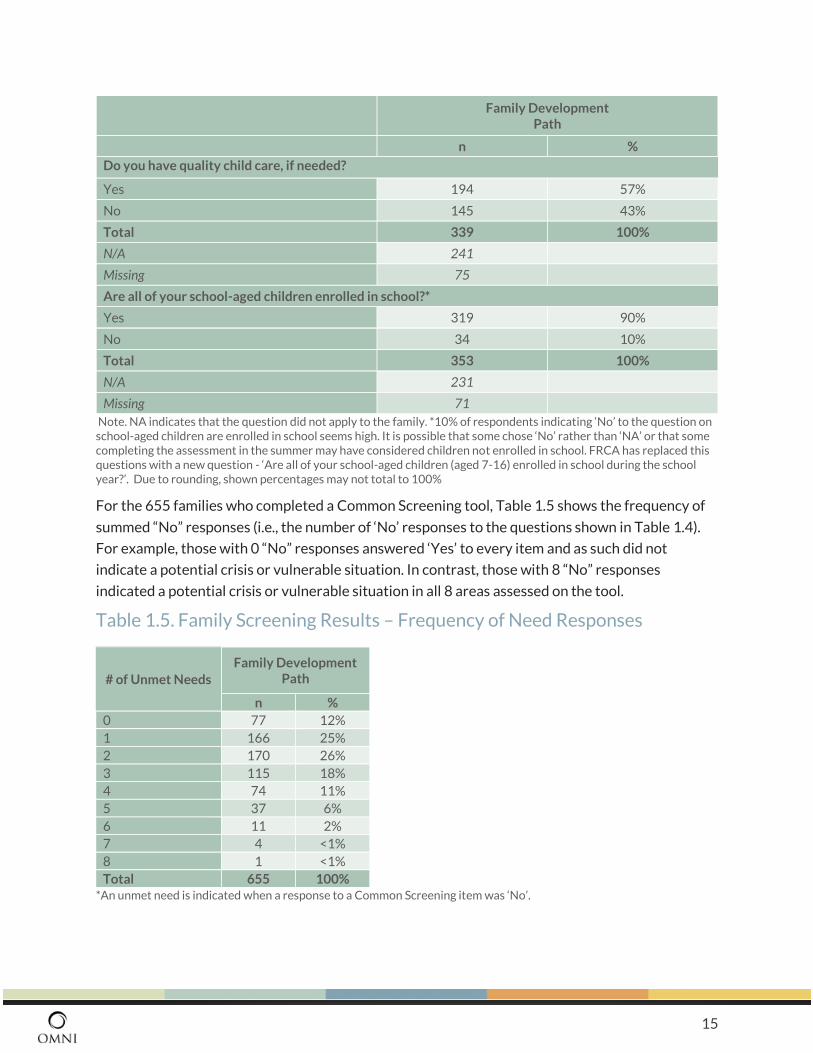
For the 655 families who completed a Common Screening tool, Table 1.5 shows the frequency of
summed “No” responses (i.e., the number of ‘No’ responses to the questions shown in Table 1.4).
For example, those with 0 “No” responses answered ‘Yes’ to every item and as such did not
indicate a potential crisis or vulnerable situation. In contrast, those with 8 “No” responses
indicated a potential crisis or vulnerable situation in all 8 areas assessed on the tool.
Table 1.5. Family Screening Results – Frequency of Need Responses
# of Unmet Needs
Family Development Path
n %
0 77 12%
1 166 25%
2 170 26%
3 115 18%
4 74 11%
5 37 6%
6 11 2%
7 4 <1%
8 1 <1%
Total 655 100% *An unmet need is indicated when a response to a Common Screening item was ‘No’.
16
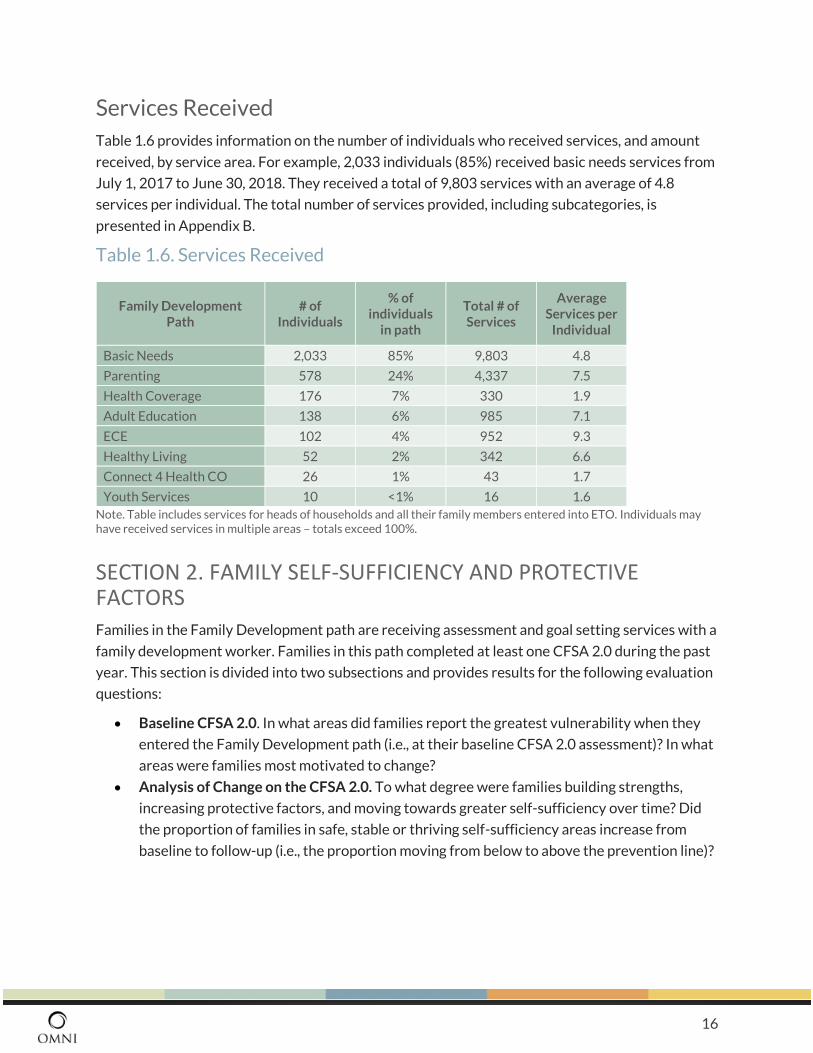
Services Received
Table 1.6 provides information on the number of individuals who received services, and amount
received, by service area. For example, 2,033 individuals (85%) received basic needs services from
July 1, 2017 to June 30, 2018. They received a total of 9,803 services with an average of 4.8
services per individual. The total number of services provided, including subcategories, is
presented in Appendix B.
Table 1.6. Services Received
Family Development Path
# of Individuals
% of individuals
in path
Total # of Services
Average Services per
Individual
Basic Needs 2,033 85% 9,803 4.8
Parenting 578 24% 4,337 7.5
Health Coverage 176 7% 330 1.9
Adult Education 138 6% 985 7.1
ECE 102 4% 952 9.3
Healthy Living 52 2% 342 6.6
Connect 4 Health CO 26 1% 43 1.7
Youth Services 10 <1% 16 1.6
Note. Table includes services for heads of households and all their family members entered into ETO. Individuals may have received services in multiple areas – totals exceed 100%.
SECTION 2. FAMILY SELF-SUFFICIENCY AND PROTECTIVE FACTORS
Families in the Family Development path are receiving assessment and goal setting services with a
family development worker. Families in this path completed at least one CFSA 2.0 during the past
year. This section is divided into two subsections and provides results for the following evaluation
questions:
• Baseline CFSA 2.0. In what areas did families report the greatest vulnerability when they
entered the Family Development path (i.e., at their baseline CFSA 2.0 assessment)? In what
areas were families most motivated to change?
• Analysis of Change on the CFSA 2.0. To what degree were families building strengths,
increasing protective factors, and moving towards greater self-sufficiency over time? Did
the proportion of families in safe, stable or thriving self-sufficiency areas increase from
baseline to follow-up (i.e., the proportion moving from below to above the prevention line)?

17
Baseline CFSA 2.0
FRCs serve parents and guardians as well as individuals and couples in their communities. Of the
1,104 who answered the question about parental status,16 816 (74%) indicated that they were
raising children or expecting a child; the other 288 (26%) were individuals or couples without
children.
PART A: THE DOMAIN MATRIX
In this section, we examine the areas in which families are vulnerable in self-sufficiency at entry
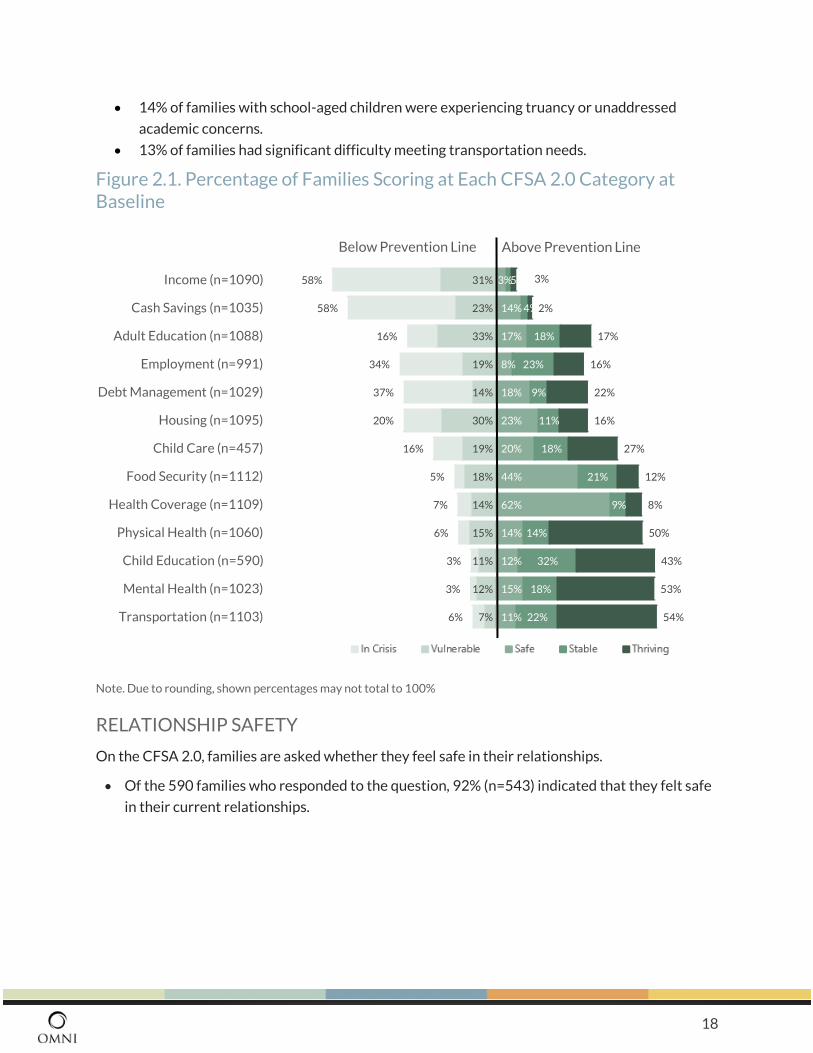
into the Family Development path (i.e., the baseline assessment). Figure 2.1 presents the
percentage of families scoring in each CFSA 2.0 category of the domain matrix at baseline. Data
are sorted according to the domains with the largest percentage of families below a score of 3.
Recall that CFSA 2.0 scores for each category are coded 1 to 5, with higher scores indicating
higher levels of well-being and generally align with the following classifications: 1=in crisis,
2=vulnerable, 3=safe, 4=stable, and 5=thriving.
Scores of 3 or higher indicate a safe, stable or thriving
situation.
See Appendix E for the specific indicators for each level by category.
At baseline, families reported the greatest vulnerability in the areas of income, cash savings,
employment, adult education, housing, and debt management. Sample sizes for each domain can
be seen in Figure 2. Baseline data revealed the following:
• 89% of families had family incomes at or below 200% of the federal poverty level.
• 81% of families had no cash savings.
• In 53% of families, no adult was employed full time.
• 51% of families did not have safe, stable or affordable housing.
• 51% of families had increasing debt.
• In 49% of families, no adult had education beyond high school and none were enrolled in
post-secondary or specialized training.
• 35% of families with young children and in need of child care did not have access to reliable,
affordable and quality care.
• 23% of families had low or very low food security.
• 21% of families were experiencing physical health concerns.
• In 21% of families, not all family members had health insurance or they were underinsured.
• 15% of families were experiencing mental health concerns.
16 Questions on family status were added to ETO after all staff were trained on the CFSA 2.0.
18
• 14% of families with school-aged children were experiencing truancy or unaddressed
academic concerns.
• 13% of families had significant difficulty meeting transportation needs.
Figure 2.1. Percentage of Families Scoring at Each CFSA 2.0 Category at Baseline
Note. Due to rounding, shown percentages may not total to 100%
RELATIONSHIP SAFETY
On the CFSA 2.0, families are asked whether they feel safe in their relationships.
• Of the 590 families who responded to the question, 92% (n=543) indicated that they felt safe
in their current relationships.
31%
23%
33%
19%
14%
30%
19%
18%
14%
15%
11%
12%
7%
58%
58%
16%
34%
37%
20%
16%
5%
7%
6%
3%
3%
6%
5%
14%
17%
8%
18%
23%
20%
44%
62%
14%
12%
15%
11%
3%
4%
18%
23%
9%
11%
18%
21%
9%
14%
32%
18%
22%
3%
2%
17%
16%
22%
16%
27%
12%
8%
50%
43%
53%
54%
Income (n=1090)
Cash Savings (n=1035)
Adult Education (n=1088)
Employment (n=991)
Debt Management (n=1029)
Housing (n=1095)
Child Care (n=457)
Food Security (n=1112)
Health Coverage (n=1109)
Physical Health (n=1060)
Child Education (n=590)
Mental Health (n=1023)
Transportation (n=1103)
Below Prevention Line Above Prevention Line
19
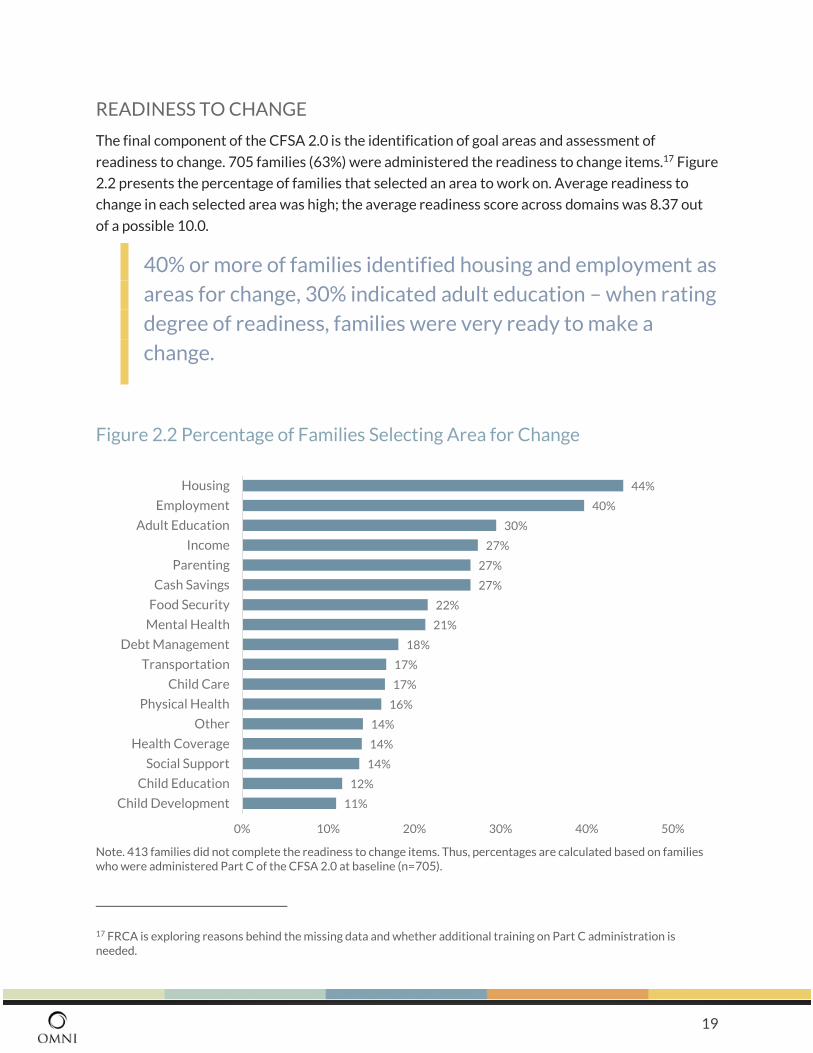
READINESS TO CHANGE
The final component of the CFSA 2.0 is the identification of goal areas and assessment of
readiness to change. 705 families (63%) were administered the readiness to change items.17 Figure
2.2 presents the percentage of families that selected an area to work on. Average readiness to
change in each selected area was high; the average readiness score across domains was 8.37 out
of a possible 10.0.
40% or more of families identified housing and employment as
areas for change, 30% indicated adult education – when rating
degree of readiness, families were very ready to make a
change.
Figure 2.2 Percentage of Families Selecting Area for Change
Note. 413 families did not complete the readiness to change items. Thus, percentages are calculated based on families who were administered Part C of the CFSA 2.0 at baseline (n=705).
17 FRCA is exploring reasons behind the missing data and whether additional training on Part C administration is needed.
11%
12%
14%
14%
14%
16%
17%
17%
18%
21%
22%
27%
27%
27%
30%
40%
44%
0% 10% 20% 30% 40% 50%
Child Development
Child Education
Social Support
Health Coverage
Other
Physical Health
Child Care
Transportation
Debt Management
Mental Health
Food Security
Cash Savings
Parenting
Income
Adult Education
Employment
Housing
20
Analysis of Change on the CFSA 2.0
Prior to examining family progress towards self-sufficiency and increased protective factors, we
describe the number of families with follow-up assessments and when they occurred.
CFSA 2.0 FOLLOW-UP ASSESSMENTS
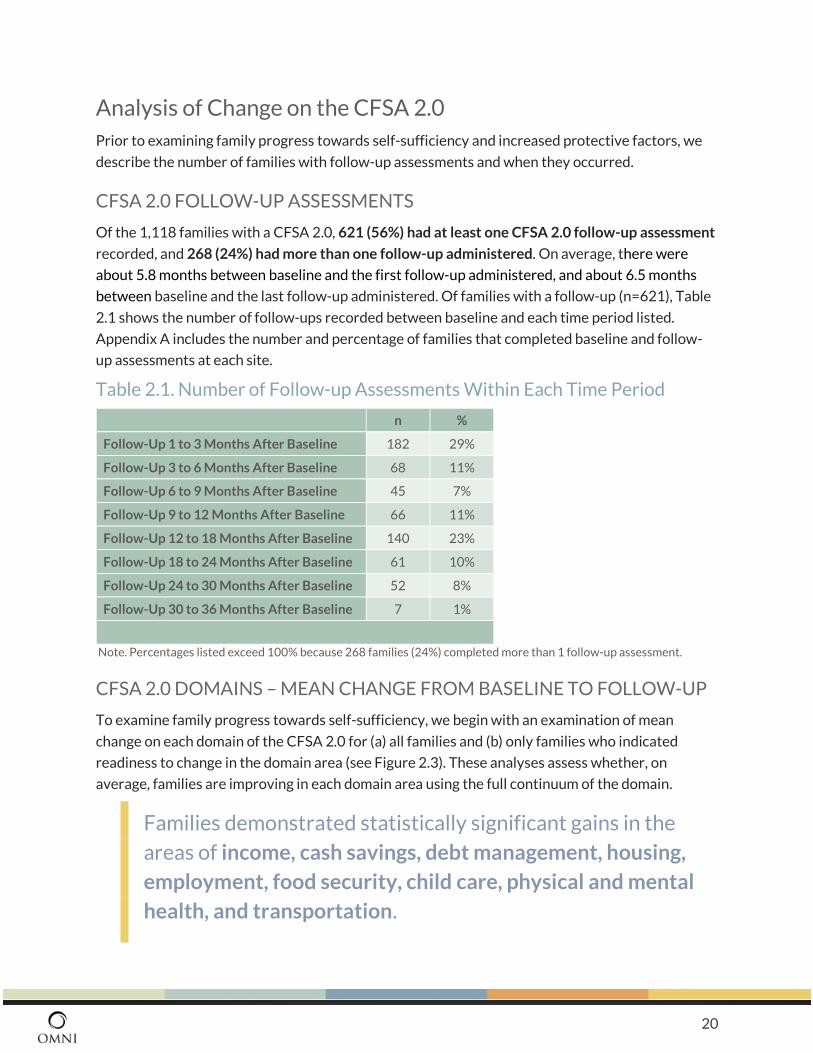
Of the 1,118 families with a CFSA 2.0, 621 (56%) had at least one CFSA 2.0 follow-up assessment
recorded, and 268 (24%) had more than one follow-up administered. On average, there were
about 5.8 months between baseline and the first follow-up administered, and about 6.5 months
between baseline and the last follow-up administered. Of families with a follow-up (n=621), Table
2.1 shows the number of follow-ups recorded between baseline and each time period listed.
Appendix A includes the number and percentage of families that completed baseline and follow-
up assessments at each site.
Table 2.1. Number of Follow-up Assessments Within Each Time Period
n %
Follow-Up 1 to 3 Months After Baseline 182 29%
Follow-Up 3 to 6 Months After Baseline 68 11%
Follow-Up 6 to 9 Months After Baseline 45 7%
Follow-Up 9 to 12 Months After Baseline 66 11%
Follow-Up 12 to 18 Months After Baseline 140 23%
Follow-Up 18 to 24 Months After Baseline 61 10%
Follow-Up 24 to 30 Months After Baseline 52 8%
Follow-Up 30 to 36 Months After Baseline 7 1%
Note. Percentages listed exceed 100% because 268 families (24%) completed more than 1 follow-up assessment.
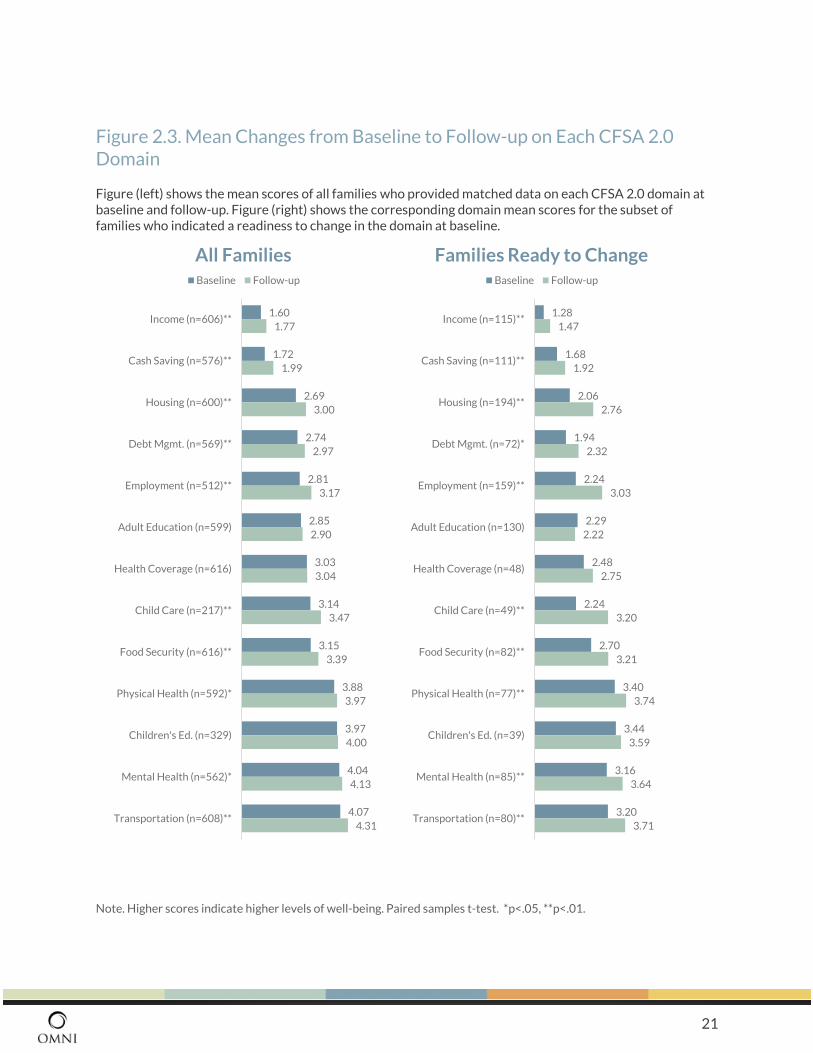
CFSA 2.0 DOMAINS – MEAN CHANGE FROM BASELINE TO FOLLOW-UP
To examine family progress towards self-sufficiency, we begin with an examination of mean
change on each domain of the CFSA 2.0 for (a) all families and (b) only families who indicated
readiness to change in the domain area (see Figure 2.3). These analyses assess whether, on
average, families are improving in each domain area using the full continuum of the domain.
Families demonstrated statistically significant gains in the
areas of income, cash savings, debt management, housing,
employment, food security, child care, physical and mental
health, and transportation.
21
Figure 2.3. Mean Changes from Baseline to Follow-up on Each CFSA 2.0 Domain
Figure (left) shows the mean scores of all families who provided matched data on each CFSA 2.0 domain at baseline and follow-up. Figure (right) shows the corresponding domain mean scores for the subset of families who indicated a readiness to change in the domain at baseline.
Note. Higher scores indicate higher levels of well-being. Paired samples t-test. *p<.05, **p<.01.
1.60
1.72
2.69
2.74
2.81
2.85
3.03
3.14
3.15
3.88
3.97
4.04
4.07
1.77
1.99
3.00
2.97
3.17
2.90
3.04
3.47
3.39
3.97
4.00
4.13
4.31
Income (n=606)**
Cash Saving (n=576)**
Housing (n=600)**
Debt Mgmt. (n=569)**
Employment (n=512)**
Adult Education (n=599)
Health Coverage (n=616)
Child Care (n=217)**
Food Security (n=616)**
Physical Health (n=592)*
Children's Ed. (n=329)
Mental Health (n=562)*
Transportation (n=608)**
All FamiliesBaseline Follow-up
1.28
1.68
2.06
1.94
2.24
2.29
2.48
2.24
2.70
3.40
3.44
3.16
3.20
1.47
1.92
2.76
2.32
3.03
2.22
2.75
3.20
3.21
3.74
3.59
3.64
3.71
Income (n=115)**
Cash Saving (n=111)**
Housing (n=194)**
Debt Mgmt. (n=72)*
Employment (n=159)**
Adult Education (n=130)
Health Coverage (n=48)
Child Care (n=49)**
Food Security (n=82)**
Physical Health (n=77)**
Children's Ed. (n=39)
Mental Health (n=85)**
Transportation (n=80)**
Families Ready to ChangeBaseline Follow-up
22
CFSA 2.0 DOMAINS – MOVEMENT ACROSS THE PREVENTION LINE
The CFSA 2.0 was developed so that each of the domain indicators represent a continuum from ‘in
crisis’ to ‘thriving’, with a prevention line indicated between ‘vulnerable’ (a score of 2) and ‘safe’ (a
score of 3). Scores of 3 or higher indicate that families are in safe, stable or thriving situations.
To assess whether families in the Family Development path showed significant movement over
the prevention line, we examined whether the proportion of families in a safe, stable or thriving
situation in each domain (i.e., scoring 3 or higher, above the Prevention Line) significantly
increased from baseline to the most recent follow-up for (a) all families and (b) only families who
indicated readiness to change in the identified domain.
As shown in Figure 2.4, the proportion of families in a safe, stable or thriving situation was
significantly higher at follow-up than at baseline in cash savings, housing, employment, child care,
food security, physical health, and mental health for all families assessed and for the subset of
families with readiness to change in the area.
After receiving Family Development services, a greater
number of families are above the prevention line in many
domains than when they entered the Family Development
path.
Significant positive movement across the prevention line was not detected for the Adult
Education, Health Coverage, and Children’s Education, suggesting that the movement over the
line in these areas may be more difficult to achieve. Statistically significant improvement in
Income, Debt Management, and Transportation was observed for all families assessed, but not for
those ready to change in the area. In each of these areas, the percentages of families scoring above
the prevention line were higher at follow-up than at baseline, but the reduced sample sizes for
those ready to change in these areas reduced the statistical power of the tests (e.g., only 72
families selected debt management as an area for change).

23
Figure 2.4. Percentage of Families Above Prevention Line at Baseline and Follow-Up
Figure (left) shows the percentages of all families who provided matched data that scored above the prevention line18 at baseline and follow-up. Figure (right) shows the corresponding percentages for a subset of families who indicated a readiness to change in the domain at baseline.
Note. Higher scores indicate higher levels of well-being. Paired samples t-test. *p<.05, **p<.01.
18 Percentage of families scoring a 3 or higher in each domain of the CFSA 2.0.
11%
18%
47%
50%
50%
50%
65%
78%
78%
78%
85%
86%
87%
15%
32%
65%
51%
62%
60%
80%
88%
82%
81%
89%
87%
92%
Income (n=606)**
Cash Savings (n=576)**
Housing (n=600)**
Adult Education (n=599)
Employment (n=512)**
Debt Mgmt. (n=569)**
Child Care (n=217)**
Food Security (n=616)**
Physical Health (n=592)*
Health Coverage (n=616)
Mental Health (n=562)*
Children's Ed. (n=329)
Transportation (n=608)**
All Families
Baseline Follow-up
4%
12%
27%
37%
34%
26%
31%
57%
69%
46%
67%
72%
66%
8%
26%
60%
32%
58%
39%
69%
81%
81%
56%
80%
74%
78%
Income (n=115)
Cash Savings (n=111)**
Housing (n=194)**
Adult Education (n=130)
Employment (n=159)**
Debt Mgmt. (n=72)
Child Care (n=49)**
Food Security (n=82)**
Physical Health (n=77)*
Health Coverage (n=48)
Mental Health (n=85)*
Children's Ed. (n=39)
Transportation (n=80)
Families Ready to Change
Baseline Follow-up
24
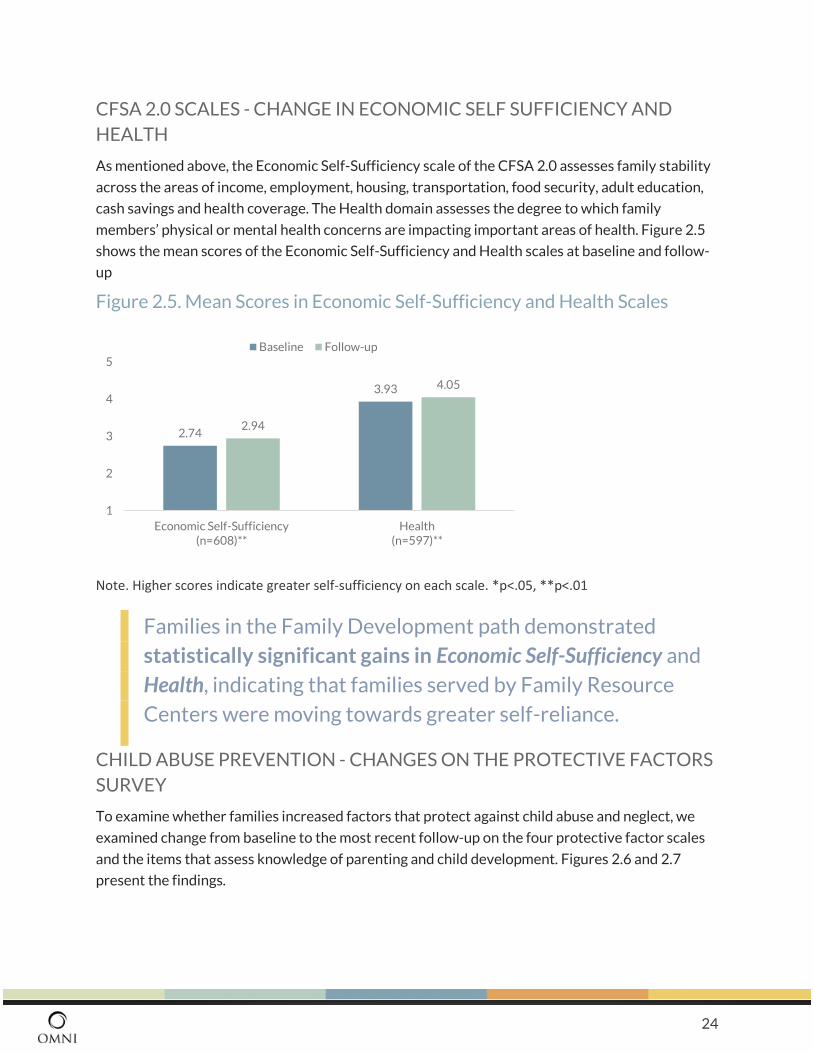
CFSA 2.0 SCALES - CHANGE IN ECONOMIC SELF SUFFICIENCY AND
HEALTH
As mentioned above, the Economic Self-Sufficiency scale of the CFSA 2.0 assesses family stability
across the areas of income, employment, housing, transportation, food security, adult education,
cash savings and health coverage. The Health domain assesses the degree to which family
members’ physical or mental health concerns are impacting important areas of health. Figure 2.5
shows the mean scores of the Economic Self-Sufficiency and Health scales at baseline and follow-
up
Figure 2.5. Mean Scores in Economic Self-Sufficiency and Health Scales
Note. Higher scores indicate greater self-sufficiency on each scale. *p<.05, **p<.01
Families in the Family Development path demonstrated
statistically significant gains in Economic Self-Sufficiency and
Health, indicating that families served by Family Resource
Centers were moving towards greater self-reliance.
CHILD ABUSE PREVENTION - CHANGES ON THE PROTECTIVE FACTORS
SURVEY
To examine whether families increased factors that protect against child abuse and neglect, we
examined change from baseline to the most recent follow-up on the four protective factor scales
and the items that assess knowledge of parenting and child development. Figures 2.6 and 2.7
present the findings.
2.74
3.93
2.94
4.05
1
2
3
4
5
Economic Self-Sufficiency(n=608)**
Health(n=597)**
Baseline Follow-up
25
On average, families reported significant increases in
Concrete Support, Family Functioning/Resiliency, and Social
Support, indicating families were improving in areas that
protect against child abuse and neglect.
Although significant improvement was not observed on the Nurturing/Attachment scale, families
scored high on this scale at both baseline and follow-up, indicating this is a key family strength.
Figure 2.6. Mean Changes from Baseline to Follow-up in Protective Factor Scales
Note. Higher scores indicate stronger protective factors. *p<.05, **p<.01
5.095.34
6.35
5.425.305.56
6.35
5.61
1
2
3
4
5
6
7
Concrete Support(n=388) *
Family Functioning/Resiliency(n=387) **
Nurturing/Attachment
(n=376)
Social Support(n=388) **
Baseline Follow-up

26
On protective factor items, families reported a decrease in not knowing what to do as a parent and
a decrease in reporting that their child misbehaves just to upset them. Recall that all items are
reverse coded in the graph so that higher scores indicate a more positive response.
Figure 2.7. Mean Changes from Baseline to Follow-up in Knowledge of Parenting/Child Development Protective Factor Items
Note. Higher scores indicate stronger protective factors. *p<.05, **p<.01
4.52
5.615.29
5.99 5.95
4.86
5.74 5.546.02 6.00
1
2
3
4
5
6
7
There are many timeswhen I don't know
what to do as a parent(n=375) **
I know how tohelp my child
learn(n=373)
My childmisbehaves just
to upset me(n=370) *
I praise my childwhen he/shebehaves well
(n=372)
When I disciplinemy child, I
lose control(n=374)
Baseline Follow-up
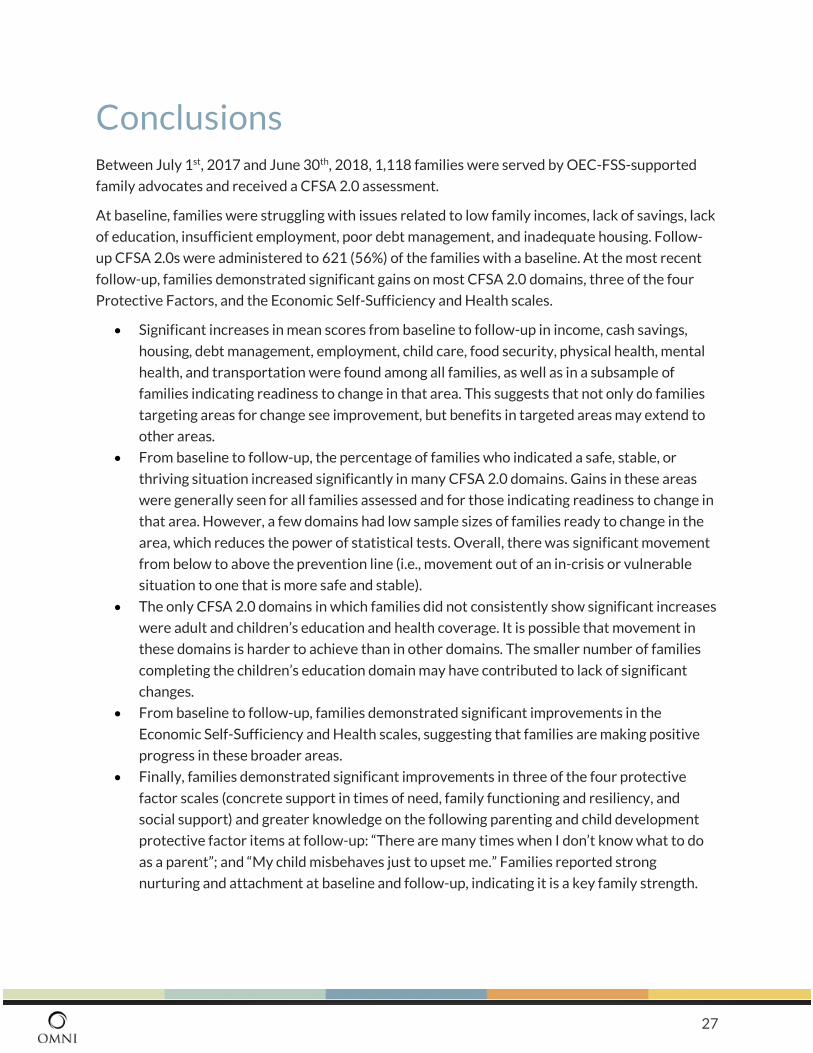
27
Conclusions Between July 1st, 2017 and June 30th, 2018, 1,118 families were served by OEC-FSS-supported
family advocates and received a CFSA 2.0 assessment.
At baseline, families were struggling with issues related to low family incomes, lack of savings, lack
of education, insufficient employment, poor debt management, and inadequate housing. Follow-
up CFSA 2.0s were administered to 621 (56%) of the families with a baseline. At the most recent
follow-up, families demonstrated significant gains on most CFSA 2.0 domains, three of the four
Protective Factors, and the Economic Self-Sufficiency and Health scales.
• Significant increases in mean scores from baseline to follow-up in income, cash savings,
housing, debt management, employment, child care, food security, physical health, mental
health, and transportation were found among all families, as well as in a subsample of
families indicating readiness to change in that area. This suggests that not only do families
targeting areas for change see improvement, but benefits in targeted areas may extend to
other areas.
• From baseline to follow-up, the percentage of families who indicated a safe, stable, or
thriving situation increased significantly in many CFSA 2.0 domains. Gains in these areas
were generally seen for all families assessed and for those indicating readiness to change in
that area. However, a few domains had low sample sizes of families ready to change in the
area, which reduces the power of statistical tests. Overall, there was significant movement
from below to above the prevention line (i.e., movement out of an in-crisis or vulnerable
situation to one that is more safe and stable).
• The only CFSA 2.0 domains in which families did not consistently show significant increases
were adult and children’s education and health coverage. It is possible that movement in
these domains is harder to achieve than in other domains. The smaller number of families
completing the children’s education domain may have contributed to lack of significant
changes.
• From baseline to follow-up, families demonstrated significant improvements in the
Economic Self-Sufficiency and Health scales, suggesting that families are making positive
progress in these broader areas.
• Finally, families demonstrated significant improvements in three of the four protective
factor scales (concrete support in times of need, family functioning and resiliency, and
social support) and greater knowledge on the following parenting and child development
protective factor items at follow-up: “There are many times when I don’t know what to do
as a parent”; and “My child misbehaves just to upset me.” Families reported strong
nurturing and attachment at baseline and follow-up, indicating it is a key family strength.
28
References Berger, L. M., & Font, S. A. (2015). The role of the family and family-centered programs and
policies. Future of Children, 25(1), 155-176. http://www.jstor.org/stable/43267767
Counts, J. M., Buffington, E. S., Chang-Rios, K., Rasmussen, H. N., & Preacher, K. J. (2010). The
development and validation of the protective factors survey: A self-report measure of protective
factors against child maltreatment. Child Abuse & Neglect, 34(10), 762-772.
Dunst, C. J., Trivette, C. M., & Hamby, D. W. (2007). Meta-analysis of family-centered help giving
practices research. Mental Retardation and Developmental Disabilities Research Reviews, 13, 370-
378. DOI: 10.1002/mrdd.20176.
Hemmelgarn, A. L., Glisson, C., & James, L. R. (2006). Organizational culture and climate:
Implications for services and interventions research. Clinical Psychology: Science and Practice, 13,
73-89.
Hetteman, J., Steele, J., & Miller, W. R. (2005). Motivational Interviewing. Annual Review of Clinical
Psychology, 1, 91-111. 10.1146/annurev.clinpsy.1.102803.143833.
Kalil, A., & Ryan, R. M. (2010). Mothers’ economic conditions and sources of support in fragile
families. Future of Children, 20(2), 39-61. http://files.eric.ed.gov/fulltext/EJ901822.pdf
Manning, M., Homel, R., & Smith, C. (2010). A meta-analysis of the effects of early developmental
prevention programs in at-risk populations on non-health outcomes in adolescence. Children and
Youth Services Review, 32, 506-519. Doe:10.1016/j.childyouth.2009.11.003
Martin, K. S., Wu, R., Wolff, M., Colantonio, A G., & Grady, J. (2013). A novel food pantry program:
Food security, self-sufficiency, and diet-quality outcomes. American journal of Preventive Medicine,
45(5), 569-575. http://dx.doi.org/10.1016/j.amepre.2013.06.012
Milaney, K. (2012). The 6 dimensions of promising practice for case managed supports to end
homelessness. Part 2: The 6 dimensions of quality. Professional Case Management, 17(1), 4-12.
Pampel, F., & OMNI Institute. (2013). Key components of Family Resource Centers: A review of the
literature. Report developed for Colorado Family Resource Center Association. Available at
http://www.cofamilycenters.org/about-us/service-delivery-approach/
Richmond, M. K., Pampel, F. C., Zarcula, Z., Howey, V., & McChesney, B. (2015). Reliability of the
Colorado Family Support Assessment: A self-sufficiency matrix for families. Research on Social
Work Practice. DOI: https://doi.org/10.1177/1049731515596072
Rubak, S., Sandboek, A., Lauritzen, T., & Christensen, B. (2005, April). Motivational interviewing: A
systematic review and meta-analysis. British Journal of General Practice, 55, 305-312.
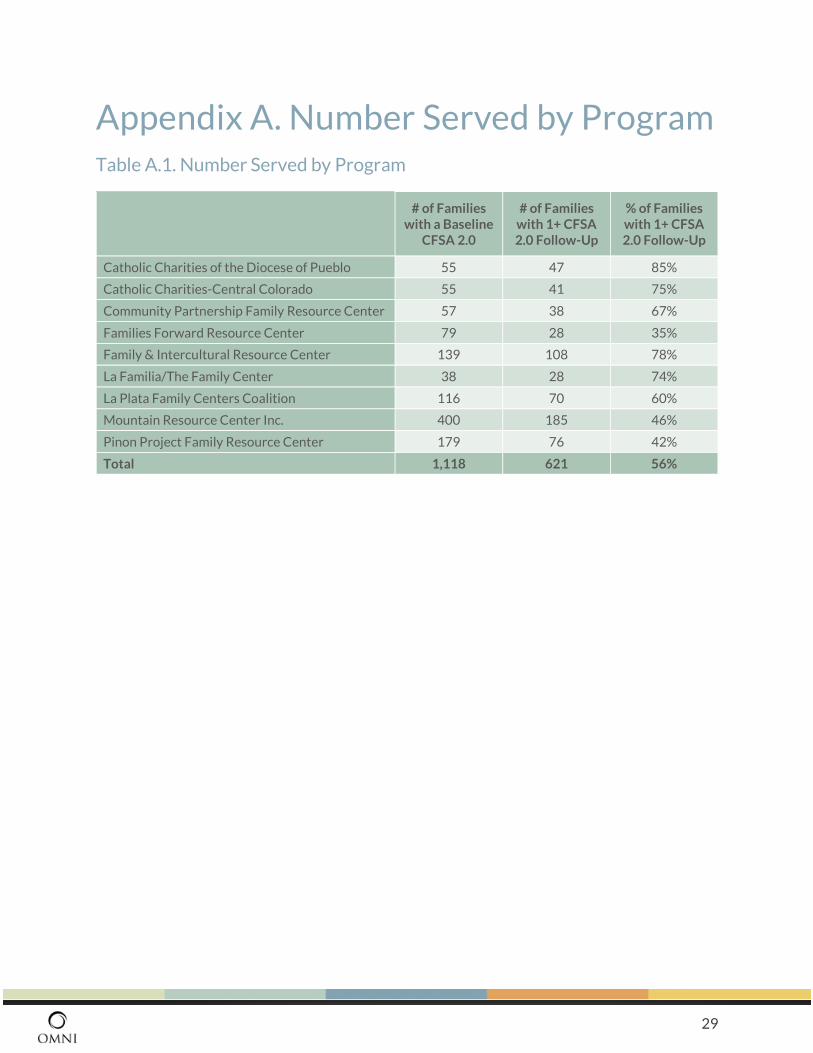
29
Appendix A. Number Served by Program Table A.1. Number Served by Program
# of Families
with a Baseline CFSA 2.0
# of Families with 1+ CFSA 2.0 Follow-Up
% of Families with 1+ CFSA 2.0 Follow-Up
Catholic Charities of the Diocese of Pueblo 55 47 85%
Catholic Charities-Central Colorado 55 41 75%
Community Partnership Family Resource Center 57 38 67%
Families Forward Resource Center 79 28 35%
Family & Intercultural Resource Center 139 108 78%
La Familia/The Family Center 38 28 74%
La Plata Family Centers Coalition 116 70 60%
Mountain Resource Center Inc. 400 185 46%
Pinon Project Family Resource Center 179 76 42%
Total 1,118 621 56%
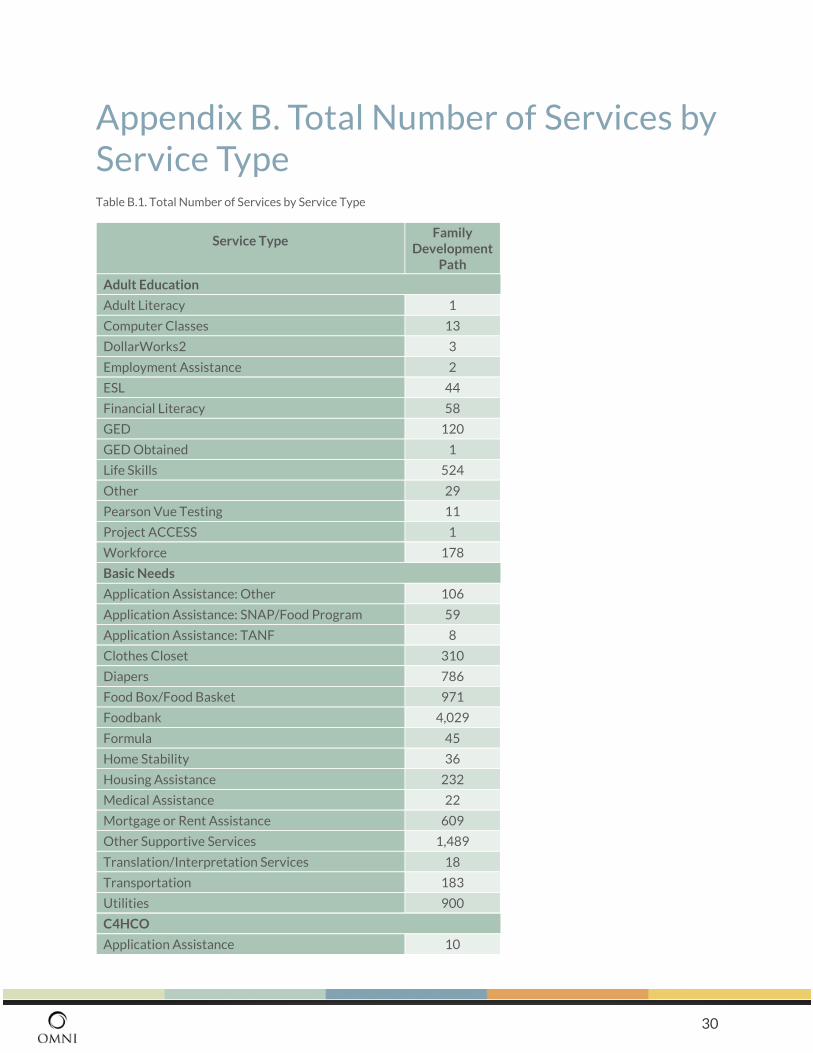
30
Appendix B. Total Number of Services by Service Type
Table B.1. Total Number of Services by Service Type
Service Type Family
Development Path
Adult Education
Adult Literacy 1
Computer Classes 13
DollarWorks2 3
Employment Assistance 2
ESL 44
Financial Literacy 58
GED 120
GED Obtained 1
Life Skills 524
Other 29
Pearson Vue Testing 11
Project ACCESS 1
Workforce 178
Basic Needs
Application Assistance: Other 106
Application Assistance: SNAP/Food Program 59
Application Assistance: TANF 8
Clothes Closet 310
Diapers 786
Food Box/Food Basket 971
Foodbank 4,029
Formula 45
Home Stability 36
Housing Assistance 232
Medical Assistance 22
Mortgage or Rent Assistance 609
Other Supportive Services 1,489
Translation/Interpretation Services 18
Transportation 183
Utilities 900
C4HCO
Application Assistance 10
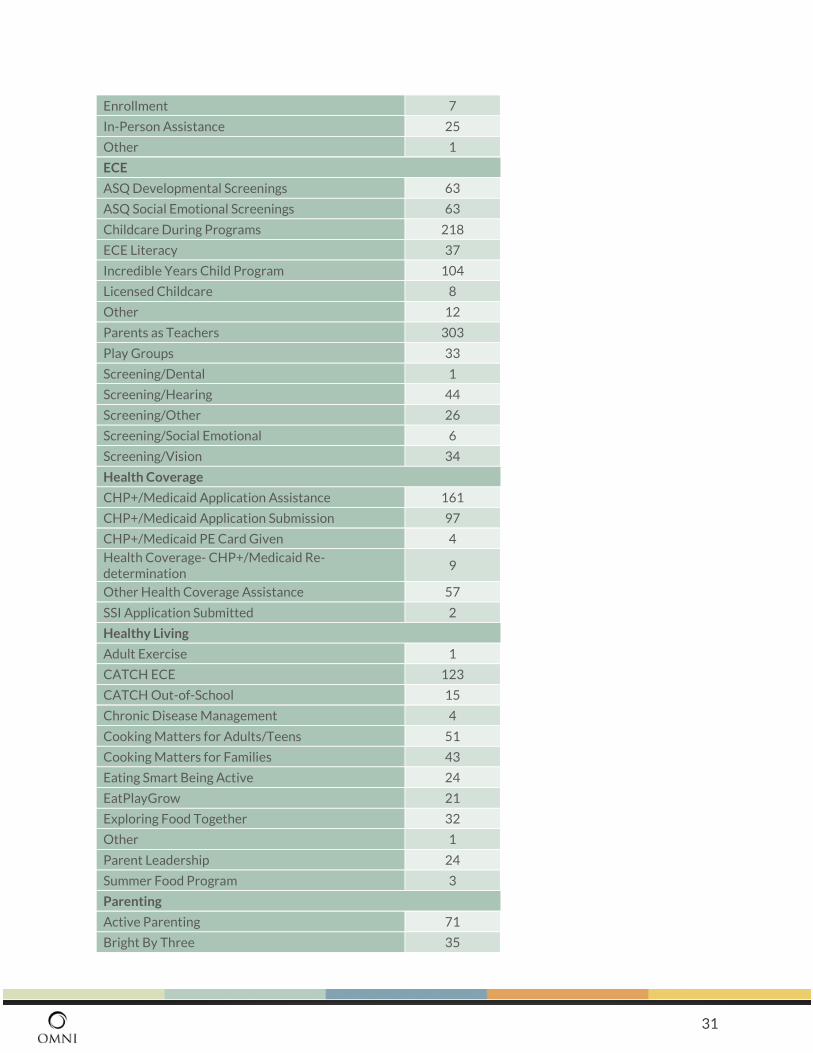
31
Enrollment 7
In-Person Assistance 25
Other 1
ECE
ASQ Developmental Screenings 63
ASQ Social Emotional Screenings 63
Childcare During Programs 218
ECE Literacy 37
Incredible Years Child Program 104
Licensed Childcare 8
Other 12
Parents as Teachers 303
Play Groups 33
Screening/Dental 1
Screening/Hearing 44
Screening/Other 26
Screening/Social Emotional 6
Screening/Vision 34
Health Coverage
CHP+/Medicaid Application Assistance 161
CHP+/Medicaid Application Submission 97
CHP+/Medicaid PE Card Given 4
Health Coverage- CHP+/Medicaid Re-determination
9
Other Health Coverage Assistance 57
SSI Application Submitted 2
Healthy Living
Adult Exercise 1
CATCH ECE 123
CATCH Out-of-School 15
Chronic Disease Management 4
Cooking Matters for Adults/Teens 51
Cooking Matters for Families 43
Eating Smart Being Active 24
EatPlayGrow 21
Exploring Food Together 32
Other 1
Parent Leadership 24
Summer Food Program 3
Parenting
Active Parenting 71
Bright By Three 35
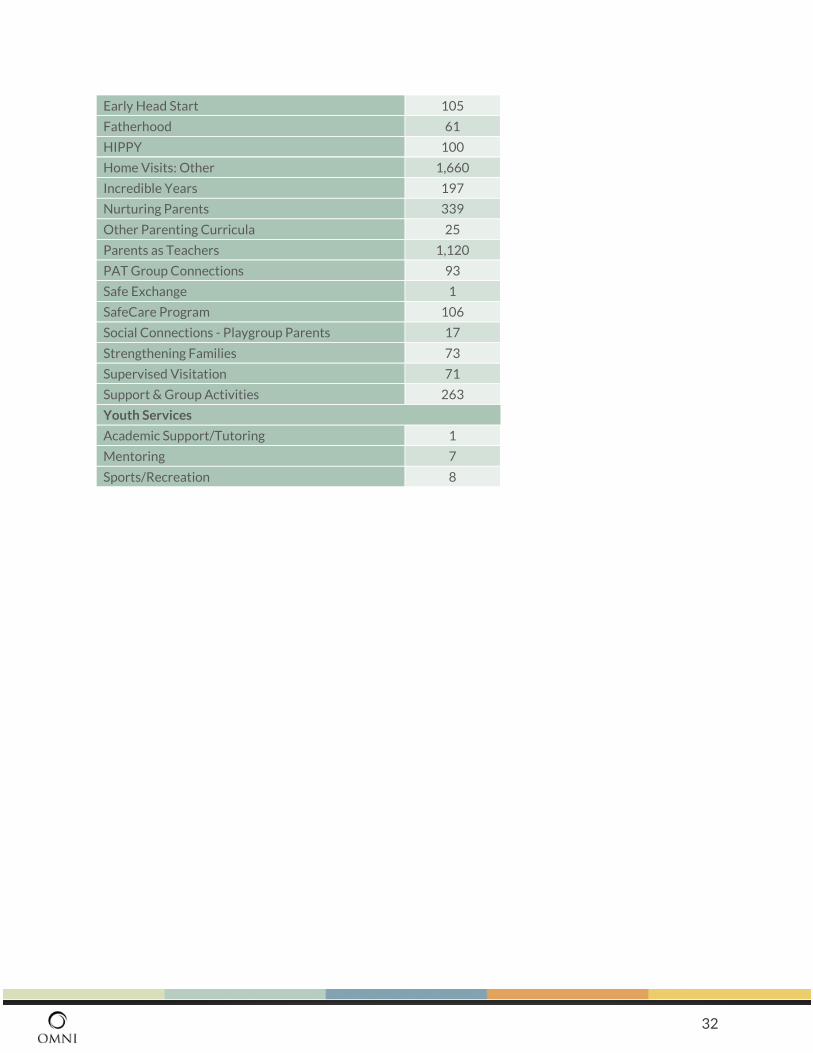
32
Early Head Start 105
Fatherhood 61
HIPPY 100
Home Visits: Other 1,660
Incredible Years 197
Nurturing Parents 339
Other Parenting Curricula 25
Parents as Teachers 1,120
PAT Group Connections 93
Safe Exchange 1
SafeCare Program 106
Social Connections - Playgroup Parents 17
Strengthening Families 73
Supervised Visitation 71
Support & Group Activities 263
Youth Services
Academic Support/Tutoring 1
Mentoring 7
Sports/Recreation 8
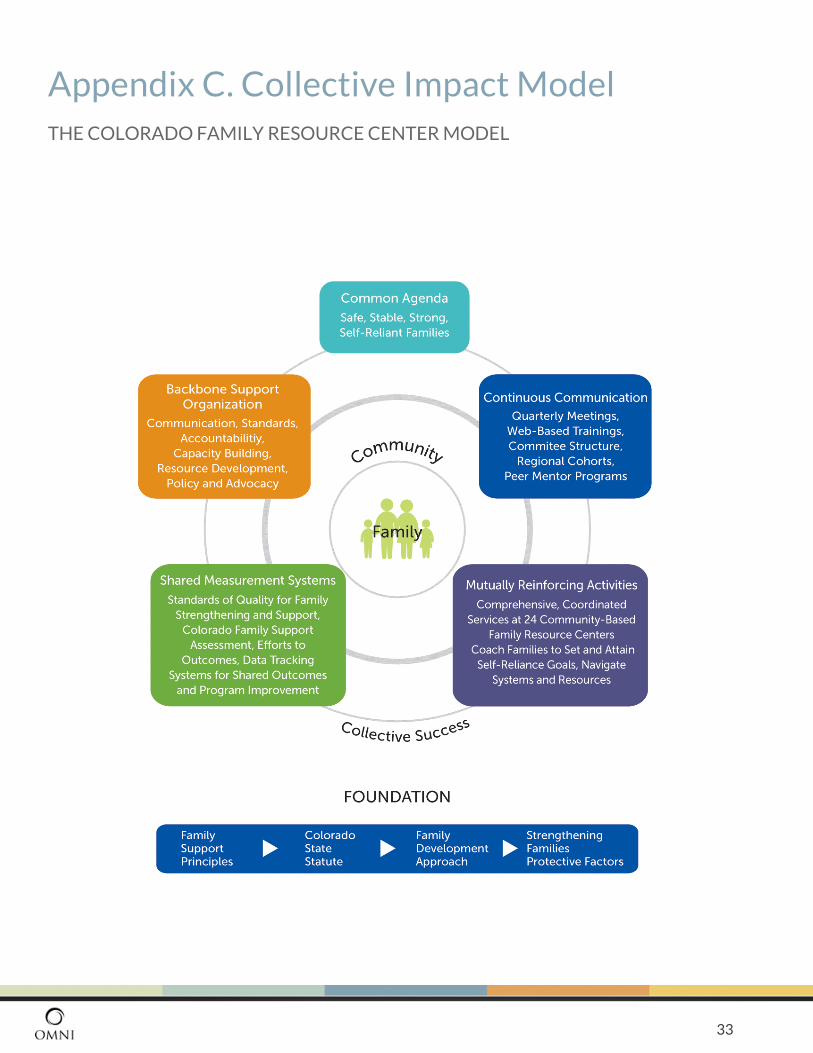
33
Appendix C. Collective Impact Model
THE COLORADO FAMILY RESOURCE CENTER MODEL
34
Backbone Support Organization The Family Resource Center Association (FRCA) strengthens and expands the Colorado Family
Resource Center model through program fidelity standards, program quality monitoring, outcome
measurement, state- and national-level advocacy, resource development, and organizational
capacity building for its 24 member family resource centers. FRCA secures funds to support
implementation of effective programs at the local family resource center level as an intermediary,
provides strategic technical assistance and training opportunities for FRCA members, and provides
regular program quality monitoring for specific programs funded through FRCA, including health,
parent and child development, and family development programs.
Shared Measurement Systems Family resource centers use the Colorado Family Support Assessment to measure progress in 16
domains of family stability: Employment, Financial, Childcare, Utility Assistance, Housing, Food,
Adult Education, Children’s Education, Parenting Skills, Family Relations, Health Care Access,
Mental Health, Substance Use, Legal, Transportation, and Support Networks. FRCA’s Efforts to
Outcomes online data tracking system helps centers track outcomes to monitor program impact
and effectiveness, standards of quality for Family Stregthening and Support, as well as their program
activities and participant demographics. The Family Resource Center Association provides access
to the online system, regular data management support, group and individual training, technical
support, system customization and tools to help centers maintain and optimize use of their data.
Mutually Reinforcing Activities Family resource centers provide a safe, accessible place for families to connect with
comprehensive, coordinated services, with programs at each center tailored to the culture,
resources and needs of the community and focused on building on the strengths of each family
and individual. Family resource center staff work in a coaching role with families to help them
set and attain short-term and long-term goals toward self-reliance. Staff also serve as navigators to
help families access resources and services at the center and in the local community. The Family
Resource Center Association fosters strong collaboration among its 24 member family resource
centers and works toward system-level supports for families through its active work on numerous
statewide collaborations and partnerships across the public, private, and nonprofit sectors.
Continuous Communication Through FRCA, family resource centers come together in quarterly meetings, regional cohorts,
webinars, and other meetings for peer support and learning, sharing of promising practices, and
training. FRCA also connects family resource centers with key thought leaders in family support
service and other relative sectors, including education, human services, child welfare, housing
and community development, and workforce development. These connections begin to break
down silos among service providers and build awareness of and support for the comprehensive,
coordinated services at the center of the Colorado Family Resource Center model.
Common Agenda The Colorado Family Resource Center Model is a comprehensive approach to helping
vulnerable families become more resilient and self-reliant across multiple areas of family
stability, including poverty. The model uses as its foundation the Principles and Practices of
Family Support (as defined by Family Support America) and the Family Resource Center statute
enacted by the Colorado General Assembly in 1993. The Family Resource Center Association
(FRCA) has also incorporated the Family Development approach developed by Cornell
University, an intensive, strengths-based approach to working one-on-one with individual
families to help them set and work toward transformative goals. The Model also integrates the
five Strengthening FamiliesProtective Factors as families set goals and move through programs.
35
Appendix D. Multiple Domain Matrix Results Multiple Domain Matrix Results
Introduction and Purpose
OMNI Institute conducted a factor analysis to identify the underlying factor structure of the domains included in
Part A of the Colorado Family Support Assessment (CFSA 2.0). The CFSA 2.0 is a three-part tool used by the
Family Resource Center Association (FRCA) to assess outcomes for families receiving family development
services from its member Family Resource Centers (FRCs). Part A assesses family self-reliance in 14 domains
(e.g., housing, transportation, employment), with indicators for each domain ranging from 1 (in crisis) to 5
(thriving). Part B is the Protective Factors Survey (PFS), and Part C identifies areas in which families would like to
set goals and their readiness to change in those areas. This report describes results from factor analyses
conducted on Part A, and the resulting recommended factor structure that can be used to monitor the progress of
families who are administered the tool.
Overview of Method
Factor analysis is a data reduction technique that examines the relationships among measured variables (in this
case, each CFSA 2.0, Part A domain). Results help identify whether the measured variables are based on
underlying ‘factors’ (for example, economic self-sufficiency). Measurement of underlying factor(s) can efficiently
provide information on whether programs are impacting multiple dimensions of an outcome rather than only
examining each component individually. Prior to conducting the factor analysis, a data quality review examined
variability of responses within each domain; similarities and differences among the individual FRCs; and the
amount of missing data in each domain.
Families included in the analyses were those who completed a baseline CFSA 2.0 between July 1st, 2015 and April
17th, 2017 (n = 3,564). Data came from families served by 24 FRCs across Colorado. Thirteen of the 14 domains of
the CFSA 2.0, Part A were included in the analyses: Income, Employment, Housing, Transportation, Food Security,
Child Care, Child Education, Adult Education, Cash Savings, Debt Management, Health Coverage, Physical Health, and
Mental Health. The Substance Use domain was excluded from analyses due to insufficient variability in responses
across families.
Summary of Findings and Recommendations
The full set of results from model testing is presented in the technical report that follows this summary. In brief,
the factor analyses yielded three major findings with respect to the factor structure of the CFSA 2.0, Part A:
• Across models, Income, Employment, Housing, Transportation, Food Security, Adult Education, Cash
Savings, and Health Coverage consistently pulled together into one factor, suggesting that these
components are measuring a single underlying construct. Given the content of the domains that contribute
to this factor, we refer to it as Economic Self-Sufficiency and recommend creating an 8-domain composite
scale by combining the domains into a single scale.
• Across models, Physical Health and Mental Health consistently pulled together into one factor, suggesting
that these components are measuring a single underlying construct. Given the content of the domains that
36
contribute to this factor, we refer to is as Health, and recommend creating a 2-domain composite scale by
combining ratings on these two domains into a single scale.
• Three domains, Debt Management, Child Education, and Child Care, were inconsistent across models. As
such, we recommend that these domains are each analyzed separately.
Results of analyses also indicated that although there is some variation between FRCs in how domains are scored,
these differences do not significantly impact the factor structure of the CFSA 2.0, Part A. This is a positive finding
and suggests that the structure of the tool is the same across communities. Therefore, the recommended factor
structure of the Economic Self-Sufficiency and Health composite scales can be used across FRCs. The
recommended factor structure is depicted in Figure 1.
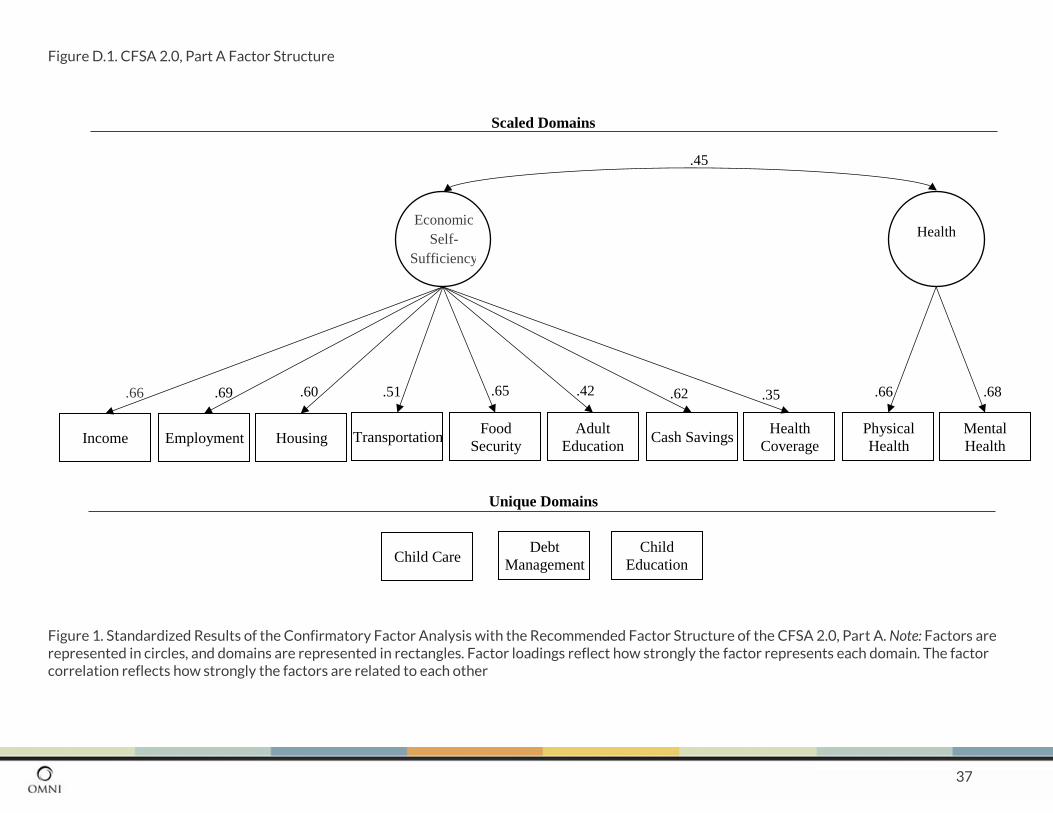
37
Figure D.1. CFSA 2.0, Part A Factor Structure
Figure 1. Standardized Results of the Confirmatory Factor Analysis with the Recommended Factor Structure of the CFSA 2.0, Part A. Note: Factors are represented in circles, and domains are represented in rectangles. Factor loadings reflect how strongly the factor represents each domain. The factor correlation reflects how strongly the factors are related to each other
Unique Domains
Employment Income Housing Adult
Education Transportation
Food
Security Cash Savings
Health
Coverage
Physical
Health
Mental
Health
Economic
Self-
Sufficiency
Health
.66 .69 .60 .51 .65 .42 .62 .35 .66 .68
.45
Child Care Child
Education Debt
Management
Scaled Domains
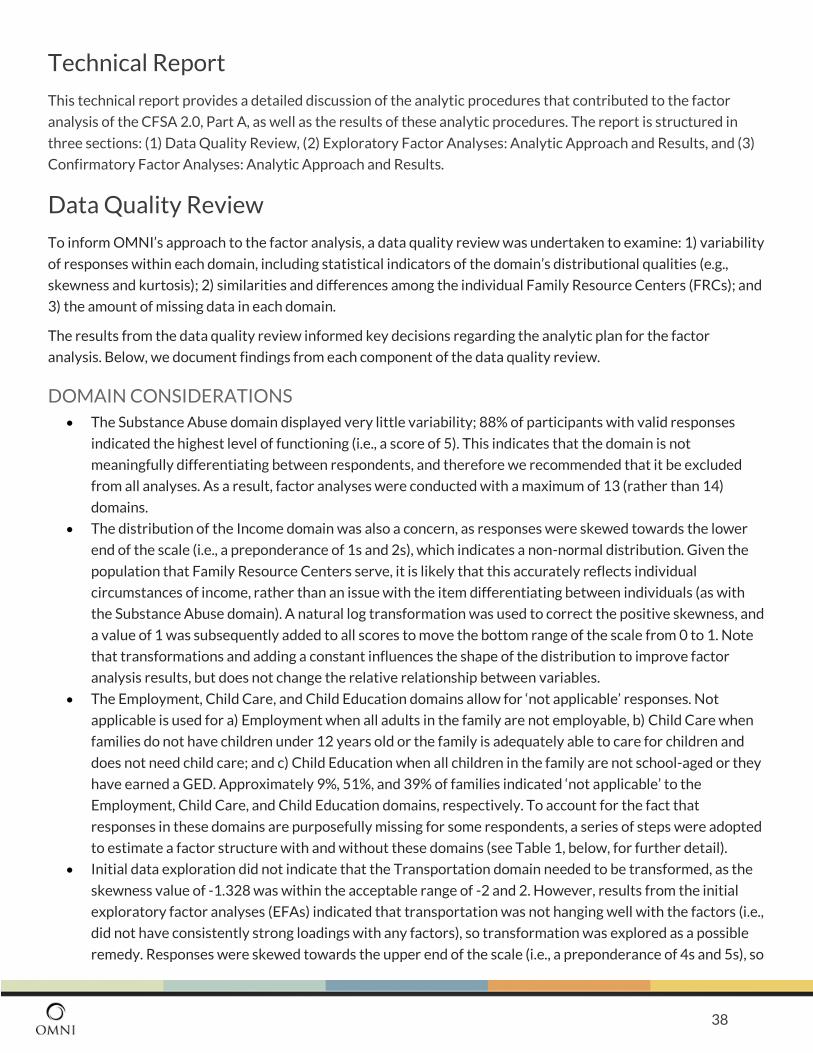
38
Technical Report
This technical report provides a detailed discussion of the analytic procedures that contributed to the factor
analysis of the CFSA 2.0, Part A, as well as the results of these analytic procedures. The report is structured in
three sections: (1) Data Quality Review, (2) Exploratory Factor Analyses: Analytic Approach and Results, and (3)
Confirmatory Factor Analyses: Analytic Approach and Results.
Data Quality Review
To inform OMNI’s approach to the factor analysis, a data quality review was undertaken to examine: 1) variability
of responses within each domain, including statistical indicators of the domain’s distributional qualities (e.g.,
skewness and kurtosis); 2) similarities and differences among the individual Family Resource Centers (FRCs); and
3) the amount of missing data in each domain.
The results from the data quality review informed key decisions regarding the analytic plan for the factor
analysis. Below, we document findings from each component of the data quality review.
DOMAIN CONSIDERATIONS
• The Substance Abuse domain displayed very little variability; 88% of participants with valid responses
indicated the highest level of functioning (i.e., a score of 5). This indicates that the domain is not
meaningfully differentiating between respondents, and therefore we recommended that it be excluded
from all analyses. As a result, factor analyses were conducted with a maximum of 13 (rather than 14)
domains.
• The distribution of the Income domain was also a concern, as responses were skewed towards the lower
end of the scale (i.e., a preponderance of 1s and 2s), which indicates a non-normal distribution. Given the
population that Family Resource Centers serve, it is likely that this accurately reflects individual
circumstances of income, rather than an issue with the item differentiating between individuals (as with
the Substance Abuse domain). A natural log transformation was used to correct the positive skewness, and
a value of 1 was subsequently added to all scores to move the bottom range of the scale from 0 to 1. Note
that transformations and adding a constant influences the shape of the distribution to improve factor
analysis results, but does not change the relative relationship between variables.
• The Employment, Child Care, and Child Education domains allow for ‘not applicable’ responses. Not
applicable is used for a) Employment when all adults in the family are not employable, b) Child Care when
families do not have children under 12 years old or the family is adequately able to care for children and
does not need child care; and c) Child Education when all children in the family are not school-aged or they
have earned a GED. Approximately 9%, 51%, and 39% of families indicated ‘not applicable’ to the
Employment, Child Care, and Child Education domains, respectively. To account for the fact that
responses in these domains are purposefully missing for some respondents, a series of steps were adopted
to estimate a factor structure with and without these domains (see Table 1, below, for further detail).
• Initial data exploration did not indicate that the Transportation domain needed to be transformed, as the
skewness value of -1.328 was within the acceptable range of -2 and 2. However, results from the initial
exploratory factor analyses (EFAs) indicated that transportation was not hanging well with the factors (i.e.,
did not have consistently strong loadings with any factors), so transformation was explored as a possible
remedy. Responses were skewed towards the upper end of the scale (i.e., a preponderance of 4s and 5s), so
39
an exponential transformation was used. Subsequent EFA results indicated that the transformed
transportation variable performed better in that factor loadings were more consistent and interpretable.
Therefore, all analyses reported here include the transformed version of the transportation domain.
SAMPLE SIZE CONSIDERATIONS
Each domain was reviewed for potential missing data concerns. A large number of respondents (3,564)
completed a baseline CFSA between July 1st, 2015, and April 17th, 2017. However, missing data affects the
number of respondents that are available for any given analysis. Listwise case deletion indicates that 28% of the
sample had a valid response for every domain item. The majority of missing data results from the ‘not applicable’
responses, which are valid response options for the Employment, Child Care, and Child Education domains. As such,
the majority of missing data may result from proper administration of the measure. A small proportion of missing
data results from instances in which family workers were unable to obtain sufficient information to appropriately
score a domain during the interview with the family (coded as ‘not enough information’); this type of missing data
is to be expected in applied settings and generally accounts for a small proportion of the data. Specifically, the
range of missing values due to ‘not enough information’ for the 14 domains was 1.1% to 9.1%, with an average of
3.7% missing across the domains.
However, missing data is a statistical concern because it can bias, and therefore reduce the accuracy of, analyses.
As noted in more detail below, the influence of the high presence of missing data in this sample due to ‘not
applicable’ responses was explored by removing and adding relevant domains that had this response option to
the factor analysis models. To account for the influence of the smaller amounts of missing data due to ‘not enough
information’, we compared the results from standard EFAs to results from factor analyses using a statistical
approach known as full information maximum likelihood. This approach to missing data allows all respondents
who have at least one valid response on a domain to be included in the analyses. When compared to traditional
approaches to missing data, which would require participants to have a valid response on all domains, this
increases the sample size; comparison of the traditional approach (i.e., listwise case deletion) and the approach
using full information maximum likelihood determines whether the missing data due to ‘not enough information’
bias the results of the factor analyses, and thus needed to be accounted for statistically.
FAMILY RESOURCE CENTER (FRC) CONSIDERATIONS
The data quality review revealed that there were consistent, significant differences between FRCs across
domains. First, some FRCs had average (mean) domain ratings that were consistently higher or lower than other
FRCs. Specifically, families from one FRC scored significantly higher than average on 8 of the 14 domains and
families from another scored significantly higher than average on 7 of the 14 domains. In contrast, families from a
third FRC scored significantly lower than average on 9 of the 14 domains. Second, results suggested that,
although small, there may be some ‘clustering’ of responses at the FRC level, indicating that some of the variance
in responses may be due to similarities in families served by centers (i.e., intraclass correlation coefficients (ICCs)
for each domain range from .07 to .40). Differences in family ratings across centers may reflect the different
populations that FRCs serve, or they may be the result of systematic differences in how staff in different FRCs
administer the tool. We compared the results from one-level and two-level standard EFAs to determine whether
the differences in response patterns at the level of the FRC influenced the factor structure, and thus needed to be
accounted for statistically.
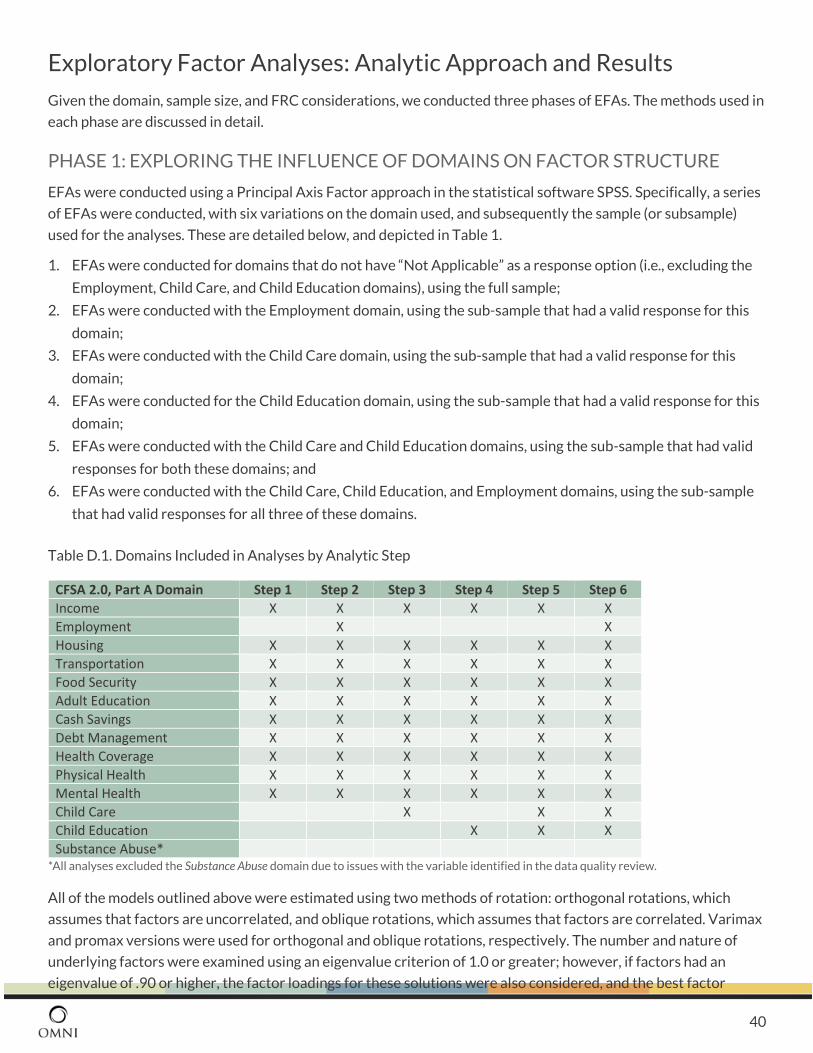
40
Exploratory Factor Analyses: Analytic Approach and Results
Given the domain, sample size, and FRC considerations, we conducted three phases of EFAs. The methods used in
each phase are discussed in detail.
PHASE 1: EXPLORING THE INFLUENCE OF DOMAINS ON FACTOR STRUCTURE
EFAs were conducted using a Principal Axis Factor approach in the statistical software SPSS. Specifically, a series
of EFAs were conducted, with six variations on the domain used, and subsequently the sample (or subsample)
used for the analyses. These are detailed below, and depicted in Table 1.
1. EFAs were conducted for domains that do not have “Not Applicable” as a response option (i.e., excluding the
Employment, Child Care, and Child Education domains), using the full sample;
2. EFAs were conducted with the Employment domain, using the sub-sample that had a valid response for this
domain;
3. EFAs were conducted with the Child Care domain, using the sub-sample that had a valid response for this
domain;
4. EFAs were conducted for the Child Education domain, using the sub-sample that had a valid response for this
domain;
5. EFAs were conducted with the Child Care and Child Education domains, using the sub-sample that had valid
responses for both these domains; and
6. EFAs were conducted with the Child Care, Child Education, and Employment domains, using the sub-sample
that had valid responses for all three of these domains.
Table D.1. Domains Included in Analyses by Analytic Step
CFSA 2.0, Part A Domain Step 1 Step 2 Step 3 Step 4 Step 5 Step 6
Income X X X X X X
Employment X X
Housing X X X X X X
Transportation X X X X X X
Food Security X X X X X X
Adult Education X X X X X X
Cash Savings X X X X X X
Debt Management X X X X X X
Health Coverage X X X X X X
Physical Health X X X X X X
Mental Health X X X X X X
Child Care X X X
Child Education X X X
Substance Abuse* *All analyses excluded the Substance Abuse domain due to issues with the variable identified in the data quality review.
All of the models outlined above were estimated using two methods of rotation: orthogonal rotations, which
assumes that factors are uncorrelated, and oblique rotations, which assumes that factors are correlated. Varimax
and promax versions were used for orthogonal and oblique rotations, respectively. The number and nature of
underlying factors were examined using an eigenvalue criterion of 1.0 or greater; however, if factors had an
eigenvalue of .90 or higher, the factor loadings for these solutions were also considered, and the best factor
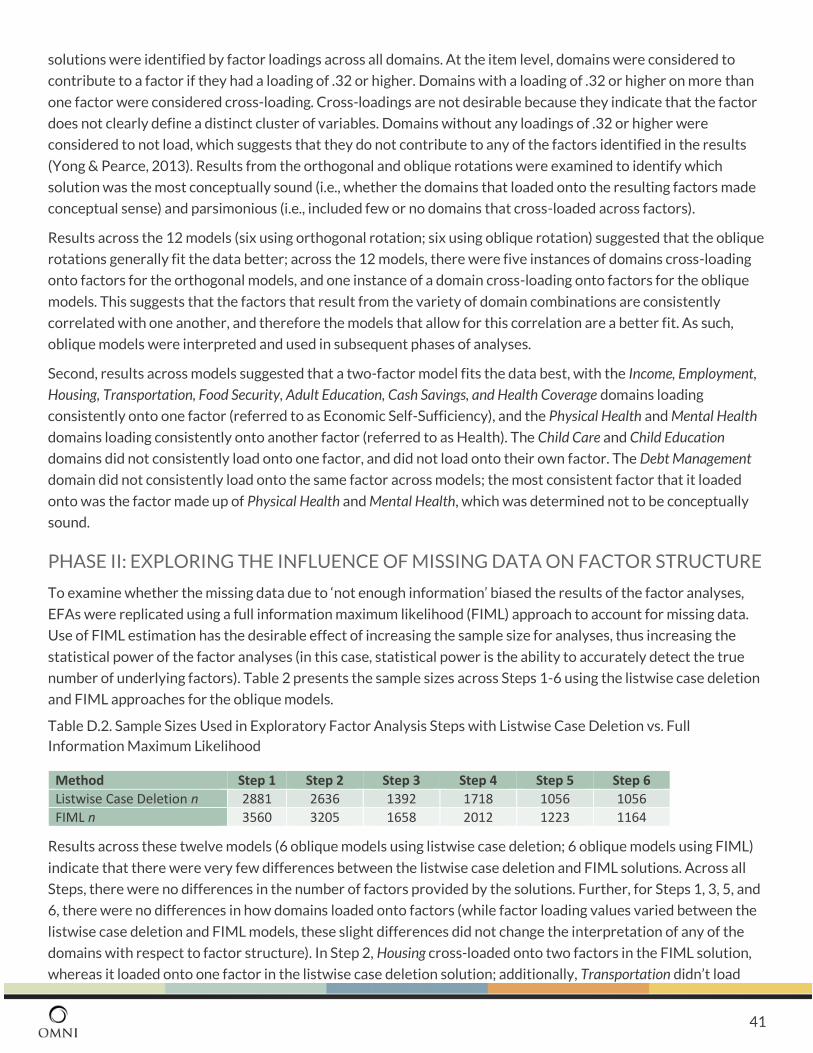
41
solutions were identified by factor loadings across all domains. At the item level, domains were considered to
contribute to a factor if they had a loading of .32 or higher. Domains with a loading of .32 or higher on more than
one factor were considered cross-loading. Cross-loadings are not desirable because they indicate that the factor
does not clearly define a distinct cluster of variables. Domains without any loadings of .32 or higher were
considered to not load, which suggests that they do not contribute to any of the factors identified in the results
(Yong & Pearce, 2013). Results from the orthogonal and oblique rotations were examined to identify which
solution was the most conceptually sound (i.e., whether the domains that loaded onto the resulting factors made
conceptual sense) and parsimonious (i.e., included few or no domains that cross-loaded across factors).
Results across the 12 models (six using orthogonal rotation; six using oblique rotation) suggested that the oblique
rotations generally fit the data better; across the 12 models, there were five instances of domains cross-loading
onto factors for the orthogonal models, and one instance of a domain cross-loading onto factors for the oblique
models. This suggests that the factors that result from the variety of domain combinations are consistently
correlated with one another, and therefore the models that allow for this correlation are a better fit. As such,
oblique models were interpreted and used in subsequent phases of analyses.
Second, results across models suggested that a two-factor model fits the data best, with the Income, Employment,
Housing, Transportation, Food Security, Adult Education, Cash Savings, and Health Coverage domains loading
consistently onto one factor (referred to as Economic Self-Sufficiency), and the Physical Health and Mental Health
domains loading consistently onto another factor (referred to as Health). The Child Care and Child Education
domains did not consistently load onto one factor, and did not load onto their own factor. The Debt Management
domain did not consistently load onto the same factor across models; the most consistent factor that it loaded
onto was the factor made up of Physical Health and Mental Health, which was determined not to be conceptually
sound.
PHASE II: EXPLORING THE INFLUENCE OF MISSING DATA ON FACTOR STRUCTURE
To examine whether the missing data due to ‘not enough information’ biased the results of the factor analyses,
EFAs were replicated using a full information maximum likelihood (FIML) approach to account for missing data.
Use of FIML estimation has the desirable effect of increasing the sample size for analyses, thus increasing the
statistical power of the factor analyses (in this case, statistical power is the ability to accurately detect the true
number of underlying factors). Table 2 presents the sample sizes across Steps 1-6 using the listwise case deletion
and FIML approaches for the oblique models.
Table D.2. Sample Sizes Used in Exploratory Factor Analysis Steps with Listwise Case Deletion vs. Full
Information Maximum Likelihood
Method Step 1 Step 2 Step 3 Step 4 Step 5 Step 6
Listwise Case Deletion n 2881 2636 1392 1718 1056 1056
FIML n 3560 3205 1658 2012 1223 1164
Results across these twelve models (6 oblique models using listwise case deletion; 6 oblique models using FIML)
indicate that there were very few differences between the listwise case deletion and FIML solutions. Across all
Steps, there were no differences in the number of factors provided by the solutions. Further, for Steps 1, 3, 5, and
6, there were no differences in how domains loaded onto factors (while factor loading values varied between the
listwise case deletion and FIML models, these slight differences did not change the interpretation of any of the
domains with respect to factor structure). In Step 2, Housing cross-loaded onto two factors in the FIML solution,
whereas it loaded onto one factor in the listwise case deletion solution; additionally, Transportation didn’t load
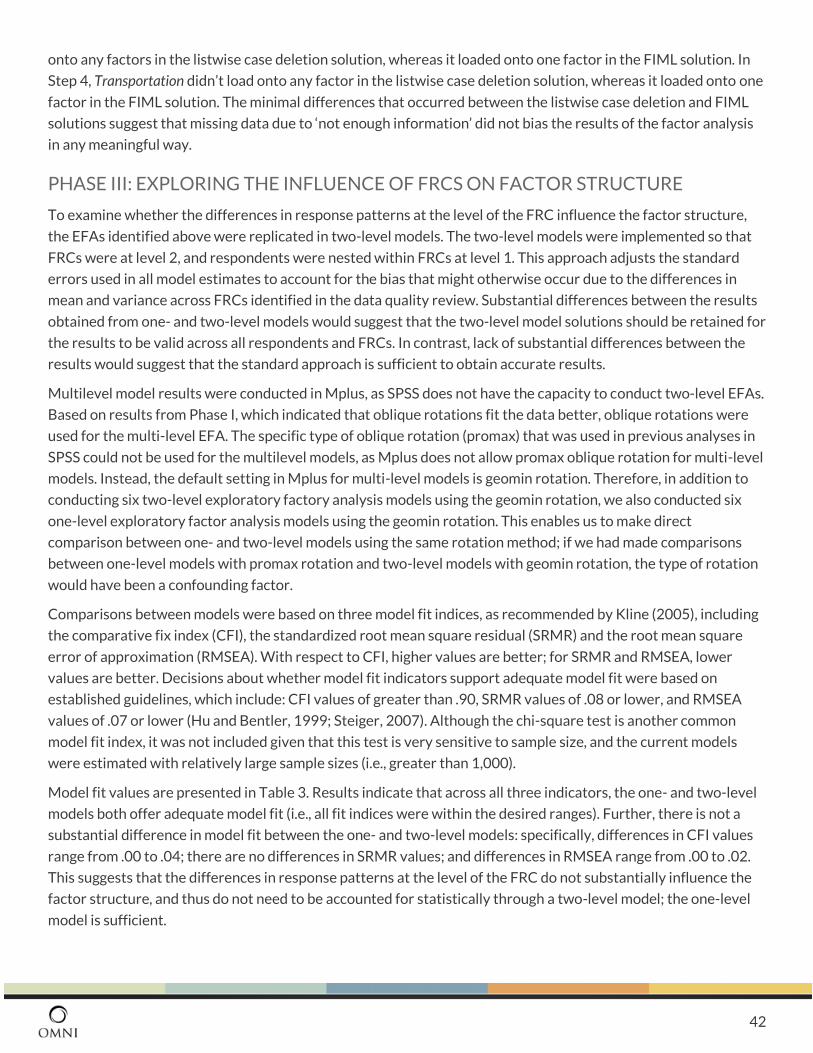
42
onto any factors in the listwise case deletion solution, whereas it loaded onto one factor in the FIML solution. In
Step 4, Transportation didn’t load onto any factor in the listwise case deletion solution, whereas it loaded onto one
factor in the FIML solution. The minimal differences that occurred between the listwise case deletion and FIML
solutions suggest that missing data due to ‘not enough information’ did not bias the results of the factor analysis
in any meaningful way.
PHASE III: EXPLORING THE INFLUENCE OF FRCS ON FACTOR STRUCTURE
To examine whether the differences in response patterns at the level of the FRC influence the factor structure,
the EFAs identified above were replicated in two-level models. The two-level models were implemented so that
FRCs were at level 2, and respondents were nested within FRCs at level 1. This approach adjusts the standard
errors used in all model estimates to account for the bias that might otherwise occur due to the differences in
mean and variance across FRCs identified in the data quality review. Substantial differences between the results
obtained from one- and two-level models would suggest that the two-level model solutions should be retained for
the results to be valid across all respondents and FRCs. In contrast, lack of substantial differences between the
results would suggest that the standard approach is sufficient to obtain accurate results.
Multilevel model results were conducted in Mplus, as SPSS does not have the capacity to conduct two-level EFAs.
Based on results from Phase I, which indicated that oblique rotations fit the data better, oblique rotations were
used for the multi-level EFA. The specific type of oblique rotation (promax) that was used in previous analyses in
SPSS could not be used for the multilevel models, as Mplus does not allow promax oblique rotation for multi-level
models. Instead, the default setting in Mplus for multi-level models is geomin rotation. Therefore, in addition to
conducting six two-level exploratory factory analysis models using the geomin rotation, we also conducted six
one-level exploratory factor analysis models using the geomin rotation. This enables us to make direct
comparison between one- and two-level models using the same rotation method; if we had made comparisons
between one-level models with promax rotation and two-level models with geomin rotation, the type of rotation
would have been a confounding factor.
Comparisons between models were based on three model fit indices, as recommended by Kline (2005), including
the comparative fix index (CFI), the standardized root mean square residual (SRMR) and the root mean square
error of approximation (RMSEA). With respect to CFI, higher values are better; for SRMR and RMSEA, lower
values are better. Decisions about whether model fit indicators support adequate model fit were based on
established guidelines, which include: CFI values of greater than .90, SRMR values of .08 or lower, and RMSEA
values of .07 or lower (Hu and Bentler, 1999; Steiger, 2007). Although the chi-square test is another common
model fit index, it was not included given that this test is very sensitive to sample size, and the current models
were estimated with relatively large sample sizes (i.e., greater than 1,000).
Model fit values are presented in Table 3. Results indicate that across all three indicators, the one- and two-level
models both offer adequate model fit (i.e., all fit indices were within the desired ranges). Further, there is not a
substantial difference in model fit between the one- and two-level models: specifically, differences in CFI values
range from .00 to .04; there are no differences in SRMR values; and differences in RMSEA range from .00 to .02.
This suggests that the differences in response patterns at the level of the FRC do not substantially influence the
factor structure, and thus do not need to be accounted for statistically through a two-level model; the one-level
model is sufficient.

43
Table D.3. Model Fit for One- and Two-Level Exploratory Factor Analyses
One-Level Models Two-Level Models
CFI SRMR RMSEA CFI SRMR RMSEA
Step 1 .93 .03 .07 .89 .03 .05
Step 2 .97 .02 .05 .95 .02 .04
Step 3 .98 .03 .05 .96 .03 .05
Step 4 .95 .03 .05 .95 .03 .04
Step 5 .95 .03 .05 .96 .03 .04
Step 6 .95 .03 .05 .95 .03 .05
Confirmatory Factor Analyses: Analytic Approach and Results
Finally, given the results from the three phases of EFAs, a single confirmatory factor analysis (CFA) model was
estimated. CFAs differ from EFAs in that a factor structure is imposed on the data, and model fit indices are used
to determine whether that select factor structure adequately fits the data. The factor structure selected for the
CFA was based on the cumulative results of the three phases of EFAs; a one-level model with two factors, one
representing economic self-sufficiency, and one representing health, was estimated (see Table 4). The same
model fit indices used to assess model fit in the one- and two-level EFA models (i.e., CFI, SRMR and RMSEA) were
used to evaluate model fit of the CFA. Results support adequate model fit (CFI=.91, SRMR= .05, and RMSEA=.07).
Additionally, the factor loadings of each domain were examined, and all factor loadings were significant at p <
.001 (see Table 4), indicating that each of the factors are well defined by its items. Finally, the covariance between
the two factors was examined, and results indicated that although the two factors are unique, they are
significantly and positively related to one another (b = .445, SE = .02, p < .001). This is consistent with the
conclusions of Phase I of the EFAs, in which the oblique rotations generally fit the data better, indicating that the
underlying factors were related.
Table D.4. Confirmatory Factor Analysis Results for Recommended Factor Structure of CFSA 2.0, Part A.
CFSA 2.0, Part A Domain
Standardized Factor Loadings
Factor 1: Economic Self-Sufficiency Factor 2: Health
Income .655 -
Employment .687 -
Housing .595 -
Transportation .512 -
Food Security .651 -
Adult Education .419 -
Cash Savings .615 -
Health Coverage .349 -
Physical Health - .656
Mental Health - .679
Note: – indicates that the item was not estimated on that factor. All factor loadings are significant at p < .001.
44
Multiple Domain Matrix References Hu, L.T. and Bentler, P.M. (1999), "Cutoff Criteria for Fit Indexes in Covariance Structure Analysis:
Conventional Criteria Versus New Alternatives," Structural Equation Modeling, 6 (1), 1-55. Kline, R.B. (2005), Principles and Practice of Structural Equation Modeling (2nd Edition ed.). New York:
The Guilford Press. Steiger, J.H. (2007), "Understanding the limitations of global fit assessment in structural equation
modeling," Personality and Individual Differences, 42 (5), 893-98. Yong, A. G., & Pearce. S. (2013). A Beginner’s Guide to Factor Analysis: Focusing on Exploratory Factor Analysis. Tutorials
in Quantitative Methods for Psychology, 9(2), 79-94.
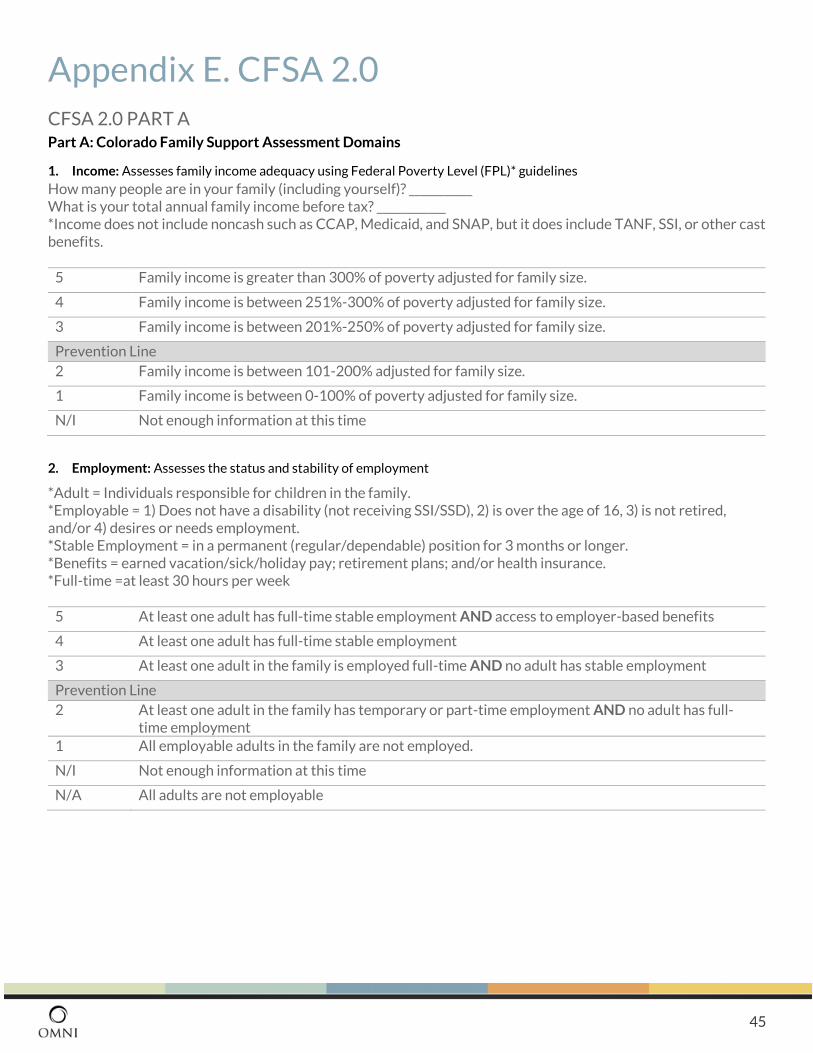
45
Appendix E. CFSA 2.0
CFSA 2.0 PART A Part A: Colorado Family Support Assessment Domains
1. Income: Assesses family income adequacy using Federal Poverty Level (FPL)* guidelines
How many people are in your family (including yourself)? ___________ What is your total annual family income before tax? ____________ *Income does not include noncash such as CCAP, Medicaid, and SNAP, but it does include TANF, SSI, or other cast benefits.
5 Family income is greater than 300% of poverty adjusted for family size.
4 Family income is between 251%-300% of poverty adjusted for family size.
3 Family income is between 201%-250% of poverty adjusted for family size.
Prevention Line
2 Family income is between 101-200% adjusted for family size.
1 Family income is between 0-100% of poverty adjusted for family size.
N/I Not enough information at this time
2. Employment: Assesses the status and stability of employment
*Adult = Individuals responsible for children in the family. *Employable = 1) Does not have a disability (not receiving SSI/SSD), 2) is over the age of 16, 3) is not retired, and/or 4) desires or needs employment. *Stable Employment = in a permanent (regular/dependable) position for 3 months or longer. *Benefits = earned vacation/sick/holiday pay; retirement plans; and/or health insurance. *Full-time =at least 30 hours per week
5 At least one adult has full-time stable employment AND access to employer-based benefits
4 At least one adult has full-time stable employment
3 At least one adult in the family is employed full-time AND no adult has stable employment
Prevention Line
2 At least one adult in the family has temporary or part-time employment AND no adult has full-time employment
1 All employable adults in the family are not employed.
N/I Not enough information at this time
N/A All adults are not employable
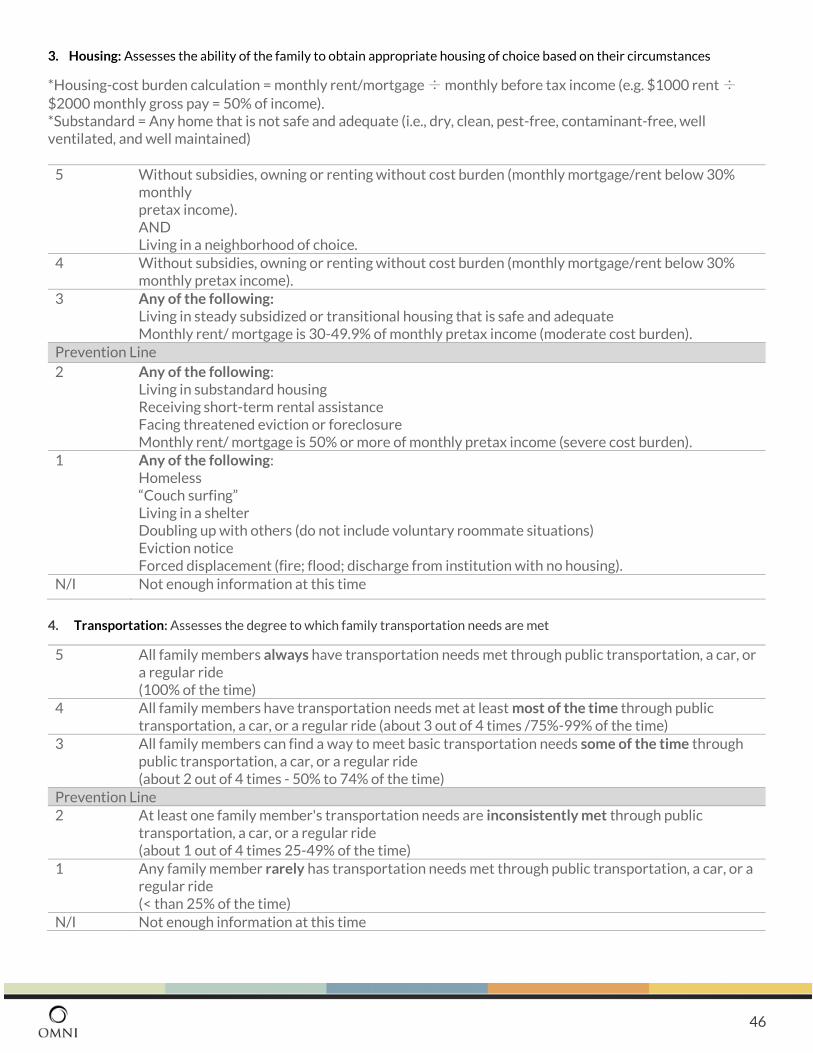
46
3. Housing: Assesses the ability of the family to obtain appropriate housing of choice based on their circumstances
*Housing-cost burden calculation = monthly rent/mortgage ÷ monthly before tax income (e.g. $1000 rent ÷
$2000 monthly gross pay = 50% of income). *Substandard = Any home that is not safe and adequate (i.e., dry, clean, pest-free, contaminant-free, well ventilated, and well maintained)
5 Without subsidies, owning or renting without cost burden (monthly mortgage/rent below 30% monthly pretax income). AND Living in a neighborhood of choice.
4 Without subsidies, owning or renting without cost burden (monthly mortgage/rent below 30% monthly pretax income).
3 Any of the following: Living in steady subsidized or transitional housing that is safe and adequate Monthly rent/ mortgage is 30-49.9% of monthly pretax income (moderate cost burden).
Prevention Line
2 Any of the following: Living in substandard housing Receiving short-term rental assistance Facing threatened eviction or foreclosure Monthly rent/ mortgage is 50% or more of monthly pretax income (severe cost burden).
1 Any of the following: Homeless “Couch surfing” Living in a shelter Doubling up with others (do not include voluntary roommate situations) Eviction notice Forced displacement (fire; flood; discharge from institution with no housing).
N/I Not enough information at this time
4. Transportation: Assesses the degree to which family transportation needs are met
5 All family members always have transportation needs met through public transportation, a car, or a regular ride (100% of the time)
4 All family members have transportation needs met at least most of the time through public transportation, a car, or a regular ride (about 3 out of 4 times /75%-99% of the time)
3 All family members can find a way to meet basic transportation needs some of the time through public transportation, a car, or a regular ride (about 2 out of 4 times - 50% to 74% of the time)
Prevention Line 2 At least one family member's transportation needs are inconsistently met through public
transportation, a car, or a regular ride (about 1 out of 4 times 25-49% of the time)
1 Any family member rarely has transportation needs met through public transportation, a car, or a regular ride (< than 25% of the time)
N/I Not enough information at this time
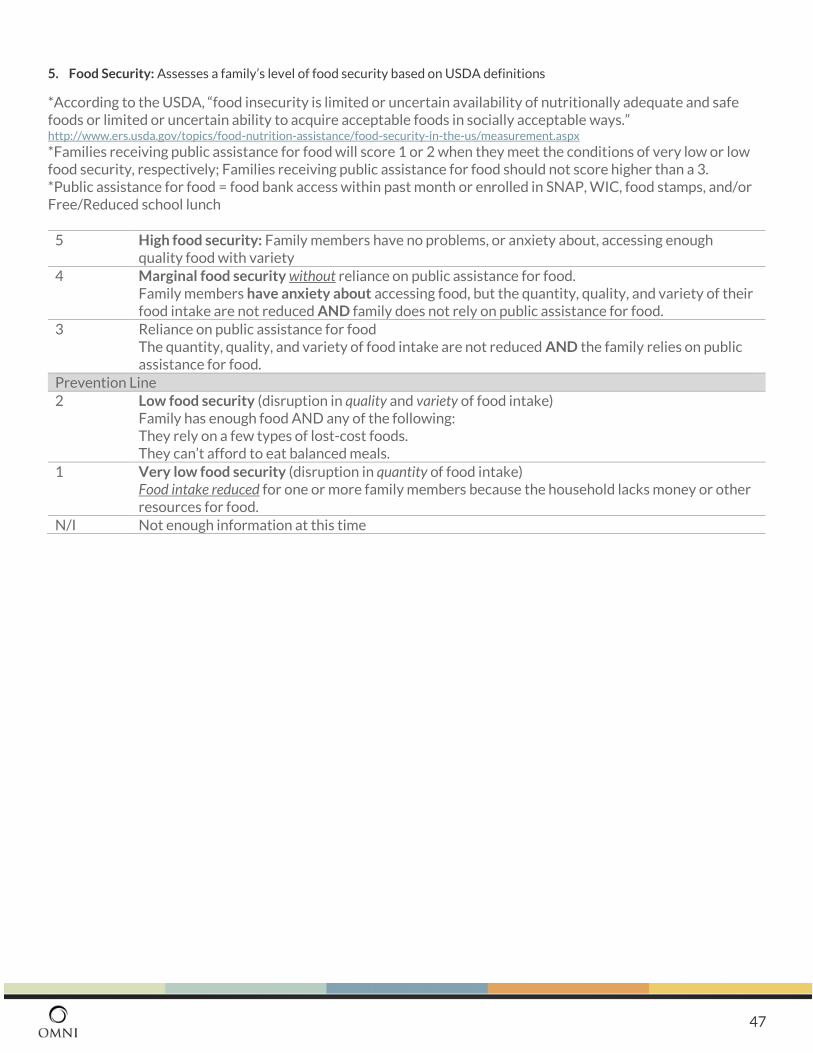
47
5. Food Security: Assesses a family’s level of food security based on USDA definitions
*According to the USDA, “food insecurity is limited or uncertain availability of nutritionally adequate and safe foods or limited or uncertain ability to acquire acceptable foods in socially acceptable ways.” http://www.ers.usda.gov/topics/food-nutrition-assistance/food-security-in-the-us/measurement.aspx *Families receiving public assistance for food will score 1 or 2 when they meet the conditions of very low or low food security, respectively; Families receiving public assistance for food should not score higher than a 3. *Public assistance for food = food bank access within past month or enrolled in SNAP, WIC, food stamps, and/or Free/Reduced school lunch
5 High food security: Family members have no problems, or anxiety about, accessing enough quality food with variety
4 Marginal food security without reliance on public assistance for food. Family members have anxiety about accessing food, but the quantity, quality, and variety of their food intake are not reduced AND family does not rely on public assistance for food.
3 Reliance on public assistance for food The quantity, quality, and variety of food intake are not reduced AND the family relies on public assistance for food.
Prevention Line 2 Low food security (disruption in quality and variety of food intake)
Family has enough food AND any of the following: They rely on a few types of lost-cost foods. They can’t afford to eat balanced meals.
1 Very low food security (disruption in quantity of food intake) Food intake reduced for one or more family members because the household lacks money or other resources for food.
N/I Not enough information at this time
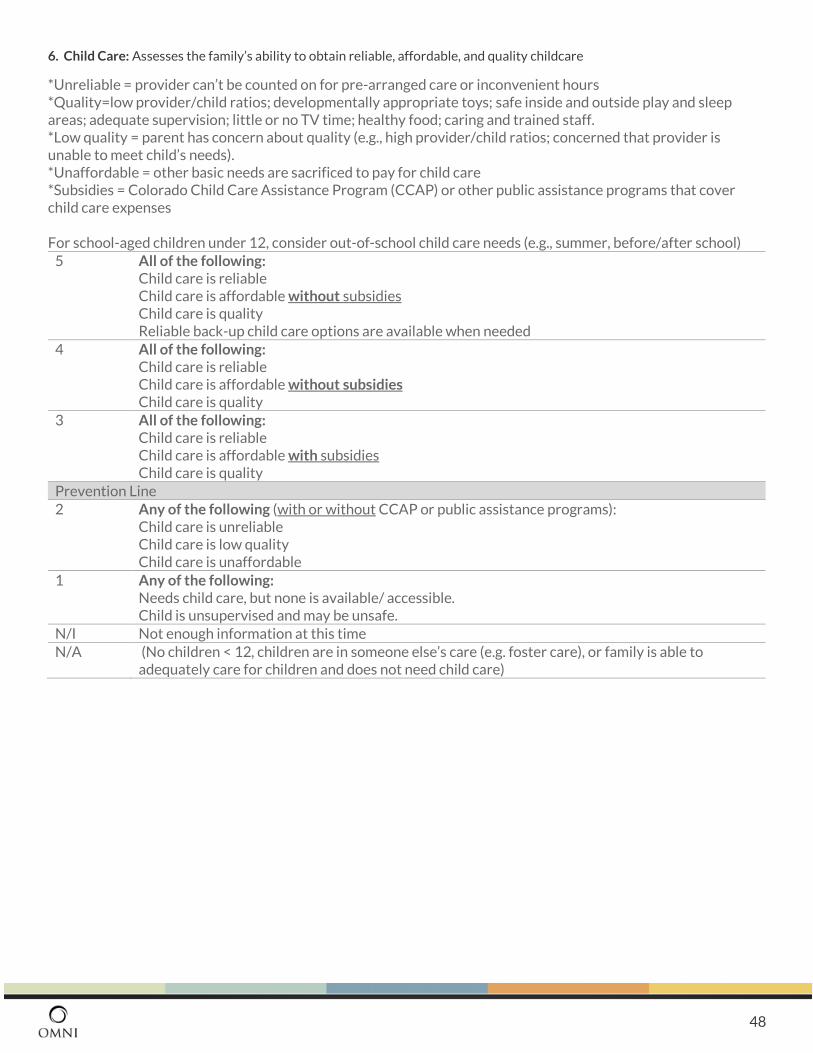
48
6. Child Care: Assesses the family’s ability to obtain reliable, affordable, and quality childcare
*Unreliable = provider can’t be counted on for pre-arranged care or inconvenient hours *Quality=low provider/child ratios; developmentally appropriate toys; safe inside and outside play and sleep areas; adequate supervision; little or no TV time; healthy food; caring and trained staff. *Low quality = parent has concern about quality (e.g., high provider/child ratios; concerned that provider is unable to meet child’s needs). *Unaffordable = other basic needs are sacrificed to pay for child care *Subsidies = Colorado Child Care Assistance Program (CCAP) or other public assistance programs that cover child care expenses For school-aged children under 12, consider out-of-school child care needs (e.g., summer, before/after school)
5 All of the following: Child care is reliable Child care is affordable without subsidies Child care is quality Reliable back-up child care options are available when needed
4 All of the following: Child care is reliable Child care is affordable without subsidies Child care is quality
3 All of the following: Child care is reliable Child care is affordable with subsidies Child care is quality
Prevention Line 2 Any of the following (with or without CCAP or public assistance programs):
Child care is unreliable Child care is low quality Child care is unaffordable
1 Any of the following: Needs child care, but none is available/ accessible. Child is unsupervised and may be unsafe.
N/I Not enough information at this time N/A (No children < 12, children are in someone else’s care (e.g. foster care), or family is able to
adequately care for children and does not need child care)
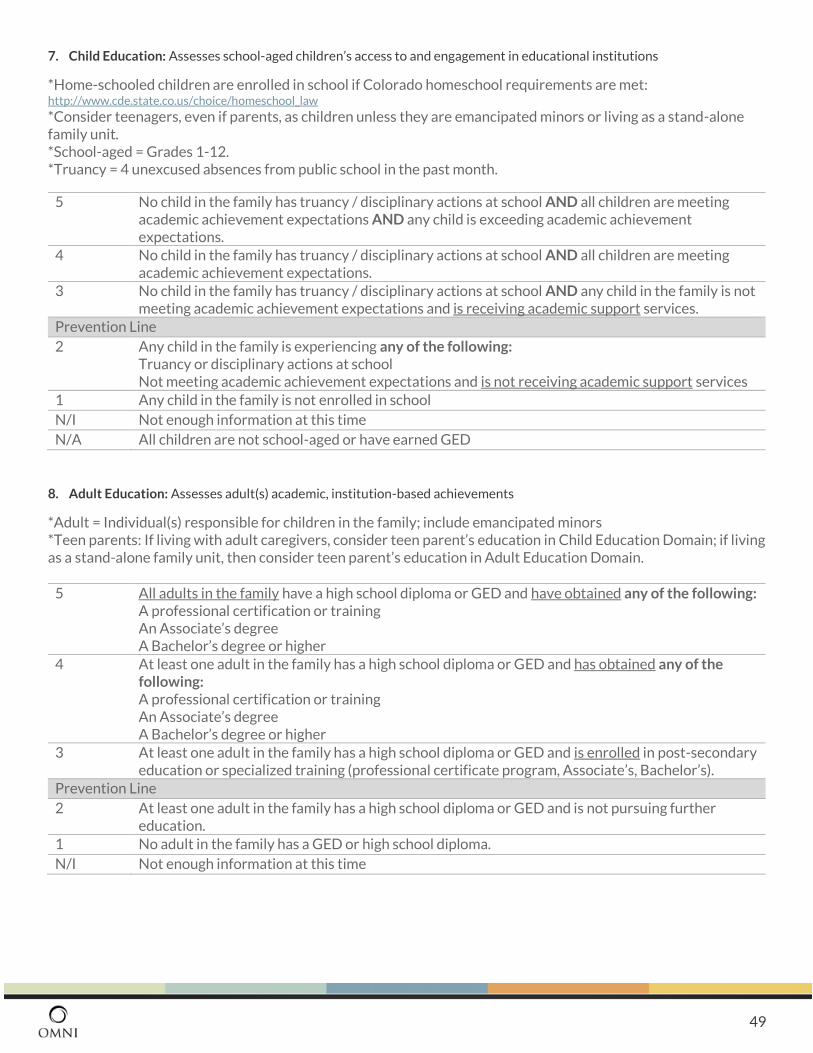
49
7. Child Education: Assesses school-aged children’s access to and engagement in educational institutions
*Home-schooled children are enrolled in school if Colorado homeschool requirements are met: http://www.cde.state.co.us/choice/homeschool_law *Consider teenagers, even if parents, as children unless they are emancipated minors or living as a stand-alone family unit. *School-aged = Grades 1-12. *Truancy = 4 unexcused absences from public school in the past month.
5 No child in the family has truancy / disciplinary actions at school AND all children are meeting academic achievement expectations AND any child is exceeding academic achievement expectations.
4 No child in the family has truancy / disciplinary actions at school AND all children are meeting academic achievement expectations.
3 No child in the family has truancy / disciplinary actions at school AND any child in the family is not meeting academic achievement expectations and is receiving academic support services.
Prevention Line
2 Any child in the family is experiencing any of the following: Truancy or disciplinary actions at school Not meeting academic achievement expectations and is not receiving academic support services
1 Any child in the family is not enrolled in school
N/I Not enough information at this time
N/A All children are not school-aged or have earned GED
8. Adult Education: Assesses adult(s) academic, institution-based achievements
*Adult = Individual(s) responsible for children in the family; include emancipated minors *Teen parents: If living with adult caregivers, consider teen parent’s education in Child Education Domain; if living as a stand-alone family unit, then consider teen parent’s education in Adult Education Domain.
5 All adults in the family have a high school diploma or GED and have obtained any of the following: A professional certification or training An Associate’s degree A Bachelor’s degree or higher
4 At least one adult in the family has a high school diploma or GED and has obtained any of the following: A professional certification or training An Associate’s degree A Bachelor’s degree or higher
3 At least one adult in the family has a high school diploma or GED and is enrolled in post-secondary education or specialized training (professional certificate program, Associate’s, Bachelor’s).
Prevention Line
2 At least one adult in the family has a high school diploma or GED and is not pursuing further education.
1 No adult in the family has a GED or high school diploma.
N/I Not enough information at this time
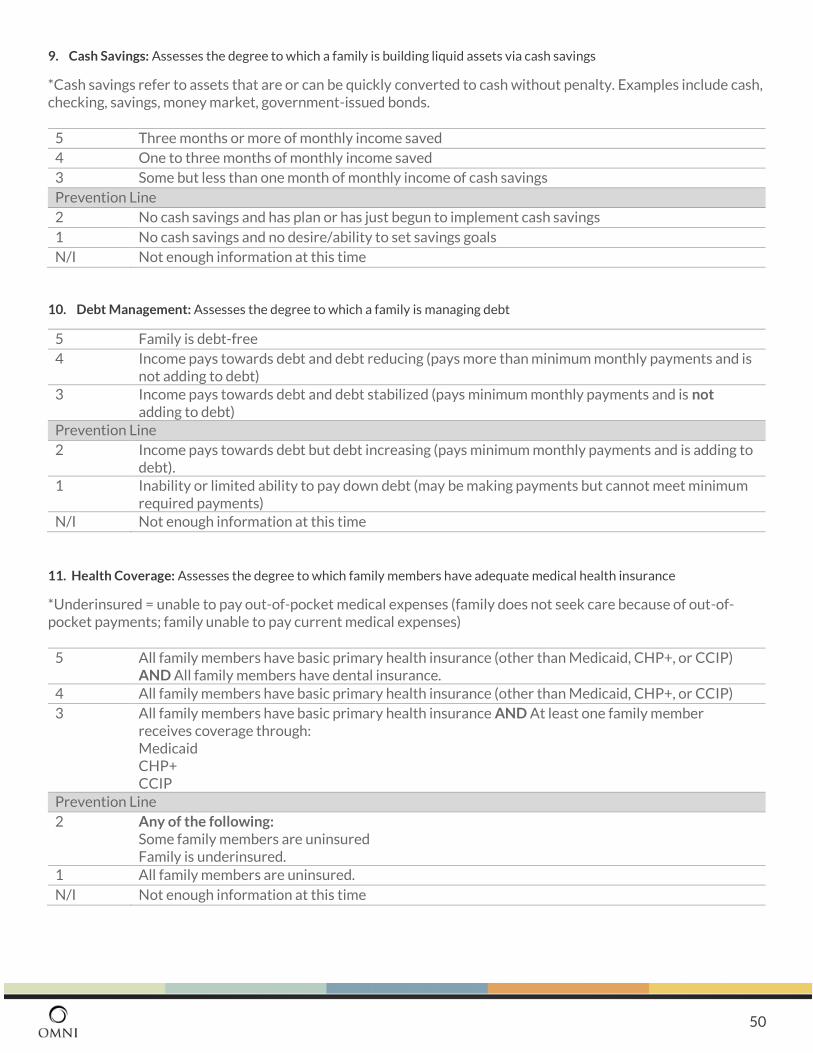
50
9. Cash Savings: Assesses the degree to which a family is building liquid assets via cash savings
*Cash savings refer to assets that are or can be quickly converted to cash without penalty. Examples include cash, checking, savings, money market, government-issued bonds.
5 Three months or more of monthly income saved
4 One to three months of monthly income saved
3 Some but less than one month of monthly income of cash savings
Prevention Line
2 No cash savings and has plan or has just begun to implement cash savings
1 No cash savings and no desire/ability to set savings goals
N/I Not enough information at this time
10. Debt Management: Assesses the degree to which a family is managing debt
5 Family is debt-free
4 Income pays towards debt and debt reducing (pays more than minimum monthly payments and is not adding to debt)
3 Income pays towards debt and debt stabilized (pays minimum monthly payments and is not adding to debt)
Prevention Line
2 Income pays towards debt but debt increasing (pays minimum monthly payments and is adding to debt).
1 Inability or limited ability to pay down debt (may be making payments but cannot meet minimum required payments)
N/I Not enough information at this time
11. Health Coverage: Assesses the degree to which family members have adequate medical health insurance
*Underinsured = unable to pay out-of-pocket medical expenses (family does not seek care because of out-of-pocket payments; family unable to pay current medical expenses)
5 All family members have basic primary health insurance (other than Medicaid, CHP+, or CCIP) AND All family members have dental insurance.
4 All family members have basic primary health insurance (other than Medicaid, CHP+, or CCIP)
3 All family members have basic primary health insurance AND At least one family member receives coverage through: Medicaid CHP+ CCIP
Prevention Line
2 Any of the following: Some family members are uninsured Family is underinsured.
1 All family members are uninsured.
N/I Not enough information at this time
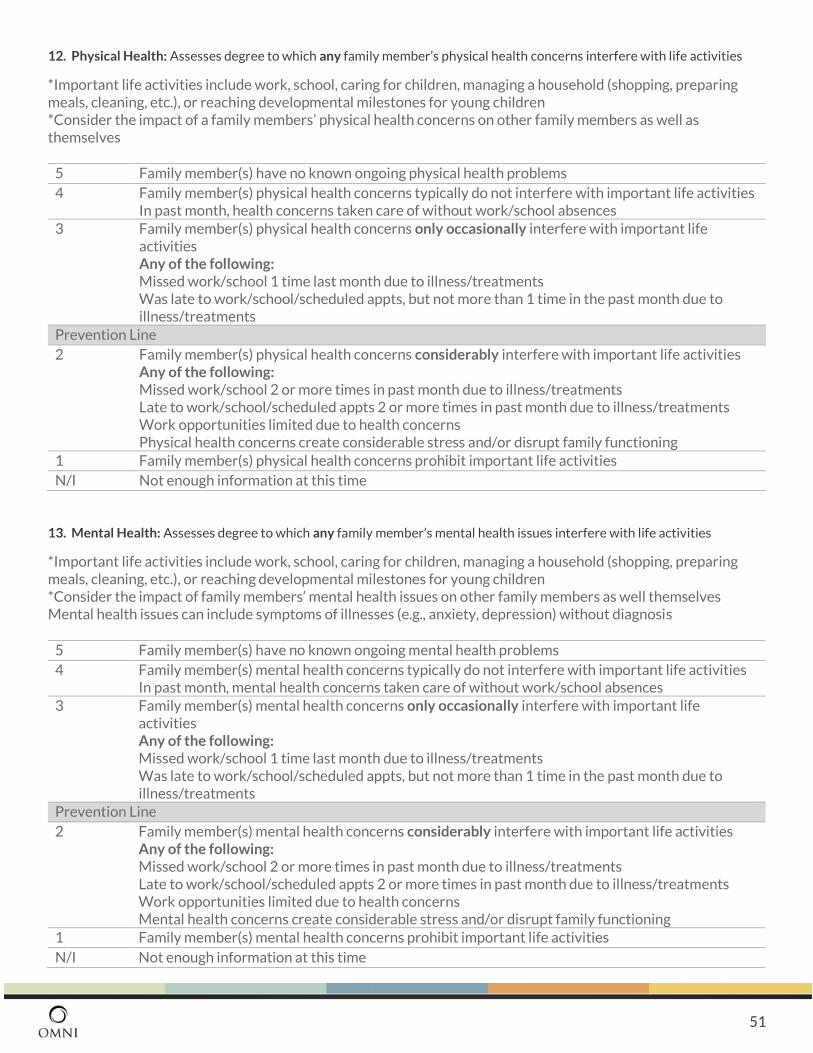
51
12. Physical Health: Assesses degree to which any family member’s physical health concerns interfere with life activities
*Important life activities include work, school, caring for children, managing a household (shopping, preparing meals, cleaning, etc.), or reaching developmental milestones for young children *Consider the impact of a family members’ physical health concerns on other family members as well as themselves
5 Family member(s) have no known ongoing physical health problems
4 Family member(s) physical health concerns typically do not interfere with important life activities In past month, health concerns taken care of without work/school absences
3 Family member(s) physical health concerns only occasionally interfere with important life activities Any of the following: Missed work/school 1 time last month due to illness/treatments Was late to work/school/scheduled appts, but not more than 1 time in the past month due to illness/treatments
Prevention Line
2 Family member(s) physical health concerns considerably interfere with important life activities Any of the following: Missed work/school 2 or more times in past month due to illness/treatments Late to work/school/scheduled appts 2 or more times in past month due to illness/treatments Work opportunities limited due to health concerns Physical health concerns create considerable stress and/or disrupt family functioning
1 Family member(s) physical health concerns prohibit important life activities
N/I Not enough information at this time
13. Mental Health: Assesses degree to which any family member’s mental health issues interfere with life activities
*Important life activities include work, school, caring for children, managing a household (shopping, preparing meals, cleaning, etc.), or reaching developmental milestones for young children *Consider the impact of family members’ mental health issues on other family members as well themselves Mental health issues can include symptoms of illnesses (e.g., anxiety, depression) without diagnosis
5 Family member(s) have no known ongoing mental health problems
4 Family member(s) mental health concerns typically do not interfere with important life activities In past month, mental health concerns taken care of without work/school absences
3 Family member(s) mental health concerns only occasionally interfere with important life activities Any of the following: Missed work/school 1 time last month due to illness/treatments Was late to work/school/scheduled appts, but not more than 1 time in the past month due to illness/treatments
Prevention Line
2 Family member(s) mental health concerns considerably interfere with important life activities Any of the following: Missed work/school 2 or more times in past month due to illness/treatments Late to work/school/scheduled appts 2 or more times in past month due to illness/treatments Work opportunities limited due to health concerns Mental health concerns create considerable stress and/or disrupt family functioning
1 Family member(s) mental health concerns prohibit important life activities
N/I Not enough information at this time
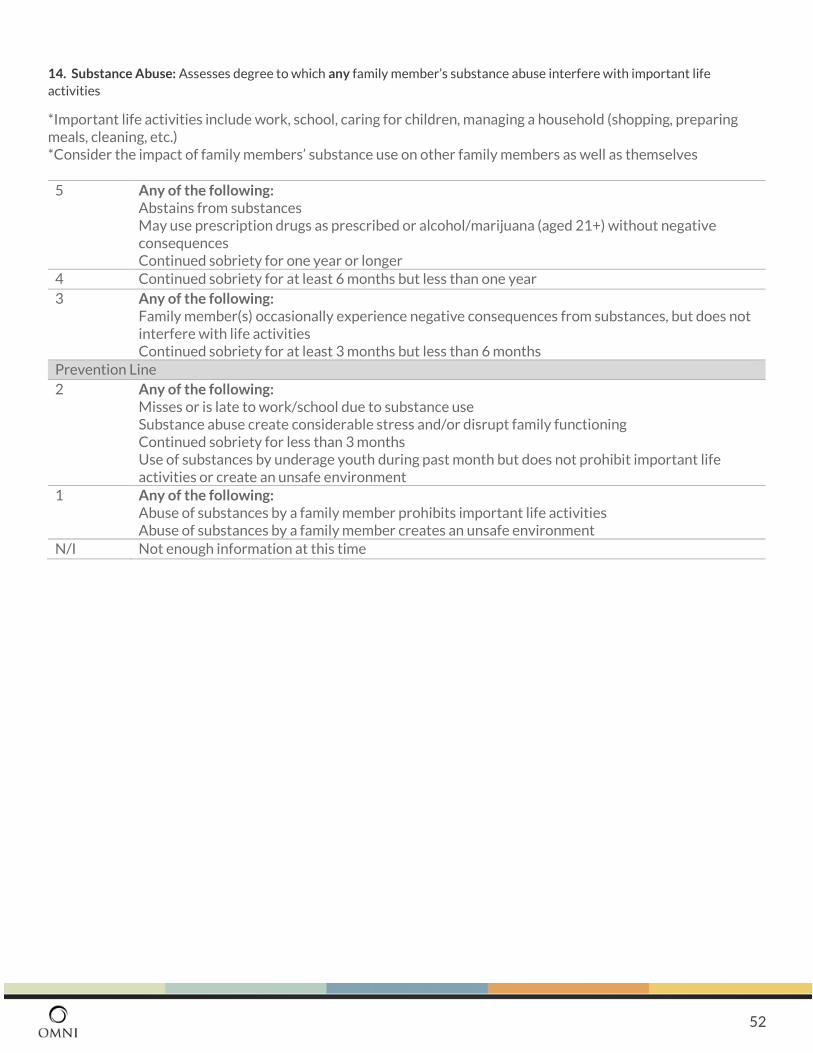
52
14. Substance Abuse: Assesses degree to which any family member’s substance abuse interfere with important life
activities
*Important life activities include work, school, caring for children, managing a household (shopping, preparing meals, cleaning, etc.) *Consider the impact of family members’ substance use on other family members as well as themselves
5 Any of the following: Abstains from substances May use prescription drugs as prescribed or alcohol/marijuana (aged 21+) without negative consequences Continued sobriety for one year or longer
4 Continued sobriety for at least 6 months but less than one year
3 Any of the following: Family member(s) occasionally experience negative consequences from substances, but does not interfere with life activities Continued sobriety for at least 3 months but less than 6 months
Prevention Line
2 Any of the following: Misses or is late to work/school due to substance use Substance abuse create considerable stress and/or disrupt family functioning Continued sobriety for less than 3 months Use of substances by underage youth during past month but does not prohibit important life activities or create an unsafe environment
1 Any of the following: Abuse of substances by a family member prohibits important life activities Abuse of substances by a family member creates an unsafe environment
N/I Not enough information at this time
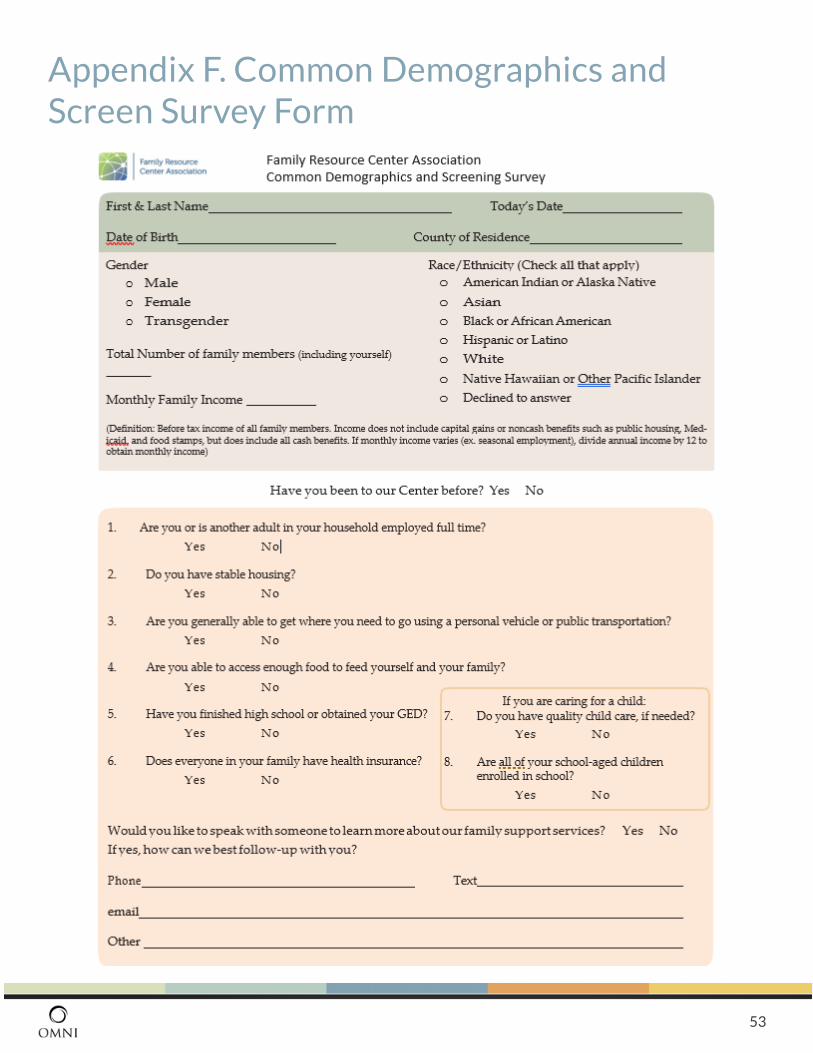
53
Appendix F. Common Demographics and Screen Survey Form