Embed Size (px)
Citation preview

MIGRATION PATTERNS OF ADULT FEMALE MULE DEER IN RESPONSE TO NATURAL-GAS DEVELOPMENT
Patrick Lendrum, ISU; Chuck Anderson, CPW; Terry Bowyer & John Kie, ISU; Jon Jenks, SDSU

Mule Deer Migration
Temperate regions
►Low-elevation winter ranges
►High-elevation summer ranges
►Spring
Winter to summer range
►Autumn
Summer to winter range

►Traditional routes Used for many
generations
Seasonally and yearly
►Travel great distances Average 35-55 km
~ 60 km


Objectives
►Map spring migration routes from
2008 to 2010
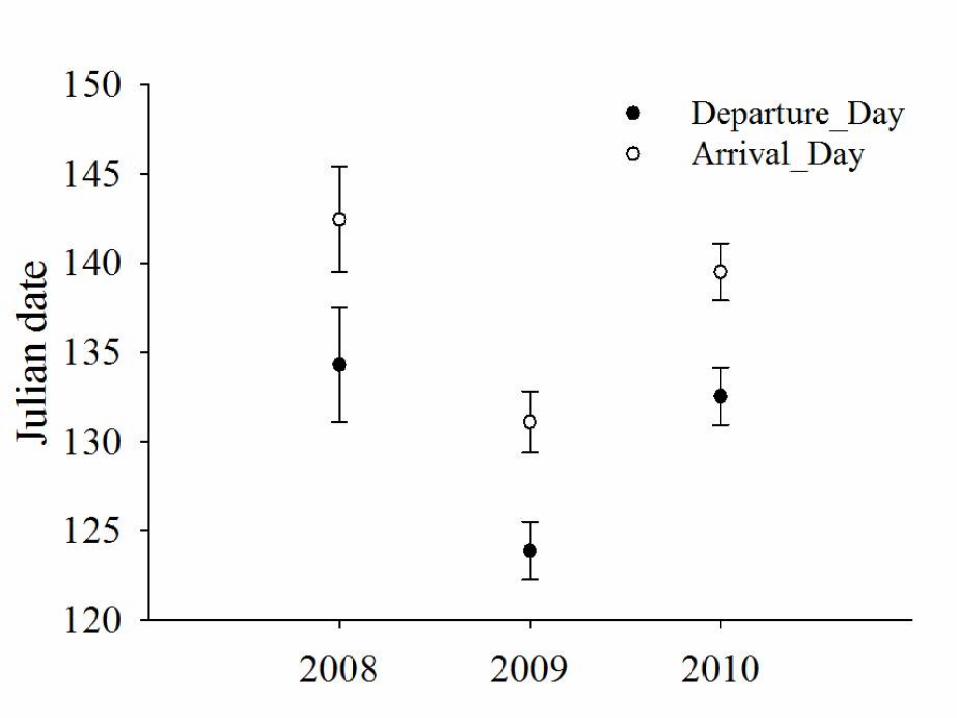
►Determine timing and synchrony
Departure and arrival
►Resource selection Environmental and landscape alterations

n =205 adult female mule deer


0
0.5
1
1.5
2
2.5
3
North Ridge North Magnolia Ryan Gulch South Magnolia
Nu
mb
er
pa
ds/h
om
e r
an
ge


Timing of migration…
PK


► Snow depth
► Spring green-up
varied among years
highly synchronous across study areas within
years
► Deer in better condition departed winter
range earlier.
Factors Influencing Migration Timing

120 125 130 135 140 145 150
Snow
Depth
(cm
)
0
20
40
60
80
100
120
140
2008
2009
2010


Resource-selection Functions
►Use vs. availability GPS locations vs. random locations
►Step length
Distance between 2 consecutive locations
► Turning angle
Angle between steps
► Conditional logistic regression


Resource Selection
Environmental
►Elevation
►Slope
►Aspect
►Terrain ruggedness
►Vegetation type
Landscape Alterations
►Roads
►Well pads
►Pipelines


Od
ds
rati
o
0.00
1.00
2.00
3.00
4.00
5.00
North East West
Od
ds
rati
o
0.00
1.00
2.00
3.00
4.00
5.00
North Ridge (Low)
North Magnolia (Medium-low)
Ryan Gulch (Medium-high)
South Magnolia (High)
A)
B)

Herbaceous PJ Forest Barren Riparian
Odd
s ra
tio
0.0
0.2
0.4
0.6
0.8
1.0
1.2
1.4
Odd
s ra
tio
0.0
0.2
0.4
0.6
0.8
1.0
1.2
1.4
North Ridge (Low)
North Magnolia (Medium-low)
Ryan Gulch (Medium-high)
South Magnolia (High)
A)
B)
Day
Night


Migration Summary ►Mule deer moved more quickly through the most
developed areas
► Selected habitats with increased cover.
►Avoided roads except in the most developed area
High road densities may preclude avoidance
► Selected areas close to well pads
Predator avoidance? elk competition? foraging opportunities?

Conclusion
Deer may avoid disturbance where feasible or increase their rate of travel through highly developed landscapes where the energetic cost of avoidance may be too high

Acknowledgements
Advisors
► Dr. Terry Bowyer - ISU
► Dr. Chuck Anderson - CPW
► Dr. John Kie - ISU
► Dr. Jonathan Jenks - SDSU
Funding
Colorado Parks and Wildlife, Federal Aid in Wildlife Restoration, Colorado Mule Deer Association, Colorado Mule Deer Foundation, Colorado Oil and Gas Conservation Commission, EnCana Corp., Williams Production LMT CO., Exxon Mobil Production Co., Shell Petroleum, Marathon Oil Corp.
Additional Support
Colorado Parks and Wildlife, Quicksilver Air Inc., Coulter Aviation, White River Bureau of Land Management, U.S. Forest Service

Questions?

SD Min. Max. SD Min. Max.
Elevation (m)
North Ridge 2,158.94 184.20 1,764.38 2,795.23 2,261.61 266.30 1,721.67 3,344.86
North Magnolia 2,297.23 148.20 1,912.75 2,838.41 2,300.51 253.50 1,757.44 3,428.61
Ryan Gulch 2,269.04 172.40 1,871.76 2,799.31 2,255.67 207.70 1,511.37 3,075.65
South Magnolia 2,314.25 169.90 1,915.48 2,745.73 2,269.74 214.00 1,520.88 2,812.14
Slope (%)
North Ridge 11.21 6.80 0.09 39.38 12.66 8.10 0.00 50.50
North Magnolia 11.86 7.30 0.13 40.22 13.18 8.30 0.00 62.58
Ryan Gulch 10.91 6.90 0.03 36.63 14.04 8.90 0.00 63.26
South Magnolia 11.96 6.80 0.01 34.67 15.45 9.50 0.00 69.88
Terrain ruggedness
North Ridge 0.07 0.13 0.00 0.88 0.07 0.13 0.00 0.97
North Magnolia 0.08 0.14 0.00 0.96 0.08 0.14 0.00 0.96
Ryan Gulch 0.09 0.10 0.00 0.87 0.10 0.15 0.00 0.93
South Magnolia 0.09 0.10 0.00 0.84 0.10 0.15 0.00 0.97
Used locations Random locationsVariables and
Study area x x
SD Min. Max. SD Min. Max.
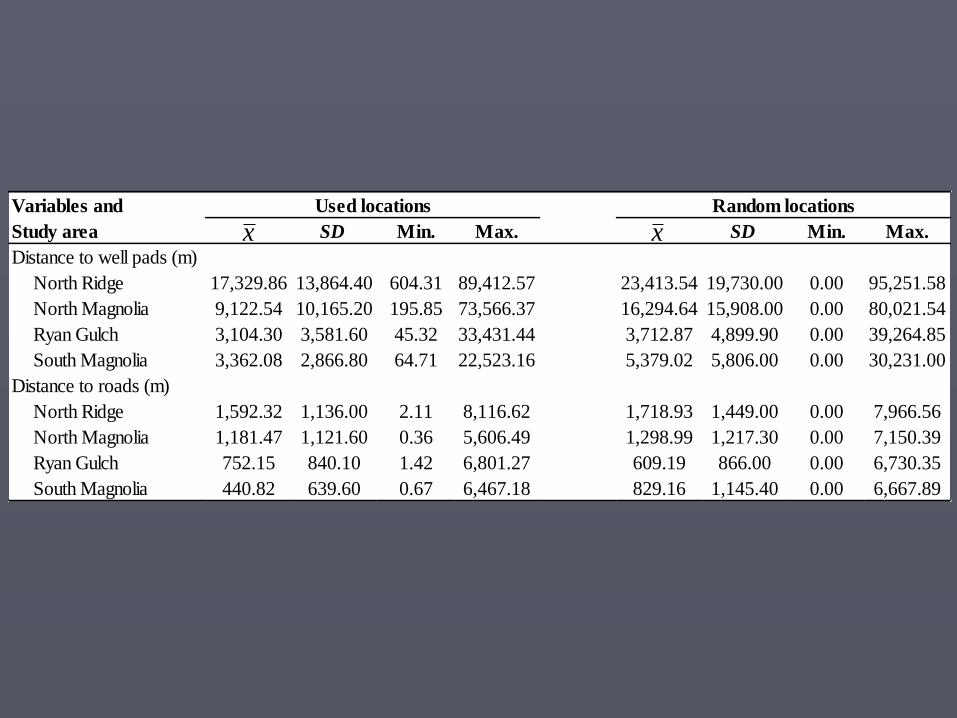
Distance to well pads (m)
North Ridge 17,329.86 13,864.40 604.31 89,412.57 23,413.54 19,730.00 0.00 95,251.58
North Magnolia 9,122.54 10,165.20 195.85 73,566.37 16,294.64 15,908.00 0.00 80,021.54
Ryan Gulch 3,104.30 3,581.60 45.32 33,431.44 3,712.87 4,899.90 0.00 39,264.85
South Magnolia 3,362.08 2,866.80 64.71 22,523.16 5,379.02 5,806.00 0.00 30,231.00
Distance to roads (m)
North Ridge 1,592.32 1,136.00 2.11 8,116.62 1,718.93 1,449.00 0.00 7,966.56
North Magnolia 1,181.47 1,121.60 0.36 5,606.49 1,298.99 1,217.30 0.00 7,150.39
Ryan Gulch 752.15 840.10 1.42 6,801.27 609.19 866.00 0.00 6,730.35
South Magnolia 440.82 639.60 0.67 6,467.18 829.16 1,145.40 0.00 6,667.89
Variables and
Study area
Used locations Random locations
x x