Embed Size (px)
Citation preview
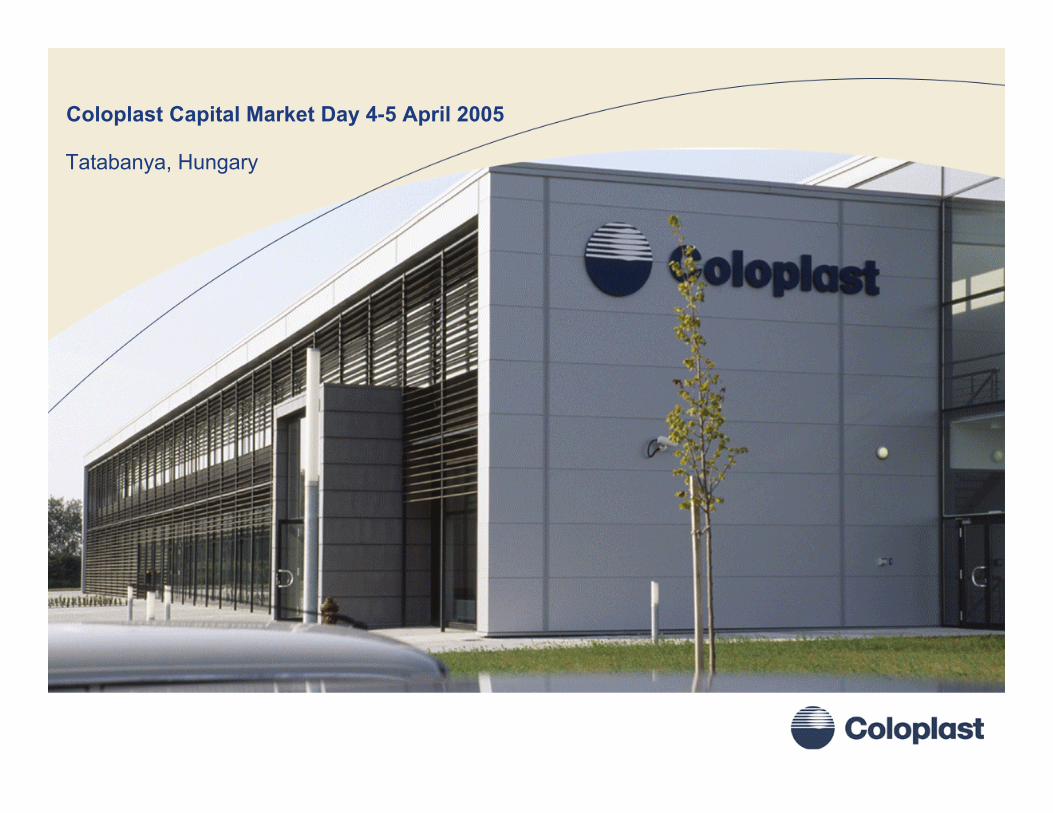
Coloplast Capital Market Day 4-5 April 2005
Tatabanya, HungaryColoplast Capital Market Day 4-5 April 2005
Tatabanya, Hungary
1
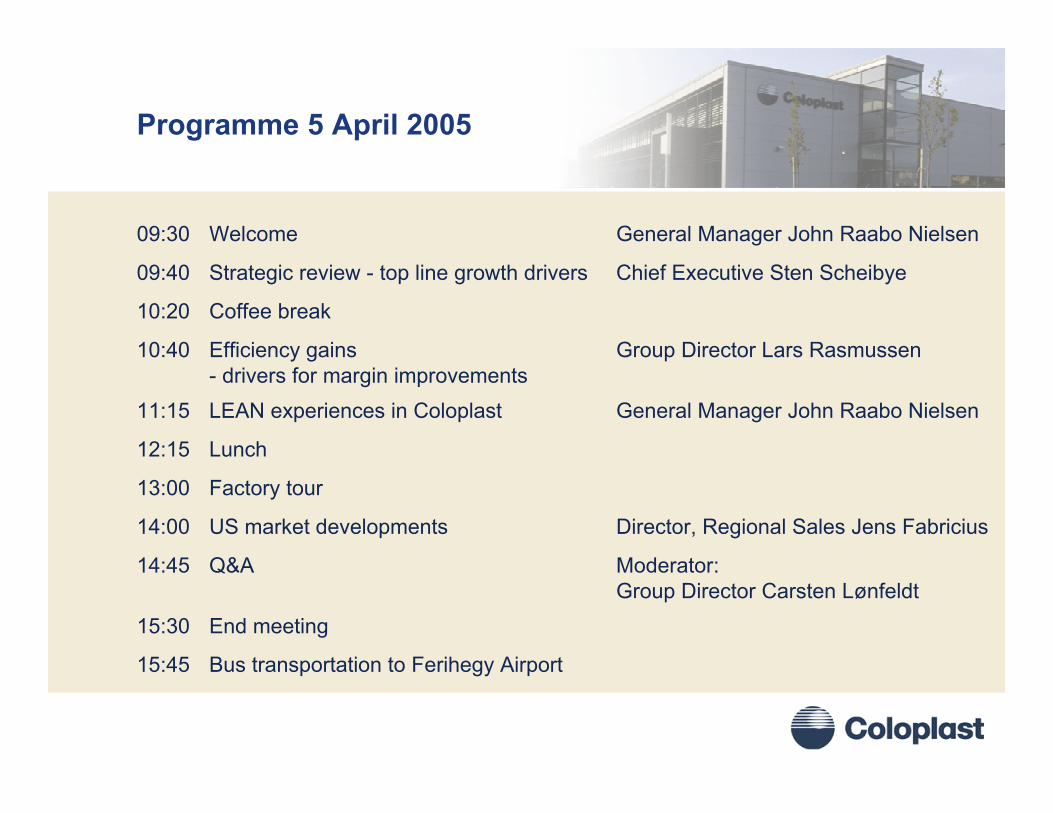
Programme 5 April 2005
Bus transportation to Ferihegy Airport15:45
End meeting15:30
Moderator: Group Director Carsten Lønfeldt
Q&A14:45
Director, Regional Sales Jens FabriciusUS market developments14:00
Factory tour13:00
Lunch12:15
General Manager John Raabo NielsenLEAN experiences in Coloplast11:15
Group Director Lars RasmussenEfficiency gains - drivers for margin improvements
10:40
Coffee break 10:20
Chief Executive Sten ScheibyeStrategic review - top line growth drivers09:40
General Manager John Raabo NielsenWelcome09:30

Coloplast Capital Market Day 4-5 April 2005
Tatabanya, Hungary
Coloplast strategic review
Sten Scheibye, CEO

3
Throughout the world we wish, within our selected business areas, to be the preferred source of medical devices and associated services, contributing to a better quality of life.
By being close to customers we fulfil their needs with innovative, high quality solutions. Through empathy, responsiveness and dependability we seek to earn their loyalty.
Our culture attracts and nourishes individuals who are energetic, committed and have passion for our business.
We respect differences and pledge to act responsibly in social, environmental and business contexts.
By striving to be best in our business we achieve growth and increased value for our customers, employees and shareholders.
Coloplast’s Mission
Business platform
Customers
Employees
Society
Shareholders

4
Coloplast’s Vision
Customer promiseAn active life with highest possible quality of life for people with special needs
Employee promise A challenging workplace with plenty of opportunities
Society promiseResponsible behaviour in all matters
Balanced value creation for all key stakeholders
Long term shareholder return

5
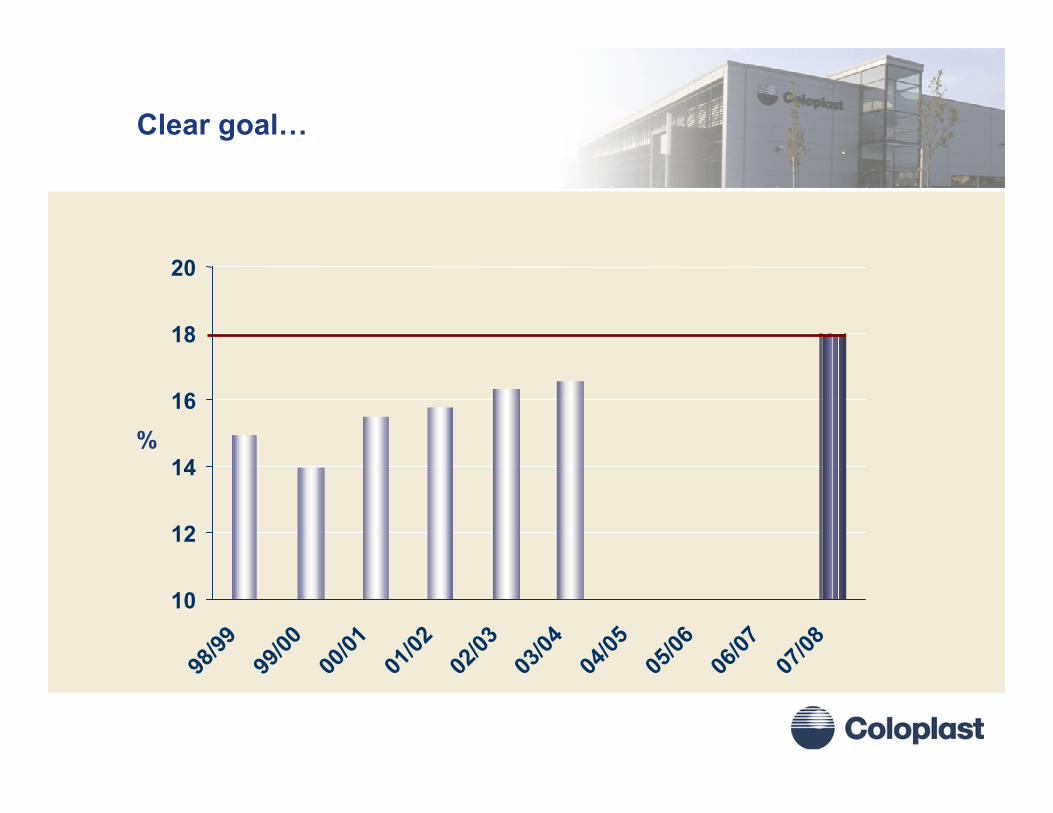
Expectations and targets
• Sales growth of 8-9% inlocal currencies
• Profit margin 15-16%
• Sales exceeding DKK 9 billionthrough organic growth
• Profit margin (EBIT) reaching 18%• ROAIC of 20%• Acquisitions and divestments
2004/05
2008
6
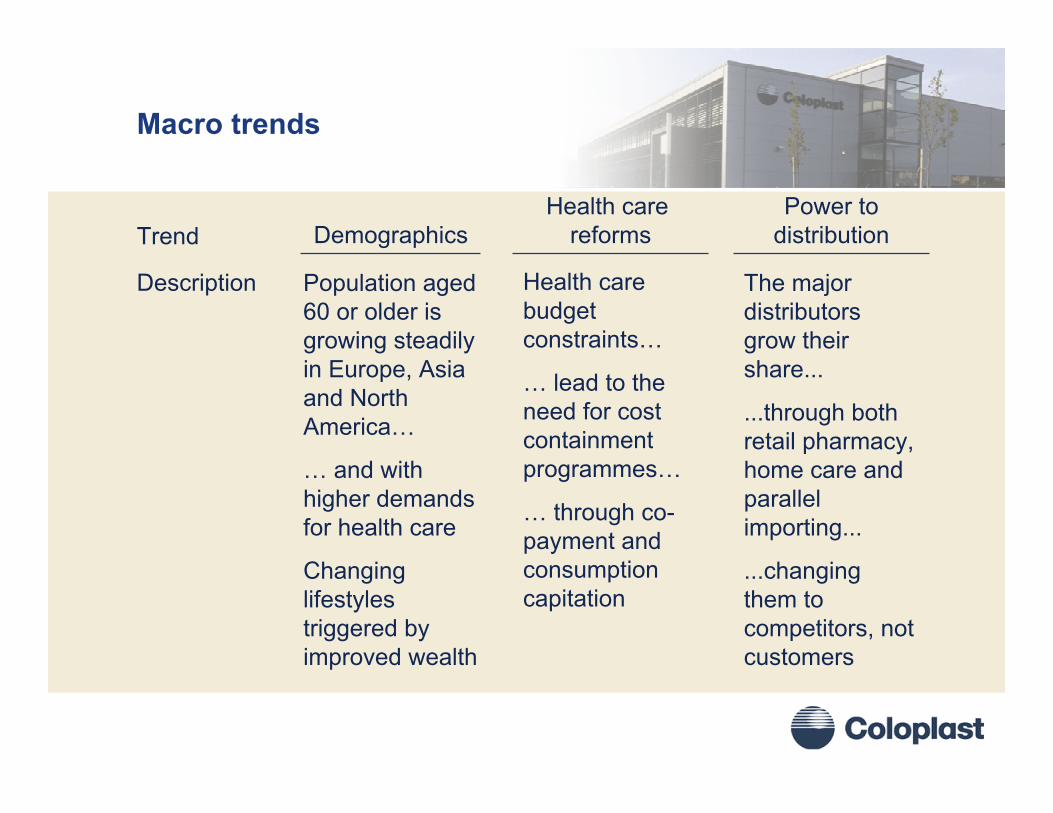
Macro trends
Trend
Description
Demographics
Population aged60 or older is growing steadily in Europe, Asia and North America…
… and with higher demands for health care
Changing lifestyles triggered by improved wealth
Health care reforms
Health care budget constraints…
… lead to the need for cost containment programmes…
… through co-payment and consumption capitation
Power todistribution
The major distributors grow their share...
...through both retail pharmacy, home care and parallel importing...
...changing them to competitors, not customers
7
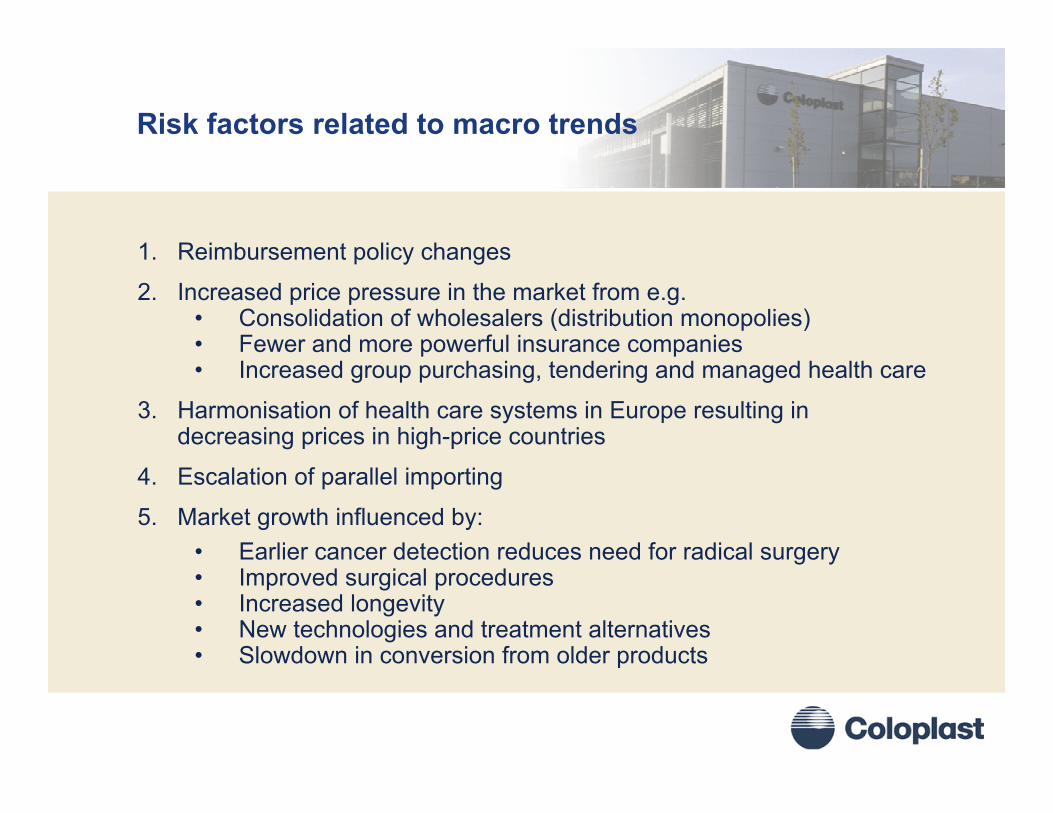
Risk factors related to macro trends
1. Reimbursement policy changes
2. Increased price pressure in the market from e.g.• Consolidation of wholesalers (distribution monopolies)• Fewer and more powerful insurance companies• Increased group purchasing, tendering and managed health care
3. Harmonisation of health care systems in Europe resulting in decreasing prices in high-price countries
4. Escalation of parallel importing
5. Market growth influenced by:• Earlier cancer detection reduces need for radical surgery• Improved surgical procedures• Increased longevity• New technologies and treatment alternatives• Slowdown in conversion from older products

8
…that must be addressed appropriately
1. Reimbursement• Monitor/influence policy• Product design• Emphasis on clinical
documentation
2. Price pressure• Observe market trends• Improve tendering capabilities
3. Harmonisation of health care systems• Monitor development
4. Parallel imports• Monitor importers’ activities• Price strategy coordination• Product and packaging
diversification
5. Slowdown in market growth• Focus on growth segments• Search for new technologies• Low cost production

9
Changing power among key customers…
• The payer
• The end customer
• The health care professional
10
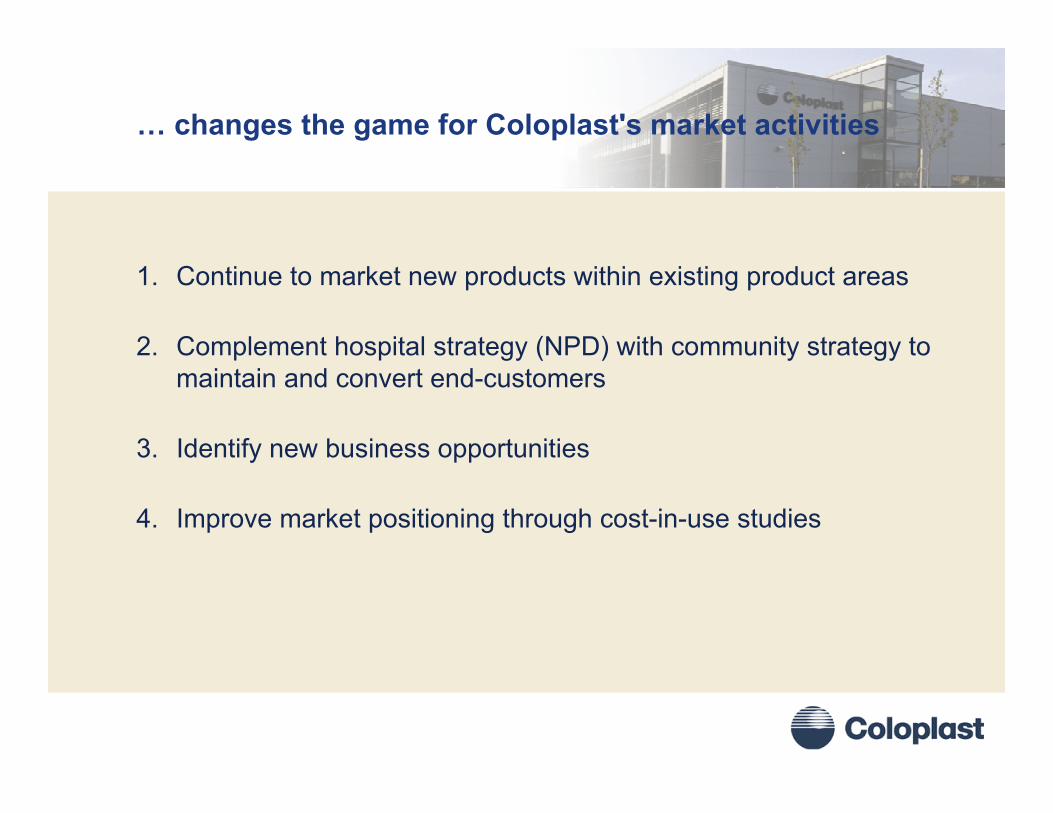
… changes the game for Coloplast's market activities
1. Continue to market new products within existing product areas
2. Complement hospital strategy (NPD) with community strategy to maintain and convert end-customers
3. Identify new business opportunities
4. Improve market positioning through cost-in-use studies

11
1. Innovation- Launch of new products within existing product areas
1997/98 2000/011998/99 1999/00 2001/02 2002/03 2003/04
Pas
te S
trip
Ass
ura
HO
SN
ew A
ssur
a 1p
, clo
sed
New
Ass
ura
2p, c
lose
d an
d op
enA
ssur
a O
pen
bags
with
filte
rEa
siC
ath
Luer
Lock
Eas
iCat
h S
etN
ew A
dhes
ive
for S
ec+
Uris
heat
hsP
urilo
nS
tabi
lon
Sac
ral D
ress
ing
Circ
Aid
Assu
ra O
pen
bags
with
Hid
e-aw
ayC
onve
en S
ec+
350
ml
Con
veen
Sec
+ 75
0 m
lEa
siC
ath
Dila
tatio
n C
athe
ter
Con
veen
Xpec
tN
ew U
rine
Bag
Asso
rtmen
tC
ontre
lle-M
rk. I
IVa
cuSe
alB
iata
inB
iata
in A
dhes
ive
Exte
nded
Wea
rlife
Adh
esiv
eSp
eedi
Cat
hM
ovee
n Sy
phon
Mov
een
Nig
ht B
agC
omfe
el F
ilm 2
000
Con
treet
Hyd
roco
lloid
Alio
neTE
RA
, UR
O m
inic
ap, U
RO
Nig
ht b
agAl
ione
Non
Adh
esiv
eC
onve
x Li
ght,
2pM
ovee
nKn
ee B
agM
ovee
nLe
g Ba
gC
onve
x Li
ght,
1pC
ontre
et F
oam
Con
treet
Foa
m A
dhes
ive
UR
O M
ulti
Cha
mbe
r bag
, 2p
Eas
iflex
Ass
ura
Dua
l Filt
erR
elee
n N
FS
eaS
orb
Soft
Easi
flex
Con
vex
Ligh
tE
asi-c
lose
wid
e ou
tlet
1 p
UR
O M
ultic
ham
ber
Eas
iflex
Pae
diat
ricP
eris
teen
Ana
l Irri
gatio
nSp
eedi
Cat
h C
ompa
ctM
ovee
nPr
otec
tion
Alio
ne C
harc
oal
Con
treet
Sac
ral
Con
treet
Hee
l
Nordic Vaccine Technology A/SRanier Technology Ltd.

12
2. Community strategy- Charter Roadshow
A mobile truck that can be converted into:• Showroom• Waiting room• Two private consultation rooms

13
2. Charter Roadshow - Direct dialogue with end-customers
• Direct dialogue with users in their own environment
• Ideal way to introduce new products
• Supportive of Coloplast’s community strategy- conversion and retention
of users
14
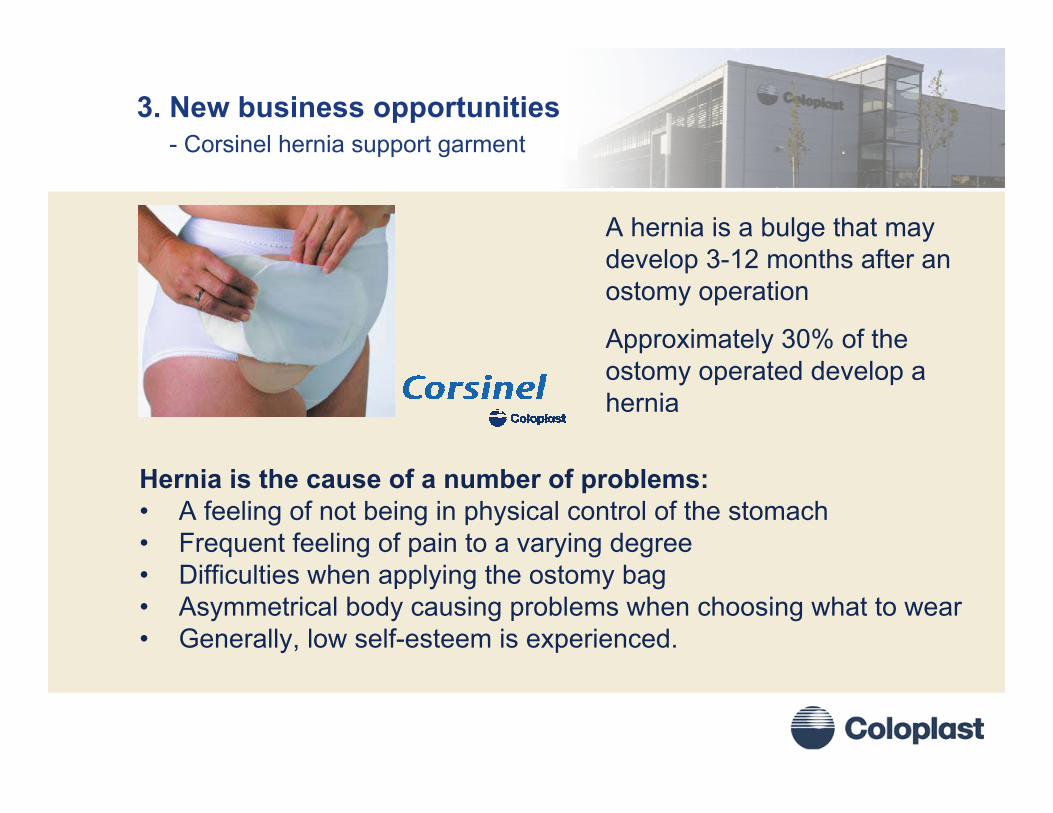
Hernia is the cause of a number of problems:• A feeling of not being in physical control of the stomach• Frequent feeling of pain to a varying degree• Difficulties when applying the ostomy bag• Asymmetrical body causing problems when choosing what to wear• Generally, low self-esteem is experienced.
3. New business opportunities- Corsinel hernia support garment
A hernia is a bulge that may develop 3-12 months after an ostomy operation
Approximately 30% of the ostomy operated develop a hernia
15
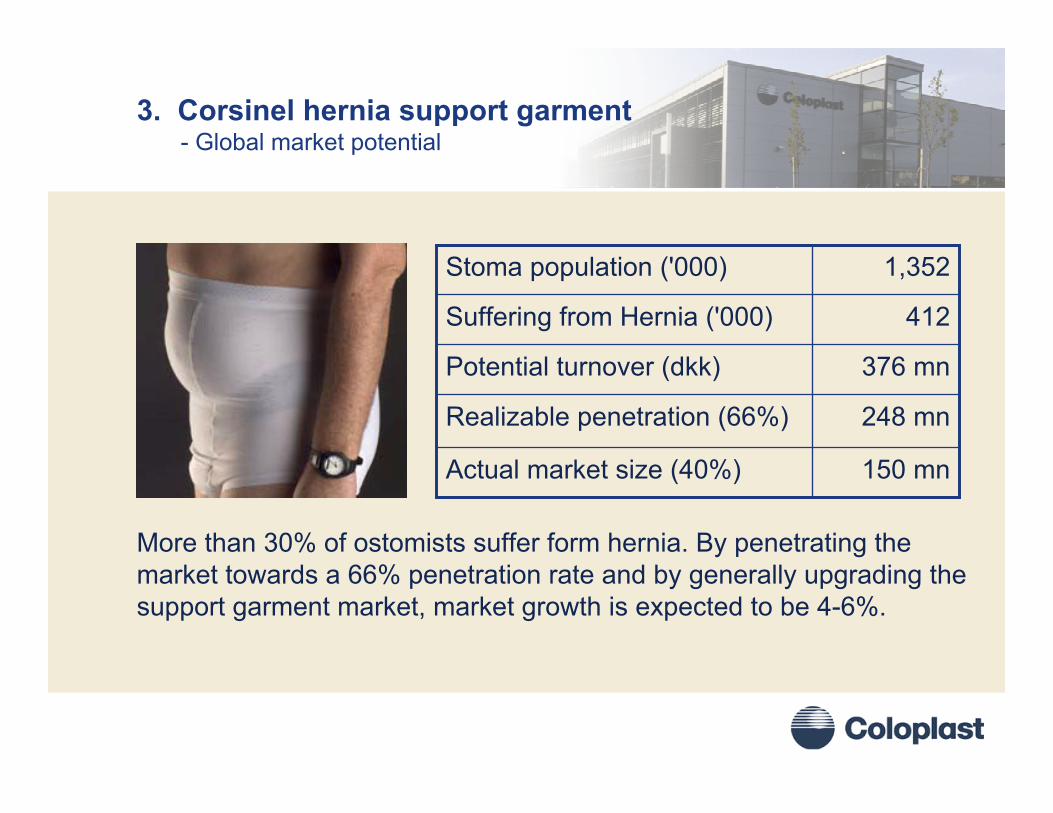
150 mnActual market size (40%)
248 mnRealizable penetration (66%)
376 mnPotential turnover (dkk)
412Suffering from Hernia ('000)
1,352Stoma population ('000)
More than 30% of ostomists suffer form hernia. By penetrating the market towards a 66% penetration rate and by generally upgrading the support garment market, market growth is expected to be 4-6%.
3. Corsinel hernia support garment- Global market potential
16
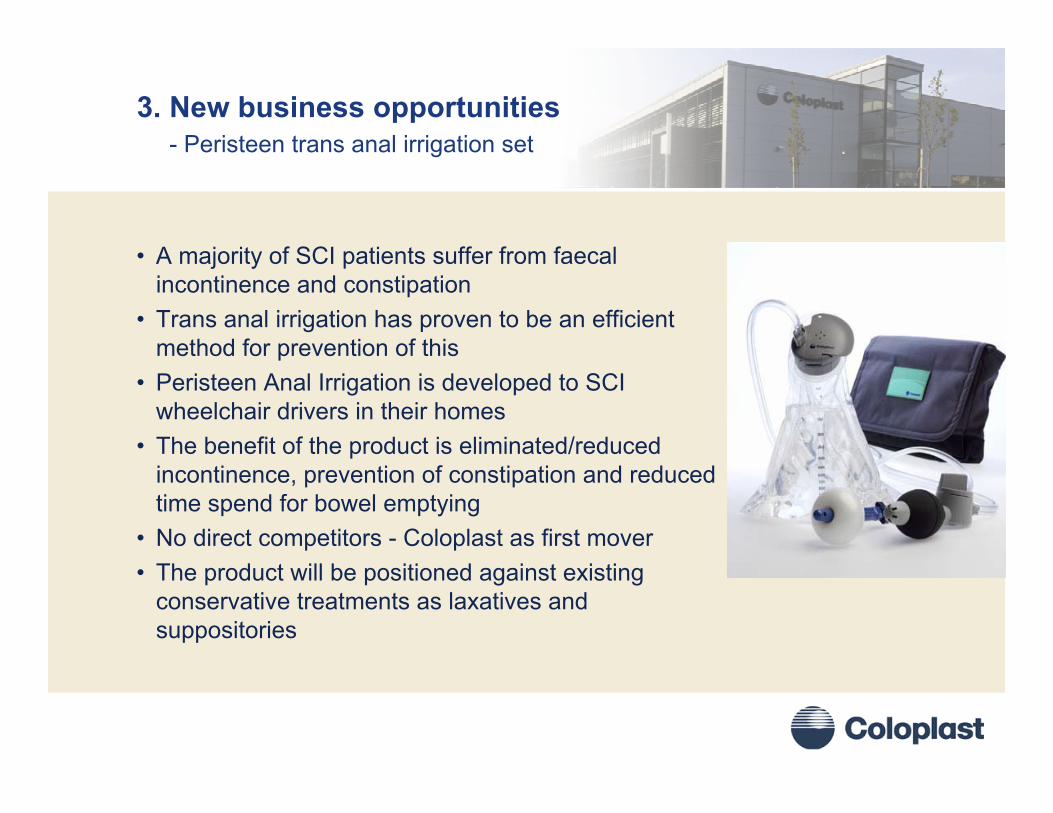
3. New business opportunities- Peristeen trans anal irrigation set
• A majority of SCI patients suffer from faecal incontinence and constipation
• Trans anal irrigation has proven to be an efficient method for prevention of this
• Peristeen Anal Irrigation is developed to SCI wheelchair drivers in their homes
• The benefit of the product is eliminated/reduced incontinence, prevention of constipation and reduced time spend for bowel emptying
• No direct competitors - Coloplast as first mover• The product will be positioned against existing
conservative treatments as laxatives and suppositories
17
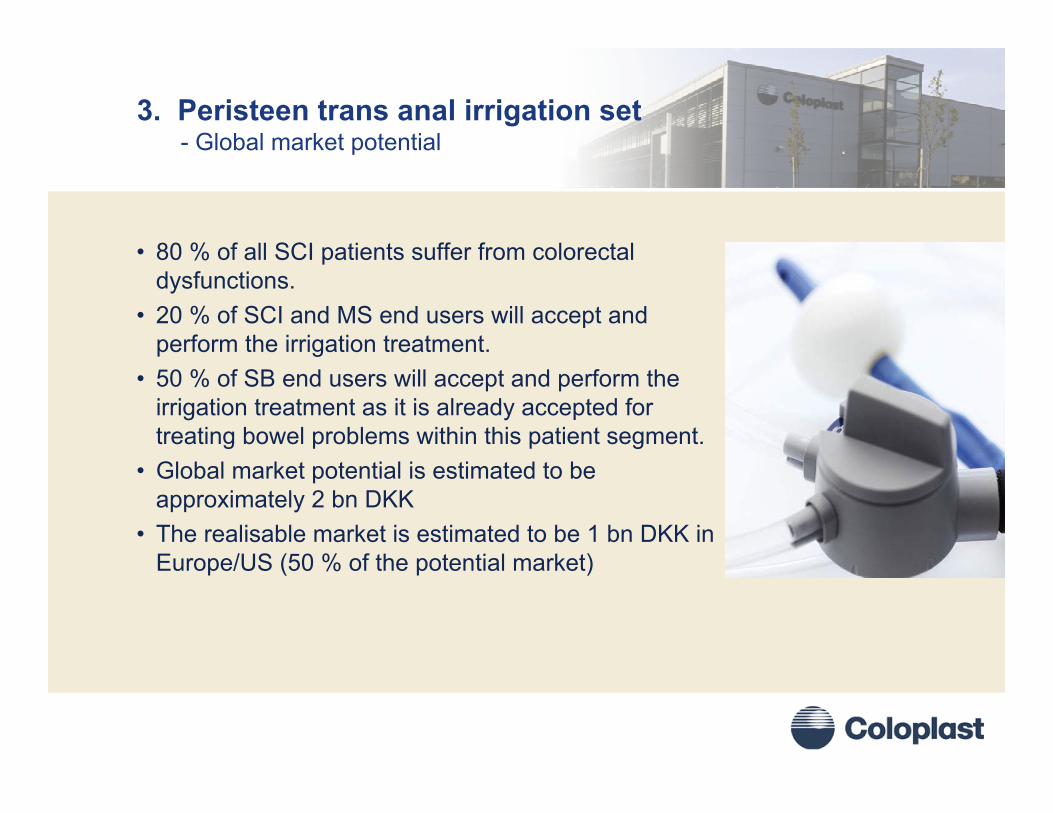
3. Peristeen trans anal irrigation set- Global market potential
• 80 % of all SCI patients suffer from colorectal dysfunctions.
• 20 % of SCI and MS end users will accept and perform the irrigation treatment.
• 50 % of SB end users will accept and perform the irrigation treatment as it is already accepted for treating bowel problems within this patient segment.
• Global market potential is estimated to be approximately 2 bn DKK
• The realisable market is estimated to be 1 bn DKK in Europe/US (50 % of the potential market)

18
4. Cost-in-use studies- Results from a UK health economic analysis of Contreet
United Kingdom
0,0
50,0
100,0
150,0
200,0
250,0
300,0
0,0 2,0 4,0 6,0 8,0 10,0 12,0 14,0
Reduction in wound area per week %
Wee
kly
trea
tmen
t cos
t (€)
Actisorb SilverIodoflex
Aquacel AgContreet
Contreet heals faster and is more cost-effective
Scanlon et al. (2005): ”Cost-effective faster wound healing with a sustained silver Releasing foam dressing in delayed healing leg ulcers - A health economic analysis”, In press, IWJ.
19
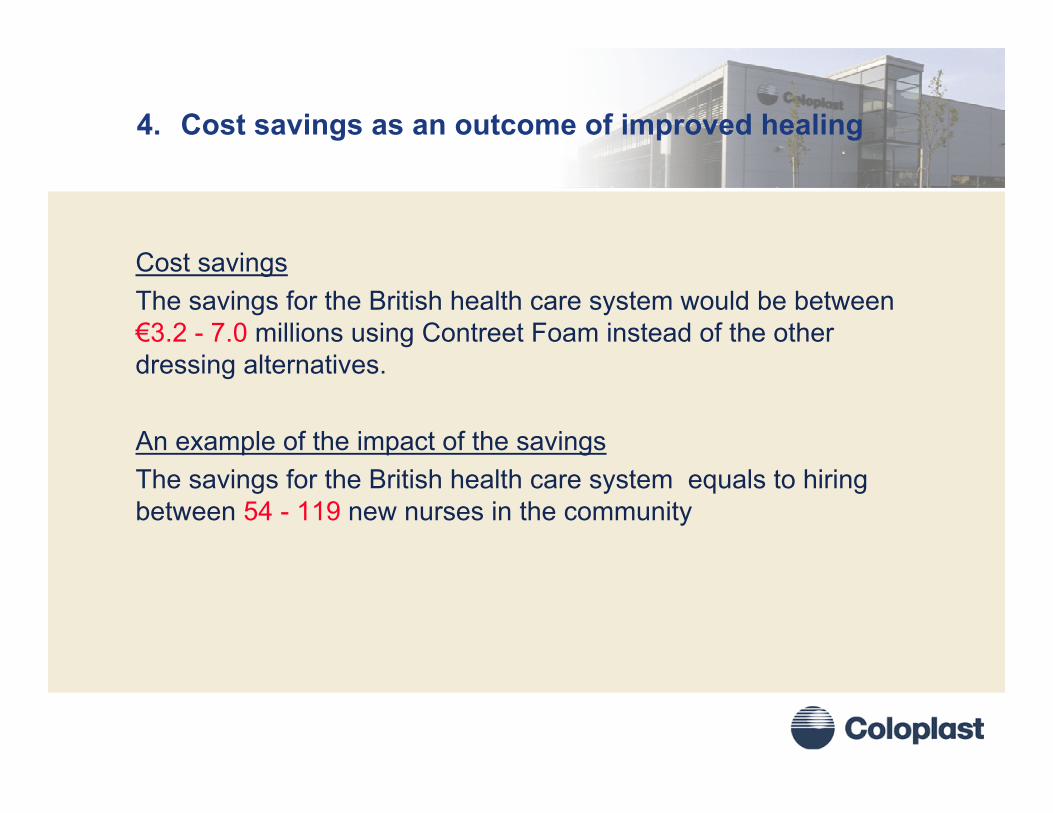
4. Cost savings as an outcome of improved healing
Cost savingsThe savings for the British health care system would be between €3.2 - 7.0 millions using Contreet Foam instead of the other dressing alternatives.
An example of the impact of the savingsThe savings for the British health care system equals to hiringbetween 54 - 119 new nurses in the community

20
4. Cost in use studies- Results from a comparative study of diapers and Conveen urisheaths
5.2711.86Total direct cost
1.363.91Other labour cost due to incontinence leakage
0.823.30Labour cost for changing product
0.030.33Waste disposal cost
1.333.42Indirect material and laundry cost
1.730.90Direct material cost
Conveen 2-pcs.latex urisheaths
DiapersCosts variable / cost per day (€)
21
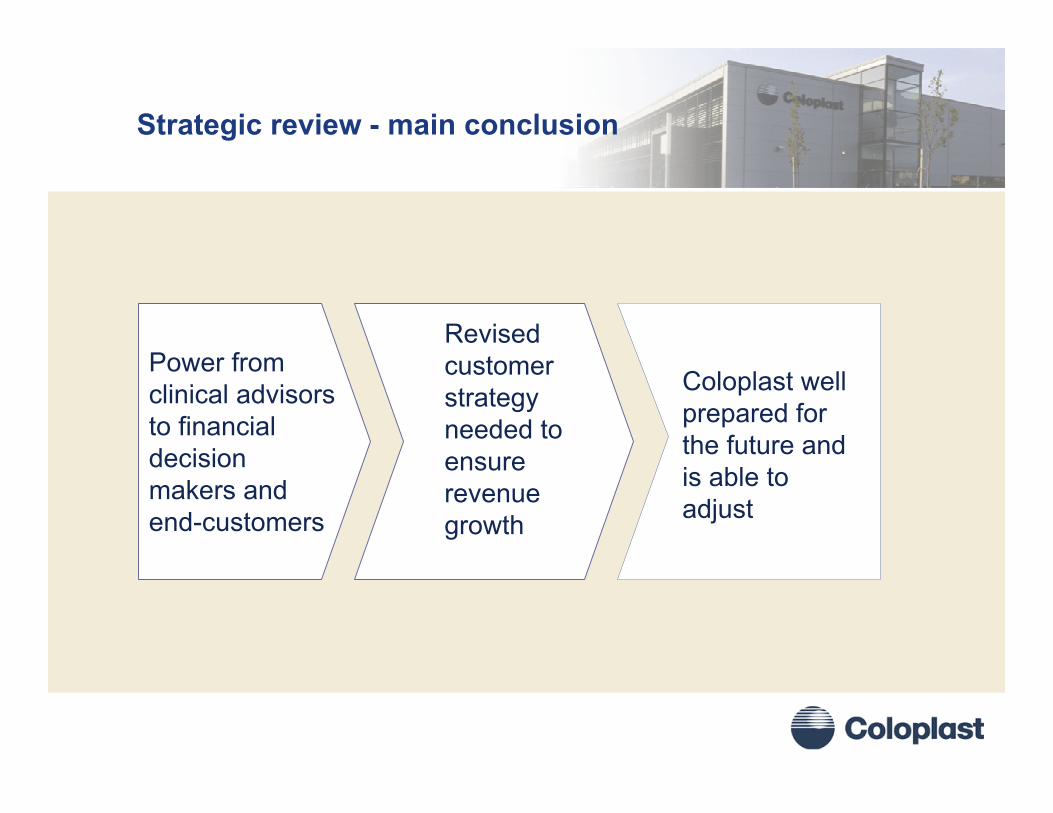
Strategic review - main conclusion
Power from clinical advisors to financial decision makers and end-customers
Revised customer strategy needed to ensure revenue growth
Coloplast well prepared for the future and is able to adjust

22
0100020003000400050006000700080009000
10000
1997
/9819
98/99
1999
/0020
00/01
2001
/0220
02/03
2003
/0420
04/05
2005
/0620
06/07
2007
/08
Track record- Organic growth rates
mD
KK
14% 13%12%
12%
14% 11%10% CAGR 10%

Coloplast Capital Market Day 4-5 April 2005
Tatabanya, Hungary
Coffee Break

Coloplast Capital Market Day 4-5 April 2005
Tatabanya, Hungary
Coloplast’s manufacuring strategy towards 2010
Lars Rasmussen, Group Director, COO

25
Objective for 2008: Turnover of at least 9 bn DKK
9 bn DKK
Organicgrowth
0100020003000400050006000700080009000
10000
1997
/9819
98/99
1999
/0020
00/01
2001
/0220
02/03
2003
/0420
04/05
2005
/0620
06/07
2007
/08
mD
KK
26
Clear goal…
10
12
14
16
18
20
98/99
99/00
00/01
01/02
02/03
03/04
04/05
05/06
06/07
07/08
%

27
Manufacturing strategy as it was laid out in 2001
Pilot productionRamp-upVolume production
Pilot productionRamp-up
Volume production

28
Reduction of costs
00/01 05/06 10/11 00/01 05/06 10/11
Direct and indirect wages Other costs
Denmark
Hungary

29
Building costs
5,000 10,000
Factory/adm.Clean room
Hungary
10,000 25,000
Factory/adm. (Humlebæk)Clean room
Denmark
DKK/m2Building costs, not including the site

30
Phase I, 1 April 2002
13,800 m2
production and administration.
Cost of building: about 65 mDKK

31
Phase II, 1 October 2003
Another 10,000 m2 production including clean rooms. Cost of building: about 65 mDKK
32
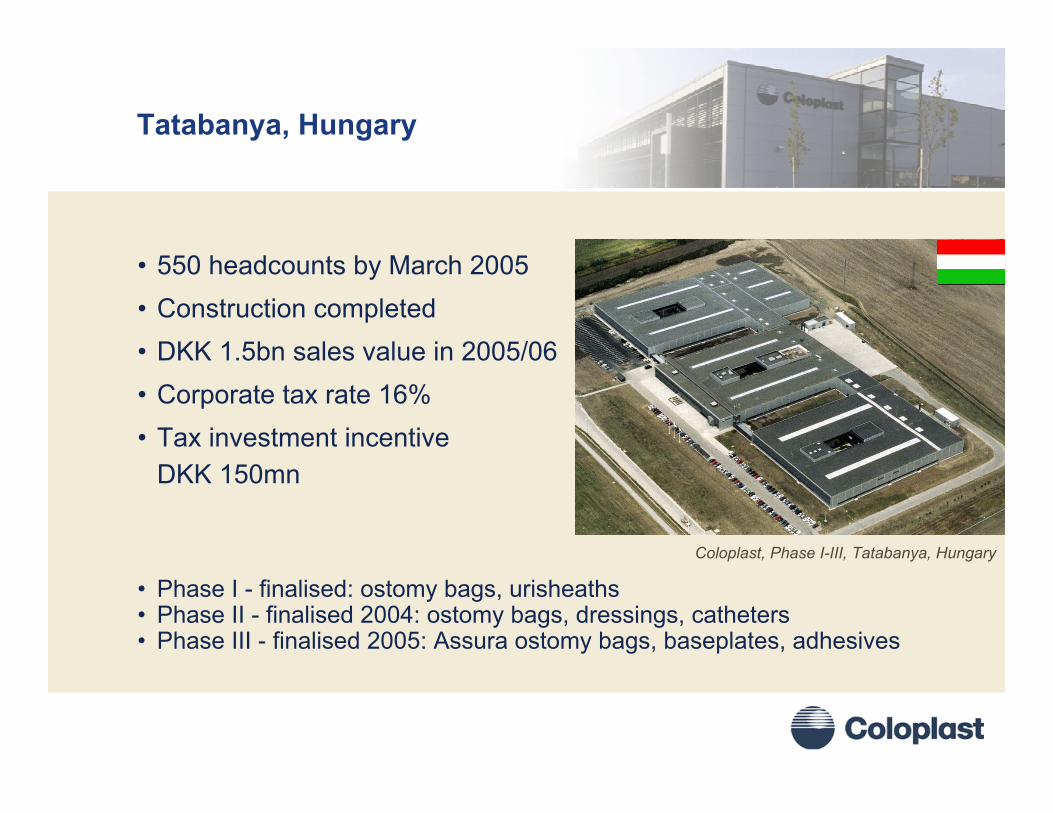
Tatabanya, Hungary
• 550 headcounts by March 2005• Construction completed• DKK 1.5bn sales value in 2005/06• Corporate tax rate 16%• Tax investment incentive
DKK 150mn
• Phase I - finalised: ostomy bags, urisheaths• Phase II - finalised 2004: ostomy bags, dressings, catheters• Phase III - finalised 2005: Assura ostomy bags, baseplates, adhesives
Coloplast, Phase I-III, Tatabanya, Hungary
33
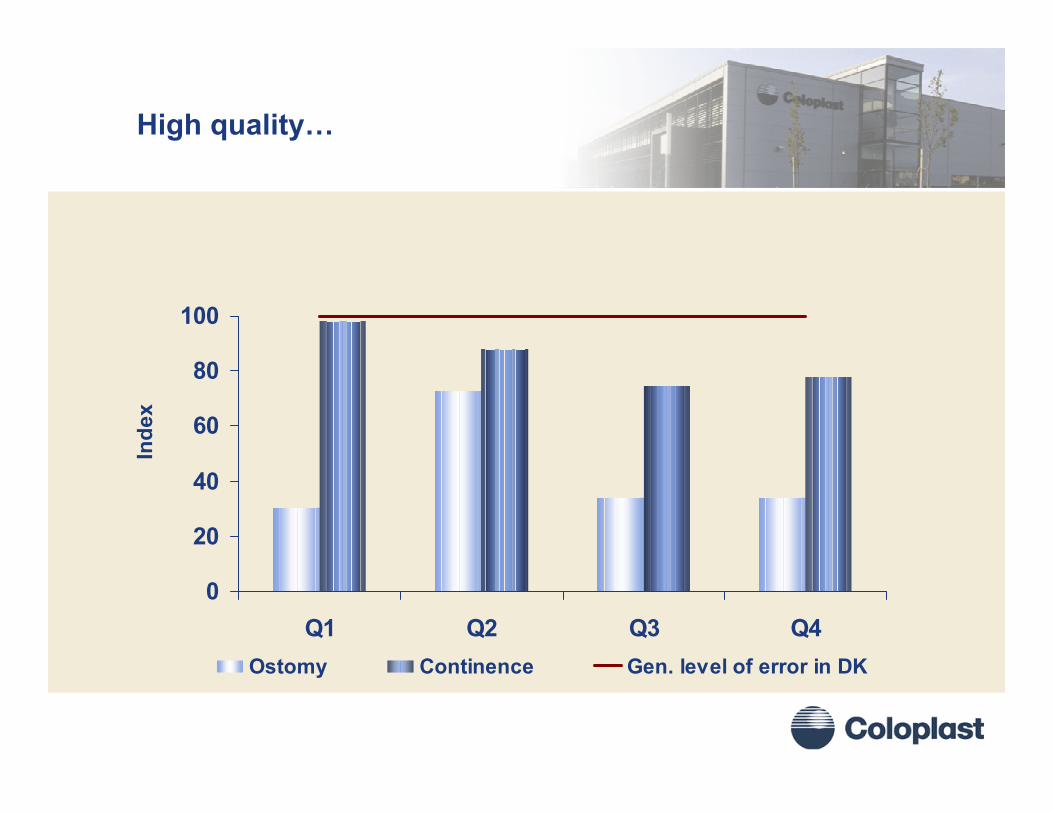
High quality…
0
20
40
60
80
100
Q1 Q2 Q3 Q4Ostomy Continence Gen. level of error in DK
Inde
x

34
Efficiency is developing according to plan
When fully utilizedand with 900 headcounts savings amount to a min. of 75 mDKK/year
Yearly tax effect of 30-50 mDKK in 2005-11.
Q1 Q2 Q3 Q4
Actual Planned
35
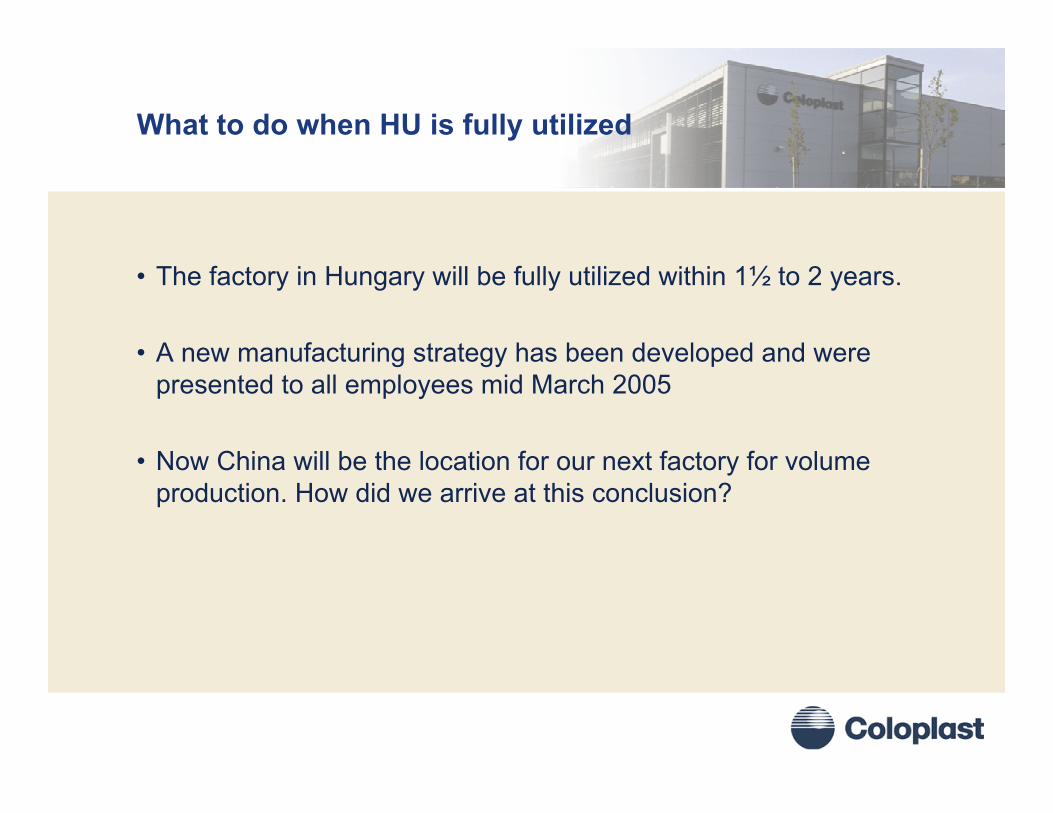
What to do when HU is fully utilized
• The factory in Hungary will be fully utilized within 1½ to 2 years.
• A new manufacturing strategy has been developed and were presented to all employees mid March 2005
• Now China will be the location for our next factory for volume production. How did we arrive at this conclusion?
36
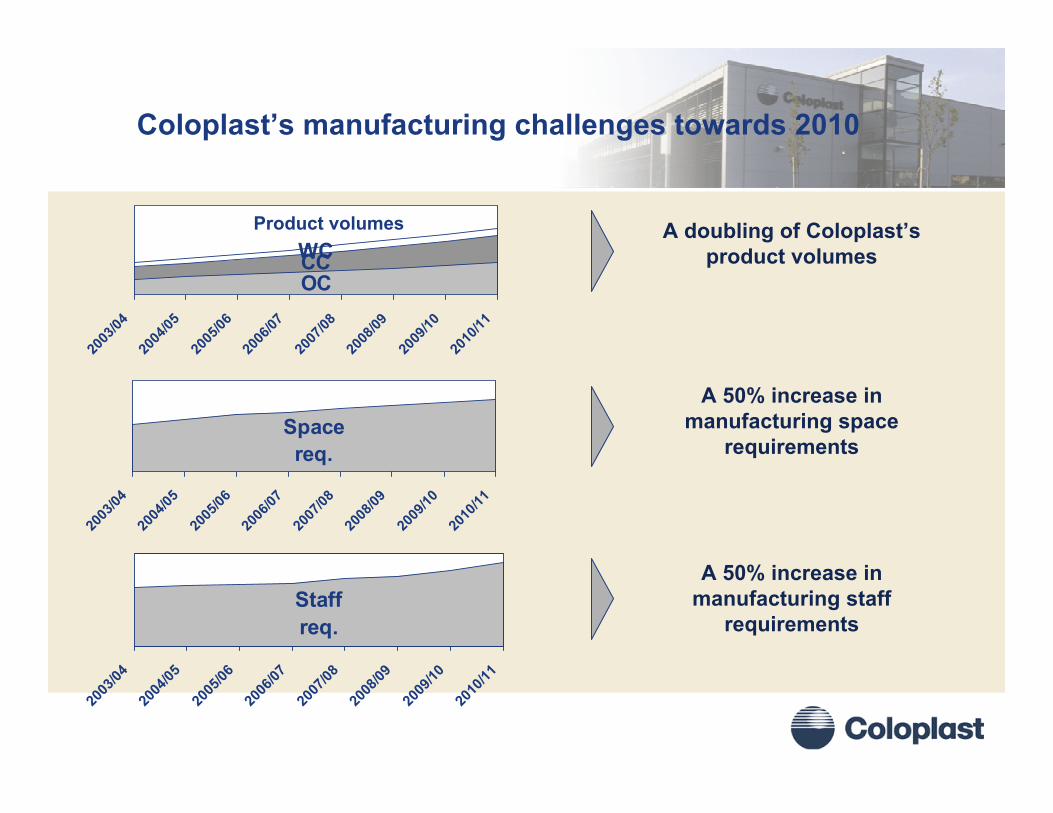
Coloplast’s manufacturing challenges towards 2010
OCCCWC
2003
/0420
04/05
2005
/0620
06/07
2007
/0820
08/09
2009
/1020
10/11
Space req.
2003
/0420
04/05
2005
/0620
06/07
2007
/0820
08/09
2009
/1020
10/11
Staff req.
2003
/0420
04/05
2005
/0620
06/07
2007
/0820
08/09
2009
/1020
10/11
A doubling of Coloplast’s product volumes
A 50% increase in manufacturing space
requirements
A 50% increase in manufacturing staff
requirements
Product volumes

37
The majority of the growth (measured in volume) is expected to come from the European market
0100.000200.000300.000400.000500.000600.000700.000800.000
2003
/0420
04/05
2005
/0620
06/07
2007
/0820
08/09
2009
/1020
10/11
’000 pcs
Europe
Americas & ROW

38
Central/East Europe and China were considered for Coloplast’s future factory expansions
Central/East Europe China
Beijing (Tianjin)Shanghai (Suzhou)Hong Kong (Macau)
Poland
Czech Rep.
Slovakia
Hungary
Romania
Existing facilities in HU used as benchmark
Existing facilities in CN used as benchmark
39
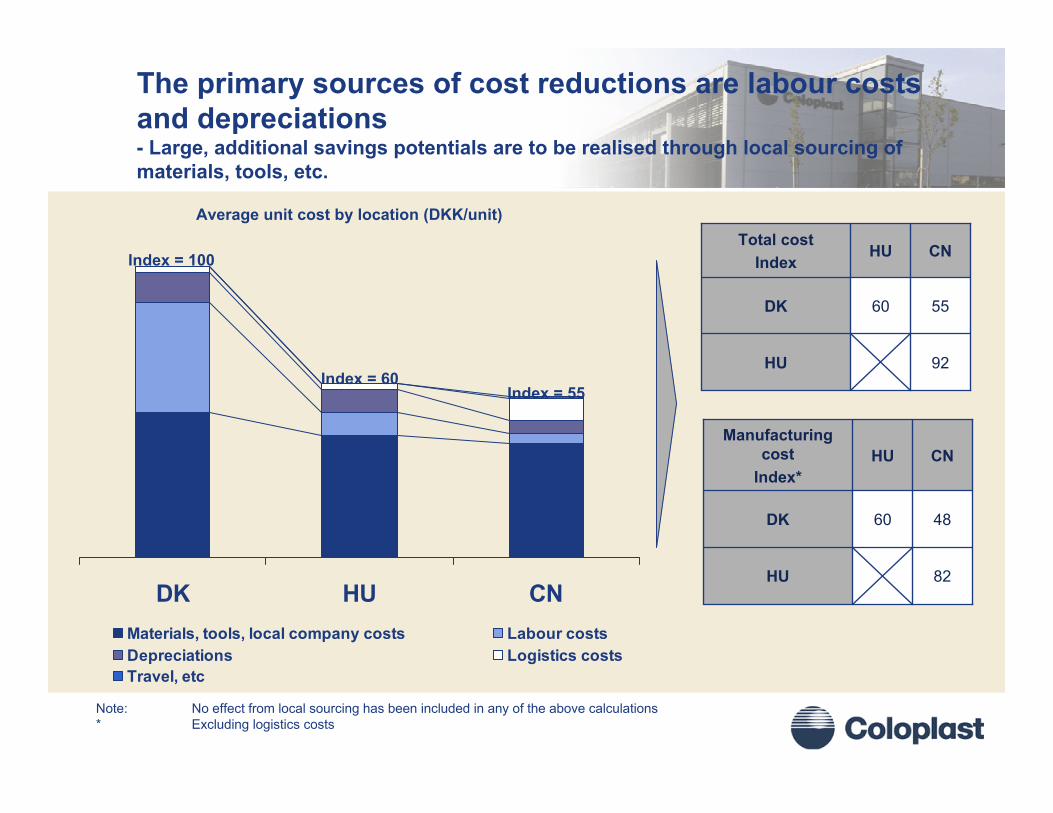
The primary sources of cost reductions are labour costs and depreciations- Large, additional savings potentials are to be realised through local sourcing of materials, tools, etc.
DK HU CNMaterials, tools, local company costs Labour costsDepreciations Logistics costsTravel, etc
Average unit cost by location (DKK/unit)
60
HU
92HU
55DK
CNTotal cost
Index
60
HU
82HU
48DK
CNManufacturing
costIndex*
Note: No effect from local sourcing has been included in any of the above calculations* Excluding logistics costs
Index = 100
Index = 60Index = 55

40
Due to the relatively high logistics costs, the average savings per product will vary from market to market
0,17
0,33
0,48
0
0,1
0,2
0,3
0,4
0,5
0,6
Europe Americas &ROW
China
Savings CN vs. HUDKK/product
Average Savings per product per market from production in CN vs. HU

41
Building costs
4,0008,000
Factory/adm.Clean room
China
5,000 10,000
Factory/adm.Clean room
Hungary
10,000 25,000
Factory/adm. (Humlebæk)Clean room
Denmark
DKK/m2Building costs, not including the site
42
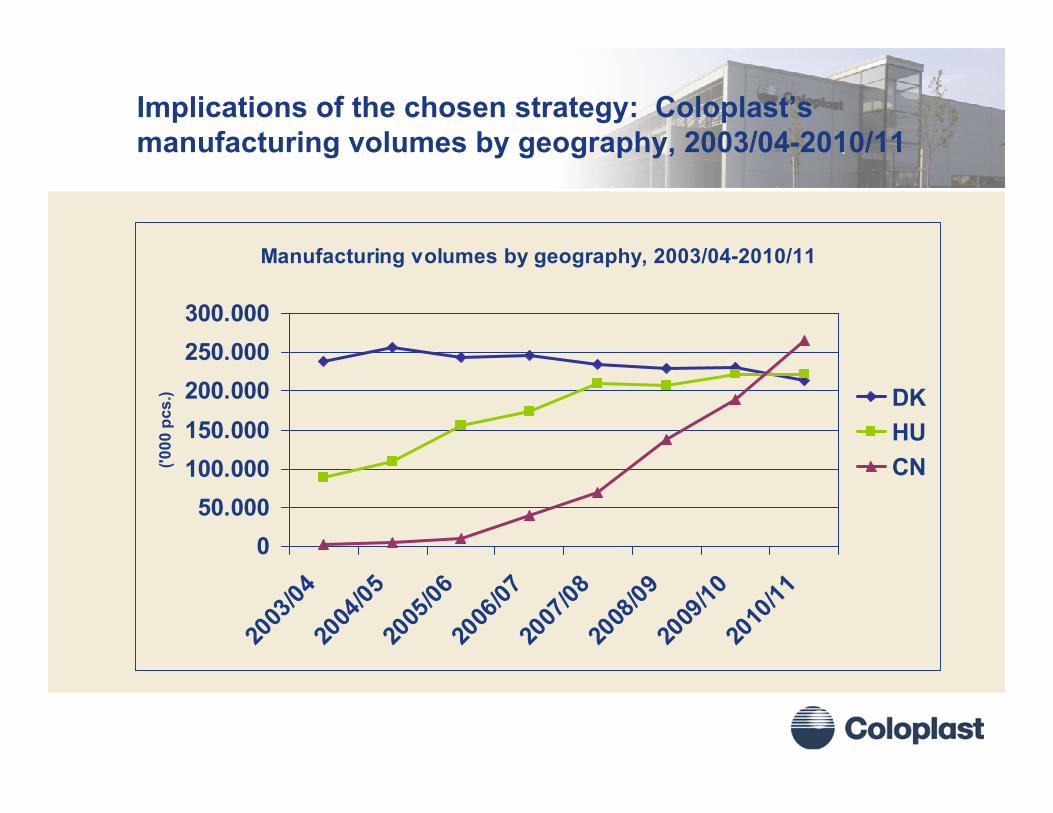
Implications of the chosen strategy: Coloplast’s manufacturing volumes by geography, 2003/04-2010/11
Manufacturing volumes by geography, 2003/04-2010/11
050.000
100.000150.000200.000250.000300.000
2003
/0420
04/05
2005
/0620
06/07
2007
/0820
08/09
2009
/1020
10/11
('000
pcs
.) DKHUCN
43
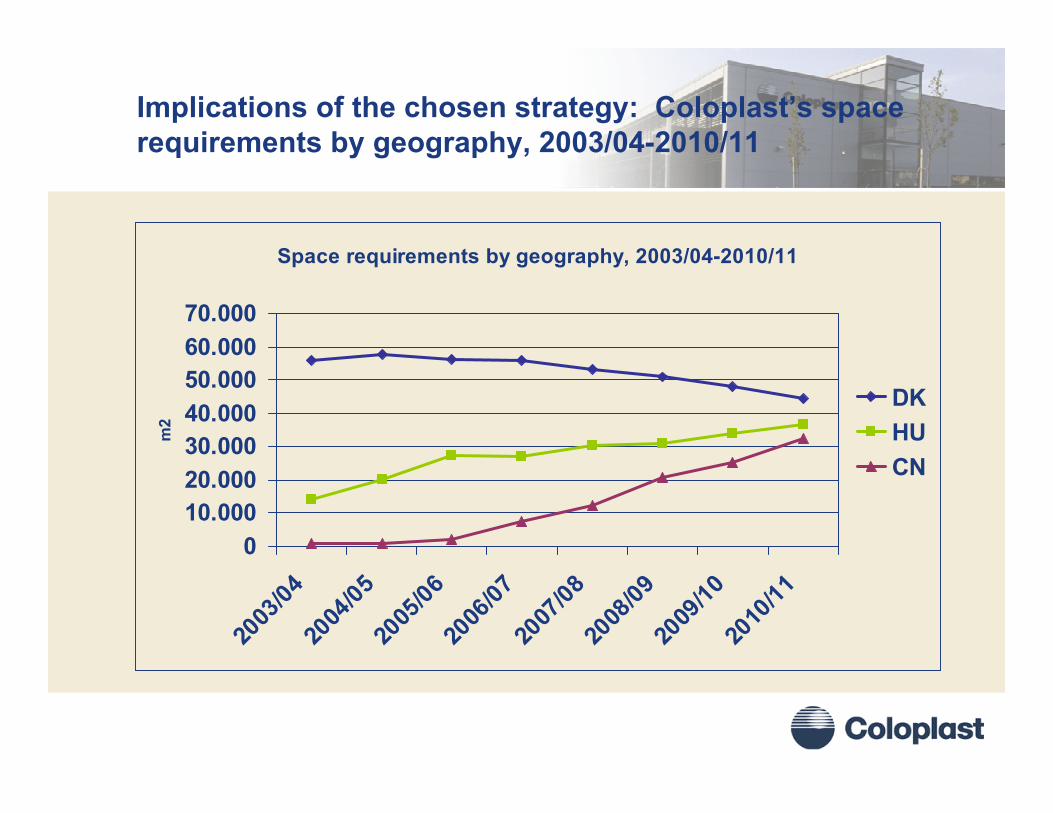
Implications of the chosen strategy: Coloplast’s space requirements by geography, 2003/04-2010/11
Space requirements by geography, 2003/04-2010/11
010.00020.00030.00040.00050.00060.00070.000
2003
/0420
04/05
2005
/0620
06/07
2007
/0820
08/09
2009
/1020
10/11
m2
DKHUCN

44
Implications of the chosen strategy: Coloplast’s total staff requirements (FTEs) by geography, 2003/04-2010/11
Total staff requirements (FTEs) by geography, 2003/04-2010/11
0
500
1.000
1.500
2.000
2003
/0420
04/05
2005
/0620
06/07
2007
/0820
08/09
2009
/1020
10/11
FTEs
DKHUCN
45
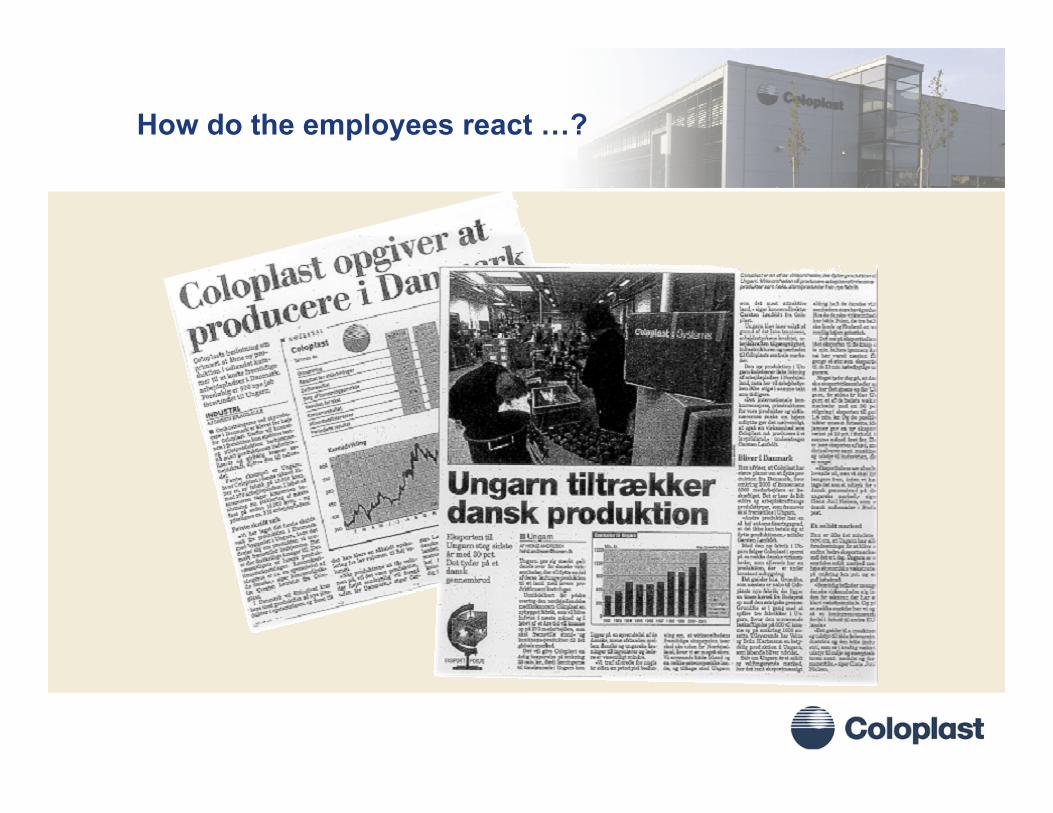
How do the employees react …?

46
Employee Satisfaction Measurement 2003
2003
4,05
3,98
4,07 3,823,973,974,024,13You feel safe in your employment
20
3,823,99You have been informedof the objectives and plans of the company
42
3,994,003,873,784,00Your superior is reliablein word and action
32
19971998200020012002
Scale 1 - 5
47
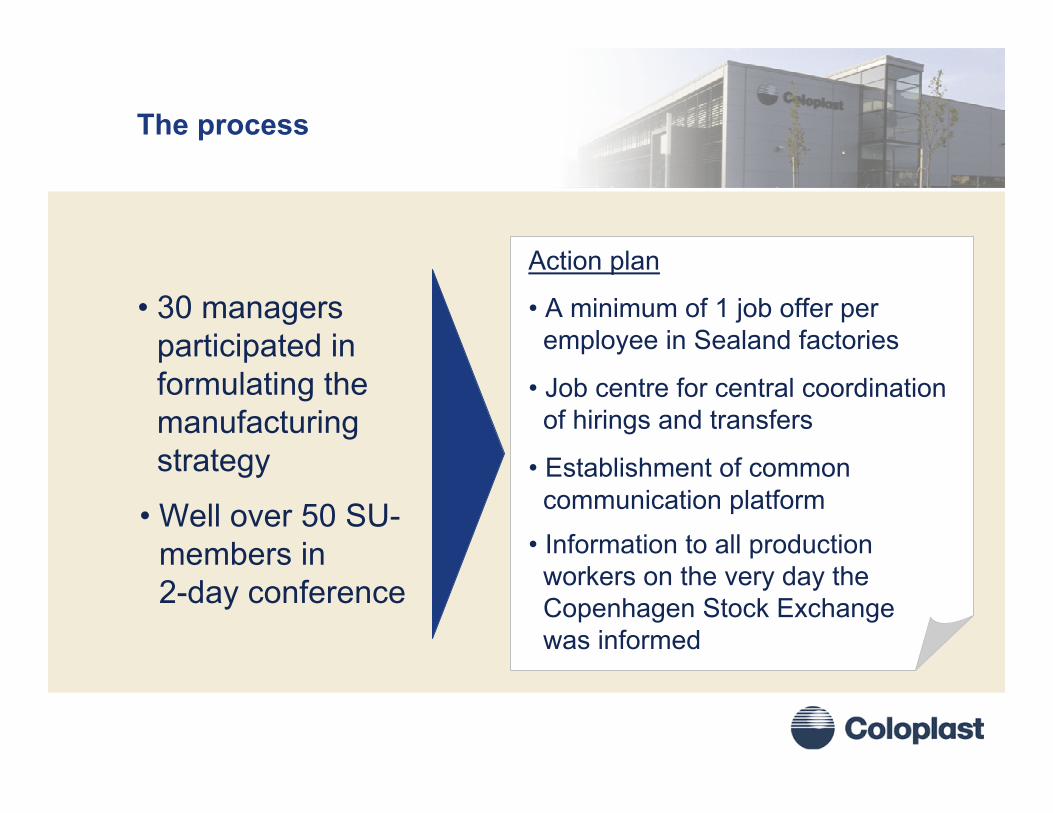
The process
• 30 managers participated in formulating the manufacturing strategy
Action plan
• A minimum of 1 job offer per employee in Sealand factories
• Job centre for central coordination of hirings and transfers
• Establishment of common communication platform
• Information to all production workers on the very day theCopenhagen Stock Exchange was informed
• Well over 50 SU-members in 2-day conference

Coloplast Capital Market Day 4-5 April 2005
Tatabanya, Hungary
Lean ExperiencesColoplast Hungary Kft
John Raabo Nielsen, General Manager

49
- 75%Lead-time
- 67%Waste / Scrap
+ 30%Productivity
x 5Inventory Turns
Target
Sustainable results require a way of thinking
50
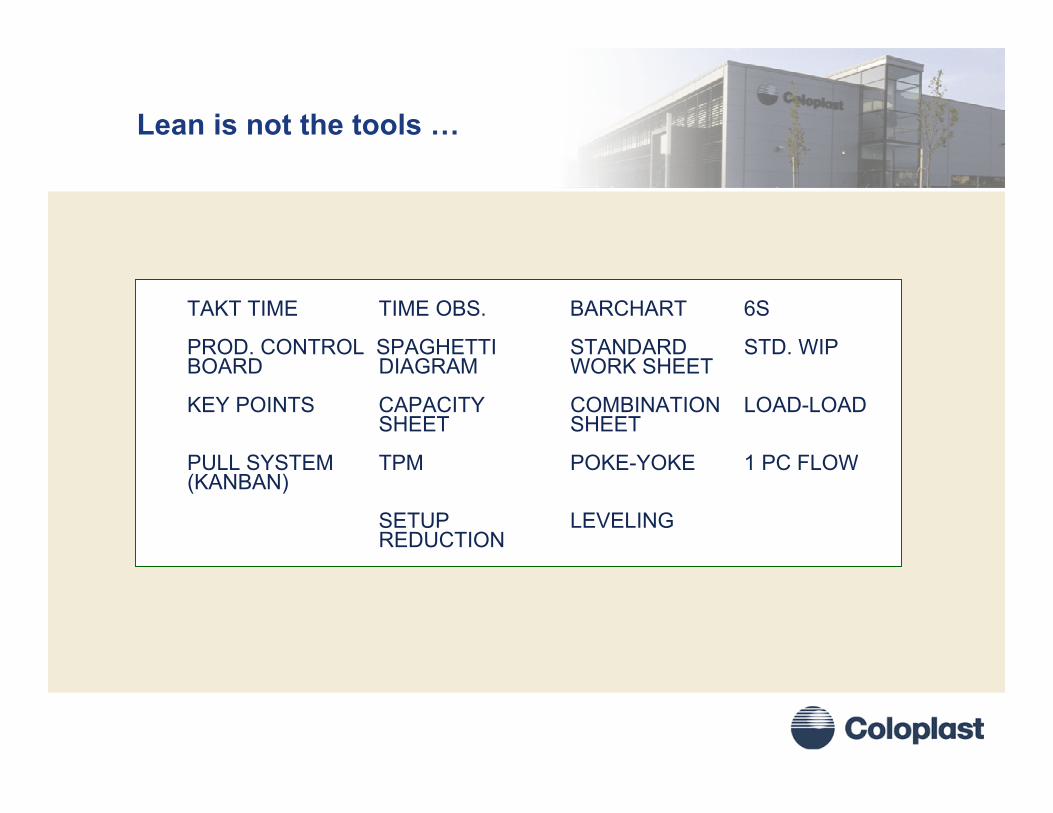
TAKT TIME TIME OBS. BARCHART 6S
PROD. CONTROL SPAGHETTI STANDARD STD. WIPBOARD DIAGRAM WORK SHEET
KEY POINTS CAPACITY COMBINATION LOAD-LOADSHEET SHEET
PULL SYSTEM TPM POKE-YOKE 1 PC FLOW(KANBAN)
SETUP LEVELINGREDUCTION
Lean is not the tools …
51
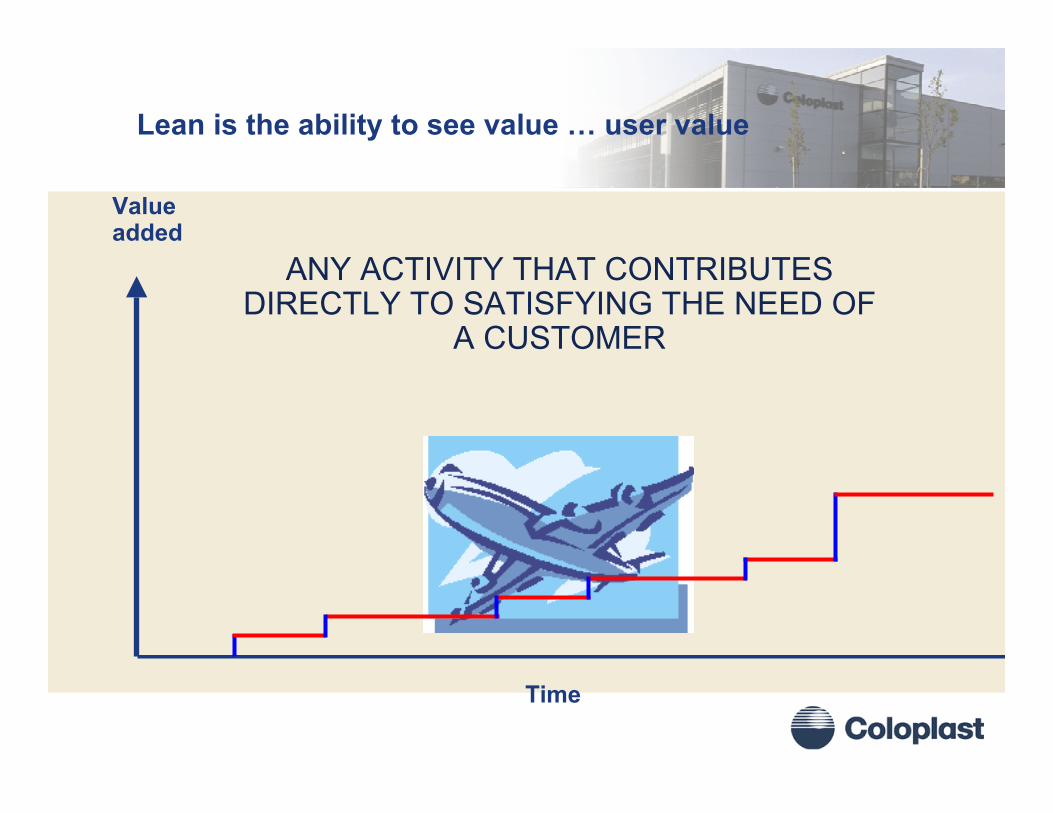
Lean is the ability to see value … user value
ANY ACTIVITY THAT CONTRIBUTES DIRECTLY TO SATISFYING THE NEED OF
A CUSTOMER
Valueadded
Time

52
Value
- To the customer
Valuestream
- Analyse andidentify waste
Flow
- The shortestway from ideato happy customer
Pull
- Deliveryaccording to customer needs
Perfection
- Small as well as big constant improvements
The five principles of lean

53
Airplane GameWill illustrate the power of Implementing Flow and Pull principles
ValueValue
stream
Flow
PullConstant
Improvements(Perfection)

54
Simulation Physical Layout
RawMaterialQueue
MaterialIdentification
Fuselage“Queue”
FuselageFold
Nose #1Fold
“Queue”Nose Fold
#1
Nose #2Fold
“Queue”
Nose Fold#2
WingFold
“Queue”
WingFoldShipping
Shipping“Queue”Customer
CustomerReceiving
QTY PROD
UNITS / MIN
W.I.P.
“HOT”
Observations6:
1:
Facilitator
Material Handler: 6pc Simulation(Moves all Material)PAPER AIRPLANE, CO.
6 1
55
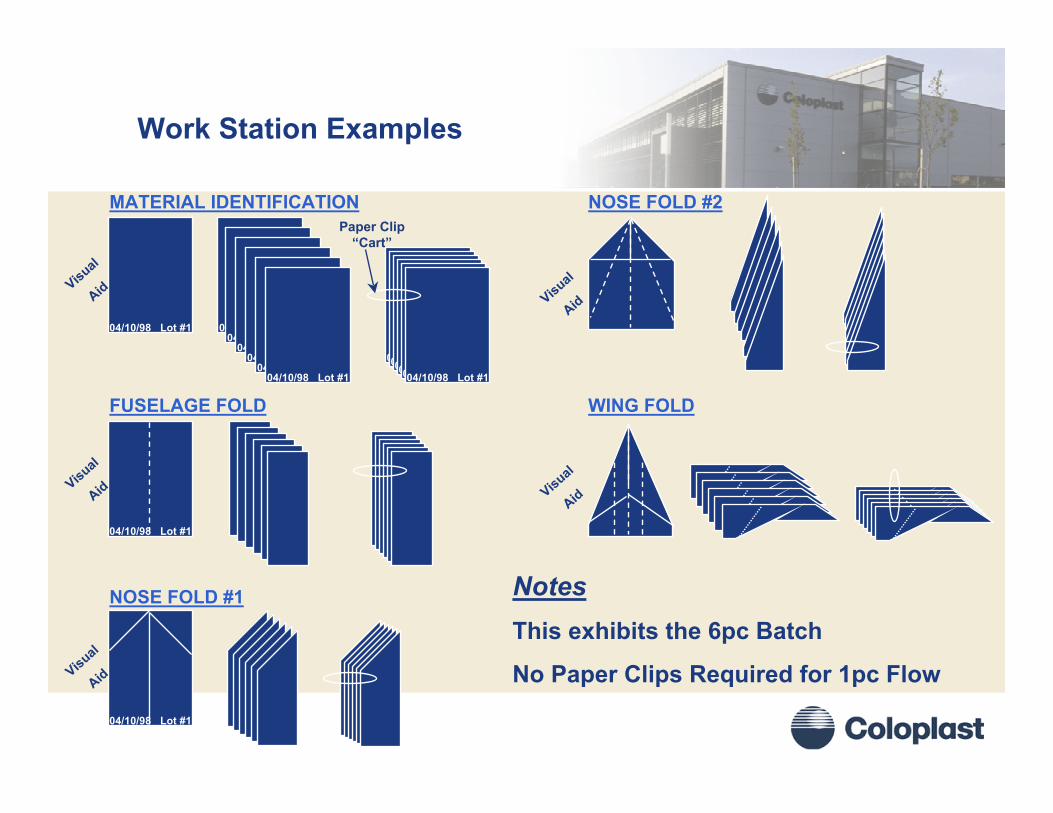
Work Station Examples
04/10/98 Lot #1 04/10/98 Lot #104/10/98 Lot #1
04/10/98 Lot #104/10/98 Lot #1
04/10/98 Lot #104/10/98 Lot #1
04/10/98 Lot #104/10/98 Lot #104/10/98 Lot #104/10/98 Lot #104/10/98 Lot #104/10/98 Lot #1
04/10/98 Lot #1
04/10/98 Lot #1
MATERIAL IDENTIFICATION
FUSELAGE FOLD
NOSE FOLD #1
NOSE FOLD #2
WING FOLD
NotesThis exhibits the 6pc Batch
No Paper Clips Required for 1pc Flow
Visual
Aid
Visual
Aid
Visual
Aid
Visual
Aid
Visual
Aid
Paper Clip “Cart”

Coloplast Capital Market Day 4-5 April 2005
Tatabanya, Hungary
Our lean journey
Coloplast Hungary Kft

57
Opportunity to start from scratch
A recognized benchmark in volume manufacturing organized around the core manufacturing processes delivering medical devices meeting market demand on product quality and service level.
A recognized benchmark in volume manufacturing organized around the core manufacturing processes delivering medical devices meeting market demand on product quality and service level.
Vision
• Equipment always calibrated
• Error proofing evident
• Most equipment calibrated
• Key equipment calibrated according to major issues
• Equipment occasionally calibrated
Equipment Calibration Process
• Has programs to understand issues and root cause and to effectively communicate them
• Relatively quick issue tracking and has programs to conduct issue analysis and implement solutions
• Root cause analysis is conducted and efforts are made to develop partial solutions
• Limited analysis of issues
Issuecontrol
• Product attributes improved through process optimization
• Product attributes throughout the process are defined and relationship to input variables understood
• Product attributes throughout the process are defined
• Product attributes are defined at finished goods only
Output Variables
• Critical set points and process inputs are known and there is a proactive responsiveness to changes in input parameters
• All critical set points and process inputs are defined and consistently applied by all operators
• Several set points are defined and process inputs measured
• Process set points vary by operator and process inputs aren’t measured
Input Variables
• Comprehensive performance measurement process in regular use.
• Results and progress are systematically tracked and recorded
• Use of competitive comparison and benchmarks
• Process capability measured and compared to competitive benchmarks
• Formal performance measurement process in regular use.
• Measurement expectations are clear and consistent
• Expanded focus to include comparison against business goals
• Process capability measured and reported on a regular basis
• Formal performance measurement process in use.
• Narrow focus: primarily time and cost reporting
• Process capability measured infrequently, based on discretion of local management
• Informal performance measures, limited accountability since quality is not measured on individual, team, or manager level
• Process capability not measured
PerformanceManagement
• Operators are 100% responsible for all quality related to their value-added process
• Operators perform Statistical Quality Control (SQC)
• Operators are able to control basic quality parameters
• Operators perform Go/No-Go tests
• Operators reportquality issues
• Operators have no quality responsibility
OperatorResponsibility
Stage IVStage IIIStage IIStage I
• Equipment always calibrated
• Error proofing evident
• Most equipment calibrated
• Key equipment calibrated according to major issues
• Equipment occasionally calibrated
Equipment Calibration Process
• Has programs to understand issues and root cause and to effectively communicate them
• Relatively quick issue tracking and has programs to conduct issue analysis and implement solutions
• Root cause analysis is conducted and efforts are made to develop partial solutions
• Limited analysis of issues
Issuecontrol
• Product attributes improved through process optimization
• Product attributes throughout the process are defined and relationship to input variables understood
• Product attributes throughout the process are defined
• Product attributes are defined at finished goods only
Output Variables
• Critical set points and process inputs are known and there is a proactive responsiveness to changes in input parameters
• All critical set points and process inputs are defined and consistently applied by all operators
• Several set points are defined and process inputs measured
• Process set points vary by operator and process inputs aren’t measured
Input Variables
• Comprehensive performance measurement process in regular use.
• Results and progress are systematically tracked and recorded
• Use of competitive comparison and benchmarks
• Process capability measured and compared to competitive benchmarks
• Formal performance measurement process in regular use.
• Measurement expectations are clear and consistent
• Expanded focus to include comparison against business goals
• Process capability measured and reported on a regular basis
• Formal performance measurement process in use.
• Narrow focus: primarily time and cost reporting
• Process capability measured infrequently, based on discretion of local management
• Informal performance measures, limited accountability since quality is not measured on individual, team, or manager level
• Process capability not measured
PerformanceManagement
• Operators are 100% responsible for all quality related to their value-added process
• Operators perform Statistical Quality Control (SQC)
• Operators are able to control basic quality parameters
• Operators perform Go/No-Go tests
• Operators reportquality issues
• Operators have no quality responsibility
OperatorResponsibility
Stage IVStage IIIStage IIStage I Implementation Activities
Qua
lity
– Implement process for equipment calibration
– Define input and output variables– Define and implement calibration
process– Ostomy– Continence– Wound Care
– Implement robust process for quality issue control
– Define process for issue control– Impl. std. root cause analysis
– Quality performance management– Define process and metrics for total
cost of quality– Implement and align key quality
performance with incentive system – Quality responsibility handed over to
operators– Define basic quality parameters to
be controlled by operators– Execute training in SPC and quality
control on machine level– Hand over basic quality parameters
to operators– Ostomy– Continence– Wound care
2003/2004Sep Oct Nov Dec Jan FebMar Apr Mai Jun Jul Aug Q1 Q2 Q3
2004/20
Prioritizing improvement areas Implementation plansIdentifying
improvement areas
Op. Flex.
Op. Prod. Mgm
Q-Issue Control
Q-Performance
Maint. Practices
Maint. Cost Control
Materials Mgm
Production planning
Production Scheduling
Operating Equip. Efficiency
Equip. Calibration
Q-Responsibility
Maint. Resp M-Issue Control
Transportation
Op. Flex.
Op. Prod. Mgm
Q-Issue Control
Q-Performance
Maint. Practices
Maint. Cost Control
Materials Mgm
Production planning
Production Scheduling
Operating Equip. Efficiency
Equip. Calibration
Q-Responsibility
Maint. Resp M-Issue Control
Transportation
Priority 1
Ease of implementation
Ben
efit/
Pote
ntia
l
Priority 2Priority 3
low
high
difficult easy

58
ManufacturingPrimary
Support Functions
Plant Mgmt
Engineering &
Maintenance
Planning & logistics
ProductionOstomy
ProductionContinence
ProductionWoundcareQuality
Secondary Support functions
IT
FacilitiesManagement
Finance/Controlling
HR
Classic Ostomy
• Day Shift Lead• Operator Sub
Teams
• Evening Shift Lead
• Operator Sub Teams
• Night Shift Lead• Operator Sub
Teams
Operation MgmtGuiding principleWhite collar ratio: Max 10%
Post Op
• Day Shift Lead• Operator Sub
Teams
• Evening Shift Lead
• Operator Sub Teams
• Night Shift Lead• Operator Sub
Teams
Assura
• Day Shift Lead• Operator Sub
Teams
• Evening Shift Lead
• Operator Sub Teams
• Night Shift Lead• Operator Sub
Teams

59
Project based improvement project
Implementation Activities
– Involvment due to impact of activities from other functions
– Optimize OEE on machine level– Increase operator flexibility – Increase operator productivity
– Implement robust process for quality issue control
– Quality performance management
– Quality responsibility handed over to operators
– Implement process for equipment calibration
– Define technical tasks/responsibilities on individual machine level
– Hand over technical tasks to operators
– Track activities and time on individual machine level
– Implement robust process for Eng. and Maint. issue control
– Define measurement and process for materials management
– Optimize production capacity planning and replenishment
– Improve production scheduling
– Improve shipment activities and costs
2003/2004Oct Nov Dec Jan FebMar AprMay Jun Jul Aug Sep Q1 Q2 Q3 Q4
2004/2005Q1 Q2 Q3 Q4
2005/2006Q1 Q2 Q3 Q4
2006/2007
Prod
uctio
nQ
ualit
yTe
chni
cal
Logi
stic
s

Coloplast Capital Market Day 4-5 April 2005
Tatabanya, Hungary

61
Two powerful tools and a systematic process
Value Stream Analysis
Rapid Improvement
Event
Rapid Improvement
EventRapid Improvement
Event

62
Value Stream Analysis

63
Value Stream Mapping

64
VSA is really a planning event
Brainstormed IdeasACTION
IDEAACTION
IDEAACTION
IDEAACTION
IDEAACTION
IDEA
ACTIONIDEA
ACTIONIDEA
ACTIONIDEA
ACTIONIDEA
ACTIONIDEA
ACTIONIDEA
ACTIONIDEA
ACTIONIDEA
ACTIONIDEA
ACTIONIDEA
ACTIONIDEA
Events Projects Do-ItsEVENT TOPIC
EVENT TOPIC
PRO-JECT
PRO-JECT
ACTIONITEM
EVENT TOPIC
EVENT TOPIC
PRO-JECT
PRO-JECT
ACTIONITEM
EVENT TOPIC
EVENT TOPIC
PRO-JECT
ACTIONITEM
ACTIONITEM
ACTIONITEM
EVENTTOPIC
May Jun Jul Aug Sep OctD
o-Its
Pro
ject
s
Eve
nts
EVENTTOPIC
EVENTTOPIC
EVENTTOPIC
EVENTTOPIC
EVENTTOPIC
EVENTTOPIC
EVENTTOPIC
EVENTTOPIC
EVENTTOPIC
EVENTTOPIC
PROJECT
PROJECT
PROJECT
PROJECT PROJECT
PROJECT
ACTION ITEM
ACTION ITEM
ACTION ITEM
ACTION ITEM
ACTION ITEM
ACTION ITEM
ACTION ITEM
Brainstorm and discuss
Sort ideas
Plan actions

65
Productivity Lead time
Corporate
Subsidiaries
Home Care
Divisions
SBU’s
Volume production
Corporate staff
We are measuring productivity and lead time...
66
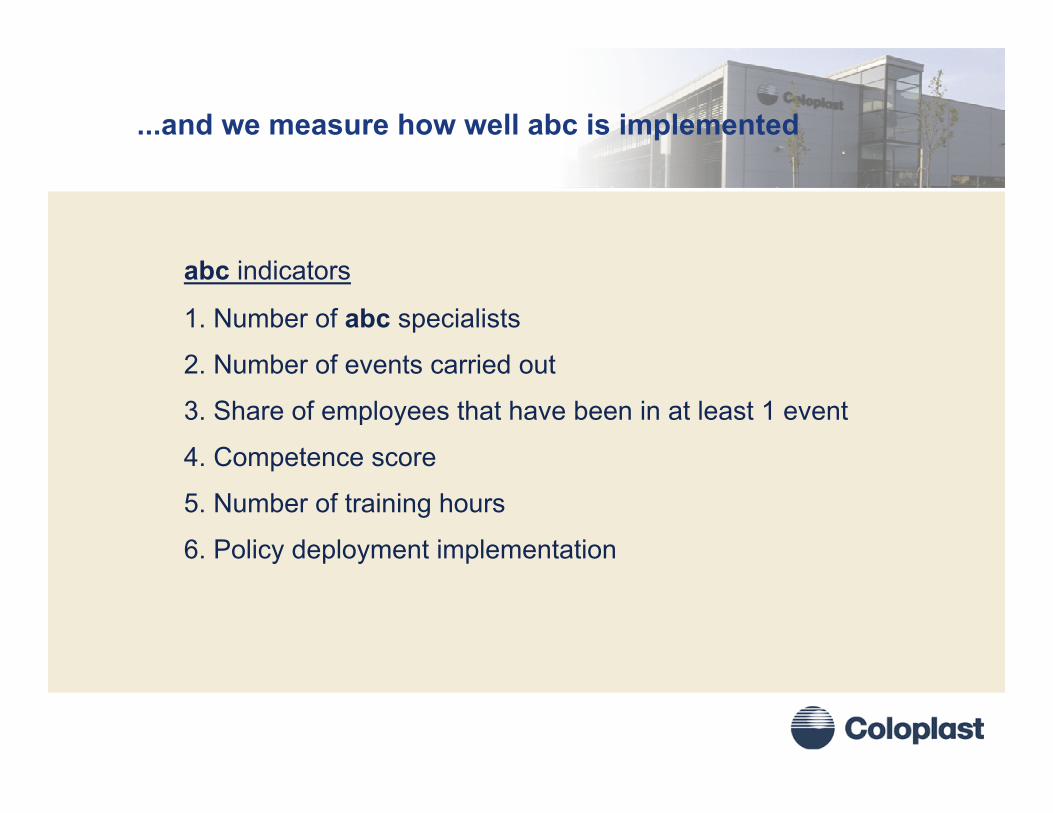
abc indicators
1. Number of abc specialists
2. Number of events carried out
3. Share of employees that have been in at least 1 event
4. Competence score
5. Number of training hours
6. Policy deployment implementation
...and we measure how well abc is implemented

67
Accelerate speed to
World Class Manufacturing Excellence
Coloplast Capital Market Day 4-5 April 2005
Tatabanya, Hungary
Lunch
Factory tour

Coloplast Capital Market Day 4-5 April 2005
Tatabanya, Hungary
Successful penetration of US markets
Jens Fabricius, Director, Regional Sales

70
Agenda
OC/CC Market overview
Strategy basis
03/04 Implementation status
Home Health retention/conversion

71
OC/CC Market overview

72
Dis
tribu
tion
Hospital Home Health Agencies Retail DME
Chronic care - US patient path
Payer source - Medicare, Medicaid and private insurance
2-5 Days 90 Days - 20 Years30-90 Days
Patie
nt p
ath
Patient at homeNew patient Convalescent patient(at home or in long-term care inst.)
Direct sales, wholesalers and specialised home care providers
Medical product manufacturerGPO

73
Market status - Ostomy
Total Market value 280 mill. USD 03/04
• $280mm• ConvaTec
– Index 100 to 02/03• Hollister
– Index 101 to 02/03• Coloplast
– Index >125 to 02/03
Other2%
Coloplast4%
CvT56%
Holl38%

74
Market status - Continence care
Total Market value 370 mill. USD 03/04
Intermittent Coated Catheters
Estimated value potential
60 mill. USD, 16% of total CC

75
Market Status - reimbursement
2004 – US passes Medicare Modernization Act
• New Prescription Drug benefit for Seniors, disabled• Contracting Reform
• Requires competitive bidding in the 10 largest MSAs beginning in 2007, followed by the next 80 largest in 2009. Competitive bidding prices could be applied nationally beginning in 2011.
• Chronic care Improvement programs• Extended Care reforms• Preventative Care Programs for;
• CHF, Diabetes, COPD, Hypertension• Disease Management focus
76
Strategy basis

77
Key goals - market share and topline growth
• Reach two-digit ostomy market share within 3-5 years
• Ostomy NPD and Key Player awareness/preference
• Develop intermittent coated catheter market segment
• OC/CC CAGR sales > 25%
• Sterling Medical Services (SMS) an enabler of CP OC/CC
• Build strategic end-user franchise with other HC providers - Byram, Edgepark and certain urological dealers
78
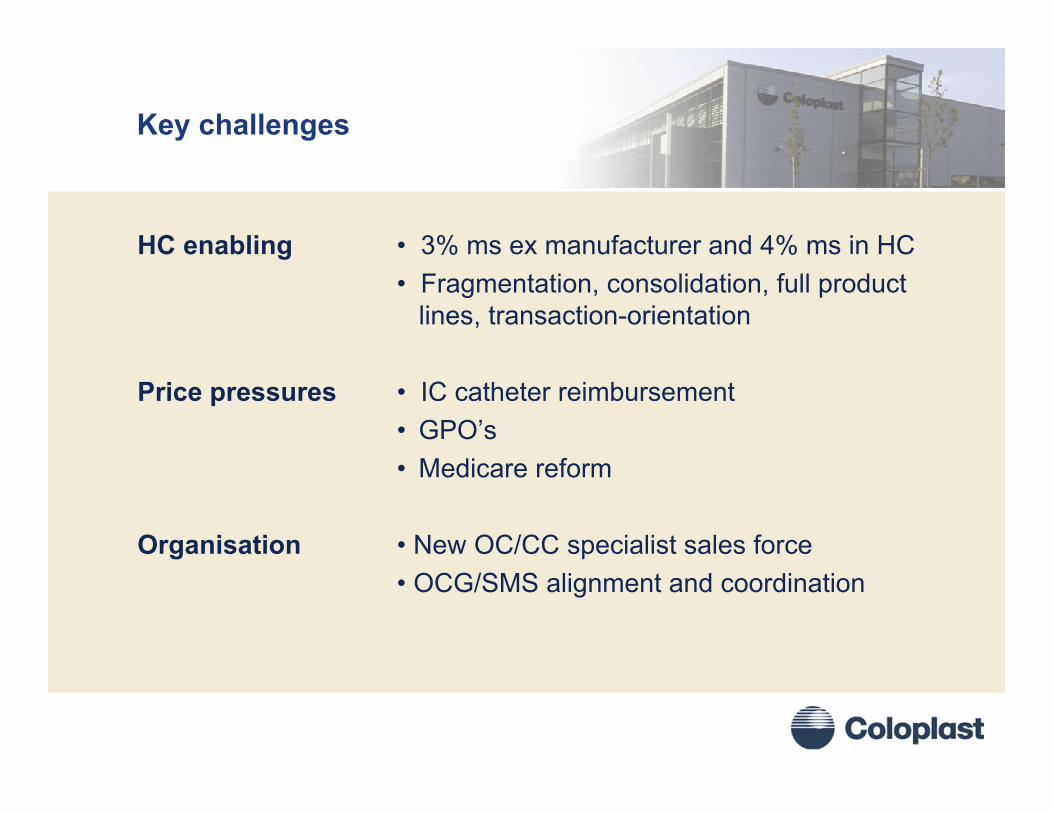
Key challenges
HC enabling • 3% ms ex manufacturer and 4% ms in HC• Fragmentation, consolidation, full product
lines, transaction-orientation
Price pressures • IC catheter reimbursement • GPO’s• Medicare reform
Organisation • New OC/CC specialist sales force• OCG/SMS alignment and coordination

79
03/04 implementation status

80
Hospital coverage => key player relations and NPD
02/03 03/04 04/05Ostomy sales representatives 17 32 38
ET's per ostomy sales reps 2.500 147 78 66
Hospitals per rep needed to cover those hospitals performing 90% of all Ostomy Surgeries (77,000) 2.271 134 71 60
Optimal Hospital Coverage per Rep 35 35 35

81
Important successes
• Consorta GPO contract
• Significant NPD growth
• Sustained OC Hospital growth > 30%
• OC market share growth towards two digit in 3-5 years
• Sustained OC/CC growth> 25%
82
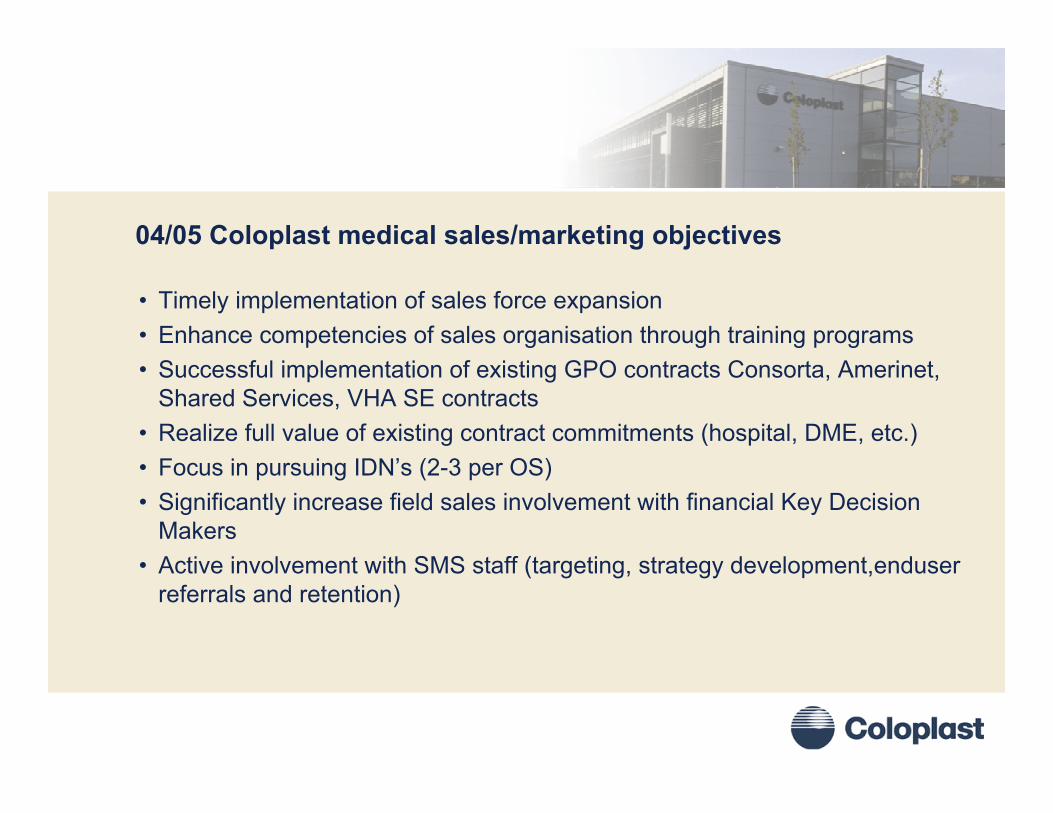
04/05 Coloplast medical sales/marketing objectives
• Timely implementation of sales force expansion• Enhance competencies of sales organisation through training programs• Successful implementation of existing GPO contracts Consorta, Amerinet,
Shared Services, VHA SE contracts• Realize full value of existing contract commitments (hospital, DME, etc.)• Focus in pursuing IDN’s (2-3 per OS)• Significantly increase field sales involvement with financial Key Decision
Makers • Active involvement with SMS staff (targeting, strategy development,enduser
referrals and retention)

83
Home Health retention/conversion

84
Ostomy patient retention - Home Health is key!
Community20% - 30%
Possible “Paths” - New Patients#1 – Hospital -> HHA -> Community#2 – Hospital -> Community#3 – Hospital -> Extended Care#4 – Hospital -> Extended Care -> Home Health#5 - Hospital -> Extended Care -> Home Health -> Community
Primary Path - Existing OstomatesCommunity -> HHA -> Community/Extended Care
Extended Care
5%-15%Home Health Agency
Private Insurance,
Medicaid, Other
Medicare / PPS
Customers
60%-70%
55%-60% 40%-45%
Hospital
85
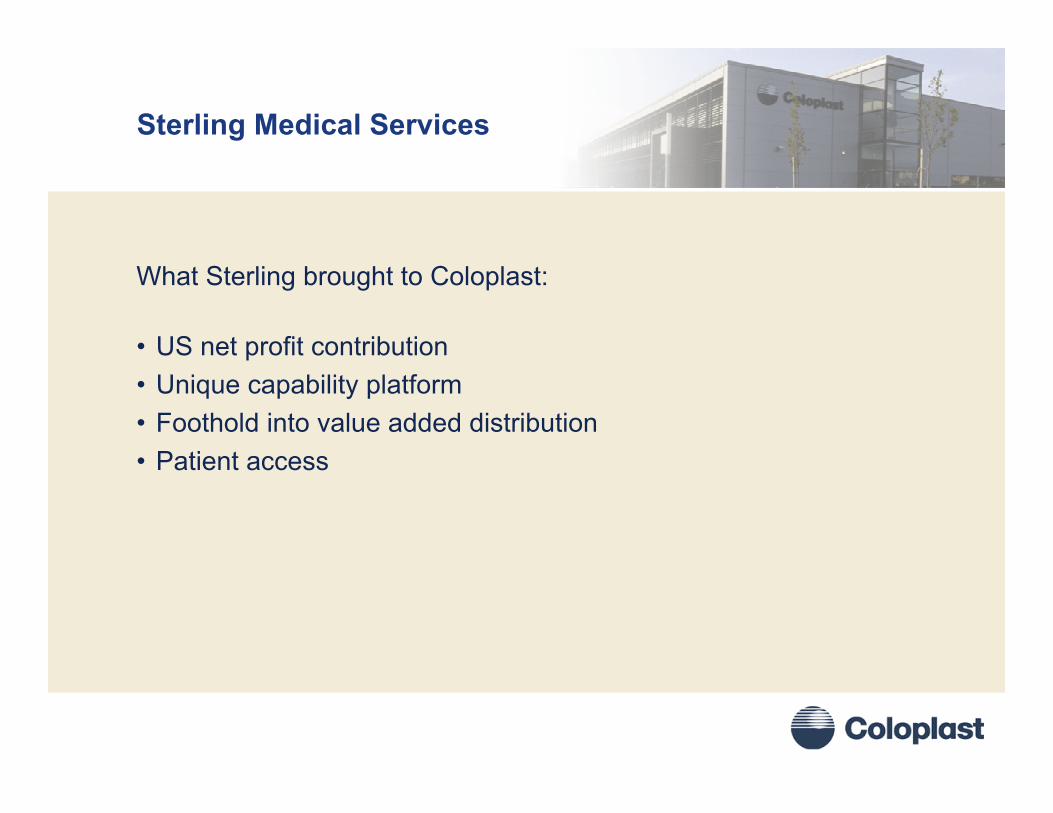
Sterling Medical Services
What Sterling brought to Coloplast:
• US net profit contribution• Unique capability platform• Foothold into value added distribution• Patient access

86
How to extract value from end-users in Sterling?
• Coordinate CP/SMS (best of both) end-user activities
• Transform CP/SMS end-user activities into a standalone business system for chronic care
• Absorb end-user activities into Coloplast
87
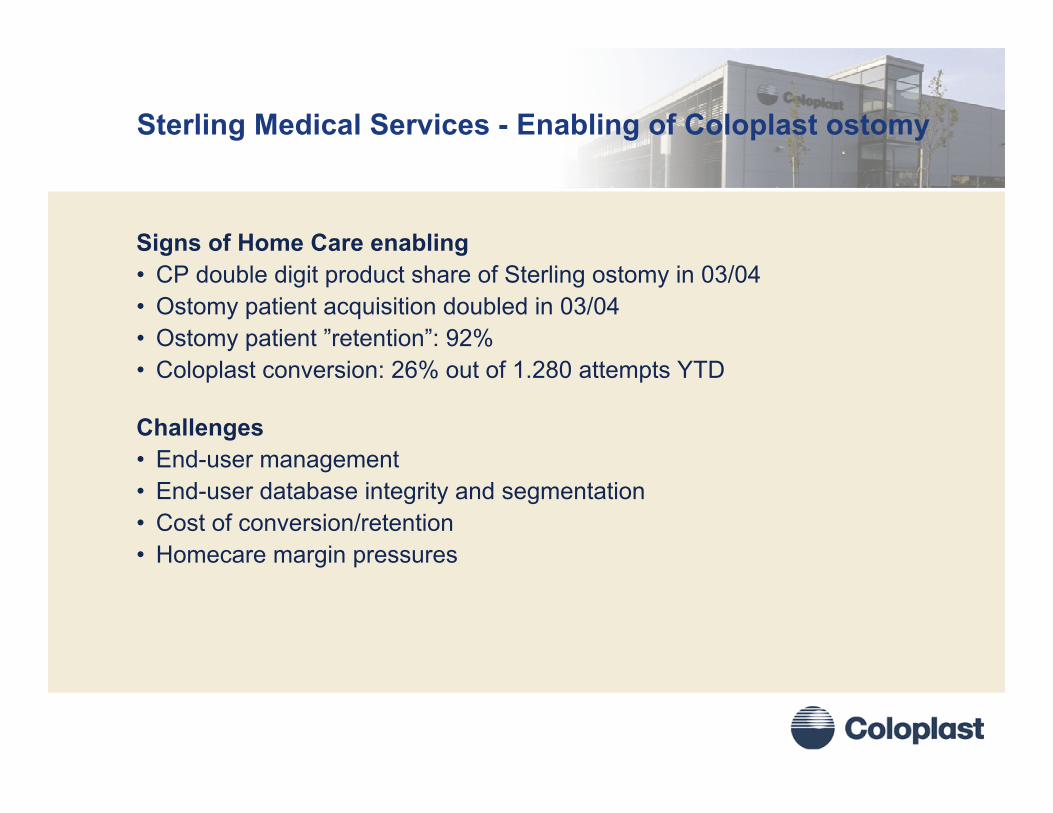
Sterling Medical Services - Enabling of Coloplast ostomy
Signs of Home Care enabling• CP double digit product share of Sterling ostomy in 03/04• Ostomy patient acquisition doubled in 03/04• Ostomy patient ”retention”: 92%• Coloplast conversion: 26% out of 1.280 attempts YTD
Challenges• End-user management• End-user database integrity and segmentation• Cost of conversion/retention• Homecare margin pressures
88
Coloplast OC/CC USA
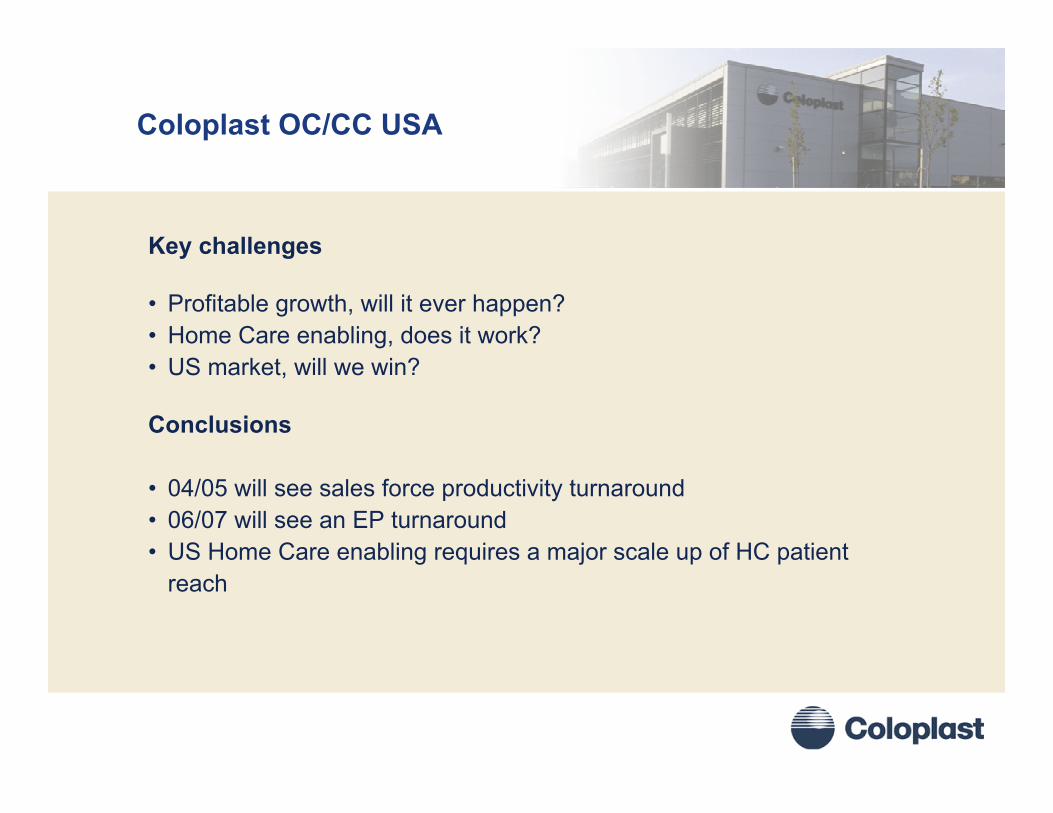
Key challenges
• Profitable growth, will it ever happen?• Home Care enabling, does it work?• US market, will we win?
Conclusions
• 04/05 will see sales force productivity turnaround• 06/07 will see an EP turnaround• US Home Care enabling requires a major scale up of HC patient
reach

Coloplast Capital Market Day 4-5 April 2005
Tatabanya, Hungary
Q&A
ModeratorCarsten Lønfeldt, Group Director, CFO

Coloplast Capital Market Day 4-5 April 2005
Tatabanya, Hungary
Bus leaves forFerihegy airport 15:45