Embed Size (px)
Citation preview

1
COLLEGE NAME
BHOPAL
MEASUREMENT AND INSTRUMENTATION (EC 305)
LAB MANUAL
Name
Branch
Subject
Enroll No.

2
INDEX
S.No Name of experiment Date
of
Experiment
Date
of
Submission
Remarks
3
EXPERIMENT NO : 1
OBJECTIVE: - Study of CRO & Measurement of frequency using Lissajous Patterns.
APPARTUS REQUIRED:-CRO, Function Generator.
THEORY: The cathode ray oscilloscope is the most versatile measuring instrument available. We can
measure following parameters using the CRO:
1. AC or DC voltage.
2. Time (t=1/f).
3. Phase relationship
4. Waveform calculation: Rise time; fall time; on time; off-time Distortion, etc.
We can also measure non-electrical physical quantities like pressure, strain, temperature,
acceleration, etc., by converting into electrical quantities using a transducer.
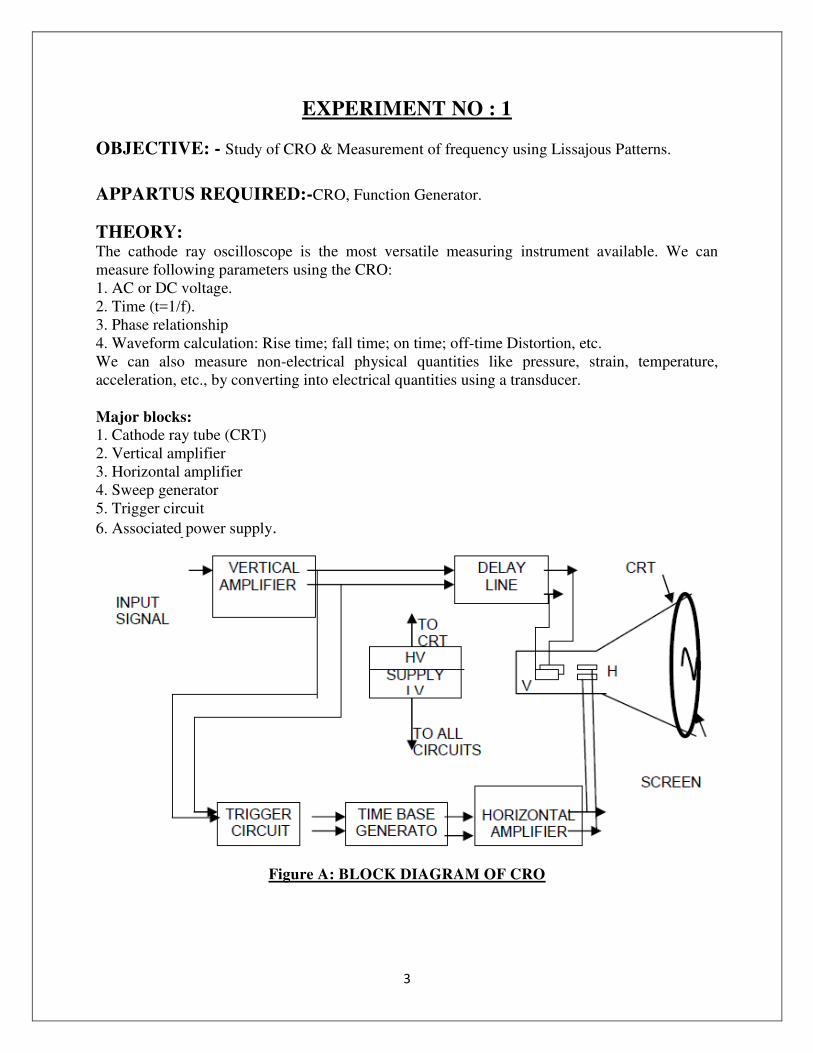
Major blocks:
1. Cathode ray tube (CRT)
2. Vertical amplifier
3. Horizontal amplifier
4. Sweep generator
5. Trigger circuit
6. Associated power supply.
Figure A: BLOCK DIAGRAM OF CRO
4
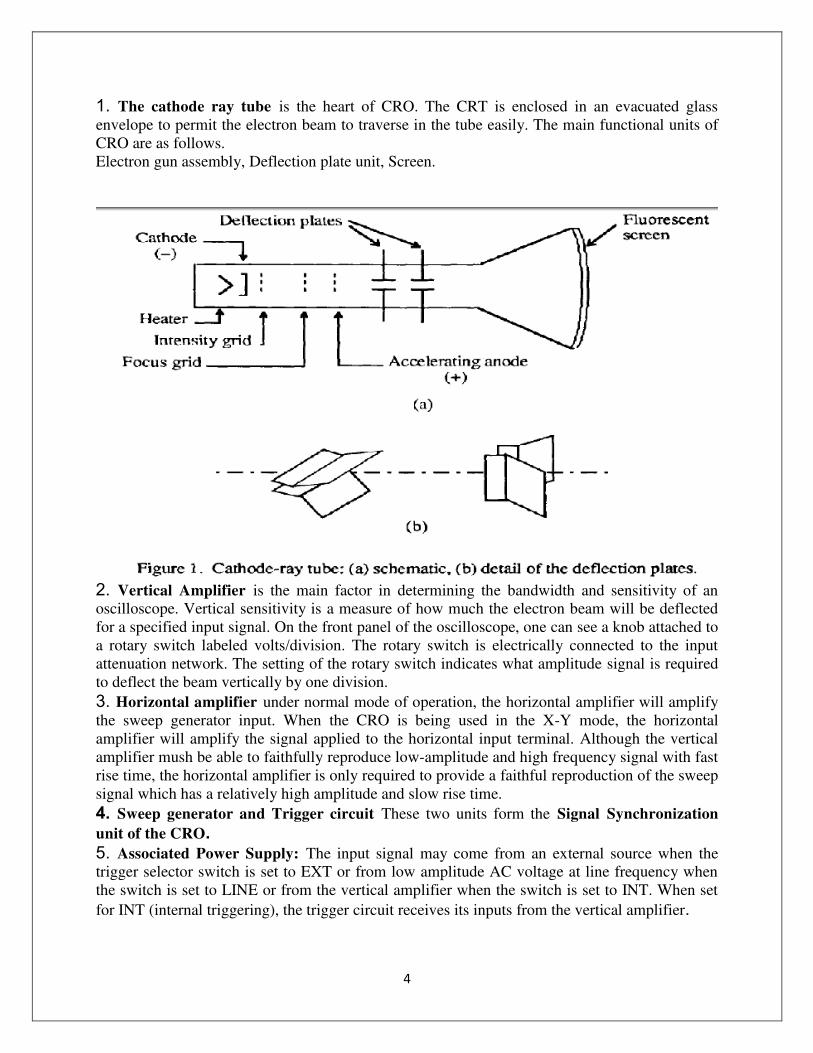
1. The cathode ray tube is the heart of CRO. The CRT is enclosed in an evacuated glass
envelope to permit the electron beam to traverse in the tube easily. The main functional units of
CRO are as follows.
Electron gun assembly, Deflection plate unit, Screen.
2. Vertical Amplifier is the main factor in determining the bandwidth and sensitivity of an
oscilloscope. Vertical sensitivity is a measure of how much the electron beam will be deflected
for a specified input signal. On the front panel of the oscilloscope, one can see a knob attached to
a rotary switch labeled volts/division. The rotary switch is electrically connected to the input
attenuation network. The setting of the rotary switch indicates what amplitude signal is required
to deflect the beam vertically by one division.
3. Horizontal amplifier under normal mode of operation, the horizontal amplifier will amplify
the sweep generator input. When the CRO is being used in the X-Y mode, the horizontal
amplifier will amplify the signal applied to the horizontal input terminal. Although the vertical
amplifier mush be able to faithfully reproduce low-amplitude and high frequency signal with fast
rise time, the horizontal amplifier is only required to provide a faithful reproduction of the sweep
signal which has a relatively high amplitude and slow rise time.
4. Sweep generator and Trigger circuit These two units form the Signal Synchronization
unit of the CRO. 5. Associated Power Supply: The input signal may come from an external source when the
trigger selector switch is set to EXT or from low amplitude AC voltage at line frequency when
the switch is set to LINE or from the vertical amplifier when the switch is set to INT. When set
for INT (internal triggering), the trigger circuit receives its inputs from the vertical amplifier.
5
MEASUREMENTS USING CRO:-
1.1 Measurement of Voltage Using CRO :
A voltage can be measured by noting the Y deflection produced by the voltage; using this
deflection in conjunction with the Y-gain setting, the voltage can be calculated as follows :
V = (no. of boxes in cm.) x (selected Volts/cm scale)
1.2 Measurement of Current and Resistance Using a CRO :
Using the general method, a correctly calibrated CRO can be used in conjunction with a known
value of resistance R to determine the current I flowing through the resistor.
1.3 Measurement of Frequency Using a CRO :
A simple method of determining the frequency of a signal is to estimate its periodic time from
the trace on the screen of a CRT. However this method has limited accuracy, and should only be
used where other methods are not available. To calculate the frequency of the observed signal,
one has to measure the period, i.e. the time taken for 1 complete cycle, using the calibrated
sweep scale. The period could be calculated by
T = (no. of squares in cm) x (selected Time/cm scale)
Once the period T is known, the frequency is given by
f (Hz)= 1/T(sec)
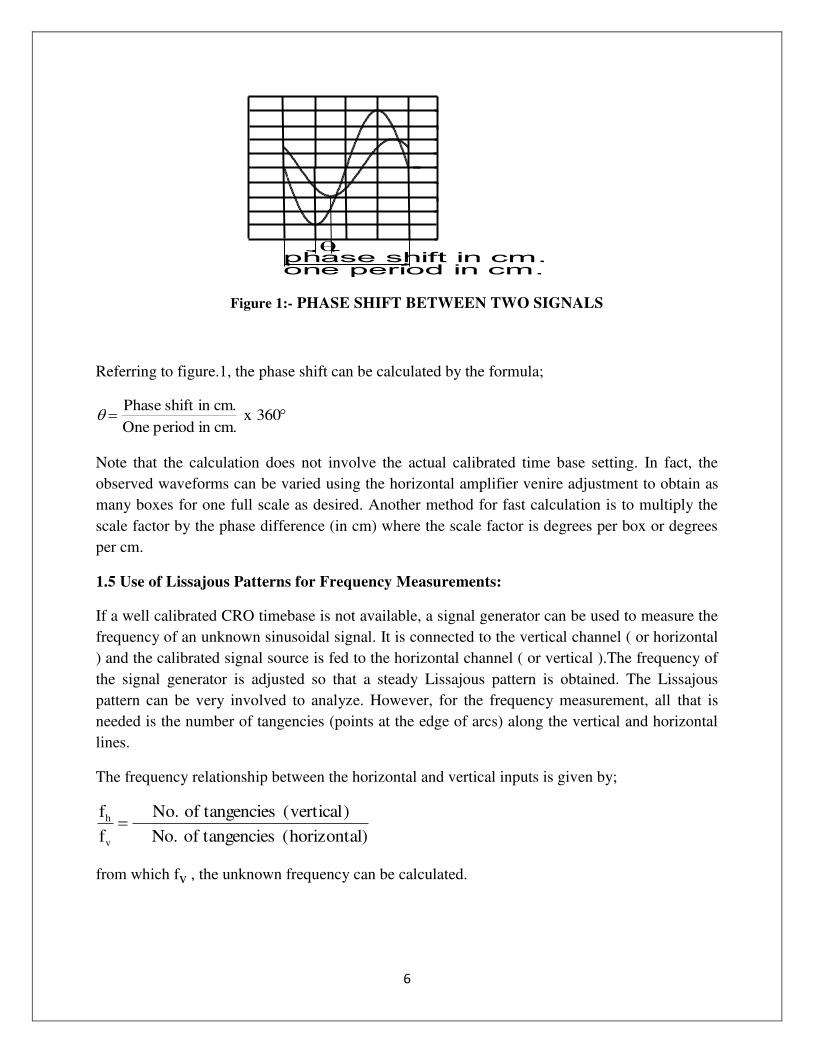
1.4. Measurement of Phase:
The calibrated time scales can be used to calculate the phase shift between two sinusoidal signals
of the same frequency. If a dual trace or beam CRO is available to display the two signals
simultaneously (one of the signals is used for synchronization), both of the signals will appear in
proper time perspective and the amount of time difference between the waveforms can be
measured. This, in turn can be utilized to calculate the phase angle, between the two signals.
6
phase shift in cm.one period in cm.
Figure 1:- PHASE SHIFT BETWEEN TWO SIGNALS
Referring to figure.1, the phase shift can be calculated by the formula;
Phase shift in cm.
One period in cm. x 360
Note that the calculation does not involve the actual calibrated time base setting. In fact, the
observed waveforms can be varied using the horizontal amplifier venire adjustment to obtain as
many boxes for one full scale as desired. Another method for fast calculation is to multiply the
scale factor by the phase difference (in cm) where the scale factor is degrees per box or degrees
per cm.
1.5 Use of Lissajous Patterns for Frequency Measurements:
If a well calibrated CRO timebase is not available, a signal generator can be used to measure the
frequency of an unknown sinusoidal signal. It is connected to the vertical channel ( or horizontal
) and the calibrated signal source is fed to the horizontal channel ( or vertical ).The frequency of
the signal generator is adjusted so that a steady Lissajous pattern is obtained. The Lissajous
pattern can be very involved to analyze. However, for the frequency measurement, all that is
needed is the number of tangencies (points at the edge of arcs) along the vertical and horizontal
lines.
The frequency relationship between the horizontal and vertical inputs is given by;
f
f N
h
v
No. of tangencies (vertical)
o. of tangencies (horizontal)
from which fv , the unknown frequency can be calculated.
7
2. PRELIMINARY WORK:
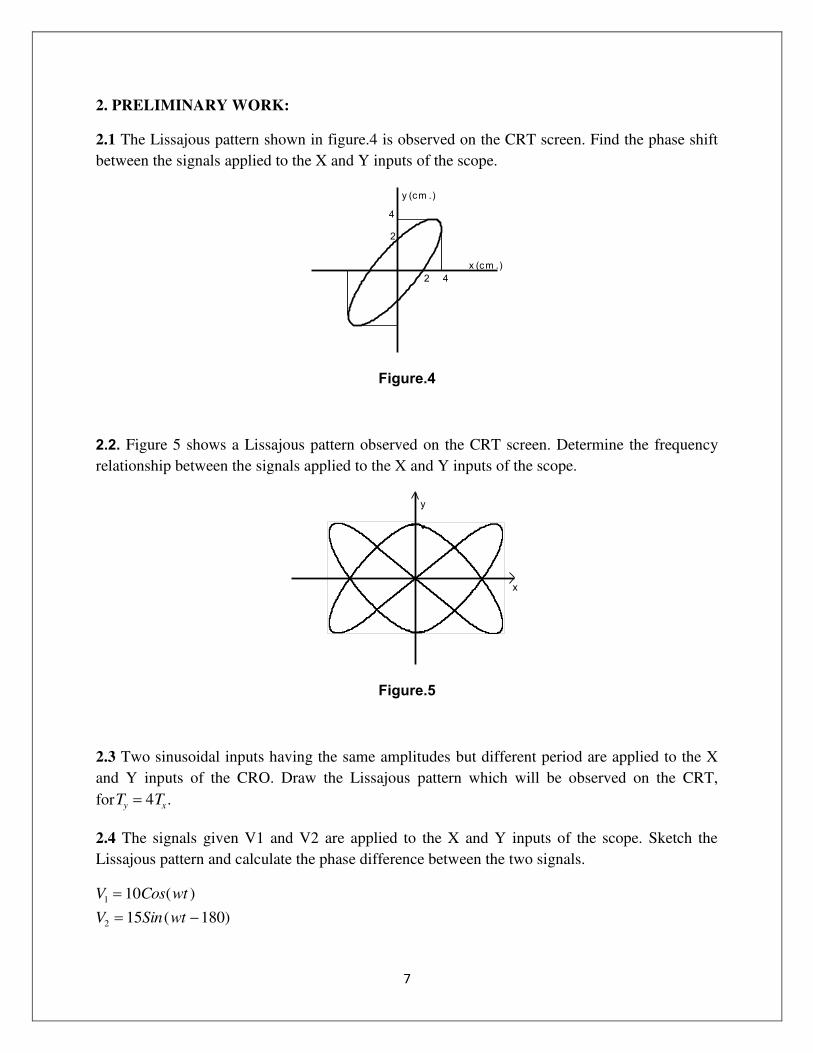
2.1 The Lissajous pattern shown in figure.4 is observed on the CRT screen. Find the phase shift
between the signals applied to the X and Y inputs of the scope.
4
2
42
y (cm .)
x (cm .)
Figure.4
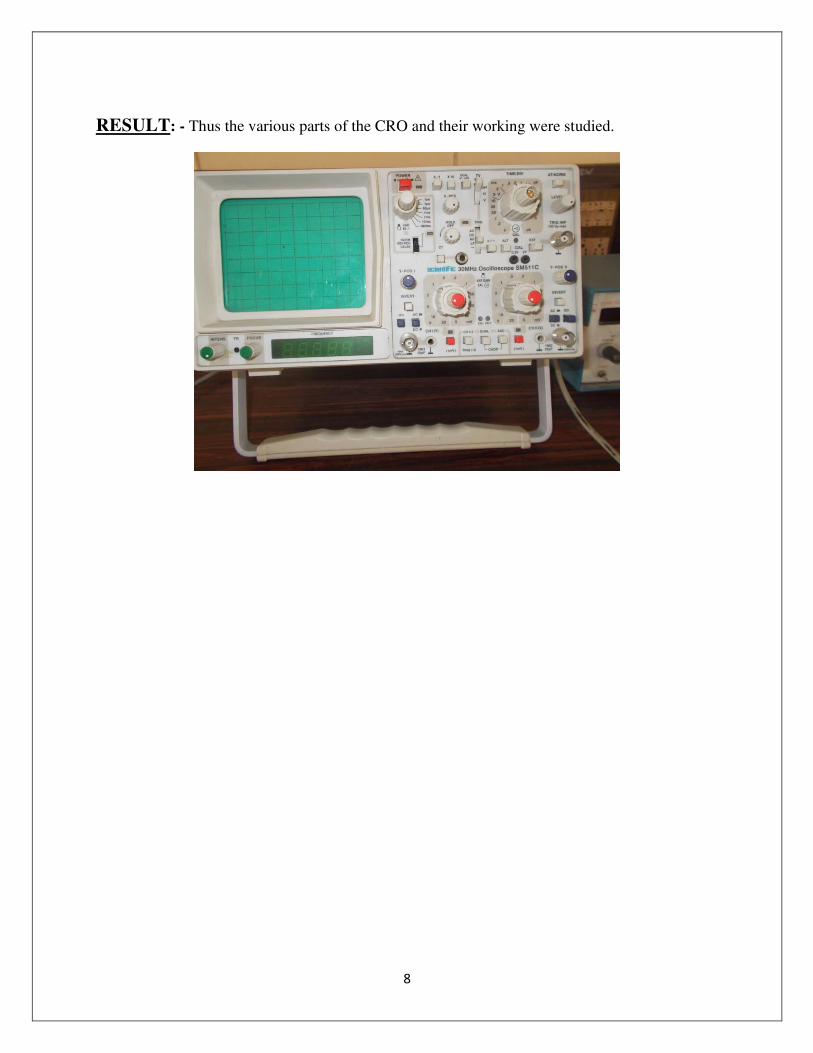
2.2. Figure 5 shows a Lissajous pattern observed on the CRT screen. Determine the frequency
relationship between the signals applied to the X and Y inputs of the scope.
y
x
Figure.5
2.3 Two sinusoidal inputs having the same amplitudes but different period are applied to the X
and Y inputs of the CRO. Draw the Lissajous pattern which will be observed on the CRT,
forT Ty x 4 .
2.4 The signals given V1 and V2 are applied to the X and Y inputs of the scope. Sketch the
Lissajous pattern and calculate the phase difference between the two signals.
V Cos wt
V Sin wt
1
2
10
15 180
( )
( )
8
RESULT: - Thus the various parts of the CRO and their working were studied.
9
EXPERIMENT NO. 2
OBJECTIVE: -To study the characteristics of an LVDT position sensor with respect to the
secondary output voltage.
APPARATUS REQUIRED: - Trainer Kit, Connecting Leads, Digital Multimeter.
THEORY: - Displacement transducer generally covers those mechanical elements which
convert force into displacement and then displacement into electrical signals.
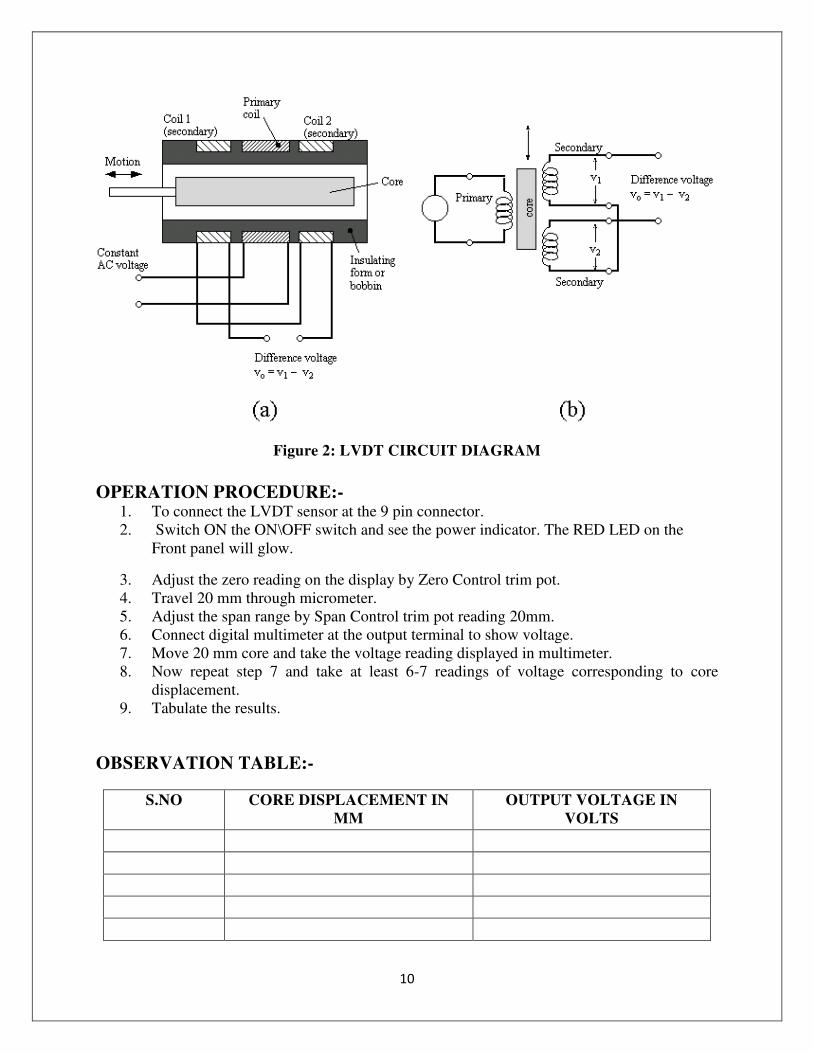
The LVDT is basically a mutual induction type transducer with variable coupling between
the primary and the two secondary coils. LVDT consist of primary coil, uniformly wound over a
certain length of transducer and two identical secondary coils symmetrically wound on either
side of a primary coil and away from the center as shown in the fig. The iron core is free to move
inside the coils in either direction from the null (central) position. When the primary coil is
excited by primary supply, the induced emfs of the secondary’s are equal to each other with the core lying in the center or null position. The secondaries are connected in series opposition so
that the resultant output is zero. Displacement of movable core in either direction from the null
position will result in output voltage proportional to displacement but of opposite polarity.
LVDT find a number of applications in both measurement and control system. The
extremely fine resolution, high accuracy, and good stability make the device particularly suitable
as a short-stroke, position-measuring device.
CIRCUIT DIAGRAM:-
Figure 1: LVDT CUTAWAY
10
Figure 2: LVDT CIRCUIT DIAGRAM
OPERATION PROCEDURE:- 1. To connect the LVDT sensor at the 9 pin connector.
2. Switch ON the ON\OFF switch and see the power indicator. The RED LED on the
Front panel will glow.
3. Adjust the zero reading on the display by Zero Control trim pot.
4. Travel 20 mm through micrometer.
5. Adjust the span range by Span Control trim pot reading 20mm.
6. Connect digital multimeter at the output terminal to show voltage.
7. Move 20 mm core and take the voltage reading displayed in multimeter.
8. Now repeat step 7 and take at least 6-7 readings of voltage corresponding to core
displacement.
9. Tabulate the results.
OBSERVATION TABLE:-
S.NO CORE DISPLACEMENT IN
MM
OUTPUT VOLTAGE IN
VOLTS
11
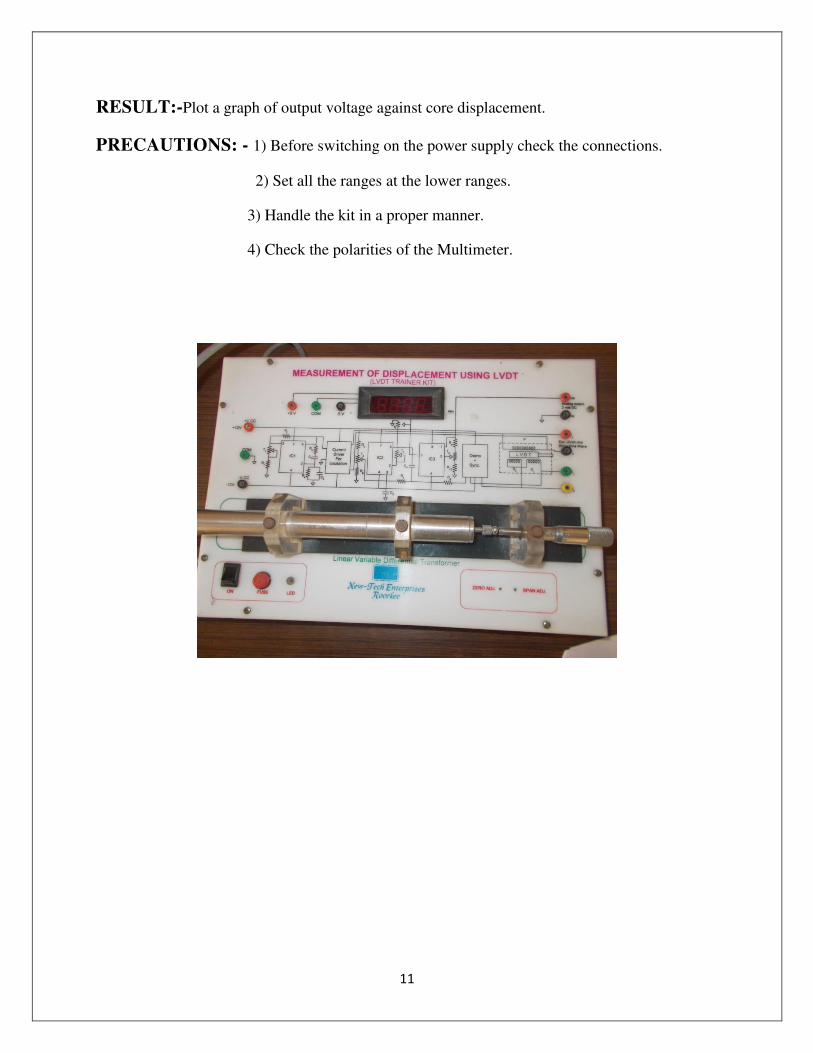
RESULT:-Plot a graph of output voltage against core displacement.
PRECAUTIONS: - 1) Before switching on the power supply check the connections.
2) Set all the ranges at the lower ranges.
3) Handle the kit in a proper manner.
4) Check the polarities of the Multimeter.
12
EXPERIMENT NO.3
OBJECTIVE:- To measure the intensity of light using LDR.
APPARATUS REQUIRED:- LDR, trainer kit, Lamp holder, Voltmeter , ammeter,
wooden stand as distance scale.
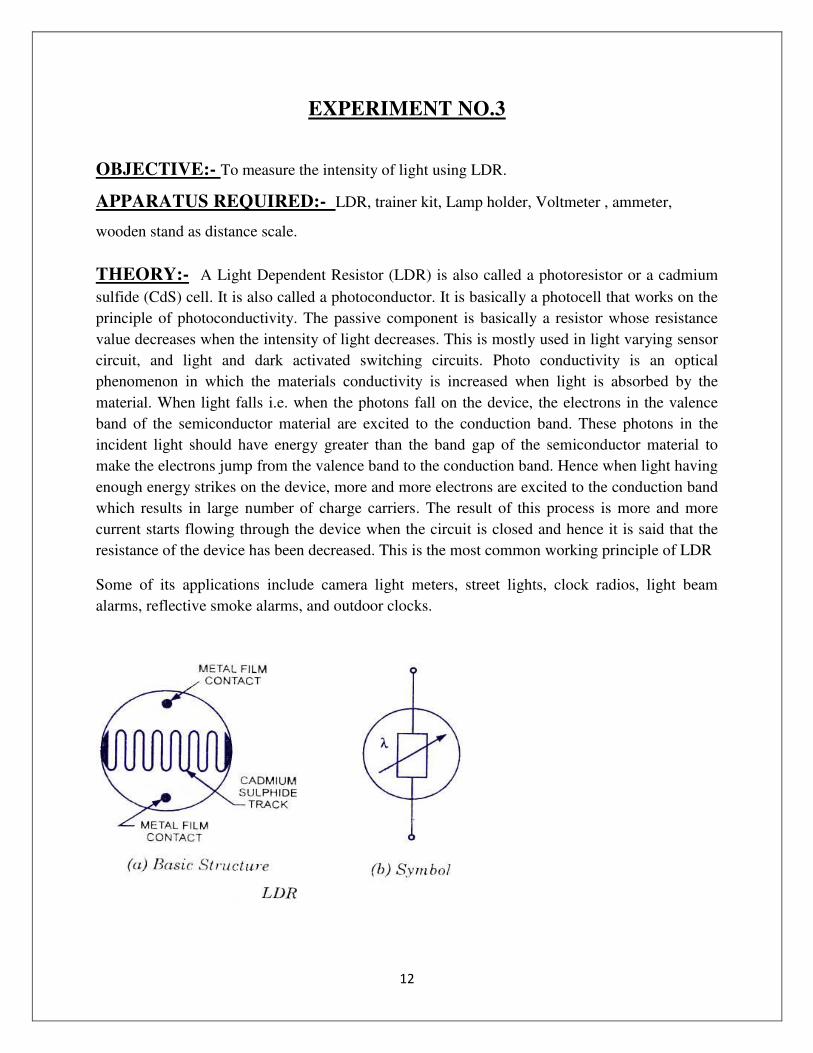
THEORY:- A Light Dependent Resistor (LDR) is also called a photoresistor or a cadmium
sulfide (CdS) cell. It is also called a photoconductor. It is basically a photocell that works on the
principle of photoconductivity. The passive component is basically a resistor whose resistance
value decreases when the intensity of light decreases. This is mostly used in light varying sensor
circuit, and light and dark activated switching circuits. Photo conductivity is an optical
phenomenon in which the materials conductivity is increased when light is absorbed by the
material. When light falls i.e. when the photons fall on the device, the electrons in the valence
band of the semiconductor material are excited to the conduction band. These photons in the
incident light should have energy greater than the band gap of the semiconductor material to
make the electrons jump from the valence band to the conduction band. Hence when light having
enough energy strikes on the device, more and more electrons are excited to the conduction band
which results in large number of charge carriers. The result of this process is more and more
current starts flowing through the device when the circuit is closed and hence it is said that the
resistance of the device has been decreased. This is the most common working principle of LDR
Some of its applications include camera light meters, street lights, clock radios, light beam
alarms, reflective smoke alarms, and outdoor clocks.
13
PROCEDURE :- 1) Connect the output of DC power supply (0-3 V DC) to the input of the
LDR circuit. Also connect voltmeter, current meter and LDR in the circuit.
2) Place the lamp holder and LDR on a graduated wooden stand opposite to each other . Connect
the lamp to AC mains and focus the light on LDR.
3) Switch ON the instrument using ON/OFF toggle switch.
4) Now increase the power supply voltage in small steps and every time note down the voltage
and current. Calculate the resistance value of LDR.
5) Vary the distance (d) between LDR and light source and repeat the experiment again.
6) Plot graph between Resistance (R) and Distance (d2).
OBSERVATION TABLE:-
S.NO Distance of
Lamp from
LDR (cm)
Ammeter
reading (mA)
Resistance of
LDR
Voltmeter
reading(V)
D2
RESULT:-

14
EXPERIMENT NO.4
OBJECTIVE:- To measure the intensity of light using Photodiode.
APPARATUS REQUIRED:- Photodiode, trainer kit, Lamp holder, Voltmeter , ammeter,
wooden stand as distance scale.
THEORY:- A photodiode is a semiconductor device that converts light into current. The
current is generated when photons are absorbed in the photodiode. A small amount of current is
also produced when no light is present. Photodiodes may contain optical filters, built-in lenses,
and may have large or small surface areas. Photodiodes usually have a slower response time as
their surface area increases. The common, traditional solar cell used to generate electric solar
power is a large area photodiode.
Light energy can be considered in terms of photons or packets of light. When a photon of
sufficient energy enters the depletion region of a semiconductor diode, it may strike an atom with
sufficient energy to release the electron from the atomic structure. This creates a free electron
and a hole (i.e. an atom with a space for an electron). The electron is negatively charged, while
the hole is positively charged.
The electrons and holes may remain free, or other electrons may combine with holes to form
complete atoms again in the crystal lattice. However it is possible that the electrons and holes
may remain free and be pulled away from the depletion region by an external field. In this way
the current through the diode will change and a photocurrent is produced.
Some of its applications include camera light meters, street lights, clock radios, light beam
alarms, reflective smoke alarms, and outdoor clocks.
PROCEDURE :- 1) Connect the output of DC power supply (0-3 V DC) to the input of the
Photo Diode circuit. Also connect voltmeter, current meter and Photo Diode in the circuit
through patch cords shown by dotted lines.

15
2) Place the lamp holder and Photo Diode on a graduated wooden stand opposite to each other.
Connect the lamp to AC mains and focus the light on Photo Diode. Select the range of current
meter to 50µA.
3) Switch ON the instrument using ON/OFF toggle switch provided on the front panel.
4) Now increase the power supply voltage in small steps and every time note down the voltage
and current.
5) Plot graph between Voltage and Current by taking Voltage along X-axis & Current along Y-
axis.
6) Repeat the experiment for different distances between Lamp & photo diode
OBSERVATION TABLE:-
S.NO Reverse Voltage
(V)
Reverse Current
(I)
RESULT:-
16
EXPERIMENT NO.5
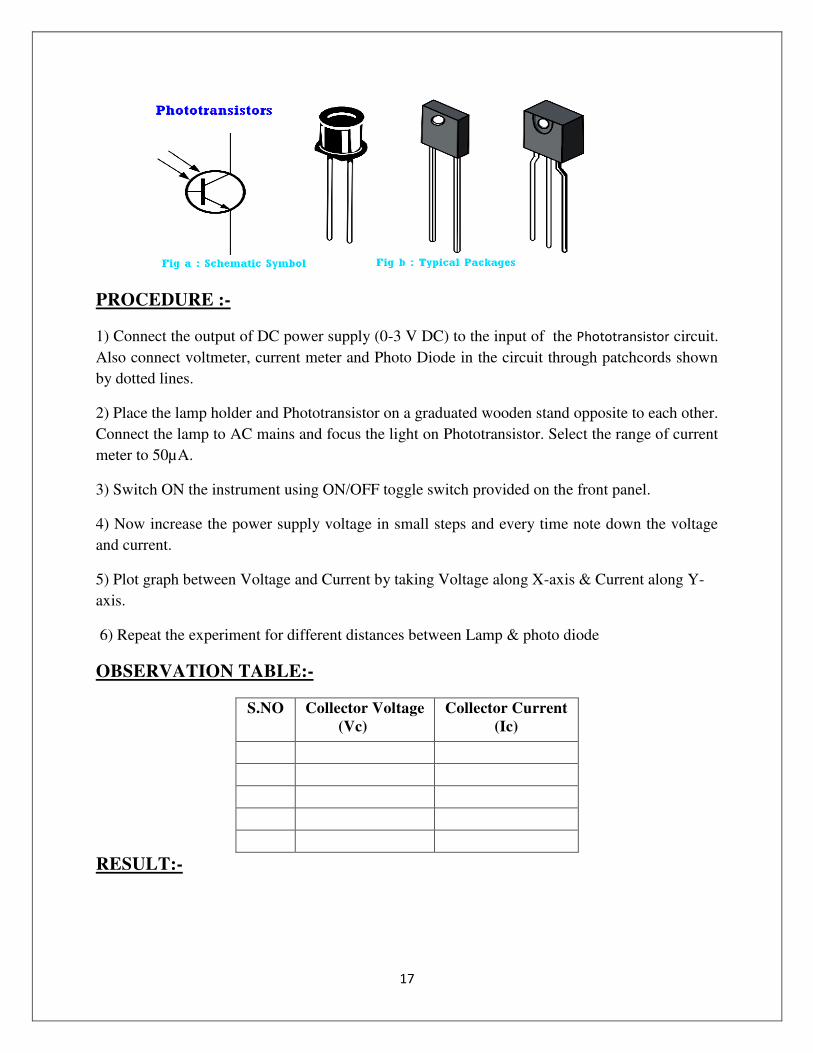
OBJECTIVE:- To measure the intensity of light using Phototransistor.
APPARATUS REQUIRED:- Phototransistor, trainer kit, Lamp holder, Voltmeter ,
ammeter, wooden stand as distance scale.
THEORY:- Phototransistors are either tri-terminal (emitter, base and collector) or bi-
terminal (emitter and collector) semiconductor devices which have a light-sensitive base region.
Although all transistors exhibit light-sensitive nature, these are specially designed and optimized
for photo applications. These are made of diffusion or ion-implantation and have much larger
collector and base regions in comparison with the ordinary transistors. These devices can be
either homojunction structured or heterojunction structured, as shown by Figure 1a and 1b,
respectively. In the case of homojunction phototransistors, the entire device will be made of a
single material-type; either silicon or germanium. However to increase their efficiency, the
phototransistors can be made of non-identical materials (Group III-V materials like GaAs) on
either side of the pn junction leading to heterojunction devices. Nevertheless, homojunction
devices are more often used in comparison with the hetero junction devices as they are
economical.
Light energy can be considered in terms of photons or packets of light. When a photon of
sufficient energy enters the depletion region of a semiconductor diode, it may strike an atom with
sufficient energy to release the electron from the atomic structure. This creates a free electron
and a hole (i.e. an atom with a space for an electron). The electron is negatively charged, while
the hole is positively charged.
The electrons and holes may remain free, or other electrons may combine with holes to form
complete atoms again in the crystal lattice. However it is possible that the electrons and holes
may remain free and be pulled away from the depletion region by an external field. In this way
the current through the diode will change and a photocurrent is produced.
Some of its applications include camera light meters, street lights, clock radios, light beam
alarms, reflective smoke alarms, and outdoor clocks.
17
PROCEDURE :-
1) Connect the output of DC power supply (0-3 V DC) to the input of the Phototransistor circuit.
Also connect voltmeter, current meter and Photo Diode in the circuit through patchcords shown
by dotted lines.
2) Place the lamp holder and Phototransistor on a graduated wooden stand opposite to each other.
Connect the lamp to AC mains and focus the light on Phototransistor. Select the range of current
meter to 50µA.
3) Switch ON the instrument using ON/OFF toggle switch provided on the front panel.
4) Now increase the power supply voltage in small steps and every time note down the voltage
and current.
5) Plot graph between Voltage and Current by taking Voltage along X-axis & Current along Y-
axis.
6) Repeat the experiment for different distances between Lamp & photo diode
OBSERVATION TABLE:-
S.NO Collector Voltage
(Vc)
Collector Current
(Ic)
RESULT:-
18
EXPERIMENT NO.6
OBJECTIVE:- To convert the heat energy (Temperature) into electrical signal using
Thermocouple Transducer.
APPARATUS REQUIRED:- Trainer Kit, Water Heater, Connecting Leads.
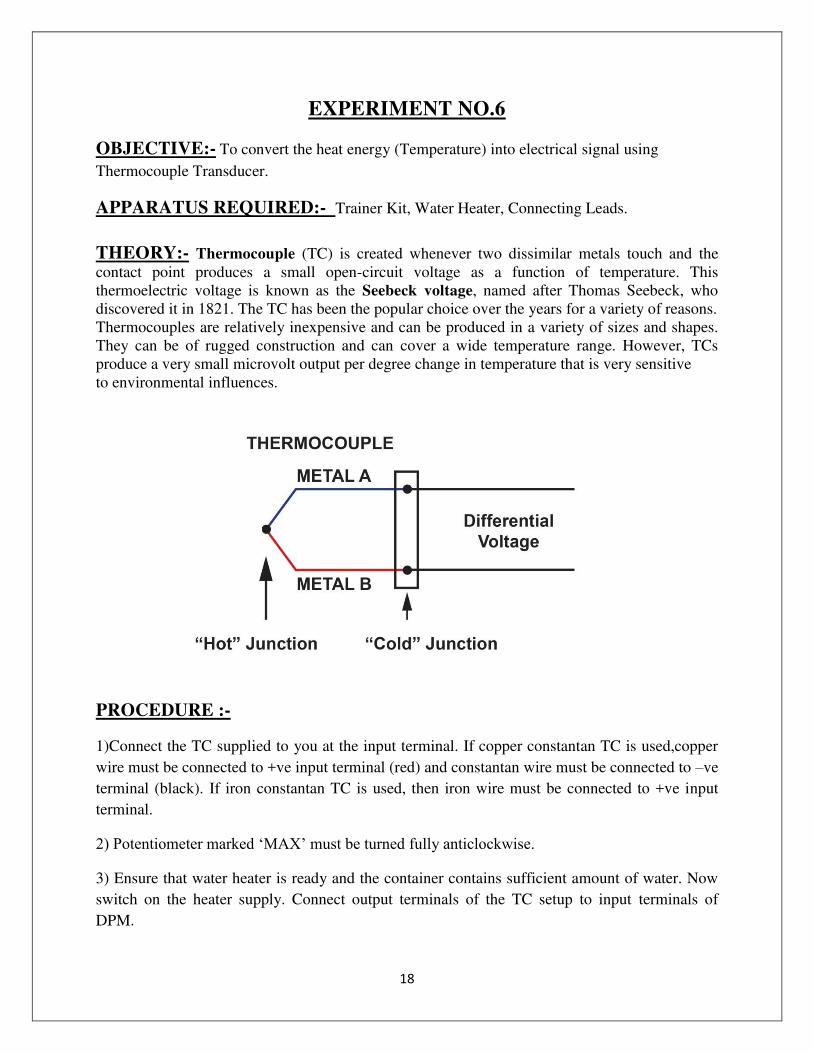
THEORY:- Thermocouple (TC) is created whenever two dissimilar metals touch and the
contact point produces a small open-circuit voltage as a function of temperature. This
thermoelectric voltage is known as the Seebeck voltage, named after Thomas Seebeck, who
discovered it in 1821. The TC has been the popular choice over the years for a variety of reasons.
Thermocouples are relatively inexpensive and can be produced in a variety of sizes and shapes.
They can be of rugged construction and can cover a wide temperature range. However, TCs
produce a very small microvolt output per degree change in temperature that is very sensitive
to environmental influences.
PROCEDURE :-
1)Connect the TC supplied to you at the input terminal. If copper constantan TC is used,copper
wire must be connected to +ve input terminal (red) and constantan wire must be connected to –ve
terminal (black). If iron constantan TC is used, then iron wire must be connected to +ve input
terminal.
2) Potentiometer marked ‘MAX’ must be turned fully anticlockwise.
3) Ensure that water heater is ready and the container contains sufficient amount of water. Now
switch on the heater supply. Connect output terminals of the TC setup to input terminals of
DPM.
19
4) Prepare a mixture of melting ice and keep the mixture stirring regularly. Immerse the TC in
the ice bath and adjust the pot. Marked minimum on the panel to get zero on the DPM.
5) When the water starts boiling, the potentiometer marked Max is adjusted to get an indication
of the boiling point temperature (which is measured with the help of mercury in the glass tight
thermometer). Repeat steps 4 & 5 until u get satisfactory indication at 0 degree and at boiling
point.
6) Turn OFF the heater so that water starts cooling. Note the indicating reading on DPM and the
thermometer reading. Enter the observations in table no.1 given below and then plot the graph of
thermometer reading on x-axis and thermocouple reading on y-axis choosing proper scales.
OBSERVATION TABLE:-
S. No. Thermometer Reading in ºC Thermocouple
Output Voltage (DPM
reading)
At the end of the experiment the following points may be noted.
1. TC output is fairly linear and there is good agreement in the reading shown by the TC
and the Thermometer. Calibration curve can be seen to be almost a straight line.
2. When the TC is taken out of ice bath and immersed in boiling water,the rise in
temperature is indicated almost instantaneously. This shows that the TC has got very
good time response.
NOTE: DPM used is 199.9 milivolt types. The minimum temperature indicated is 199.9
C.i.e. 1 milivolt is equal to 1 degree centigrade.
PRECAUTIONS:-1) While connecting the TC to the input terminals, observe correct
polarity.
2) A broken or unconnected TC will give out of scale indication.
3) Please ensure that the TC tip does not touch the heater element directly. Proper earthing of the
heater may be ensured. Proper stirring of hot water must be carried out.
20
EXPERIMENT NO.7
OBJECTIVE:- To convert the heat energy (Temperature) into electrical signal using RTD
Transducer.
APPARATUS REQUIRED:- Trainer Kit, Water Heater, Connecting Leads.
THEORY:- RTD is resistance temperature detector. The resistance of a conductor
changes with change in temperature, this property is utilized for measurement of
temperature. The variation of resistance with temperature is represented by following
relationships for most of the metals.
R = R0 [1+ 1T + 2 T+……..+ n T]
R0 = Resistance at temperature T = 0
1, 2, n = Constants
Platinum is especially suited for this purpose, as it can withstand the high
temperatures while maintaining high stability. The requirements of a good conductor
material to be used in RTD are
1. The change in the resistance of material per unit change in temperature should
be less as large as possible.
2. The material should have a high value of resistively so that minimum volume
of material should be used for the construction of RTD.
3. The resistance of the material should have a continuous and stable relationship
with temperature.
4. The most common RTD’s are made of platinum, nickel or nickel alloys. The
economical nickel wires are used for a limited range of temperatures. Metals
most commonly used for resistance thermometer along with their properties
are listed below.
21
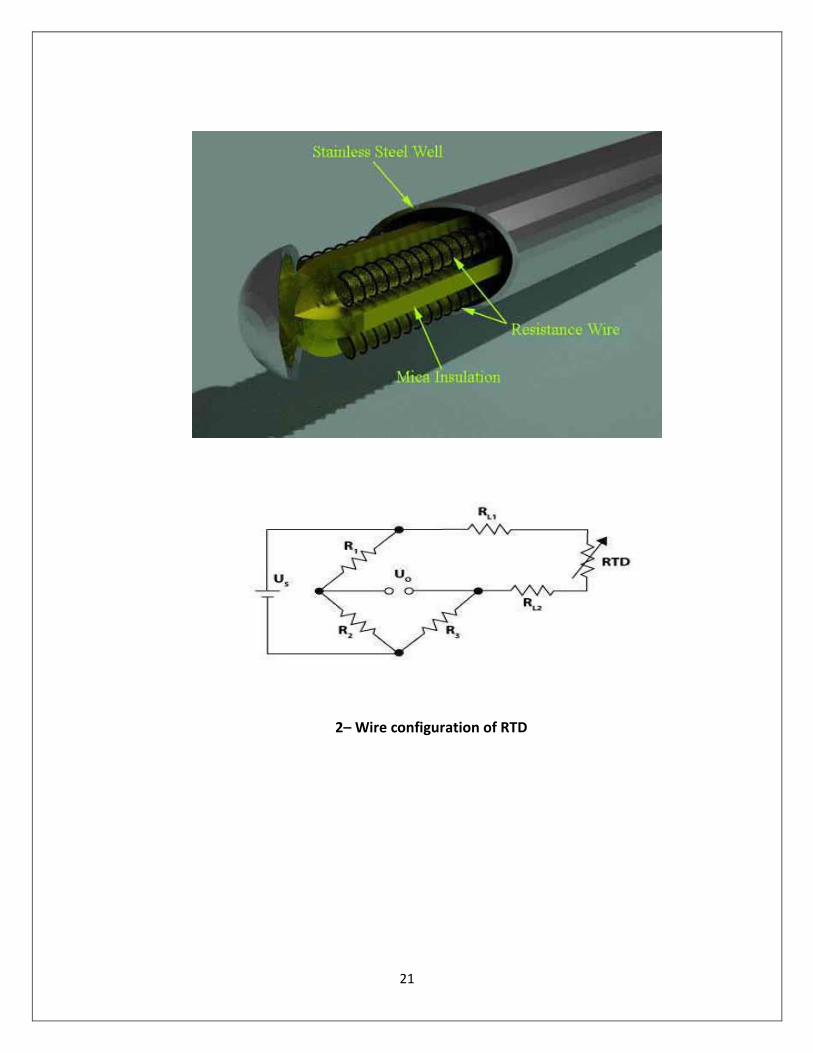
2– Wire configuration of RTD
22
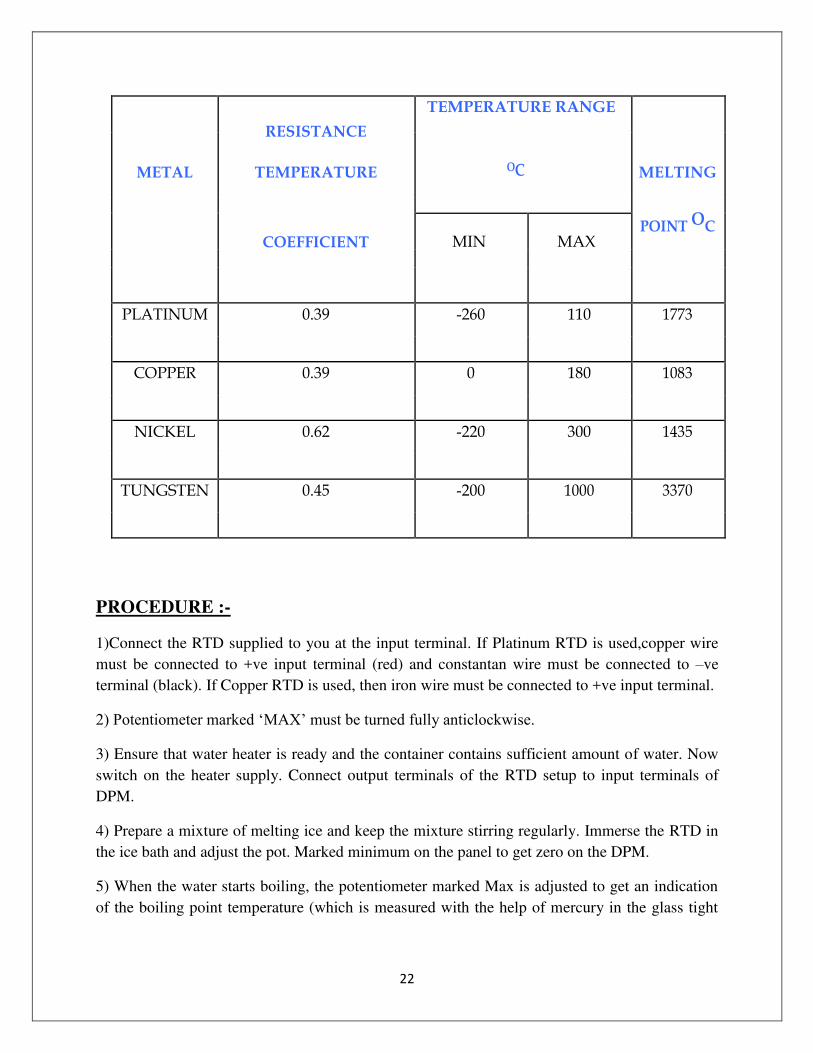
RESISTANCE
TEMPERATURE RANGE
METAL TEMPERATURE OC MELTING
POINT O
C
COEFFICIENT MIN MAX
PLATINUM 0.39 -260 110 1773
COPPER 0.39 0 180 1083
NICKEL 0.62 -220 300 1435
TUNGSTEN 0.45 -200 1000 3370
PROCEDURE :-
1)Connect the RTD supplied to you at the input terminal. If Platinum RTD is used,copper wire
must be connected to +ve input terminal (red) and constantan wire must be connected to –ve
terminal (black). If Copper RTD is used, then iron wire must be connected to +ve input terminal.
2) Potentiometer marked ‘MAX’ must be turned fully anticlockwise.
3) Ensure that water heater is ready and the container contains sufficient amount of water. Now
switch on the heater supply. Connect output terminals of the RTD setup to input terminals of
DPM.
4) Prepare a mixture of melting ice and keep the mixture stirring regularly. Immerse the RTD in
the ice bath and adjust the pot. Marked minimum on the panel to get zero on the DPM.
5) When the water starts boiling, the potentiometer marked Max is adjusted to get an indication
of the boiling point temperature (which is measured with the help of mercury in the glass tight
23
thermometer). Repeat steps 4 & 5 until u get satisfactory indication at 0 degree and at boiling
point.
6) Turn OFF the heater so that water starts cooling. Note the indicating reading on DPM and the
thermometer reading. Enter the observations in table no.1 given below and then plot the graph of
thermometer reading on x-axis and thermocouple reading on y-axis choosing proper scales.
OBSERVATION TABLE:-
S. No. Thermometer Reading in ºC RTD
Change in Resistance
At the end of the experiment the following points may be noted.
1. RTD output is fairly linear and there is good agreement in the reading shown by the RTD
and the Thermometer. Calibration curve can be seen to be almost a straight line.
2. When the RTD is taken out of ice bath and immersed in boiling water,the rise in
temperature is indicated almost instantaneously. This shows that the RTD has got very
good time response.
PRECAUTIONS:-
1) While connecting the RTD to the input terminals, observe correct polarity.
2) A broken or unconnected RTD will give out of scale indication.
3) Please ensure that the RTD tip does not touch the heater element directly.
4) Proper earthing of the heater may be ensured. Proper stirring of hot water must be carried out.
24
EXPERIMENT NO.8
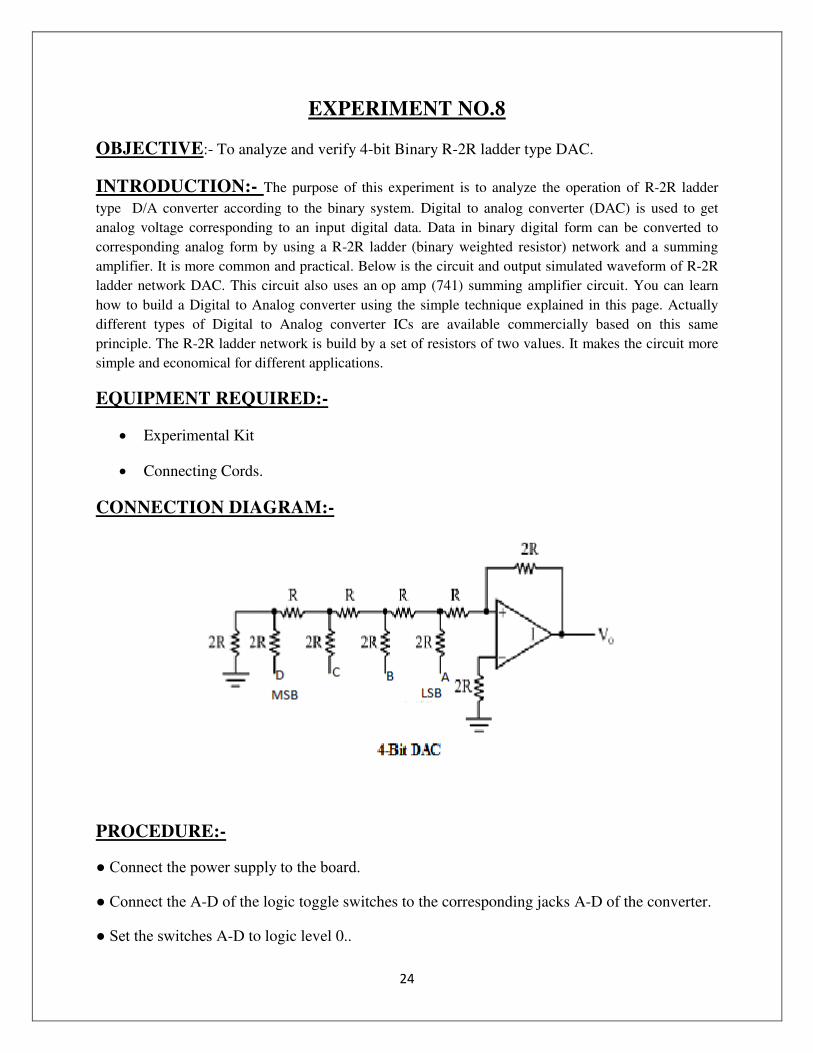
OBJECTIVE:- To analyze and verify 4-bit Binary R-2R ladder type DAC.
INTRODUCTION:- The purpose of this experiment is to analyze the operation of R-2R ladder
type D/A converter according to the binary system. Digital to analog converter (DAC) is used to get
analog voltage corresponding to an input digital data. Data in binary digital form can be converted to
corresponding analog form by using a R-2R ladder (binary weighted resistor) network and a summing
amplifier. It is more common and practical. Below is the circuit and output simulated waveform of R-2R
ladder network DAC. This circuit also uses an op amp (741) summing amplifier circuit. You can learn
how to build a Digital to Analog converter using the simple technique explained in this page. Actually
different types of Digital to Analog converter ICs are available commercially based on this same
principle. The R-2R ladder network is build by a set of resistors of two values. It makes the circuit more
simple and economical for different applications.
EQUIPMENT REQUIRED:-
Experimental Kit
Connecting Cords.
CONNECTION DIAGRAM:-
PROCEDURE:-
● Connect the power supply to the board.
● Connect the A-D of the logic toggle switches to the corresponding jacks A-D of the converter.
● Set the switches A-D to logic level 0..

25
● Connect DPM (on kit) as voltmeter to the output (V0) of the converter.
● Switch the logic toggle switches in binary progression & measure & record the output voltage
in correspondence of every combination of the input code.
● With input code D C B A = 0000 the output voltage VO has to be null: eventual little
deviations against zero are due to the operational amplifier offset.
● Switch off the Power Supply.
OBSERVATION TABLE:-
Logic Inputs
Output voltage
(V)
S. No. D(MSB) C B A(LSB)
26
CONCLUSION:-
As per the applied inputs through the switches then according to the reference voltage the output
voltage is generated in analog form.
27
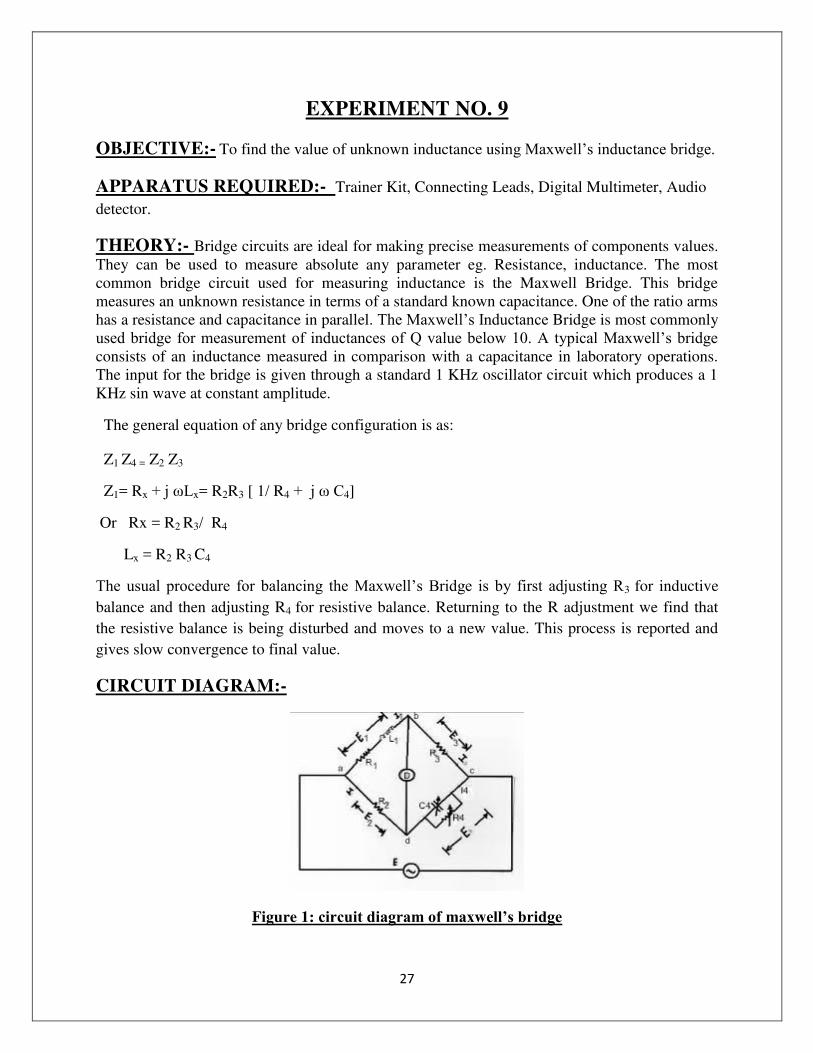
EXPERIMENT NO. 9
OBJECTIVE:- To find the value of unknown inductance using Maxwell’s inductance bridge.
APPARATUS REQUIRED:- Trainer Kit, Connecting Leads, Digital Multimeter, Audio
detector.
THEORY:- Bridge circuits are ideal for making precise measurements of components values.
They can be used to measure absolute any parameter eg. Resistance, inductance. The most
common bridge circuit used for measuring inductance is the Maxwell Bridge. This bridge
measures an unknown resistance in terms of a standard known capacitance. One of the ratio arms
has a resistance and capacitance in parallel. The Maxwell’s Inductance Bridge is most commonly
used bridge for measurement of inductances of Q value below 10. A typical Maxwell’s bridge consists of an inductance measured in comparison with a capacitance in laboratory operations.
The input for the bridge is given through a standard 1 KHz oscillator circuit which produces a 1
KHz sin wave at constant amplitude.
The general equation of any bridge configuration is as:
Z1 Z4 = Z2 Z3
Z1= Rx + j ωLx= R2R3 [ 1/ R4 + j ω C4]
Or Rx = R2 R3/ R4
Lx = R2 R3 C4
The usual procedure for balancing the Maxwell’s Bridge is by first adjusting R3 for inductive
balance and then adjusting R4 for resistive balance. Returning to the R adjustment we find that
the resistive balance is being disturbed and moves to a new value. This process is reported and
gives slow convergence to final value.
CIRCUIT DIAGRAM:-
Figure 1: circuit diagram of maxwell’s bridge
28
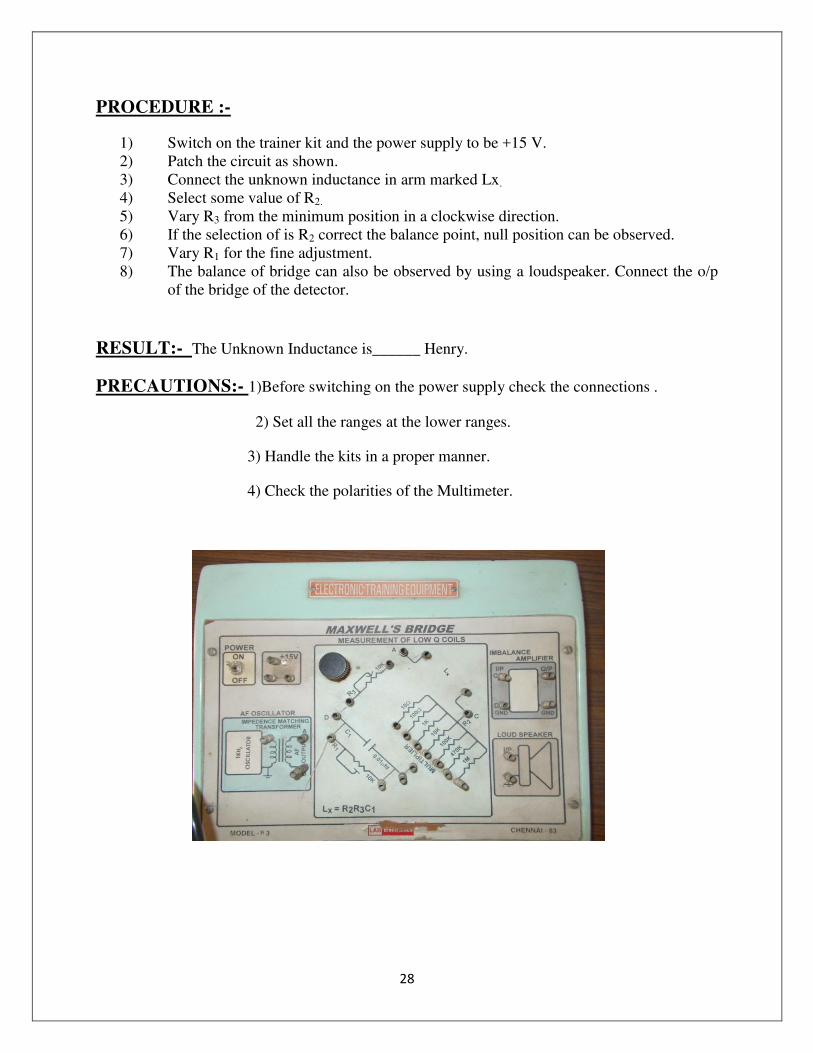
PROCEDURE :-
1) Switch on the trainer kit and the power supply to be +15 V.
2) Patch the circuit as shown.
3) Connect the unknown inductance in arm marked Lx.
4) Select some value of R2.
5) Vary R3 from the minimum position in a clockwise direction.
6) If the selection of is R2 correct the balance point, null position can be observed.
7) Vary R1 for the fine adjustment.
8) The balance of bridge can also be observed by using a loudspeaker. Connect the o/p
of the bridge of the detector.
RESULT:- The Unknown Inductance is______ Henry.
PRECAUTIONS:- 1)Before switching on the power supply check the connections .
2) Set all the ranges at the lower ranges.
3) Handle the kits in a proper manner.
4) Check the polarities of the Multimeter.

29
Safety Instructions
Following instructions are to be followed:
1. Wearing of shoes with rubber sole.
2. Do not touch any terminal or switch without ensuring that it is dead.
3. Use a fuse wire of proper rating only.
4. Switch on the supply only after getting the circuit checked by person.
5. You should start the motor by applying the voltage gradually till the
rated voltage reached and similarly switch off the supply gradually.
6. Use long connecting leads rather than joining two or three small one.
7. In case of emergency or fire shut off the master switch.
8. Do not go to the rear side of the table to avoid electric shock.
9. Do not play with live wire.