Embed Size (px)
Citation preview
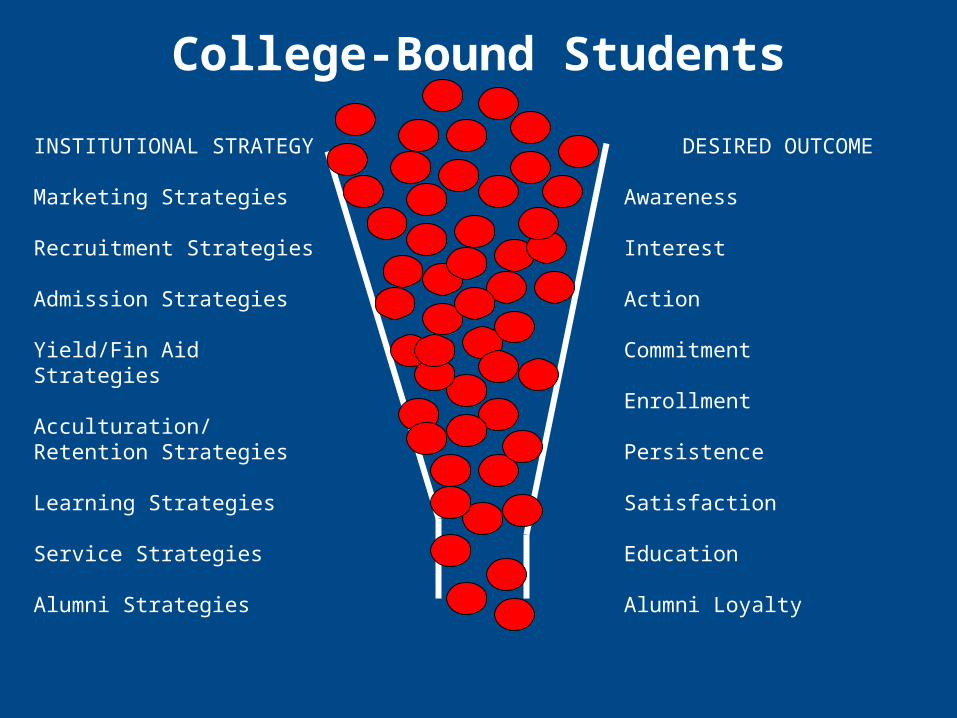
College-Bound Students
DESIRED OUTCOME
Awareness
Interest
Action
Commitment
Enrollment
Persistence
Satisfaction
Education
Alumni Loyalty
INSTITUTIONAL STRATEGY
Marketing Strategies
Recruitment Strategies
Admission Strategies
Yield/Fin Aid Strategies
Acculturation/Retention Strategies
Learning Strategies
Service Strategies
Alumni Strategies
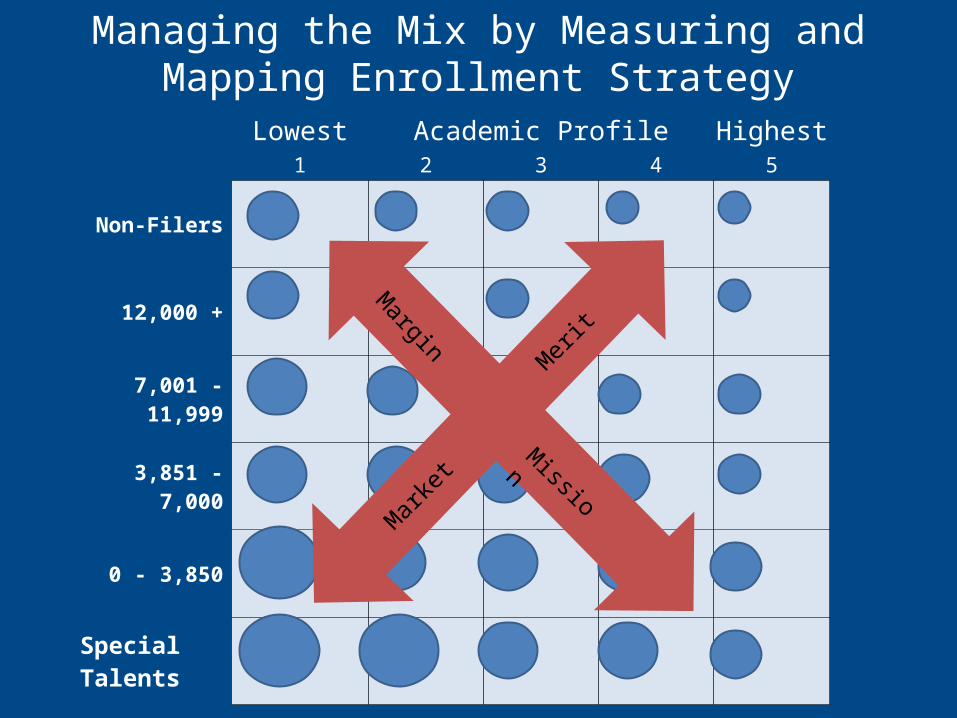
Managing the Mix by Measuring and Mapping Enrollment Strategy
Lowest Academic Profile Highest1 2 3 4 5
Non-Filers
12,000 +
7,001 - 11,999
3,851 - 7,000
0 - 3,850
Special Talents
Margin
Mission
Margin
Merit
Market
DATA DRILLINGWork Reality, Not Emotion
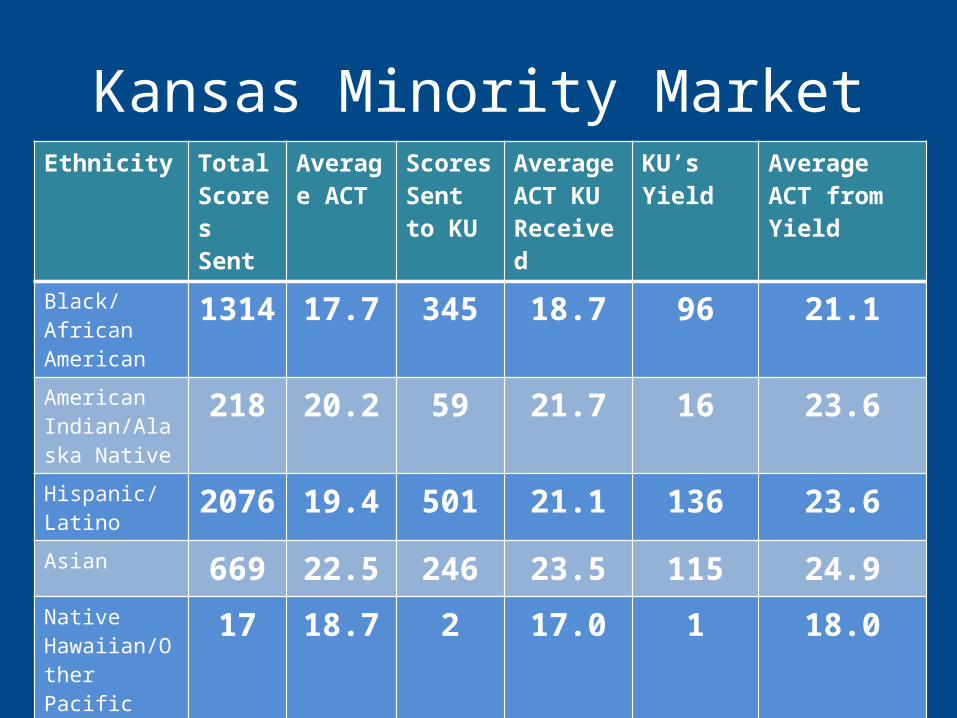
Kansas Minority MarketEthnicity Total
Scores Sent
Average ACT
Scores Sent to KU
Average ACT KU Received
KU’s Yield
Average ACT from Yield
Black/African American
1314
17.7 345 18.7 96 21.1
American Indian/Alaska Native
218 20.2 59 21.7 16 23.6
Hispanic/Latino
2076
19.4 501 21.1 136 23.6
Asian 669 22.5 246 23.5 115 24.9Native Hawaiian/Other Pacific Islander
17 18.7 2 17.0 1 18.0
Total Score Senders
4294
19.4 1153 20.9 246 23.5
KSU WSU ESU Fort Hays Butler Washburn JCCC PSU Newman GCCC0
50
100
150
200
250
300
350
400
450
500
15
16
17
18
19
20
21461
359
171 152 151119 117 99 86 83
20.4
19.8
19.1 19.2
18.5
19.418.9
19.719.4
17.1
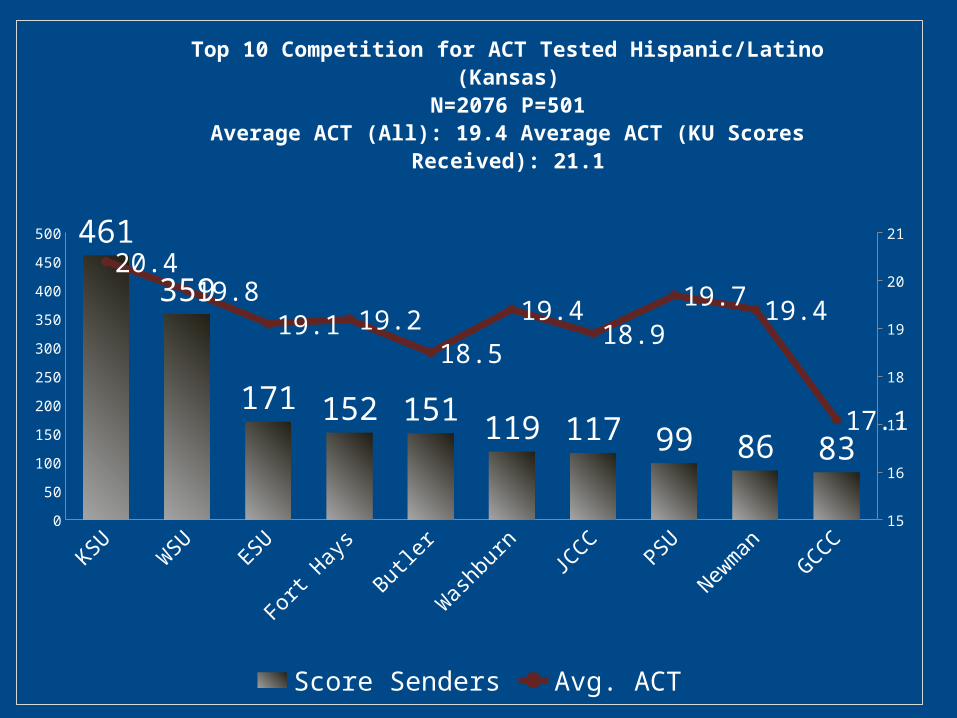
Top 10 Competition for ACT Tested Hispanic/Latino (Kansas)N=2076 P=501
Average ACT (All): 19.4 Average ACT (KU Scores Received): 21.1
Score Senders Avg. ACT
KSU WSU ESU Butler UMKC JCCC Washburn UMC KCKCC PSU0
50
100
150
200
250
300
350
0
5
10
15
20
25
307
151
91 82 7964 58 54 50 49
18.4 18.1 17.3 16.718.1 17.5 17.9
19.5
15.717.4
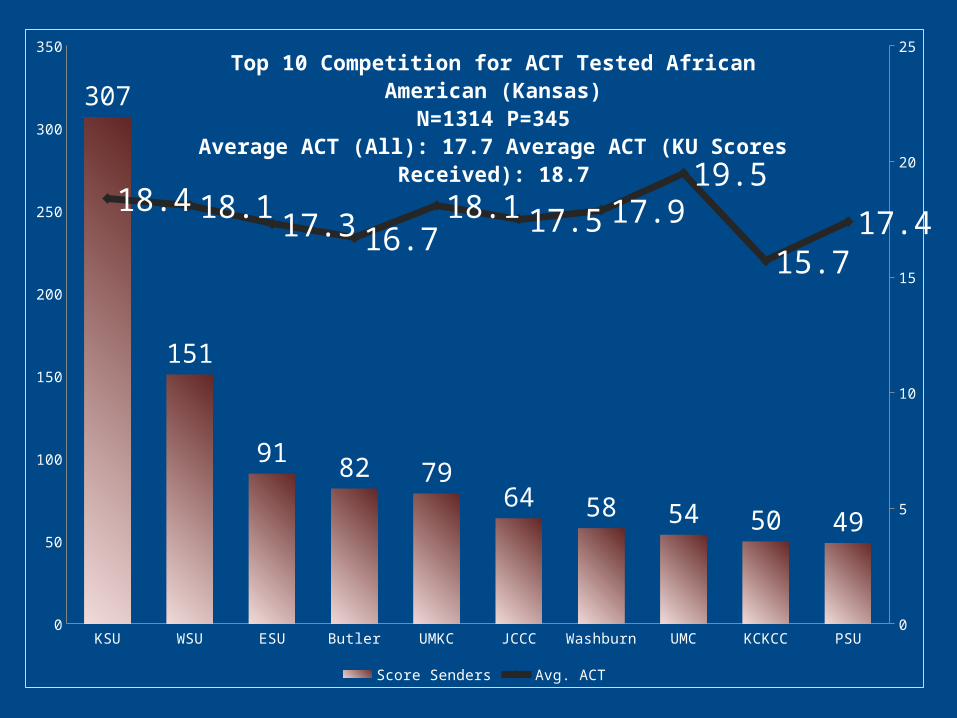
Score Senders Avg. ACT
Top 10 Competition for ACT Tested African American (Kansas)N=1314 P=345
Average ACT (All): 17.7 Average ACT (KU Scores Received): 18.7
Community Colleges – Partners or Competitors?
“Community colleges have long been regarded as the great access point in American higher education. Data just released by the National Student Clearinghouse (NSC) show that these institutions are also the preferred destination for the more than 32% of all new college students who subsequently enroll in another institution of higher education.”
American Association of Community Colleges
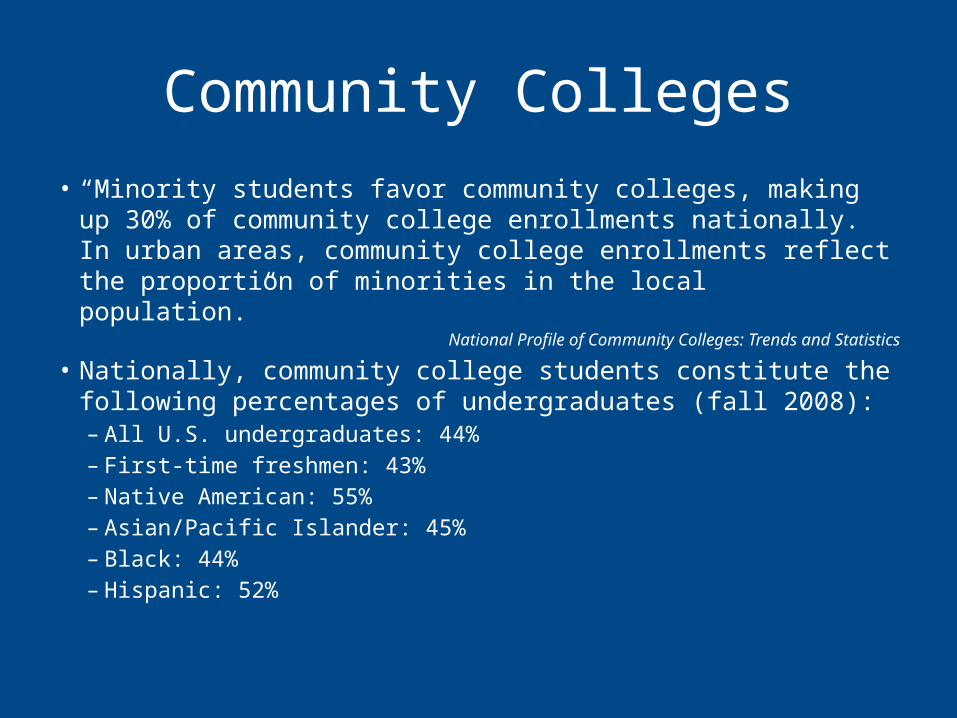
Community Colleges
• “Minority students favor community colleges, making up 30% of community college enrollments nationally. In urban areas, community college enrollments reflect the proportion of minorities in the local population.”
National Profile of Community Colleges: Trends and Statistics
• Nationally, community college students constitute the following percentages of undergraduates (fall 2008):– All U.S. undergraduates: 44%– First-time freshmen: 43%– Native American: 55%– Asian/Pacific Islander: 45%– Black: 44%– Hispanic: 52%
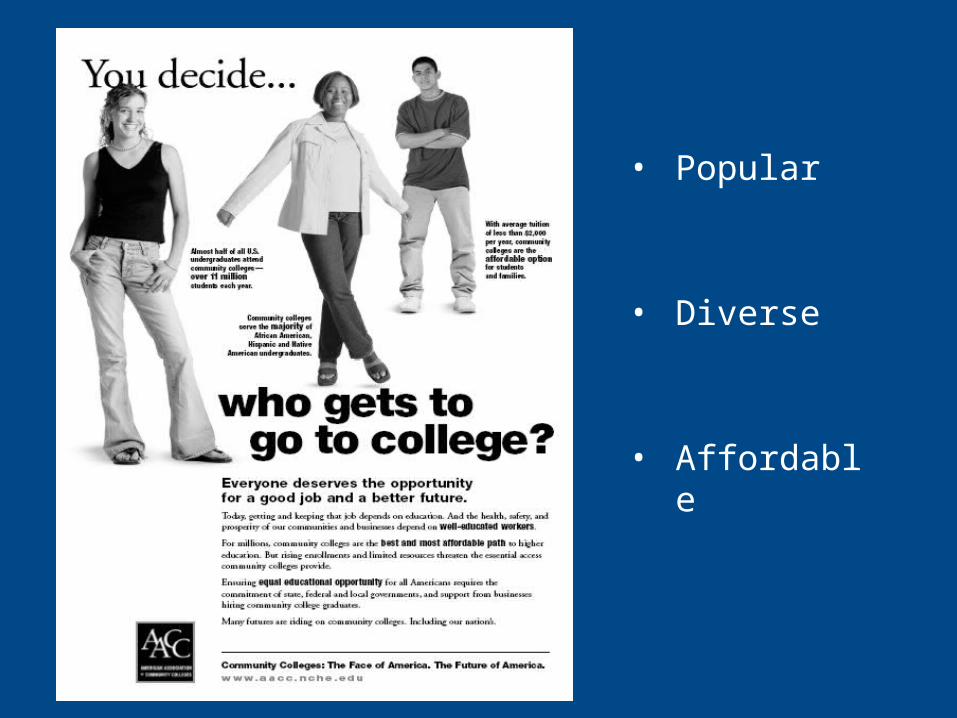
• Popular
• Diverse
• Affordable
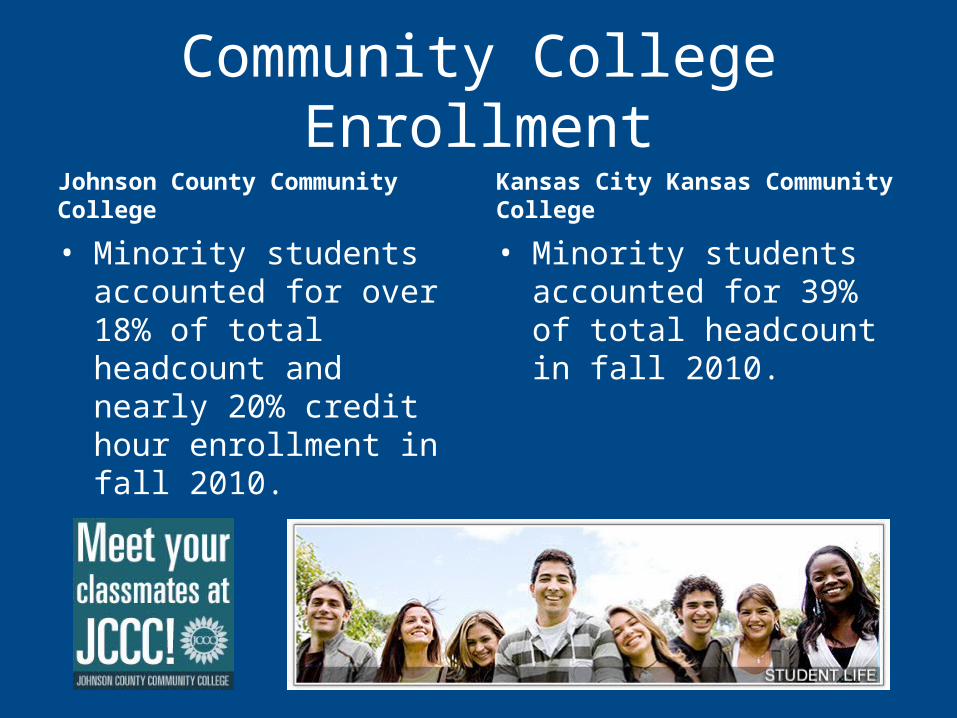
Community College Enrollment
Johnson County Community College
• Minority students accounted for over 18% of total headcount and nearly 20% credit hour enrollment in fall 2010.
Kansas City Kansas Community College
• Minority students accounted for 39% of total headcount in fall 2010.
MARKETING STRATEGIESSuspect Level
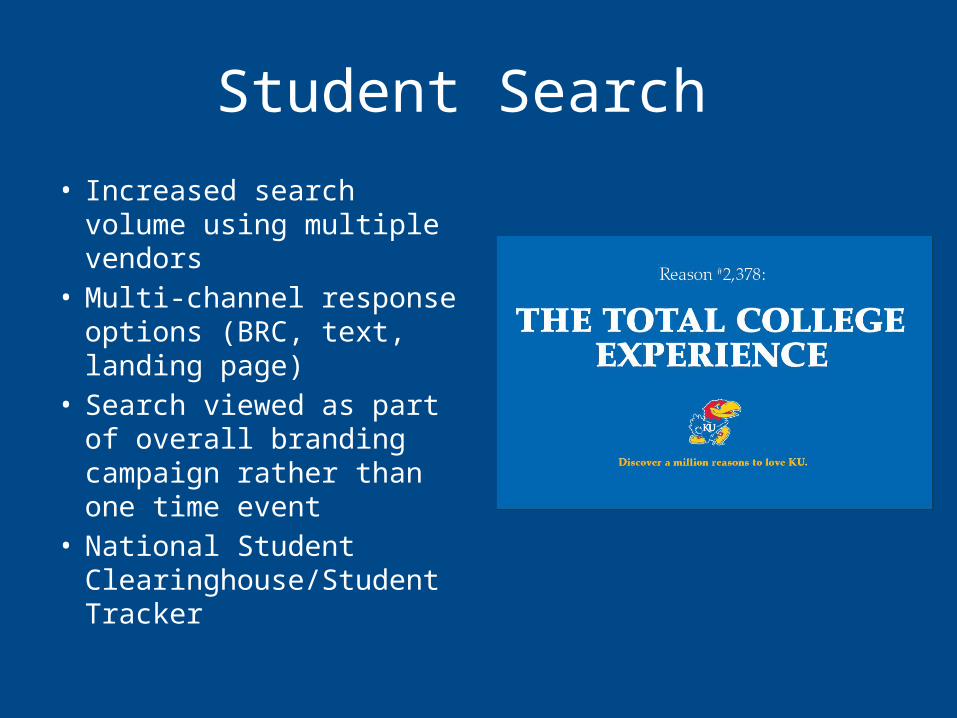
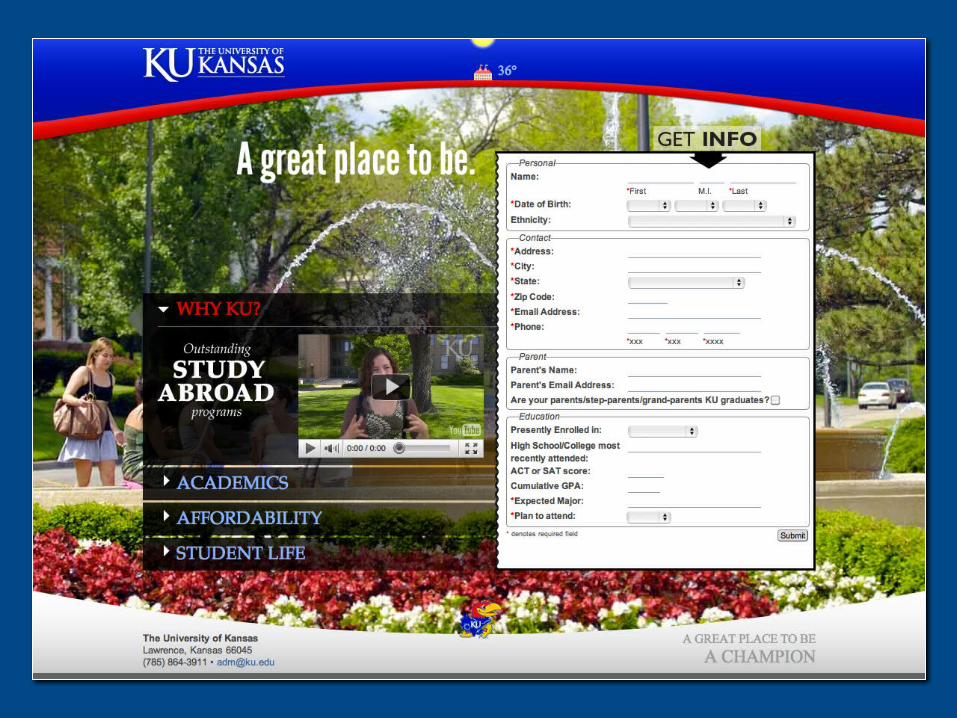
Student Search
• Increased search volume using multiple vendors
• Multi-channel response options (BRC, text, landing page)
• Search viewed as part of overall branding campaign rather than one time event
• National Student Clearinghouse/Student Tracker
OUTREACH STRATEGIES
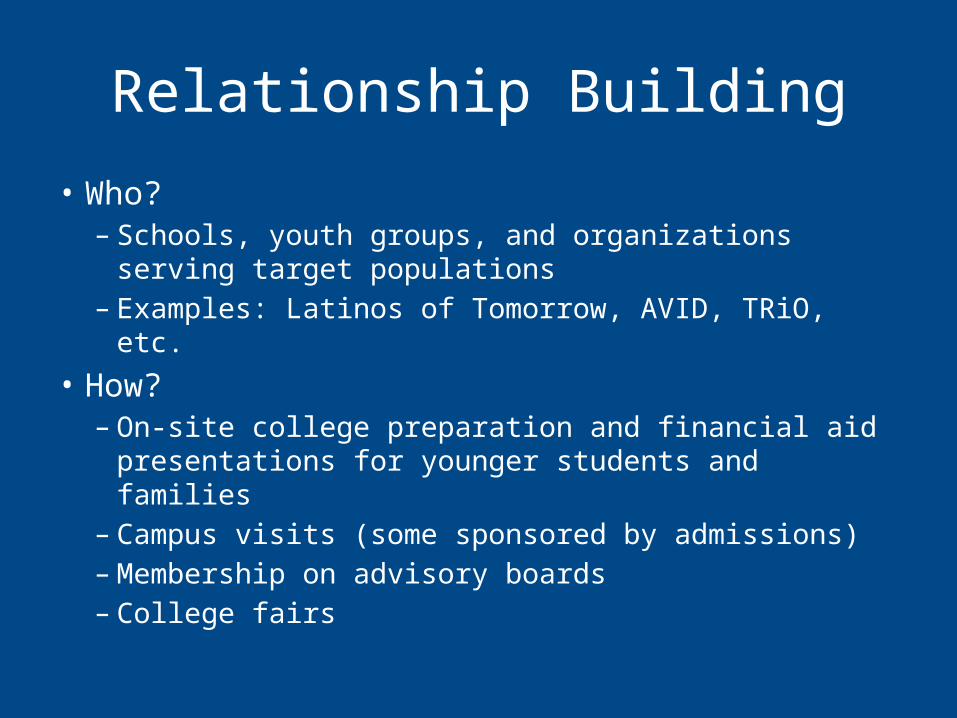
Relationship Building
• Who?– Schools, youth groups, and organizations serving
target populations– Examples: Latinos of Tomorrow, AVID, TRiO, etc.
• How?– On-site college preparation and financial aid
presentations for younger students and families– Campus visits (some sponsored by admissions)– Membership on advisory boards– College fairs
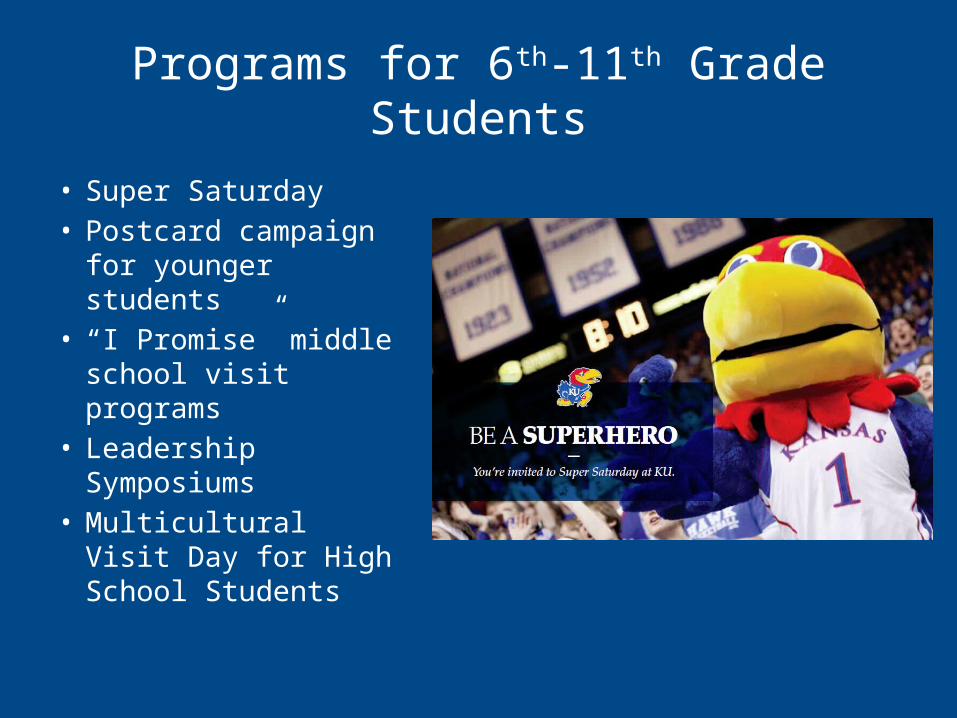
Programs for 6th-11th Grade Students
• Super Saturday• Postcard campaign
for younger students• “I Promise” middle
school visit programs• Leadership
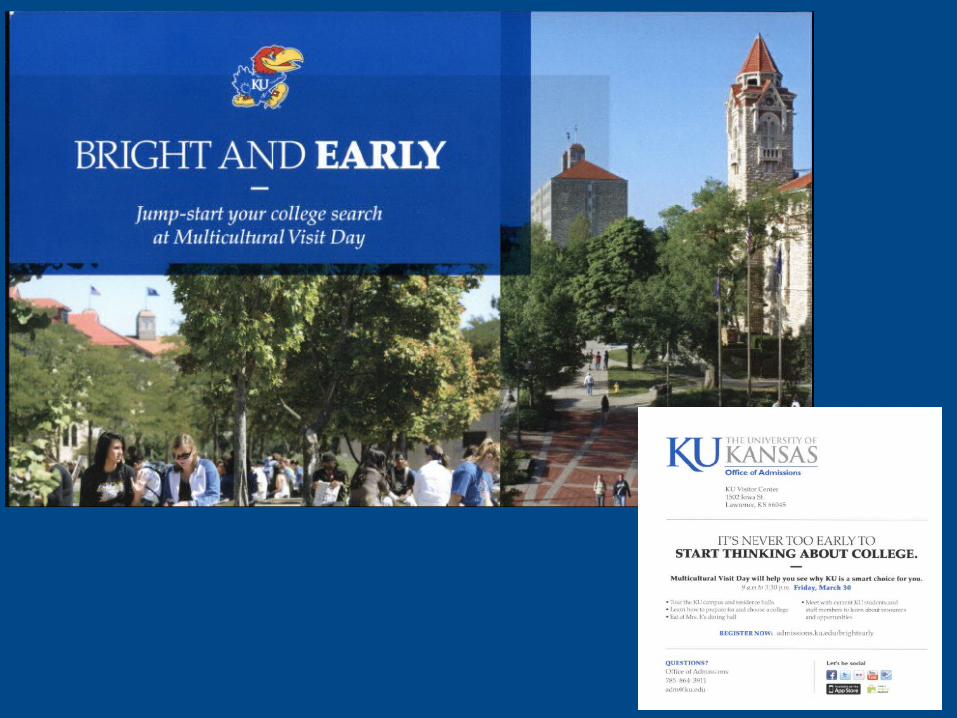
Symposiums• Multicultural Visit
Day for High School Students
RECRUITMENT STRATEGIES
Prospect Level
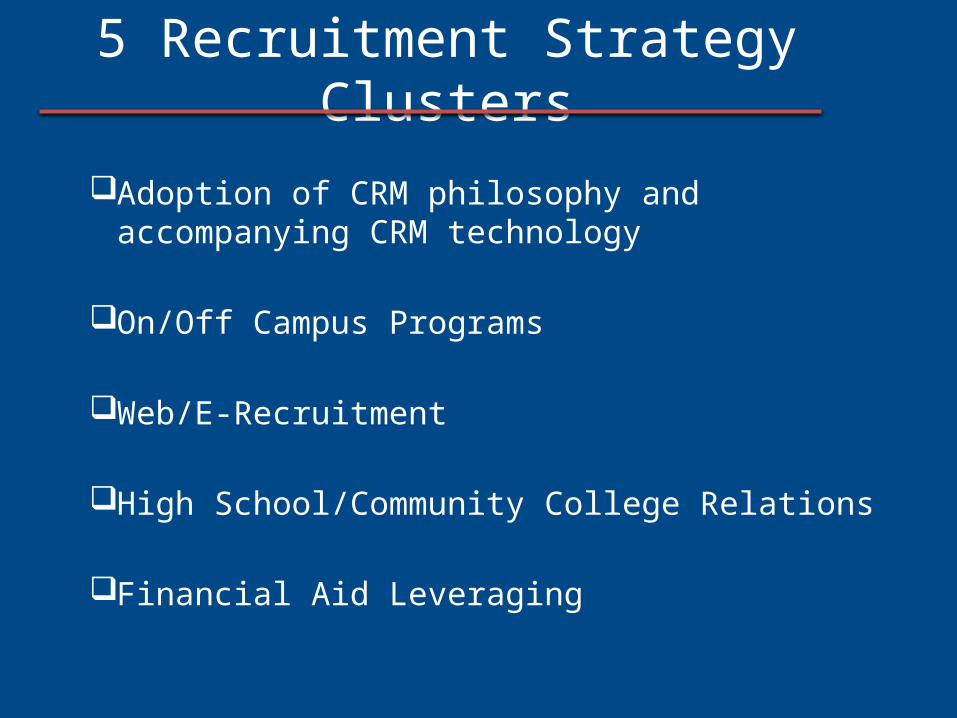
5 Recruitment Strategy Clusters
Adoption of CRM philosophy and accompanying CRM technology
On/Off Campus Programs
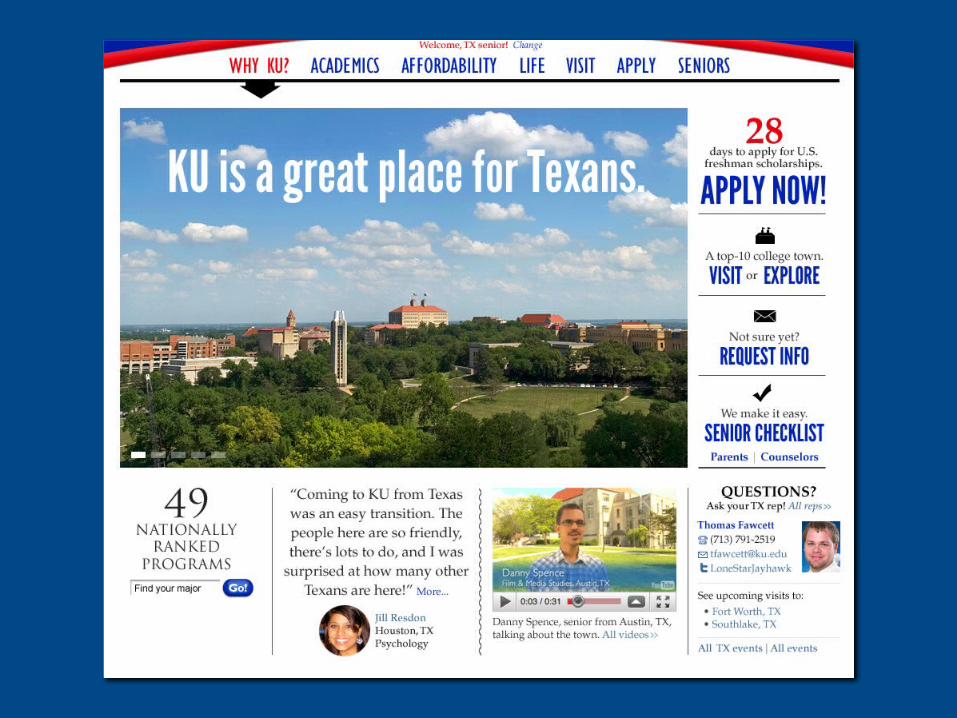
Web/E-Recruitment
High School/Community College Relations
Financial Aid Leveraging
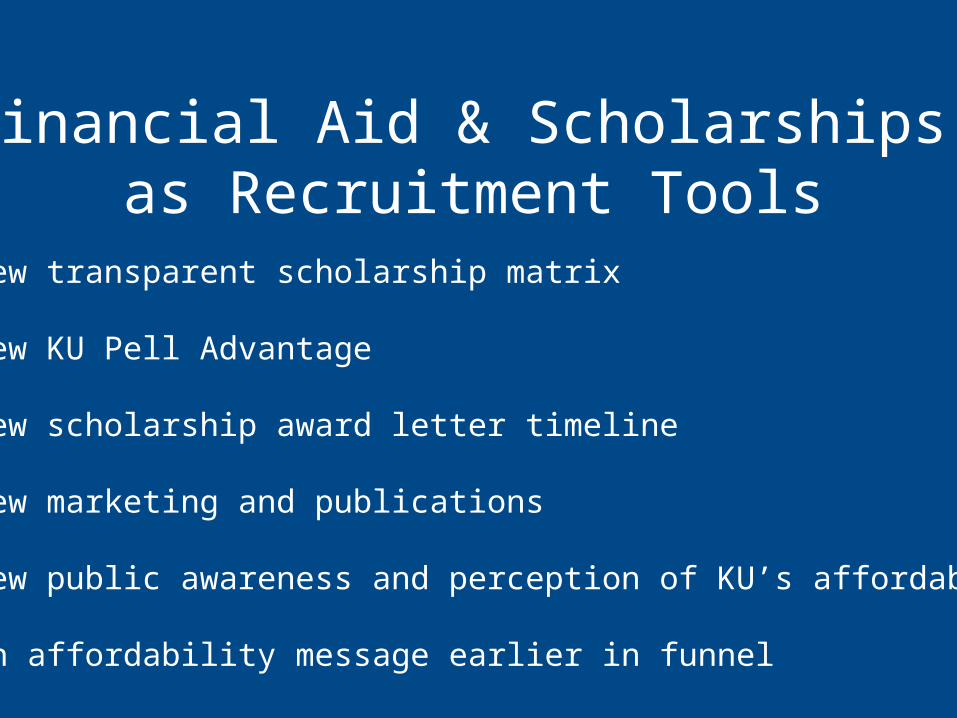
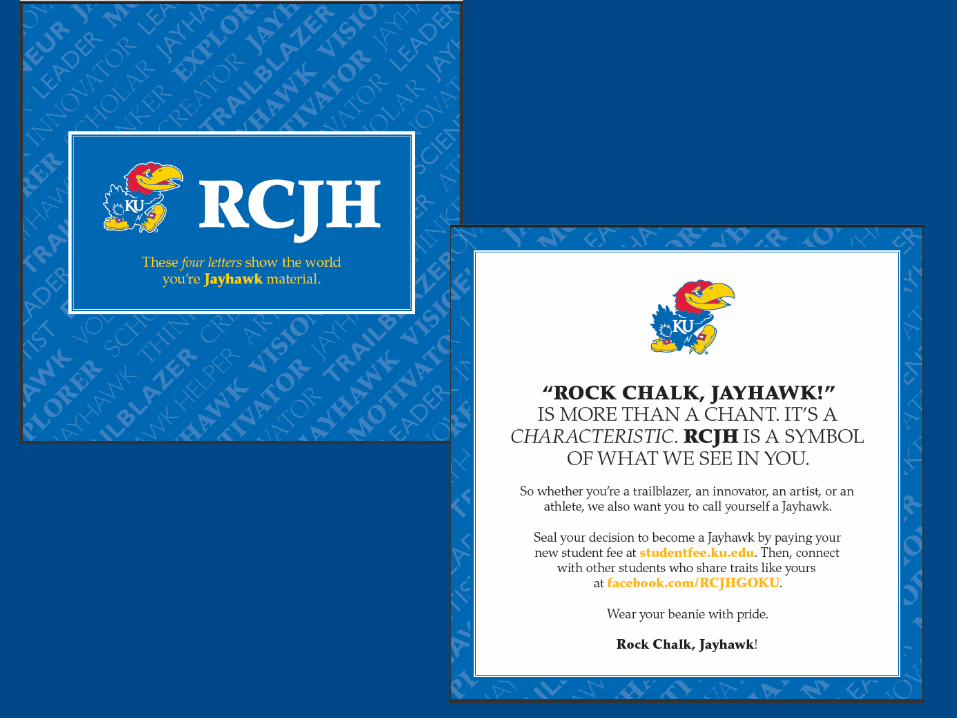
Financial Aid & Scholarships as Recruitment Tools
• New transparent scholarship matrix • New KU Pell Advantage
• New scholarship award letter timeline
• New marketing and publications • New public awareness and perception of KU’s affordability
•Push affordability message earlier in funnel
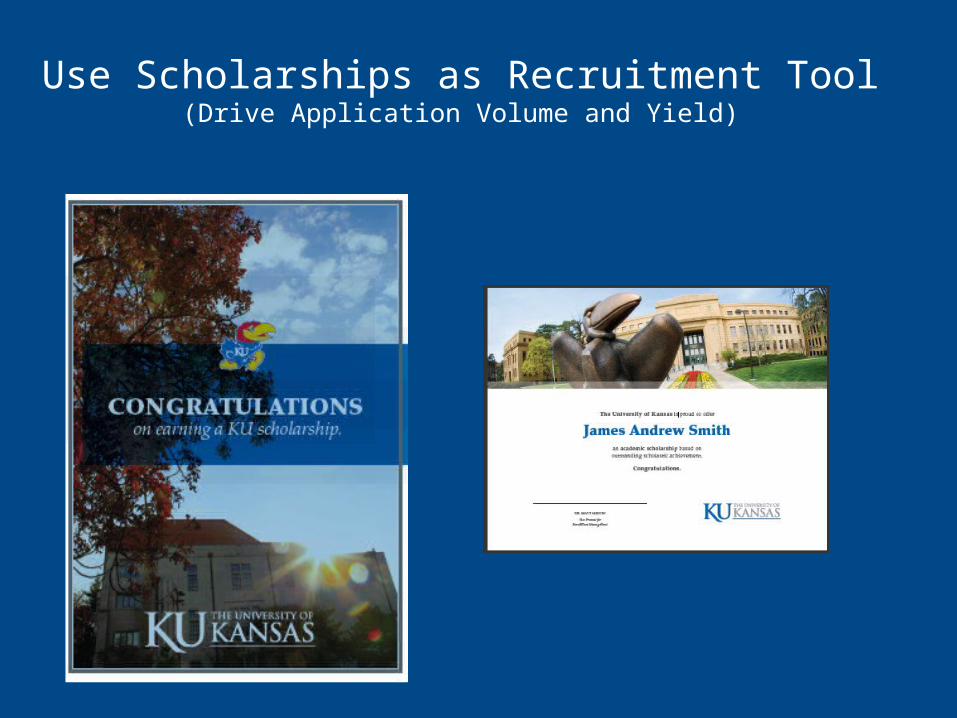
Use Scholarships as Recruitment Tool(Drive Application Volume and Yield)

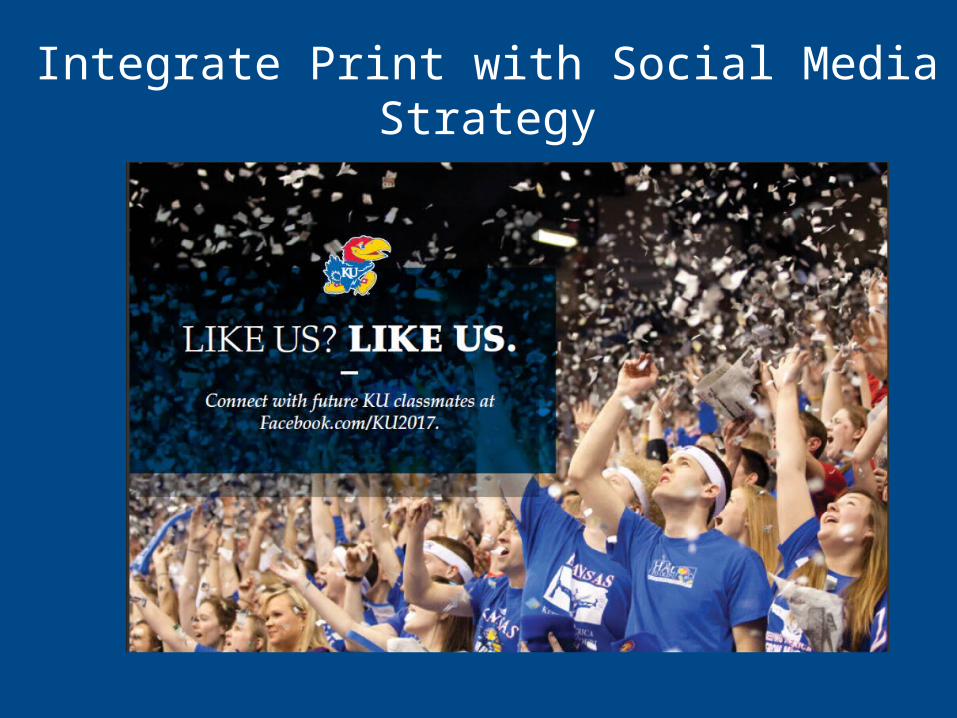
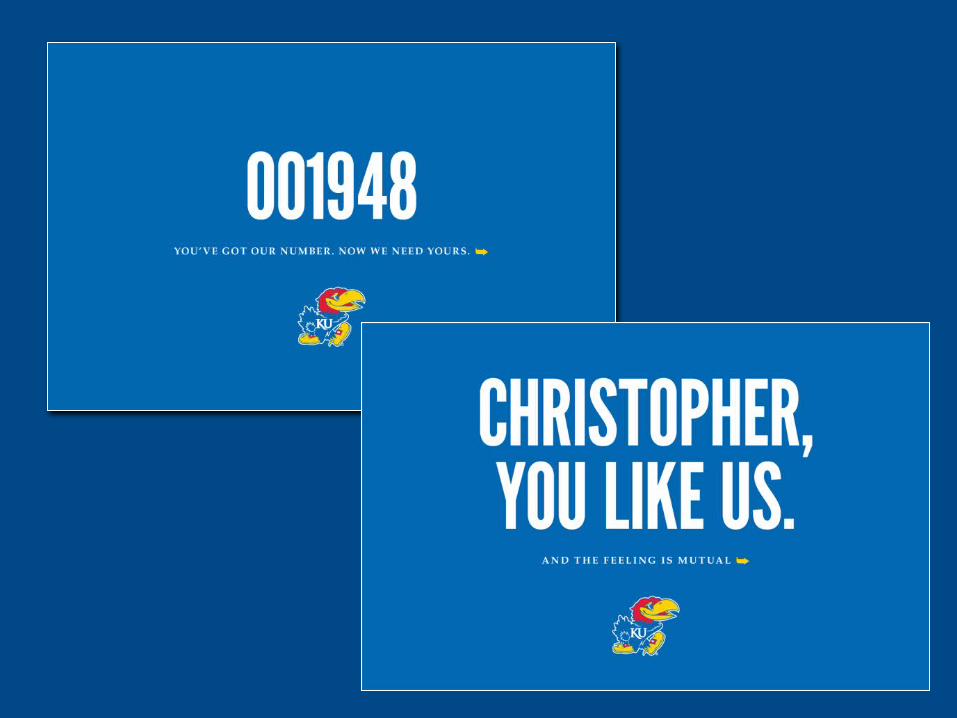
Integrate Print with Social Media Strategy
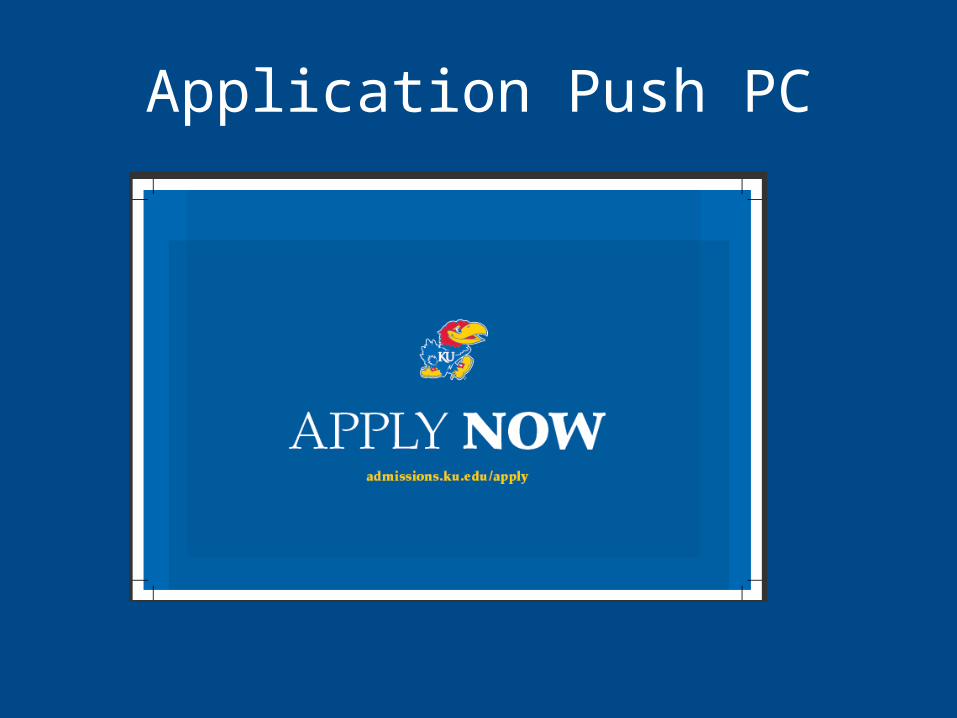
Application Push PC
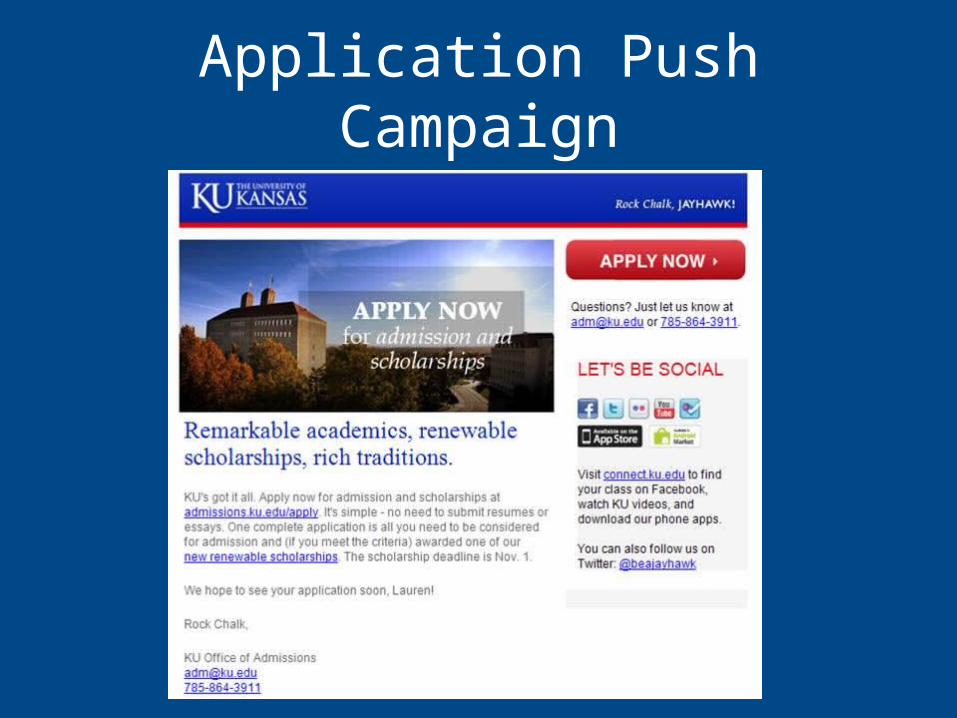
Application Push Campaign
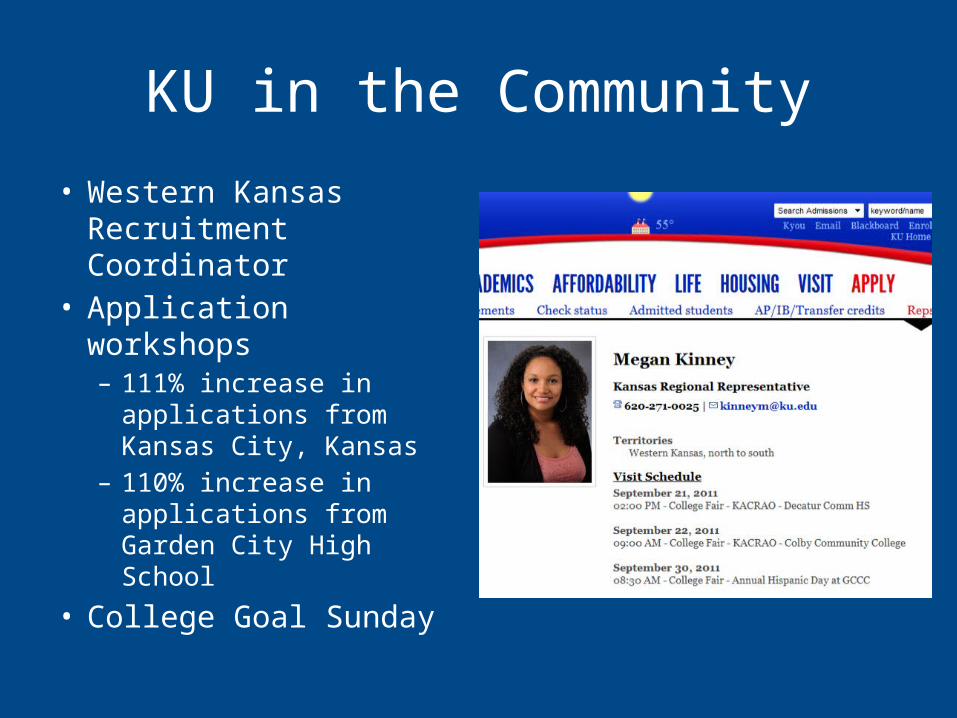
KU in the Community
• Western Kansas Recruitment Coordinator
• Application workshops– 111% increase in
applications from Kansas City, Kansas
– 110% increase in applications from Garden City High School
• College Goal Sunday

YIELD STRATEGIESADMIT LEVEL
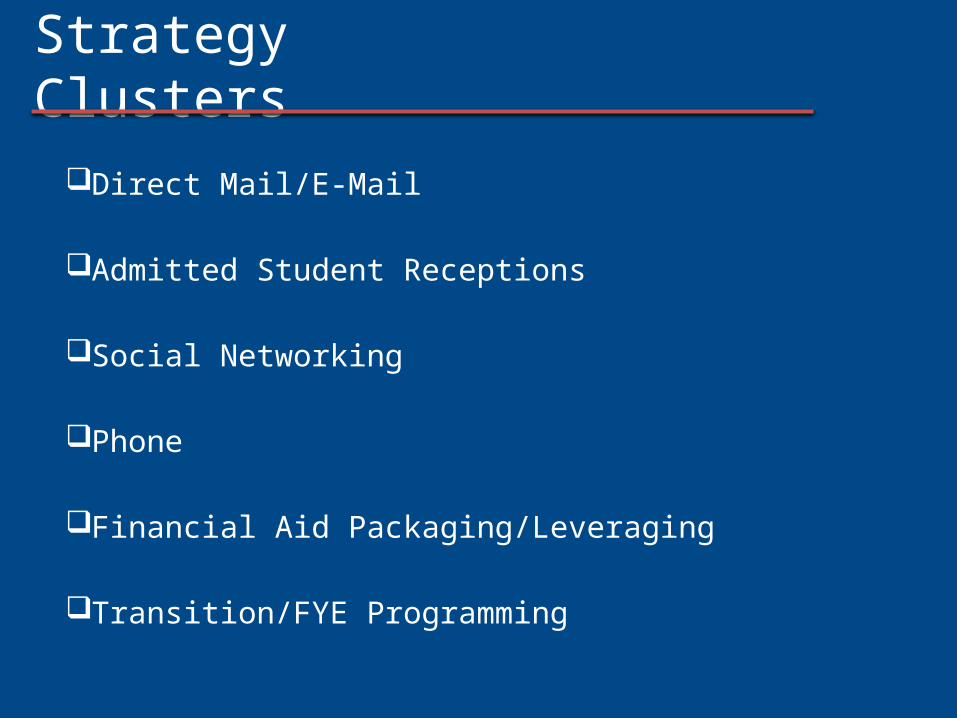
Strategy Clusters
Direct Mail/E-Mail
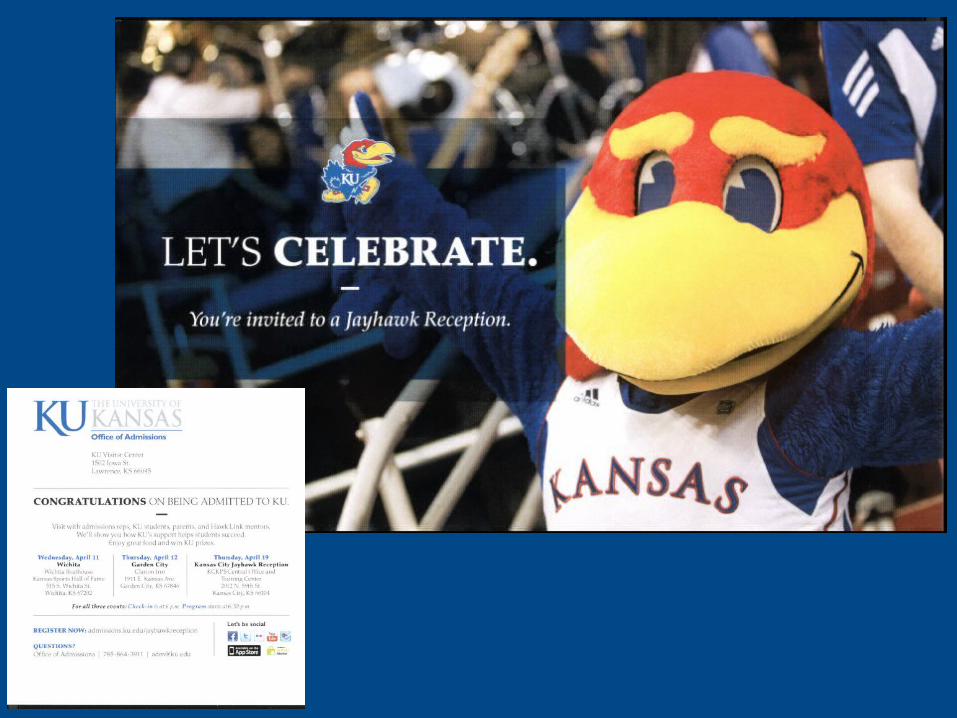
Admitted Student Receptions
Social Networking
Phone
Financial Aid Packaging/Leveraging
Transition/FYE Programming
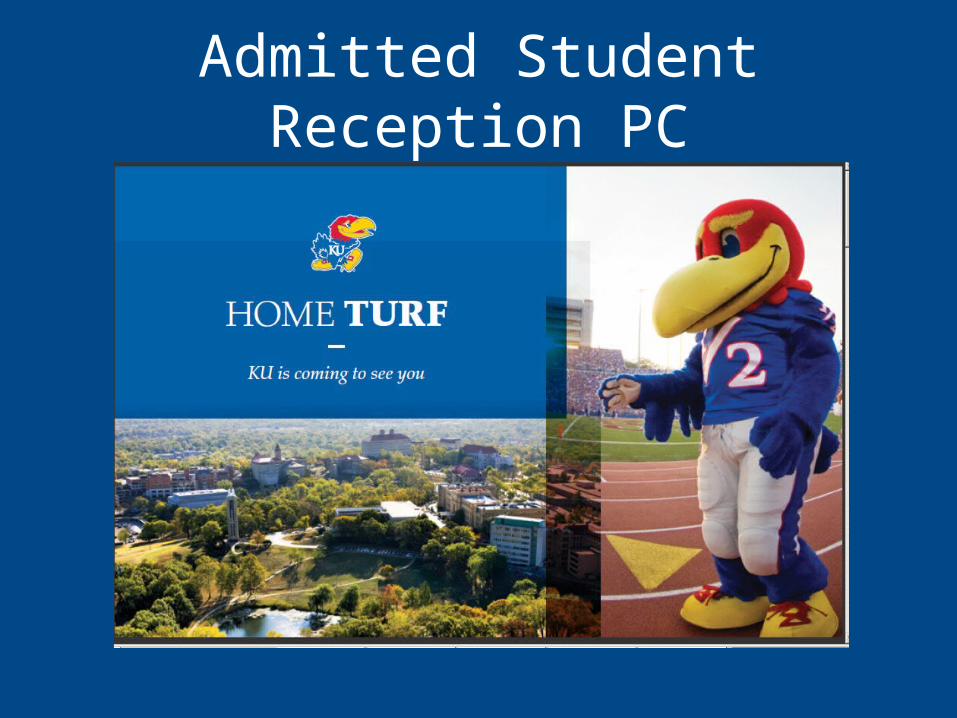
Admitted Student Reception PC

Destination KU
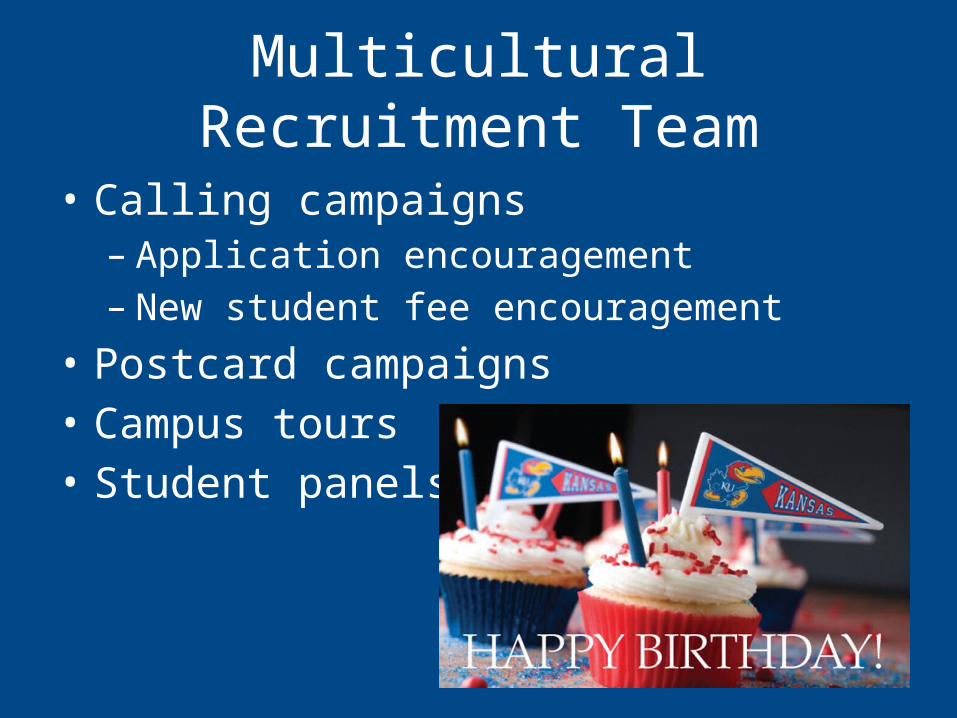
Multicultural Recruitment Team
• Calling campaigns– Application encouragement– New student fee encouragement
• Postcard campaigns• Campus tours• Student panels
RETENTION STRATEGIES
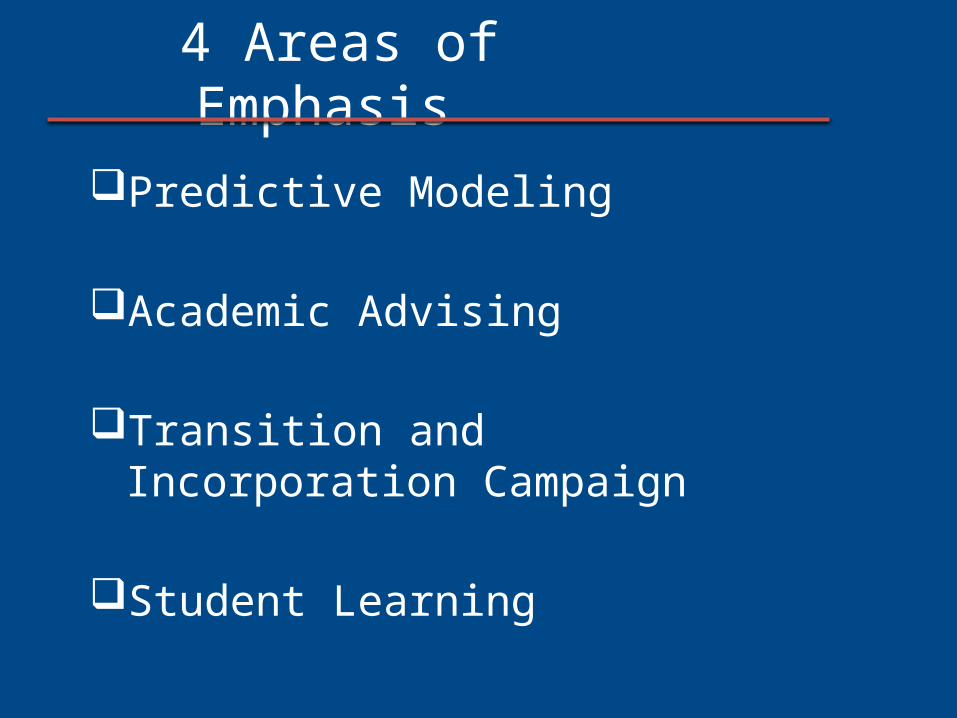
4 Areas of Emphasis
Predictive Modeling
Academic Advising
Transition and Incorporation Campaign
Student Learning
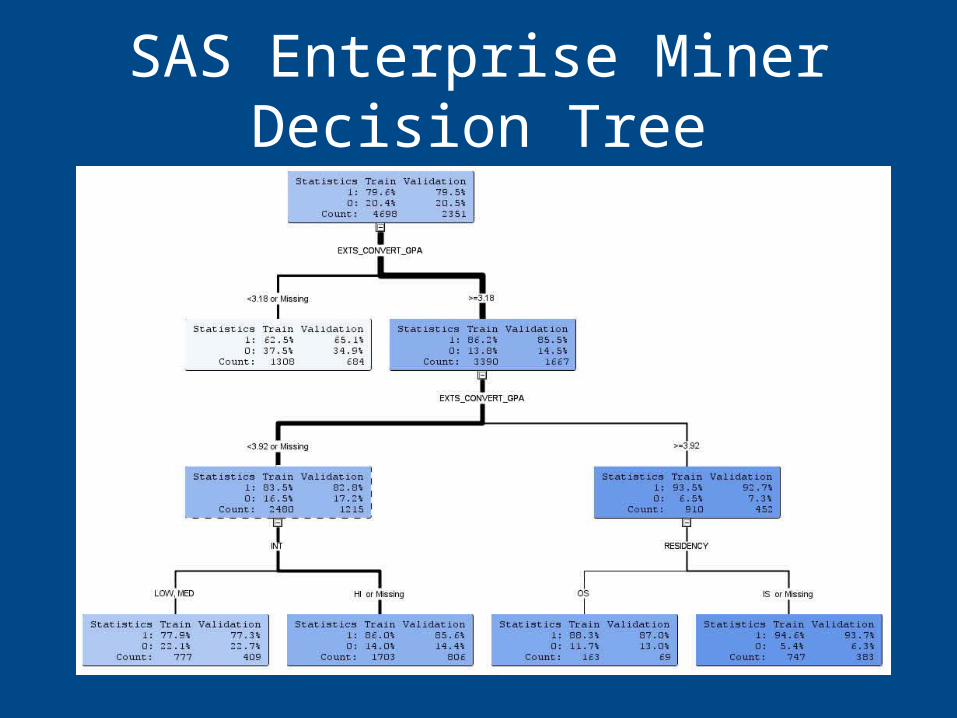
SAS Enterprise Miner Decision Tree
THE EARLY RESULTS
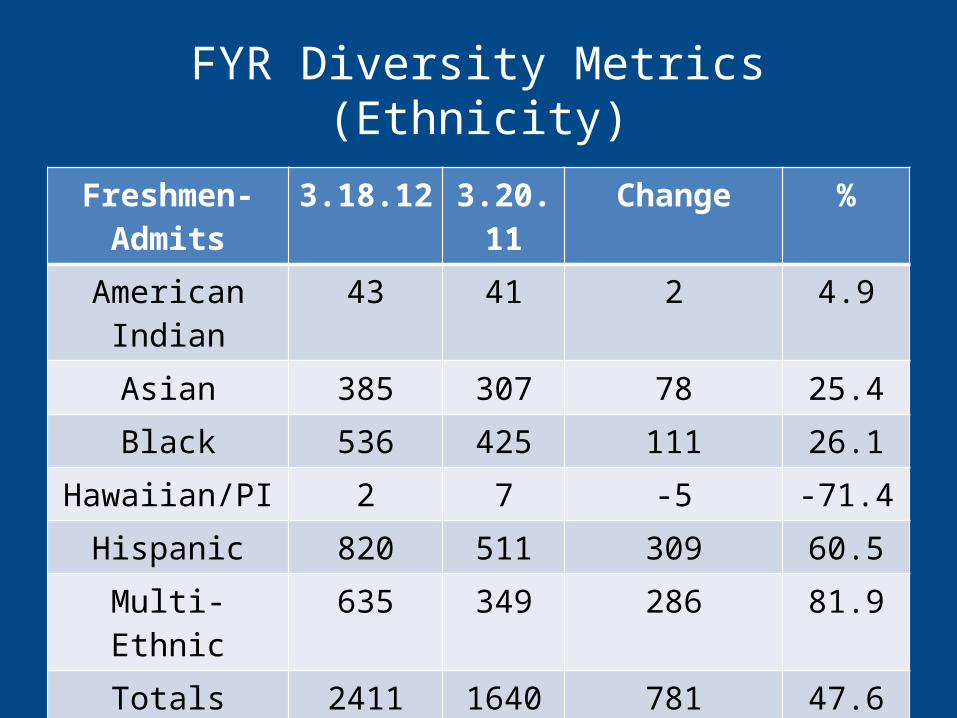
FYR Diversity Metrics (Ethnicity)Freshmen-
Admits3.18.12 3.20.11 Change %
American Indian 43 41 2 4.9Asian 385 307 78 25.4Black 536 425 111 26.1
Hawaiian/PI 2 7 -5 -71.4Hispanic 820 511 309 60.5
Multi-Ethnic 635 349 286 81.9Totals 2411 1640 781 47.6
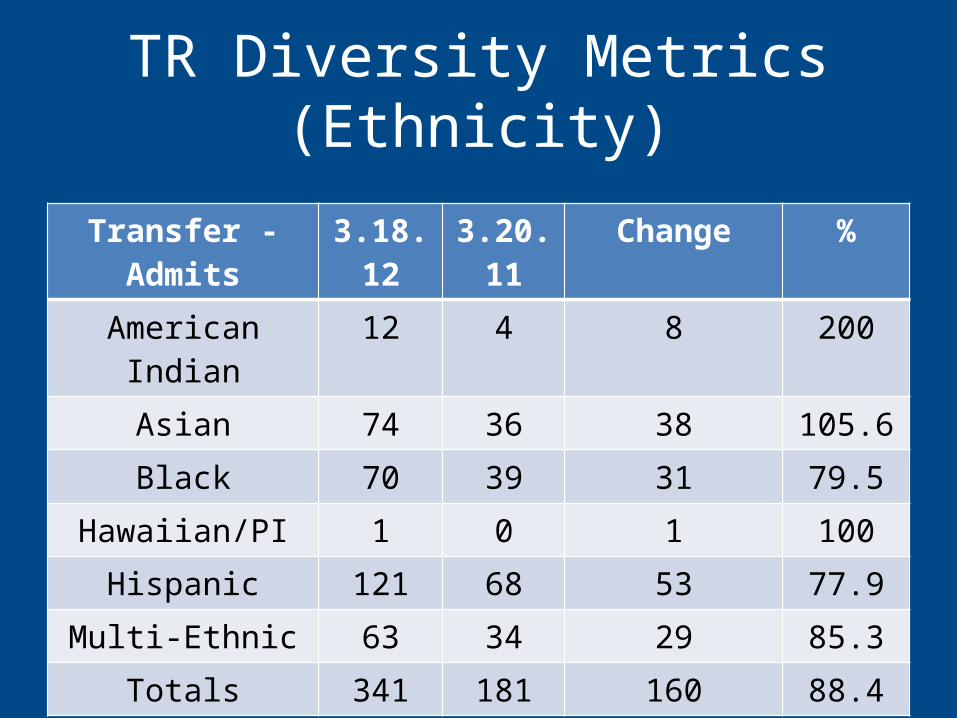
TR Diversity Metrics (Ethnicity)
Transfer -Admits 3.18.12 3.20.11 Change %American Indian 12 4 8 200
Asian 74 36 38 105.6Black 70 39 31 79.5
Hawaiian/PI 1 0 1 100Hispanic 121 68 53 77.9
Multi-Ethnic 63 34 29 85.3Totals 341 181 160 88.4
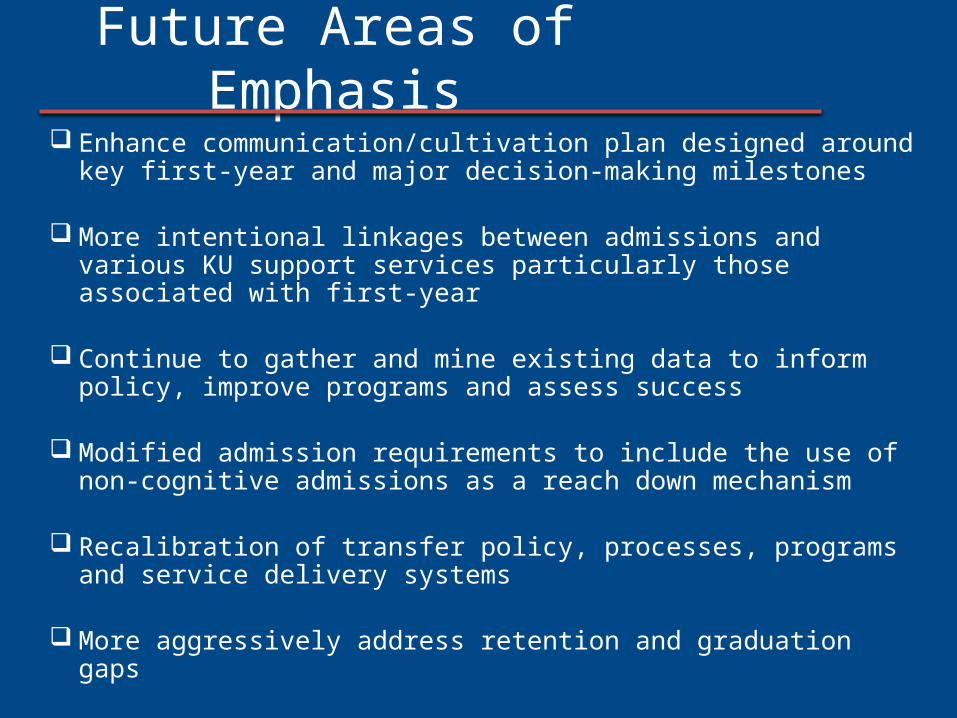
Future Areas of Emphasis Enhance communication/cultivation plan designed around key
first-year and major decision-making milestones
More intentional linkages between admissions and various KU support services particularly those associated with first-year
Continue to gather and mine existing data to inform policy, improve programs and assess success
Modified admission requirements to include the use of non-cognitive admissions as a reach down mechanism
Recalibration of transfer policy, processes, programs and service delivery systems
More aggressively address retention and graduation gaps
CONTACT
Matt Melvin
VP for Enrollment Management
785.864.4866
Lee Furbeck
Sr. Associate Director, Admissions
785.864.5214
Greg Valdovino
Assistant Director for Diversity and Outreach, Admissions
785.864.5160