Embed Size (px)
DESCRIPTION
Collateral Damage: Exchange Restrictions and Trade Flows. Shang-Jin Wei Zhiwei Zhang. Introduction. Are exchange restrictions (capital controls) good for developing countries? Adverse effects of liberalization – Rodrik, Stiglitz, survey by Kose, Prasad, Rogoff, and Wei - PowerPoint PPT Presentation
Citation preview
Collateral Damage: Exchange Restrictions and Trade Flows
Shang-Jin Wei
Zhiwei Zhang

Introduction
• Are exchange restrictions (capital controls) good for developing countries?
• Adverse effects of liberalization – Rodrik, Stiglitz, survey by Kose, Prasad, Rogoff, and Wei
• Costs of not liberalizing – Forbes’ study on cost of borrowing in Chile– This paper: Effects on international trade

Can exchange restrictions damage trade?
• Examples– Repatriation requirements for exporters.– Anecdote with the chief of a foreign exchange
control administration
• Empirical research is scarce– Tamirisa (1999)
• Data limitation• Specification issue

Notable features of this paper:
– Three unique databases• AREAER database for exchange controls.• Country-pair specific tariff data from WITS –
allowing for calculation of tariff equivalent.• Non-tariff barriers index from IMF/PDR/TRI.
– Theory-consistent gravity model that incorporates recent theoretical advances
• Anderson – Van Wincoop (2003)• Helpman – Melitz – Rubinstein (2006)

Exchange Restrictions
• 192 indicators in AREAER
• Three groups of restrictions on:– Trade payments.– Capital transactions.– FX transactions (exchange taxes and
subsidies …) and others.

Main findings:
Exchange restrictions have large negative effect on trade
• Increasing restrictions on trade payments by 1 S.D. is equivalent to increasing tariff rate by 9 to14 percentage points.
• Increasing restrictions on FX transactions and others by 1 S.D. is equivalent to raising tariff rate by 11 to 15 percentage points.

• Controls on Trade Payments or Proceeds
– Imports and Import Payments:• 1. Foreign exchange budget• 2. Financing requirements for imports• 3. Documentation requirements for release of foreign
exchange for imports
– Exports and export proceeds:• 1. Repatriation requirement• 2. Financing requirements• 3. Documentation requirements• 4. Export licenses• 5. Export taxes

• Restrictions on Following Capital Transactions:
– 1. Capital and money market instruments– 2. Derivatives and other instruments– 3. Credit operations– 4. Direct investment– 5. Liquidation of direct investment– 6. Real estate transactions– 7. Personal capital transactions– 8. Provisions specific to commercial banks and other credit
institutions– 9. Provisions specific to institutional investors– 10. Other controls imposed by securities laws

• Restrictions on FX Transactions and others
– 1. Exchange tax– 2. Exchange subsidy– 3. Absence of forward exchange market– 4. Currency requirements for pricing & settlement– 5. Payments arrears– 6. Controls on trade in gold (coins and/or bullions)– 7. Controls on exports and imports of banknotes– 8. Controls on transfers – 9. Proceeds from invisible transactions– 10. Resident Accounts– 11. Nonresident Accounts

Almost all exchange restrictions can be used as capital controls.
• Malaysia. (Johnson, Kochhar, Mitton & Tamirisa 2006)– Currency requirements for settlement.– Export proceeds.
• China– Residents holding FX bank accounts.

Restriction Indices
• For each group of the restrictions, an index is constructed as the weighted sum of all restrictions in place.
• Weights are chosen to ensure each category within the group receives equal weight.

Evolutions of Restriction Indices, 1996 - 2005
Capital Transactions
FX Transactions
Trade Payments
0.2
0.3
0.4
0.5
1996 1997 1998 1999 2000 2001 2002 2003 2004 2005

Figure 2. Control Indices in Selected Countries
Brazil
Trade Payments
0.20
0.30
0.40
0.50
0.60
0.70
0.80
1996 1997 1998 1999 2000 2001 2002 2003 2004 2005
CapitalTransactions
FXTransactions
Chile
Trade Payments
0.00
0.10
0.20
0.30
0.40
0.50
0.60
0.70
0.80
0.90
1.00
1996 1997 1998 1999 2000 2001 2002 2003 2004 2005
CapitalTransactions
FXTransactions
Greece
Trade Payments
0.00
0.05
0.10
0.15
0.20
0.25
0.30
0.35
0.40
0.45
1996 1997 1998 1999 2000 2001 2002 2003 2004 2005
FXTransactions
CapitalTransactions
Malaysia
Trade Payments
0.00
0.20
0.40
0.60
0.80
1.00
1.20
1996 1997 1998 1999 2000 2001 2002 2003 2004 2005
FXTransactions
CapitalTransactions

Augmented gravity model:
Y: Bilateral trade flows.X: Importer’s and exporter’s GDP, distance, Mills ratio and
predicted probability of trade (Helpman-Melitz-Rubinstein), colonial ties, common language…
RI: Vector of restriction indices.Tariff: Bilateral tariff rates.NTB: Non-trade barrier index from TRI.IMP, EXP, Year: fixed effects for importer, exporter, year.
, , , , , 1 , , 2 ,
1 2 3 , ,
i j t i j t i t i j t i t
i j t i j t
Y X RI Tariff NTB
IMP EXP Year

Restrictions on trade payments -0.567 -0.537
(0.153) (0.159)
Restrictions on capital -0.068 0.032
transactions (0.107) (0.110)
Restrictions on FX transactions -0.314 -0.152
and others (0.171) (0.180)
Tariff -0.713 -0.724 -0.725 -0.717
(0.182) (0.182) (0.182) (0.182)
Non-tariff barrier index -0.213 -0.226 -0.221 -0.212
(0.049) (0.048) (0.048) (0.048)

Tariff Equivalent Calculations
• A 10 percent increase in tariff rate is associated with a 7 percent reduction in trade volume
• Increasing restrictions on trade payments by 1 standard deviation (0.18) is associated with:0.18*(-0.537)/(-0.717)*100 = 13.9 percentage points increase in tariff.

Alternative Specifications
• Country pair fixed effects – to incorporate trade costs more generally.
• Separate import price indices for two trading partners – to proxy for time varying trade costs.

Restrictions on trade payments -0.434 -0.367
(0.103) (0.109)
Restrictions on capital -0.018 0.087
transactions (0.069) (0.072)
Restrictions on FX transactions -0.438 -0.353
and others (0.116) (0.124)
Tariff -0.774 -0.784 -0.801 -0.784
(0.107) (0.107) (0.107) (0.107)
Non-tariff barrier index -0.181 -0.189 -0.186 -0.178
(0.034) (0.034) (0.034) (0.034)
Model with country-pair fixed effects:

Model with time-varying import price indices
Restrictions on trade payments -0.633 -0.494
(0.154) (0.161)
Restrictions on capital -0.187 -0.033
transactions (0.102) (0.108)
Restrictions on FX transactions -0.608 -0.438
and others (0.162) (0.174)
Tariff -0.708 -0.726 -0.728 -0.721
(0.181) (0.182) (0.182) (0.182)
Non-tariff barrier index -0.177 -0.197 -0.178 -0.17
(0.047) (0.047) (0.047) (0.047)
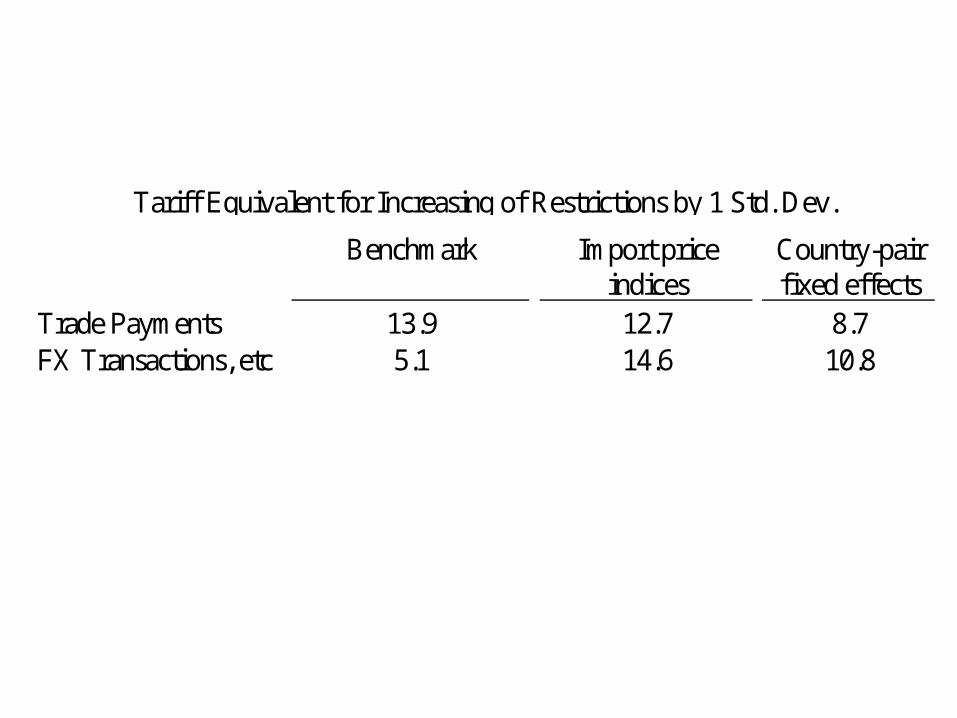
Benchmark Import price indices
Country-pair fixed effects
Trade Payments 13.9 12.7 8.7FX Transactions, etc 5.1 14.6 10.8
Tariff Equivalent for Increasing of Restrictions by 1 Std. Dev.
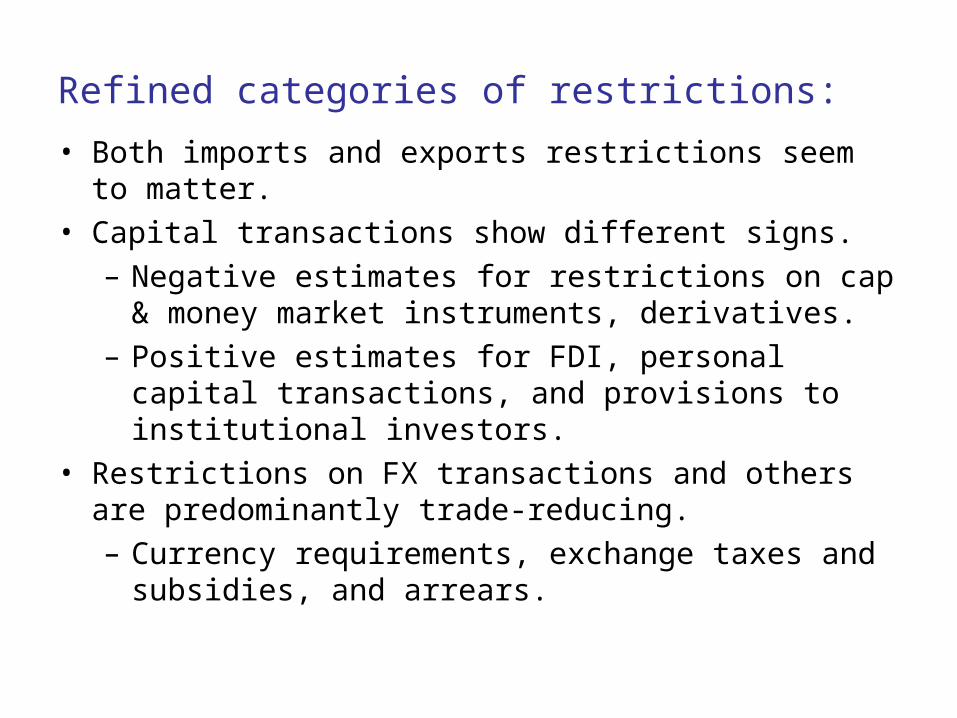
Refined categories of restrictions:
• Both imports and exports restrictions seem to matter.• Capital transactions show different signs.
– Negative estimates for restrictions on cap & money market instruments, derivatives.
– Positive estimates for FDI, personal capital transactions, and provisions to institutional investors.
• Restrictions on FX transactions and others are predominantly trade-reducing.– Currency requirements, exchange taxes and
subsidies, and arrears.

Case Study:
• The financial crises in emerging markets during 1996 – 1999 period led governments to set more controls.
• Sample includes11 emerging markets in the MSCI index that strengthened their controls on either FX transactions or capital transactions during 1996 – 1999 period.
• Did increase in exchange controls led to less trade, after controlling for changes in tariff, NTB index, GDP, and exchange rates?

Change in controls on trade 0.396 0.24 payments (0.346) (0.380) Change in controls on capital -1.578 -1.364 transactions (0.529) (0.351) Change in controls on FX -1.194 -1.394 transactions (0.396) (0.453) Multilateral real exchange rate 0.25 (0.479) Bilateral real exchange rate 0.451 (0.242)
Dependent variable: change in bilateral trade, 1996 to 1999

Tentative Conclusion:
• Some exchange restrictions have large adverse effects on trade
– Increasing restrictions on trade payments by 1 S.D. is equivalent to raising tariff by 9 to 14 percentage points.
– Increasing restrictions on FX transactions and others by 1 S.D. is equivalent to raising tariff by 11 to 15 percentage points.

Further Research Needed:
• Non-linear effects.
• Interactive effects (e.g. with governance)
• Suggestions?