Embed Size (px)
Citation preview

F

Collaboration between sales and marketing
divisions
Linda Veale
A field study submitted to the UFS Business School in the Faculty of Economic and
Management Sciences in partial fulfilment of the requirements for the degree of
Magister in Business Administration
at the
UFS Business School
University of the Free State
Bloemfontein
Supervisor: Dr J van Zyl
November 2014

i
DECLARATION
“I declare that the field study hereby handed in for the qualification of Master‟s
degree in Business Administration at the UFS Business School of the University of
the Free State is my own, independent work and that I have not previously submitted
the same work, either as a whole or in part, for a qualification at/in another university
faculty.
I also hereby cede copyright of this work to the University of the Free State”
Name: Linda Veale
Date: 20 November 2014

ii
ACKNOWLEDGEMENTS
To my family and friends who walked, and sometimes carried me, on this journey
towards my MBA, thank you from the bottom of my heart. I could not have done this
without you.
A special thanks goes out to my study leader, Dr Johan van Zyl, who provided soft
spoken words of encouragement and gentle yet firm nudges in the right direction. I
wish that other students will also continue to benefit from your guidance.

iii
ABSTRACT
The issue addressed in this study is the insufficient collaboration between the sales
and marketing divisions within a sales organisation. To address this problem, the
purpose of this study was to investigate and research the antecedents of
collaboration between the sales and marketing divisions and to identify possible
recommendations for improving the collaboration.
The study was conducted in a subsidiary of an international organisation in South
Africa. This sales company had a dedicated sales and marketing division from which
a purposive convenience sample was selected. Participants came from the same
population, and sample groups were of equal size for the quantitative and qualitative
data analysis. The data was analysed on the basis of being employed in a sales or
marketing position.
A mixed methods convergent design was chosen with the intent to merge the results
of the quantitative and qualitative data analysis. The researcher believed that
quantitative or qualitative research alone would be insufficient to gain an adequate
understanding of the research problem in such a small sample size.
A questionnaire consisting of open- and closed-ended questions was developed and
structured around the identified antecedents of collaboration gathered from the
literature review. The antecedents were cultural and economic in nature with aspects
related to information and the sales division‟s involvement in the marketing strategy
process. The qualitative data was integrated with the quantitative data around the
existing antecedents of collaboration.
The integrated results showed that, overall, the respondents agreed that
collaboration and coordination with regard to their activities are to the sales
organisation‟s advantage. The majority strongly felt that the current collaboration
could and should be improved. What appeared to be lacking was a shared frame of
reference and the ability to create and maintain a personal rapport with one another
based on appreciation of one another‟s work. Each division expected the other to
help it achieve its divisional objective but not one another‟s objectives.

iv
Despite the apparent conflict and insufficient collaboration, there was an underlying
wish by both sales and marketing respondents to collaborate on shared goals.
The change should be driven by senior management since a positive senior
management attitude towards collaboration leads to reduced inter-functional conflict.
In addition, a culture of organisational learning and transparent information sharing
should be encouraged. The development of intra-organisational guidelines on the
role allocation of activities during the buying cycle will reduce uncertainty. Open and
respectful communication between the sales and marketing divisions can provide a
basis for the clarification of misunderstandings and keep the other division up to date
in terms of marketing initiatives. Increasing the frequency of co-travelling of the
members of the marketing and sales divisions will assist in fostering relationships
and increase credibility along with opportunities for further study.
The current market intelligence system needs improvement. Alternative market
intelligence systems should be investigated by sales and marketing individuals. The
system should promote easy access to all within the sales organisation.
The sales divisions should be more involved throughout the marketing strategy.
There was no consensus on when, how or how often and to what degree they should
be involved. It is recommended that an intra-organisational survey should be
conducted together with the consultation of senior sales and marketing individuals.
Other factors that are important for collaboration were identified. There is a definite
need for clear and transparent two-way communication between sales and
marketing divisions. Regular, scheduled meetings between sales and marketing
divisions are needed where the quality of the exchange is more important than the
quantity or duration of meetings. These will help foster a sense of collaboration
within the organisation.

v
TABLE OF CONTENTS
Declaration……………………………………………………………………………………….... i
Acknowledgements……………………………………………………………………….……… ii
Abstract……………………………………………………………………………………………. iii
CHAPTER1: INTRODUCTION………………………………….……………………………. 1
1.1 INTRODUCTION…………………………..……………………………………….…... 1
1.2 PROBLEM STATEMENT……………………………………..………………..……… 4
1.3 AIM AND OBJECTIVES……………………………………..……..…………….…….. 5
1.3.1 Aim…………………………………………………………..………...……..… 5
1.3.2 Objectives……………………………………………………...………...……. 5
1.4 THEORETICAL FRAMEWORK………………………………………............…..…. 6
1.5 RESEARCH DESIGN……………………………………………………………..…… 8
1.6 ETHICAL CONSIDERATIONS…………………………………………………..……. 9
1.7 DEMARCATION OF THE FIELD STUDY……………………………………..…….. 9
1.8 DEFINING TERMINOLOGY……………………………………………………...……. 10
1.9 CHAPTER LAYOUT OF THE STUDY…………………………………………..…… 10
CHAPTER 2: COLLABORATION BETWEEN SALES AND MARKETING…………….. 12
2.1 INTRODUCTION………………………………………………………………………... 12
2.2 THE IMPORTANCE OF COLLABORATION……………………………………….... 12
2.3 THE MARKETING-SALES INTERFACE…………………………………….……….. 14
2.4 CULTURAL SOURCES OF CONFLICT…………………………………..…………... 16
2.5 MARKETERS‟ CREDIBILITY WITHIN THE SALES-MARKETING INTERFACE... 20
2.6 MARKETING-SALES COLLABORATION……………………………………………. 22
2.7 KEY ANTECEDANTS INFLUENCING COLLABORATION………………………… 24
2.8 MANAGERIAL IMPLICATIONS………………………………………………………... 25
CHAPTER 3: METHODOLOGY………………………………………………………………... 27
3.1 INTRODUCTION………………………………………………………………………… 27
3.2 DEFINITION OF MIXED METHODS………………………………………………….. 27
3.3 VALUE OF, AND RATIONALE BEHIND, THE USE OF THE MIXED
METHOD APPROACH…………………………………………………………………..
27

vi
3.4 CONVERGENT MIXED METHOD DESIGN………………………………………….. 29
3.4.1 Sampling………………………………………………………………………... 29
3.4.2 Data collection………………………………………………………………….. 30
3.4.3 Data analysis…………………………………………………………………… 30
3.4.4 The merging of databases……………………………………………………. 31
CHAPTER 4: RESULTS………………………………………………………………………… 33
4.1 INTRODUCTION………………………………………………………………………… 33
4.2 PROFILE OF RESPONDENTS………………………………………………………… 34
4.2.1 Gender………………………………………………………………………….. 34
4.2.2 Age………………………………………………………………………………. 35
4.2.3 Position………………………………………………………………………….. 36
4.2.4 Years in current position………………………………………………………. 36
4.2.5 Highest educational level……………………………………………………… 37
4.3 EXISTING COLLABORATIVE PRACTICES BETWEEN SALES AND
MARKETING DIVISIONS………………………………………………………………..
38
4.3.1 The perceived importance of collaboration…………………………………. 38
4.3.2 Assessment of the need for improving collaboration………………………. 38
4.4 ANTECEDANTS OF COLLABORATION BETWEEN SALES AND
MARKETING DIVISIONS………………………………………………………………..
39
4.4.1 Cultural factors…………………………………………………………………. 39
4.4.2 Credibility of the sales and marketing divisions…………………………….. 46
4.4.3 Economic factors………………………………………………………………. 52
4.4.4 Aspects related to information……………………………………………...... 55
4.4.5 The involvement of the sales division in the marketing strategy
process…………………………………………………………………………..
60
4.5 STEPS TOWARD INCREASING COLLABORATION BETWEEN THE SALES
AND MARKETING DIVISIONS…………………………………………………………
65
4.5.1 Management attitudes towards coordination and collaboration…………... 65
4.5.2 Shared frame of reference……………………………………………………. 65
4.5.3 Communication………………………………………………………………… 66
4.5.4 Transparent flow of information………………………………………………. 67
4.5.5 Interdepartmental consultation……………………………………………….. 68
4.5.6 Sources of interdepartmental conflict………………………………………... 68
4.6 SUMMARY……………………………………………………………………………….. 71

vii
CHAPTER 5: CONCLUSIONS AND RECOMMENDATIONS………………………………. 73
5.1 THEORETICAL BACKGROUND………………………………………………………. 73
5.2 RECOMMENDATIONS FROM LITERATURE……………………………………….. 73
5.3 SUMMARY OF EMPIRICAL FINDINGS………………………………………………. 74
5.3.1 Cultural aspects………………………………………………………………... 74
5.4 RECOMMENDATIONS FOR ACHIEVING GREATER COLLABORATION
BETWEEN THE SALES AND MARKETING DIVISIONS……………………………
77
5.5 LIMITATIONS OF THE STUDY………………………………………………………... 77
REFERENCES………………..…………………………………………………………………. 78
LIST OF FIGURES
Figure 1: Forces driving the sales organisation……………………………………………..
Figure 2: Zoltners (2004) quoted in Rouzies et al…………………………………………..
Figure 3: Depiction of emergent themes………………………………………………….….
Figure 4: Antecedents and consequences of collaboration between sales and
marketing…………………………………………………………………………………………..
2
14
21
22
Figure 5: The sales-marketing interface integrative framework……………………...…… 23
Figure 6: Convergent design…………………………………………………………………. 29
Figure 7: Respondents gender…………………………………………………………..…… 35
Figure 8: Age of respondents…………………………………………………………………. 35
Figure 9: Position of employment…………………………………………………………….. 36
Figure 10: Years in current position…………………………………………………………….. 37
Figure 11: Highest educational level……………………………………………………………. 37
LIST OF TABLES
Table 1: Perception of importance of coordinating and collaborating with regard to
activities……………………………………………………………………………………………
38
Table 2: Marketing division plays a more significant role in increasing market share and
sales turnover………………………………………………………………….………………….
40
Table 3: Sales division plays a more important role in increasing market share and
sales turnover……………………………………………………………………….…………….
40
Table 4: Allocation of activities during the buying cycle…………..……………….………… 42
Table 5: The importance of sales and marketing activities during the buying cycle……… 44

viii
Table 6: Results of Chi-square tests to determine whether a relationship exists between
the variable……………………………………………………………………………..………….
Table 7: Questions used to construct variables……………………………………………….
Table 8: Cronbach alpha values of variable constructed to assess credibility……….……
Table 9: Perception of the marketing divisions‟ expertise…………………………..……….
46
47
48
49
Table 10: Marketing understanding of South African market……………………………….. 49
Table 11: Trustworthiness of marketing division to generate valid sales leads…………… 50
Table 12: Expertise of the sales division………………………………………………………. 51
Table 13: Sales division can be trusted to follow up marketing leads……………………… 52
Table 14: Training provided by marketing enhances collaboration…………………….…… 52
Table 15: Is the current commission structure motivational? ............................................. 53
Table 16: The marketing division‟s performance bonus should be linked to portfolio
performance……………………………………………………………………………….….……
53
Table 17: Should marketing and sales share a budget? ……………………….……….…… 54
Table 18: Percentage of shared budget allocated to the sales division……………….……. 54
Table 19: Percentage of shared budget allocated to marketing…………………………….. 54
Table 20: The need for an effective market intelligence system……………………….……. 55
Table 21: Effectiveness of current market intelligence system……………………………… 55
Table 22: The importance of purchasing database information……………………….…….. 56
Table 23: The importance of presence at national tradeshows…………………….……….. 57
Table 24: The importance of organising product workshops………………………………… 57
Table 25: The importance of holding seminars for specialists………………………………. 57
Table 26: The importance of talking to end users…………………………………………….. 58
Table 27: Available recent market information by the marketing division to the sales
division……………………………………………………………………………………………..
59
Table 28: Available recent market information by the sales division to the marketing
division……………………………………………………………………………………………..
60
Table 29: Updated market information available to all members of the sales and
marketing divisions……………………….……………………………………………………….
Table 30: The involvement of the sales division in marketing strategy will increase
success…………………………………………………………………………………………….
60
61
Table 31: Sales only involved once marketing strategy is ready for implementation and
execution……………………………………………………………………………………..……
Table 32: Sales division input needed during the development phase of the marketing
strategy……………………………………………………………………………..………………
61
62

ix
Table 33: Sales division input needed during the implementation phase of marketing
strategy…………………………………………………………………………………..…………
62
Table 34: Sales division‟s input needed during execution phase of marketing strategy….. 63
Table 35: The timing of marketing and sales activities is important for a successful
marketing strategy………………………………………………………………………..……….
63
ADDENDA…………………………………………………………………………………………. 85
QUESTIONNAIRE COVER LETTER………………………………………………….. 85
QUESTIONNAIRE……………………………………………………………………….. 86

1
CHAPTER 1
INTRODUCTION
1.1 INTRODUCTION
The aim of an organisation is to increase shareholder value. A profit can be
generated by creating a competitive advantage over its competitors. The Value
Chain Analysis by Michael Porter lists the following primary activities leading to a
competitive advantage: inbound logistics, operations, outbound logistics, and
marketing and sales, followed by service delivery. According to Porter, the goal of
these activities is to create a value that is worth more than the actual cost of
providing the product or service. Therefore, the Value Chain Analysis can be used as
a means to analyse the organisation‟s internal activities and, consequently, its
competitive strength (West, 2010:89).
Market orientation is conceptualised as having three components: a customer
orientation, the competitor orientation and the inter-functional coordination
component (Rouzies et al., 2008:113). This study examines the inter-functional
coordination component in more detail.
The goal of the marketing strategy, according to West (2010:7), is to enable an
organisation to achieve its objectives. This is done through understanding the
business environment and making use of resources to meet the needs of the
customers. The marketing strategy allocates people and capital to achieve its
strategies. Therefore, marketing and sales activities are primarily focussed on getting
the customer to buy the end product. The buying cycle is described by Craig
Rosenberg as one-third marketing followed by two-thirds sales activities. Thus it is
crucial that sales and marketing collaborate to optimise the buying cycle.
The Customer Life Time Value (CLTV) is described as a marketing control variable
outcome that leads to customer equity. By viewing customers as assets, both a hard
(financial number) and a soft (customer) future-orientated outcome can be

2
expressed to measure the success of a marketing strategy (West, 2010:505).
The changing business environment is highlighted by business-to-business
organisations that are under pressure from company and customer forces which are
re-shaping the sales force and the company‟s operation. The four forces are
illustrated in Figure 1 below (Piercy, 2009:351).
Figure 1: Forces driving the sales organisation (Piercy, 2009:351)
In a more marketing-related study, Homburg (2008:134) states that most of the
traditional „marketing activities‟, specifically pricing and distribution strategy, are, in
fact, dominated by sales rather than marketing. This statement is correlated and
expanded on by Troilo (2009:872) who describes the increased influence of sales on
the following activities: pricing strategies, designing customer service and support,
as well as expanding into new geographical markets and developing distribution
strategies.
SALES
ORGANISATION
NEW
MARKETING
STRATEGIES
STRINGENT
PRODUCTIVITY
INITIATIVES
ESCALATING
CUSTOMER
DEMANDS
COMPETITION
FROM DIRECT
CHANNELS

3
In the study conducted by Liu and Comer (2007:565) on the role of salespeople as
information gatherers, the authors remark that salespeople have intimate knowledge
of their customers because of the way they interact with them. The sales force is
therefore vital to a company involved in research and development, and the
manufacturing and selling of products as a source of market information. This rapid
strategic response requires up-to-date customer-specific information to be available
within the business unit. The challenge is gathering good quality market intelligence,
transferring this information to management and communicating an effective
strategic response back to the sales force which will then implement it.
In South Africa, the South African Medical Device Industry Association (SAMED) is a
non-profit organisation incorporated under the Companies Act of 2008 (About
SAMED, 2013). The purpose of SAMED is to promote, represent and safeguard the
interests of the South African Medical Device and In-Vitro Diagnostics (VDI) industry
(Representing the SA Medical Device Industry, 2013). According to SAMED, Teleflex
Medical (Pty) Ltd is classified as a global supplier of medical devices, surgical
instruments and disposable medical products (Members, 2013). The company
manufactures, produces, distributes and sells medical devices and therefore
competes in the upstream and downstream market. Teleflex South Africa is a
market-driven organisation importing goods from overseas manufacturing sites
within Teleflex (Pty) Ltd and selling them in South Africa (Welcome to Teleflex,
2013).
The researcher is employed by Teleflex Incorporated and holds a position in the
sales division. From first-hand observation, the researcher has witnessed the current
level of collaboration between the sales and marketing divisions, as well as inter-
departmental conflict. An informal discussion with middle management has
confirmed this phenomenon.
Inadequate collaboration between sales and marketing divisions can potentially
create a situation in which the sales force promotes products that marketing did not
plan to support in the long run instead of adequately promoting the products
supported by the marketing division (Rouzies et al., 2008:114). This situation has an

4
impact on the inventory levels and number of back orders for a sales organisation. In
addition, new products and services to be designed and launched require
coordination and support between sales and marketing divisions.
1.2 PROBLEM STATEMENT
The medical device industry is a highly competitive market with rapidly evolving
technological and customer needs. The sales organisation that is able to respond
effectively and quickly to market changes is more likely to create a competitive
advantage over competitors who do not (Lyus, 2011:39). As a result, business-to-
business companies are changing the way they are responding to customer and
market pressures for higher service and relational investments (Piercy, 2010:349).
Within a sales organisation, the marketing and sales divisions collaborate in order to
achieve set business objectives through a marketing strategy. Poor collaboration
places the achievement of these set business objectives in jeopardy and impacts on
business performance. This study focuses on the existing collaboration between
sales and marketing divisions within a South African subsidiary of an international
company.
The sales and marketing divisions within Teleflex Medical South Africa are not
collaborating with one another to establish a set of shared goals to deliver the
desired customer value and improved business performance. In the past,
management arranged meetings between sales and marketing staff on a quarterly
basis in an effort to improve collaboration in terms of achieving shared goals. The
meetings were held in a training format presented by marketing staff who lectured
sales staff on focus products for the upcoming financial quarter. This failed to create
lasting collaboration between the sales and marketing staff. Sales and marketing
divisions are still focussing on their individual goals.

5
1.3 AIM AND OBJECTIVES
1.3.1 Aim
The aim of this research study was to investigate existing collaborative practices
between the sales and marketing divisions and to make recommendations with
regard to increased collaboration.
This study employed a post-positivistic constructivist research method. The post-
positivistic approach was chosen due the researcher‟s employment with Teleflex
South Africa and a degree of bias was anticipated.
The research commenced with a preliminary literature review to identify possible
antecedents of collaboration between sales and marketing divisions. This led to the
development of a semi-structured questionnaire which was completed anonymously
by members of the sales and marketing divisions.
1.3.2 Objectives
1.3.2.1 Primary objective
The primary objective was to investigate and research the antecedents of
collaboration between sales and marketing divisions.
1.3.2.2 Secondary objective
The secondary objectives of this study were to:
investigate the key variables that have an influence on collaboration between
sales and marketing divisions;
understand what other important factors are needed to enhance collaboration;
identify the steps for increased collaboration within a sales organisation; and
develop possible recommendations for achieving greater collaboration

6
between sales and marketing divisions.
1.4 THEORETICAL FRAMEWORK
The interface between sales and marketing has garnered attention in the research
community of sales and marketing management.
A research study suggested that organisations are simplifying their organisational
structure and breaking barriers between functions to increase their ability to adapt
and build competitive advantage. This was attributed to increasing competitive
pressures, shorter product life cycles and increased customer demands (Rouzies et
al., 2005:113). A proposed framework for sales and marketing integration was then
developed by Rouzies et al. (2005:113) in which the authors conceptualised
structural, procedural, cultural and people-based integration mechanisms for
marketing and sales divisions.
In 2006, Matthyssens and Johnston (2006:338) conducted a qualitative study in
Belgium in which they interviewed twenty-one managers from different industries.
The aim of the study was to establish the importance of good coordination between
the sales and marketing divisions of a company. They found that both sales and
marketing did not realise the importance of cooperation in certain areas.
Subsequently, Kotler et al. (2006:70-72) identified best practices that could improve
team effort and total contribution. Two categories that are economic and cultural in
origin and which caused strain between sales and marketing were identified.
Afterwards, Kotler et al identified four types of relationships between sales and
marketing that change as the relationship grows. In addition, they developed a
questionnaire that scores the current relationship status. The status is listed in a
progressive order as undefined, defined, aligned and integrated. This proved useful
to management in terms of helping them to determine where they are and where
they would like to be.

7
A further review of the literature shows that five important antecedents are necessary
for effective collaboration between sales and marketing divisions. Firstly, a positive
senior management attitude towards collaboration between sales and marketing is
required, communication and a reduction in inter-departmental conflict is necessary.
The two remaining antecedents include the establishment of organisational learning
and effective market intelligence systems (Le Meunier-Fitzhugh & Piercy, 2010:613).
This was followed by a cross-industry study of 337 European Union-based
companies by Homburg et al. (2008:133). They developed a multi-dimensional
model of the sales and marketing interface and found that the interface between
sales and marketing varies to a large extent between companies and across
industries. Since then follow-up studies have been undertaken to investigate the
relationship between sales and marketing (Malshe, 2011), as well as to explore the
interface between sales and marketing (Mollenkopf, 2011). All of the above-
mentioned studies were conducted in Europe with senior management staff
members serving as participants.
Teleflex Incorporated is a pure play medical device company committed to providing
long-term value to its shareholders (Welcome to Teleflex: 2013). In working towards
shared goals through collaboration, the sales and marketing divisions will optimise
working output and efficiency. Munn (quoted in Le Meunier-Fitzhugh et al.,
2007:207) argues that „there is a long standing contention that sales and marketing
activities should be coordinated because their functions are interrelated‟.
The theory therefore suggests that increased collaboration between the sales and
marketing divisions has a positive correlation with improved business performance
and holds value for business research.
To summarise, the preliminary literature review suggests that the interface between
sales and marketing divisions can be described and analysed by means of
interviews and questionnaires.

8
1.5 RESEARCH DESIGN
This study employed the mixed method methodology to investigate and describe the
current collaboration between sales and marketing divisions within Teleflex Medical
South Africa.
Permission was obtained from the Teleflex South Africa Managing Director prior to
the commencement of the study.
A secondary data analysis of available published documents was used to assist in
constructing and refining the measurement questions. The questionnaire included
questions that reveal deviations from the researcher‟s viewpoint with the purpose of
increasing the reliability of the instrument. The selected respondents were then
contacted telephonically to explain the purpose of the study, obtain consent and
explain the questionnaire. The questionnaire was emailed or faxed to the
respondents due to their geographic dispersion and limitations on the researcher‟s
time and funds. The completed questionnaires were returned via fax or email.
This study made use of the convenience non-probability sampling method as a
means of selecting 20 respondents who were relevant to the research issue. The
research population, which was made up of approximately 20 respondents, was
limited to current employees of Teleflex South Africa who are employed in a
managerial-, sales- or marketing-related position.
The questionnaire consisted of a five-point Likert-Type Scale with responses ranging
from Strongly Agree to Strongly Disagree. The parametric t-test was used for
analysis since the data came from a single, specified population and the statistical
significance between a sample distribution mean and a parameter needed to be
determined (Cooper & Schindler, 2011:468). The results were validated against a
non-parametric correlation analysis due to the non-random sampling limitation of the
study. The Partial Least Square Test (PLS) was used due to the small sample size.
Furthermore, the PLS is a predictive technique that is able to incorporate many
independent variables (Rollins et al., 2012:988).

9
1.6 ETHICAL CONSIDERATIONS
Cooper and Schindler (2011:32) assert that „The goal of ethics in research is to
ensure that no one is harmed or suffers adverse consequences from research
activities‟. In accordance, the following ethical considerations applied while
conducting this research:
Objectivity: The researcher is employed by Teleflex South Africa and a degree
of bias was anticipated. The study was therefore conducted from a post-
positivistic constructivist viewpoint and took the above mentioned into
account. Bias was further avoided by data analysis and data interpretation by
means of parametric analysis.
Voluntary participation: Participation in this study was voluntarily and
measures were taken to ensure that respondents were not forced to
participate or misled as to the reason for the study.
Informed consent: The respondents were informed of their rights, the research
process and the proposed benefits of the research prior to the start of the
study.
Confidentiality and respect: The nature of the study lent itself towards the
exposure of potentially sensitive information regarding the competitive abilities
of Teleflex South Africa. An agreement with Teleflex South Africa regarding
the notion that the results would be made known to them prior to publication
was reached. The researcher ensured that the participants‟ responses
remained confidential (i.e. unknown to the management of Teleflex South
Africa) to encourage participation and honest responses.
Data integrity: The ethical protection of the data collected during and after the
research was ensured with an offline data management system and kept in a
secure storage area.
1.7 DEMARCATION OF THE FIELD STUDY
This study investigates and describes the collaboration between the sales and
marketing divisions in a South African Medical Device Company to improve business

10
performance. The target population consists of current employees at Teleflex South
Africa employed in a marketing or sales capacity.
This study combines the fields of Strategic Management, Marketing and Sales
Management. For an organisation such as Teleflex South Africa, which
manufactures and sells products, the internal alignment of divisions is crucial to
positive business performance. Poor collaboration between the sales and marketing
divisions impacts negatively on business performance. Therefore, it is vital to
optimise sales and marketing collaboration.
Due to time and financial constraints, the researcher mostly communicated with the
respondents via telephone, fax or email.
1.8 DEFINING TERMINOLOGY
The following quotation provides an operational definition of sales and marketing
integration for the purpose of this study:
The degrees to which the departments engage in collaborative activities – the degree to
which they work together as a team and share resources to make strategic decisions, develop
implementation plans, and assess performance of these strategies and plans. (Rouzies et al.,
2008:115).
1.9 CHAPTER LAYOUT OF THE STUDY
Chapter One demarcates the problem and the aim of the study within a particular
research area.
Chapter Two deals with a thorough literature review of the sales and marketing
interface, sales and marketing collaboration and variables influencing the degree of
collaboration.
Chapter Three will be devoted to the methodology which includes information
gathered from the questionnaire.

11
Chapter Four integrates and discusses the results of the quantitative and qualitative
data from the questionnaire.
Chapter Five synthesises the data analysis findings and possible recommendations
for improved collaboration between the sales and marketing divisions at Teleflex
South Africa.

12
CHAPTER 2
COLLABORATION BETWEEN SALES AND MARKETING
2.1 INTRODUCTION
This chapter will discuss the outcome of the literature review. The importance of
collaboration between the Sales and Marketing divisions of an organisation will be
highlighted and additional insights and recommendations from previous studies on
the subject will be examined.
2.2 THE IMPORTANCE OF COLLABORATION
The creation of marketing strategy and the execution thereof require Sales and
Marketing divisions to collaborate and coordinate processes due to their
interdependency. This enables the organisation to improve business performance
(Malshe, 2009; Guenzi & Troilo, 2006; Kotler et al., 2006). The organisation‟s ability
to create customer value is also dependent on its internal coordination of the various
departments. The internal resources and abilities are consequently utilised to effect a
competitive advantage. Sales and Marketing interaction therefore has the potential to
inhibit or promote this process (Hughes et al., 2013:57). A sub-optimal relationship
will exhibit conflict, mutual stereotyping and non-cooperation. Physical separation
and different outlooks also contribute to a sub-optimal interface (Malshe, 2010:13).
Sales and marketing integration is a dynamic process. Two divisions can create
more value by working together than by working independently. This requires
consistency (same goal), coordination (timing of activities) and congruency with each
other (Rouzies et al., 2005:115). This holds true, especially with marketing strategy
creation, implementation and execution.
Sales buy-in of marketers‟ marketing strategy is defined by Malshe and Sohi
(2009:207) as the sales department‟s belief that marketing‟s proposed strategy or

13
initiative has merit and is appropriate (Malshe & Sohi, 2009:207). Sales buy-in can
be viewed as a potential outcome of internal marketing activities and can, therefore,
facilitate improvement of the sales-marketing interface (Malshe & Sohi, 2009:208).
Research has shown that, when marketing follows an independent approach from
the sales division, there are downstream consequences, such as low to little sales
buy-in of marketing strategy with poor execution, implementation and execution.
The sales force is viewed by Rouzies et al. (2005) as an important marketing tool
with which to communicate and influence customer relationships since the
effectiveness of marketing activities increases with the coordination of sales and
marketing activities (Rouzies et al., 2005:113). Figure 2 below depicts the need for
the integration of sales and marketing activities by listing the common activities of
marketing, sales and the interface. Marketing activities receive input from the sales
division and the sales department‟s activities, in turn, receive input from the
marketing division. The area where the circles overlap highlights the activities that
must be coordinated for them to be effectively and successfully performed.
Therefore, all the activities need a level of integration between sales and marketing
(Rouzies et al., 2008:114).

14
Figure 2: Zoltners (2004) quoted in Rouzies et al. (2008:114)
2.3 THE MARKETING-SALES INTERFACE
The sales and marketing departments attract two different kinds of people who
spend their time in different ways (Kotler, 2006:71). The person working in the
marketing department is highly analytical and focussed on data and projects. The
work is mostly done behind a desk and is not seen by sales people. Sales people, by
Competitive analysis
Market research
Market segmentation
Product development
Product positioning
Pricing
Packaging
Advertising
Competitive market intelligence
Personal selling
Distributor management
Account management
Merchandising
Installation
After-sales service
Target marketing Sales forecasting
Customer account selection Value proposition development /
Customer messaging Promotions
Marketing Sales Sales to Marketing inputs
Marketing to Sales inputs

15
contrast, spend most of their time talking and communicating to existing and
potential customers in the field and are skilled relationship builders. Due to the
nature of their job profile, they are used to rejection and keep on moving forward to
close the sale (Kotler, 2006:72).
The bases on which they are judged are also different. The sales force is focussed
on closing sales to reach a quantity or revenue target within a specific timeframe. In
comparison, the marketing programmes are designed to create a long-term
competitive advantage and are not as easily judged to be successful or not (Kotler,
2006:72).
The relationship between the sales and marketing functions and/or departments is a
source of organisational conflict. The two primary sources of conflict have been
identified as cultural and economic in nature (Kotler, 2006:70). This causes negative
stereotyping with regard to the perceived role, activity importance, timeline focus and
the sources of knowledge in sales and marketing departments with a resultant
undervaluing of each contribution (Hughes et al., 2013:57).
Traditionally, sales and marketing divisions have operated separately. However,
there are certain domains in which activities overlap, function concurrently or
consequentially. These domains were identified in 2008 as information sharing
between sales and marketing, structural organisational linkages, distribution of
power, orientation towards the market, and knowledge of sales and marketing
(Homburg et al., 2008:133).
Information sharing refers to the degree of spreading and circulating information from
sales and marketing divisions across the organisation (Homburg, Jensen, Krohmer,
2008:138).
Structural linkages are the degree to which vertical and horizontal interaction
channels have been established or created to facilitate interdepartmental activities.
Within this context, teamwork refers to a specific market-related project where the
activities are developed and implemented by members of the sales and marketing
16
divisions (Homburg et al., 2008:138). An example of this could be the joint planning
for an industry tradeshow by managers from sales and marketing with the stand
manned by members of the sales and marketing divisions. Joint planning, in
particular, refers to the degree to which the budget, objectives and activities were co-
developed (Homburg et al., 2008:138).
Power refers to the degree to which the sales divisions have an influence on market-
related activities as compared to the marketing division. This varies across industries
and between companies (Homburg etc., 2008:139).
The orientation of sales and marketing units refers to the time orientation (short-term
with immediate action versus long-term where extensive planning is needed), as well
as goal orientation (customer versus product) to which their activities relate
(Homburg et al., 2008:139).
Knowledge refers to the expertise within a division secondary to knowledge
acquisition and experience gained. This relates to customers‟ and competitors‟
knowledge, as well as to employees‟ knowledge of products and internal processes
(Homburg et al., 2008:139).
These domains are not hierarchical in nature and one is not a functional prerequisite
for another (Homburg et al., 2008:137). Within each domain there are constructs.
Early research studies show that the most successful models of sales and marketing
interface have strong cultural links between sales and marketing, as well as high
market knowledge by the marketing division. But the sales and marketing interface
varies across industries and companies within an industry (Homburg et al.,
2008:133).
2.4 CULTURAL SOURCES OF CONFLICT
The subcultural component of cultural frames was investigated by Beverland et al. in
2006 with the aim of investigating what keeps sales and marketing from integrating.
They found that the conflict between Sales and Marketing is driven by differences in

17
beliefs regarding the following aspects: the validity of the activity‟s scope and focus,
timeframe, sources of valid information and knowledge, difference in status, and the
perceived relationship to the business environment (Beverland et al., 2006:386).
The Sales department has a customer scope and focus while marketing focuses on
market position. Marketing is of the opinion that sales people focus too much on
individual customers‟ needs, increase costs and change the brand perception in the
market place, sacrificing the bigger picture (Beverland et al., 2006:390). Often Sales
fails to comment on marketing strategies that they believe will fail (Beverland et al.,
2006:388). In addition, the Sales department has a short-term, historically-based
timeframe whereas Marketing is more long-term and future based (Beverland et al.,
2006:390).
According to Sabnis et al. (2013), the sales force has three primary responsibilities:
firstly, customer retention via relationship management and growing revenues
through cross selling or upselling; secondly, growing the customer base by acquiring
new customers through lead follow up on marketing as well as leads generated by
themselves; and, thirdly, to engage in non-selling activities such as administration
and training (Sabnis et al., 2013: 53).
The sales force allocates proportions of its time between marketing leads, leads
generated by itself and administrative, non-acquisition activities. The motivation and
reasoning behind the chosen proportion of time allocated per activity group is of
importance (Sabnis et al., 2013: 53). The abilities of individual members of the sales
force, such as experience and historical performance, as well as the organisation‟s
marketing and sales processes, play a role in marketing lead follow-up. An increase
in the perceived quality of prequalified leads, the volume of marketing leads, and the
amount of sales management tracking of lead follow-up, has a negative influence
(Sabnis et al., 2013: 64).
Perhaps one of the biggest sources of conflict arises from the source of information
and the validity of knowledge. Marketing views sales people as valid sources of
short-term, individual, customer-based information. Sales people provide a constant
18
flow of information and ideas from their focussed contact with customers. Therefore,
sales people are viewed as a potential source of new innovations and insights with
the micro information to be linked to macro marketing approaches by Marketing
(Beverland et al., 2006:390).
Often, however, Sales people are frustrated by their market information not being
taken seriously by Marketing. The Sales department has an experienced, applied
basis for information and knowledge, while Marketing has training and theoretical
bases (Beverland et al., 2006:388).
Moreover, marketers are viewed as being out of touch with customers‟ needs and
expectations (Kotler, 2006:70). This is because salespeople view marketing as
having considerably less direct contact with customers and question the credibility of
information relayed by marketing since it often directly contradicts their own direct
experience and is not adequately explained. Salespeople also view knowledge
obtained directly from the market and experience as being more valid than
knowledge gained from large-scale studies and training. They believe that marketing
should supplement its information with information from more direct sources
(Beverland et al., 2006:390).
Individuals in sales and marketing divisions have different mind-sets pertaining to
perspectives on issues and problem solving. Two examples of different mind-sets
include customer versus product and personal relationships versus analysis
(Rouzies et al., 2005:113).
Customer versus product: salespeople are typically responsible for a geographical
region or customer group and promote to sell a wide range of product groups and
products. By contrast, marketers focus on a specific product group or brands to the
exclusion of all other product groups offered by the organisation.
Personal relationships versus analysis: salespeople aim to build relationships with
their individual customers and to develop individualised sales strategies. Marketers
have a more abstract understanding of customers by their analysis of market

19
research data.
By examining the different sales and marketing mind-sets characteristic to each
function, two cultures are identified at a subcultural and organisational level. In turn,
each subculture has a different value allocated to knowledge on what is important,
valuable and useful to achieve its target in relation to the environment (Beverland et
al., 2006:386). Therefore, subcultures moderate strategy and the implementation
thereof in the sales and marketing interface.
Organisations are made of multiple cultures and to achieve objectives, specialised
cultures in marketing and sales are necessary and inevitable. Marketing is
dependent on the sales division as a boundary-spanning activity to achieve its
performance targets such as customer retention, brand communication, sales and
profit, as well as acquisition. In return, the sales division requires the assistance of
marketing in changing what the firm is offering. The challenge lies in creating a
broader, shared frame of reference. This is needed since an independent frame of
reference can hinder cross-cultural integration. An example of this is the political
barrier involving lack of leadership support in cross-functional teams leading to
failure (Beverland et al., 2006:388).
2.4 ECONOMIC SOURCES OF CONFLICT
If sales and marketing share a budget, both parties criticise the amount as well as
what the money is spent on. For example, friction can arise from disagreements
regarding product, pricing and promotion. The sales division tends to prefer lower
prices, leaving more room for negotiation.
Marketing, on the other hand, establishes retail pricing, special promotional pricing
and tender price submission. But the sales department has the final say with regard
to transactional pricing. When special low pricing is needed, marketing is usually not
consulted by the sales department, resulting in conflict (Kotler, 2006:71).

20
The sales department perceives marketing as using more than its share of the
shared budget for marketing purposes. Instead, the sales division would prefer the
money to be spent on having extra salespeople in the field (Kotler, 2006:68).
2.5 MARKETERS’ CREDIBILITY WITHIN THE SALES-MARKETING INTERFACE
The inherent differences between sales and marketing departments may lead to
salespeople assessing marketers‟ level of credibility. The three components of
credibility, i.e. expertise, trust and interpersonal proximity, are used on a micro level
to explain the probable cause of problems in the interface (Malshe, 2010:13).
Research indicates that trustworthiness and expertise are important components
with regard to the concept of credibility. Trust relates to confidence in a partner‟s
reliability and integrity. The partner‟s dependability, competence and responsiveness
are also included. Expertise relates to the level of relevant (contextual) knowledge by
the partner pertaining to the situation (Malshe, 2010:14).
The ability of individual salespeople and marketers to create and maintain a personal
rapport with one another, based on an appreciation of one another‟s work, emerged
as the third component of credibility. This refers to the interpersonal proximity
themes of social distinction and reverence with understanding. Social distinction
relates to the perceived and real differences in status between sales and marketing.
If marketing views salespeople as being of a lower social level, the psychological
distance increases and marketing‟s credibility is adversely affected (Malshe,
2010:16).
The differences between salespeople and marketers may lead to a sense of local
rationality, causing sales and marketing to lose their objectivity and empathy towards
the other departments. This relates to reverence and understanding. An example is if
the marketing department admits that it made a mistake and appreciates how failure
on its part can create challenges for the sales force at customer level. This could
enhance its credibility by bringing it closer to the sales force (Malshe, 2010:17).
Therefore, contextual, conditional variables of inter-functional communication and

21
recurrence relate to the phenomena of marketing‟s credibility in the sales and
marketing interface (Malshe, 2010:17).
Open and respectful communication between the sales and marketing departments
can provide a basis for clarification of misunderstandings and keep one another up
to date with regard to sales and marketing initiatives. In addition, this can provide an
opportunity for feedback and asking for help when needed. This transparent flow of
information contributes to a sense of transparency and promoting trustworthiness. By
communicating activities across the interface, marketing has the opportunity to
highlight its knowledge of sales activities and business savvy (Malshe, 2010:17).
Recurrence relates to data that shows salespeople are not quick to pass judgement
on marketing‟s abilities. However, if the same mistakes, such as breaking promises
and treating salespeople differently, are repeated, marketing loses credibility
(Malshe, 2010:17). Figure 3 below depicts the emergent themes discussed above.
Figure 3: Depiction of emergent themes (Malshe, 2010:15)
Marketer’s credibility
Trustworthiness themes Expertise themes Proximity themes
Value creation
Business savvy
Trench experience
Keeping promise
Common fate
Sales advocacy
Leadership and
resource
Social distinction
Reverence and
understanding
Inter-functional
communication Recurrence

22
2.6 MARKETING-SALES COLLABORATION
In 2007, an exploratory case study, primarily conceptual in design by Ken Le
Meunier-FitzHugh and Nigel Piercy, was used to explore the antecedents and
consequences of collaboration between the sales and marketing divisions. They
found that there are three influencing factors with regard to collaboration, namely
integrators, facilitators and management attitudes pertaining to collaboration
between sales and marketing divisions (Le Meunier-FitzHugh & Piercy, 2007:939).
Figure 4 below illustrates the visual relationship between these three factors.
Figure 4: Antecedents and consequences of collaboration between sales and marketing
(Le Meunier-FitzHugh & Piercy, 2007:944)
Integrators
Collaboration between
sales and marketing
Management attitude
towards coordination Business performance
Communication
Organisational Learning
Market intelligence
Conflict of interest
Marketing planning
Collective factors
Align goals
Foster mutual understanding
Establish Esprit de
Corp
Share resources
Rewards
Cross-functional training
Integrating mechanisms
(e.g. job rotation,
project groups)
Facilitators
Explanation of factors affecting collaboration between sales and marketing
Integrators Management attitudes
to coordination Facilitators

23
A follow-up study on the drivers of sales and marketing collaboration, focussing on
the need for collaboration rather than integration to improve business performance
was conducted in 2009 (Le Meunier-FitzHugh & Piercy, 2010:611). The study
identified the following collaborative drivers: management attitudes towards
coordination, communication, interdepartmental conflict, organisational learning and
market intelligence (Le Meunier-FitzHugh & Piercy, 2010:613).
In 2013, a study by Hughes et al. (2013:57) investigated the ways in which the sales-
marketing interface affects and is affected by other departments to achieve
organisational capabilities. They introduced a holistic framework that identified key
levers that should be integrated via cooperation and cross-functional collaboration.
Figure 5: The Sales-Marketing interface integrative framework (Hughes et al., 2013:60)
The coordinator pillar (Efficacy – Effectiveness)
Th
e p
ow
er
pit
fall
Th
e c
om
petitio
n p
itfall
The cooperation pillar (Efficacy – Effectiveness)
Co
nso
lid
ati
on
Ac
ce
lera
tio
n o
f M
ark
et-
Bas
ed
Cap
ab
ilit
ies
Market sensing
New product development and launch
Market planning and execution
Supply chain management
Customer relationship management
General management
Information technology
Finance/Accounting Human resources
R & D Production
Logistics Legal
Alignment process
Resources Decision
Vision
Marketing Sales
Culture
Information
Knowledge
Fu
ncti
on
s/P
eo
ple
-lev
ers

24
2.7 KEY ANTECEDENTS INFLUENCING COLLABORATION
Marketing does more than setting a price, place, product and promotion. Marketers
need to be able to position, target and segment the product(s) and company in the
market. This requires closer collaboration with manufacturing, product development
and finance to develop brands rather than products (Kotler, 2006:70).
Stereotyping is a source of friction in the sales-marketing interface and may lead to
conflict and poor collaboration.
Marketers‟ negative stereotypical view of salespeople includes the following:
Poor sales due to sales force‟s poor execution of marketing‟s brilliant
marketing plan (Kotler, 2006:68).
Salespeople are too focussed on the individual clients and are unaware or do
not take into account the larger market in the long run (Kotler, 2006:70).
The sales division has no interest in contributing towards strategy formation
and is unable to understand market-based information (Beverland et al.,
2006:389).
The sales department is effective in a very narrow area and plays a
secondary role in carrying out strategies developed higher up in the
organisation. Sales people are not open to new ideas (Beverland et al.,
2006:390).
Salespeople respond to customers‟ immediate needs while marketers focus
on the long term and have little regard for the daily problems of customers
(Beverland et al., 2006:390).
The marketing department looks towards the future (more branded focus to
add value) and does not rely on what worked in the past (commodity based).
This leads to the perception that salespeople are resistant to change
(Beverland et al., 2006:390).
Marketing‟s relationship to the business environment is more proactive than
reactive (Beverland et al., 2006:390).

25
2.8 MANAGERIAL IMPLICATIONS
The differences between sales and marketing functions are necessary for their
activities to be successful (Le Meunier-FitzHugh & Piercy, 2007:952). Organisations
may decide to structure their sales and marketing divisions separately or as a single
unit to promote an optimal-performance organisation. Research has shown,
however, that there is no relationship between the structure of the organisation and
collaboration. Neither does the location of the sales and marketing departments in
the same building have a relationship to collaboration (Le Meunier-FitzHugh &
Piercy, 2008:19).
The presence of an effective relationship between managers is important since they
need to be able to work closely with other functional departments such as sales and
marketing and act as integrators within the organisation. In order to build and
maintain an effective cross-functional relationship, interpersonal trust is very
important. Competence and professionalism must be demonstrated by the managers
to build interpersonal trust (Dawes & Massey, 2006:357).
Inter-functional conflict between sales and marketing managers does, however, have
an impact on collaboration between sales and marketing teams. This working
relationship has two dimensions of interpersonal conflict, namely disfunctional
conflict and functional conflict. Research has shown that the overall level of
disfunctional conflict between these managers is relatively low while the functional
conflict is high. In addition, the quality of communication and the bi-directionality
thereof have a significant impact on both forms of inter-functional conflict (Massey &
Dawes, 2007:118). However, the function of marketing differs across industries,
companies and different product life-cycle stages and can therefore affect the sales
and marketing interface and managerial implications (Kotler, 2006:70).
The alignment of sales and marketing managerial rewards improves collaboration
but does not reduce inter-functional conflict. The senior management support for
collaboration does increases collaboration and reduces inter-functional conflict (Le-
Meunier-FitzHugh & Massey, 2011:1161).

26
In order to improve the relationship between sales and marketing managers, and the
individual managers‟ perceptions of the effectiveness of the relationship, the
perceived justice was investigated. Research found that the managers‟ perceptions
of organisational justice positively influenced the perceived effectiveness of the sales
and marketing relationship. Organisational justice can further be divided into
distributive, procedural and interactional justice. Increased inter-functional
communication contributed to the perceived justice (Hulland et al., 2013:450). In
addition, the power of the marketing unit indirectly influences the working relationship
between sales and marketing managers (Dawes & Massey, 2006: 346).
The sales organisation that is both market- and customer-orientated, requires a
strategic alignment between sales and marketing in order to improve their
relationship. There are two types of sales and marketing alignment needed from a
strategic perspective. Firstly, the sales and marketing divisions should work together
to develop sales-support materials that the salespeople can adapt in order to focus
on their individual customers‟ needs. Secondly, sales and marketing divisions should
collaborate on defining the profile of a prospect and create marketing initiatives that
will produce opportunities for salespeople to follow up on (LaForge et al., 2009:210).
The tension between the two cultural levels may be managed by the shared values
that are present across the subcultures (Beverland et al., 2006:388).

27
CHAPTER 3
METHODOLOGY
3.1 INTRODUCTION
This researcher made use of mixed methods and followed the convergent design
methodology. The rationale behind the choice in research design as well as the
process will be discussed in more detail in this chapter.
3.2 DEFINITION OF MIXED METHODS
Creswell (2014:2) asserts that
[a]n approach to research in the social, behavioural, and health sciences in which the
investigator gathers both quantitative (closed-ended) and qualitative (open-ended) data,
integrates the two, and then draws interpretations based on the combined strengths of both
sets of data to understand research problems.
According to Creswell, an important assumption underlying the mixed method
approach is that, when combining statistical trends from quantitative data with
personal viewpoints and stories from qualitative data, their collective strength
provides a more in-depth understanding of the research problem compared to when
these methods are used alone (Creswell, 2014:2). The researcher adhered to what
worked best and what was practical in this research study to address the research
problem with a small population group (Creswell, 2014:16). Consequently, for the
purposes of this study, the pragmatic worldview was chosen as an underlying
philosophy in the collection of both the quantitative and qualitative data.
3.3 VALUE OF, AND RATIONALE BEHIND, THE USE OF THE MIXED METHOD
APPROACH
This research study aims to understand the central theme of collaboration between
salespeople and marketers employed in the sales and marketing divisions. These

28
individuals have different perspectives on collaboration due to their different job
descriptions, viewpoints and personal experiences.
The use of quantitative or qualitative research alone was insufficient to gain an
adequate understanding of the research problem (Creswell, 2014:14). On its own,
quantitative research will neither adequately investigate the personal stories or
meanings, nor probe in-depth individual perspectives on collaboration. However, it
will provide an opportunity for generalisation and precision. Qualitative research
alone will not enable the researcher to generalise from the small sample group to a
larger population, but it will give the researcher the means for in-depth data on
individual perspectives on collaboration. In addition, the qualitative information will
add details about the setting, place and context of the personal experiences to the
data derived from the quantitative instrument (Creswell, 2014:14).
By making use of the convergent mixed method approach rather than using one
method, the researcher believes that more data was captured. This led to a better
understanding of the research problem since it was seen from multiple perspectives
and angles (Creswell, 2014:35), and the strength of one research method made up
for the weakness of another (Creswell, 2014:14).
Therefore, on a general level, mixed methods were chosen because of their ability to
draw from both quantitative and qualitative research and reduce the limitations of
both (Creswell, 2014:217). On a more practical level, the researcher had access to
both quantitative and qualitative data, and mixed methods provided a more
sophisticated and complex approach to research. On a procedural level, the mixed
methods approach was used as a strategy to gain a more in-depth understanding of
the research questions. This provided the researcher with a better understanding of
the changes needed in the organisation in which the research was conducted
(Creswell, 2014:218).
This research study contributes to the body of knowledge on collaboration between
sales and marketing divisions in South African organisations. Previous studies have

29
not specifically investigated this particular population group.
3.4 CONVERGENT MIXED METHOD DESIGN
The convergent mixed method design allows for the separate collection and analysis
of quantitative and qualitative data with the intent to merge the results (Creswell,
2014:35). The quantitative results yield general trends and relationships while the
qualitative data provides the personal perspectives of the individuals. Merging the
results provides the researcher with additional insights and a more complete
understanding of the research problem. Figure 6 below provides a visual aid on the
convergent design methodology.
Figure 6: Convergent design (Creswell, 2014:55)
3.4.1 Sampling
The target group consisted of individuals employed in the sales or marketing division
within the organisation. It is the opinion of the researcher that individuals are trying to
Qualitative data
collection and analysis
Quantitative data
collection and analysis
Qualitative results Quantitative results
Merging results for
comparison
Interpret or explain convergence or
divergence

30
understand the world in which they live and work, and, by constructing open- and
close-ended questions, the participants are able to convey their views on
collaboration given their social and historical perspectives. This will assist with
inductively developing from field data, themes and patterns for collaboration
(Creswell, 2014:8). Therefore, purposive convenience sampling was used.
Participants were selected from the same population and consisted of equal
numbers for the quantitative and qualitative data analysis. The data was analysed on
the basis of being employed in a sales or marketing position.
3.4.2 Data collection
The data collection was done through a semi-structured questionnaire that was
developed and based on the known variables or antecedents identified in the
preliminary literature review. This was cross-sectional in design by collecting and
analysing the data once (Creswell, 2014:27) by means of a questionnaire. The
questionnaire consisted of a quantitative component in the form of Likert-type
questions, and a qualitative component in the form of three open-ended questions.
Therefore, open-ended questions were employed to illicit information from the
respondents about past events, attitudes and future expectations regarding the
phenomenon of poor collaboration between sales and marketing divisions (Cooper,
Schindler, 2010:142). Furthermore, the closed and open-ended questions in the
questionnaire were designed to be parallel in nature and to facilitate data
comparisons where possible (Creswell, 2014:36). The completed questionnaires
were placed into a „file‟ and entered into a database on the researcher‟s private
laptop in preparation for the analysis.
3.4.3 Data analysis
Two databases existed prior to integration. From the beginning, both the quantitative
and the qualitative databases made use of the same measures of assessments
related to the known antecedents of collaboration. Additional factors influencing

31
collaboration and which emerged from the datasets were discussed in a separate
section. This parallel construction was essential to the merging of the two databases
for the integration of results in Chapter 4 (Creswell, 2014:37). A reliability and
normality test were done on the variables constructed to test credibility.
A side-by-side approach was followed whereby a comparison within a discussion
was made by first presenting quantitative data followed by the qualitative data
related to the section.
The quantitative data was first statistically analysed by using procedures that yielded
pie charts and tables. The tables reported cross-correlations, factor values and Chi-
square results. In addition, reliability and normality tests were conducted on variables
to test their credibility. This descriptive analysis of quantitative data (Creswell,
2014:37) was done by the Business School of the University of the Free State‟s in-
house statistician, using statistical software.
The researcher then read through and wrote general notes next to specific
paragraphs of interest. The coding of qualitative data made use of open coding, axial
coding and selective coding (Creswell, 2014:31). Aggregate data units were formed
by collapsing codes into themes. Where possible, these themes were parallel to the
known antecedents identified in the literature review. Additional factors that could
influence the collaboration emerging from the qualitative data will be discussed in a
separate section together with the related quantitative results.
3.4.4 The merging of databases
Integration started during the construction of the questionnaire and collection of the
data. This allowed both closed- and open-ended responses by the respondents.
During the data analysis phase, the quantitative and qualitative data were analysed
around parallel antecedents. The merging of the two databases was done via
discussion after interpretations and interferences were drawn from the two
databases (Creswell, 2014:36). In this research, the quantitative results were first

32
discussed in sections relating to the known factors towards collaboration with a
separate section for additional factors that influence collaboration. Then the
qualitative results which were sorted into themes relating to known antecedents were
added to the quantitative section(s) relating to them. This was done because
quantitative results do not necessarily explain how the results occurred – simply that
they did (Creswell, 2014:37) and could help explain the quantitative research results.
Therefore, the results were integrated via discussion along the known antecedents
and additional factors relating to collaboration. Additional factors that could influence
collaboration emerged from the two databases. These factors were then discussed
together in a separate section in the results section.
There may be a threat to validity (specific to convergent design methodology) due to
the unequal sample sizes within the sample group, i.e. three marketing respondents
and seventeen sales respondents.

33
CHAPTER 4
RESULTS
4.1 INTRODUCTION
The aim of this research study was to investigate existing collaborative practices
between the sales and marketing divisions and to make recommendations with
regard to increasing collaboration. The literature review revealed that cultural and
economic factors were the largest influence on collaboration. Cultural factors relate
to role allocation, the perceived importance of role within the organisation and
credibility of the individuals. Economic factors, on the other hand, relate to the
incentives in place and whether budgets were shared between the sales and
marketing divisions or whether separate budgets existed.
From the literature review it came to light that informational aspects also influence
the collaborative process. The presence of an effective market intelligence system
and the source of the information with the validity attached to the contents thereof,
as well as the way in which this market information was communicated, was found to
be influential in the collaborative process. Because the sales and marketing divisions
within the sales organisation work towards shared organisational goals and have
overlapping activities, the sales division‟s involvement in the marketing strategy
process relates back to collaboration.
Consequently, a questionnaire was developed to facilitate the investigation of the
known antecedents and to possibly identify other factors that could influence the
collaboration between the sales and marketing divisions within the organisation. The
questionnaire had a quantitative component in the form of Likert-scale questions and
a qualitative component in the form of three open-ended questions.
In order to facilitate the integration of the data from both the quantitative and
qualitative sections, the themes identified from the open-ended questions were
integrated with the quantitative questionnaire‟s data on the known factors

34
investigated. Additional factors that could influence collaboration will also be
discussed in this chapter.
Therefore, the secondary objective to investigate key variables that have an
influence on collaboration will be dealt with. Moreover, an understanding of other
factors that may be important for enhanced collaboration will be incorporated into the
results.
A summary will be provided at the end of Chapter 4.The profile of the respondents
will first be discussed.
4.2 PROFILE OF RESPONDENTS
The research population was limited to current employees of Teleflex South Africa
who are employed in a sales- or marketing-related position within the sales and
marketing divisions. There were twenty possible respondents of whom fifteen in total
completed and returned the questionnaire. All three respondents from the marketing
division responded, but only twelve sales division members participated. The
reduced participation rate could be due to the limited time (nine days) allowed for the
completion of the questionnaire. The fifth teen completed questionnaires of the
twenty possible respondents yielded a response rate of 75%.
4.2.1 Gender
The majority of the respondents were female (73%) with males only contributing
27%. This organisation is clearly female dominated in the sales and marketing
divisions (Figure 7).

35
Figure 7: Respondents gender
4.2.2 Age
According to Figure 8, the majority of the respondents were 31-40 years old (47%),
with 33% between 41-50 years, and 20% above 51 years old (Figure 8).
Figure 8: Age of respondents
Male 27%
Female 73%
Gender
Male Female
31 - 40 years 47%
41 - 50 years 33%
51 and older 20%
Age
31 - 40 years 41 - 50 years 51 and older

36
4.2.3 Position
The majority of the respondents were employed in a sales position (80%), while the
marketing respondents comprised 20% of the total respondents. This is a realistic
depiction of a sales organisation where the members of the sales division are more
than those in the marketing division (Figure 9).
Figure 9: Position of employment
4.2.4 Years in current position
In figure 10 below, it can be seen that most of the respondents have only occupied
their positions for less than 2 years (40%). Twenty-seven per cent (27%) have spent
2-5 years in their current position, whereas 20% have occupied their current
positions for more than 10 years. A minority (13%) has been in their current position
for 6-10 years (Figure 10).
Sales 80%
Marketing 20%
Position
Sales Marketing

37
Figure 10: Years in current position
4.2.5 Highest educational level
Figure 11 below shows that the majority of the respondents (46%) hold a diploma
qualification, while 20% have post-graduate degrees, and 20% have undergraduate
degrees. One respondent holds a master‟s degree (7%) and one a Grade 12
qualification (7%) (Figure 11).
Figure 11: Highest educational level
Less than 2 years 40%
2 - 5 years 27%
6 - 10 years 13%
More than 10 years 20%
Years in current position
Less than 2 years 2 - 5 years 6 - 10 years More than 10 years
Matric or Grade 12 7%
Diploma 46% Undergraduate
degree 20%
Postgraduate degree
20%
Master degree 7%
Highest educational level
Matric or Grade 12 Diploma Undergraduate degree
Postgraduate degree Master degree

38
4.3 EXISTING COLLABORATIVE PRACTICES BETWEEN SALES AND
MARKETING DIVISIONS
The quantitative data were in the form of categorical (nominal measurement scale)
data from Likert-type scale questions. Cross-tabulation takes two variables and
tabulates the results of one variable against the results of the other. This provides a
basic picture of the way in which two variables inter-relate and helps to identify
patterns of interaction between the variables, thereby summarising observations
according to categories. The Chi-square statistic is then calculated to determine
whether the two discrete variables are associated and to see if the pattern has any
substantial relevance. The quantitative data was analysed, using this approach.
4.3.1 The perceived importance of collaboration
Questions 2.1 and 2.2 relate to the respondents‟ knowledge as to the importance of
collaboration for the sales organisation, as well as the importance of collaborating
and coordinating their activities. The majority of the respondents (73,3%) strongly
agree and the remaining 26,7% agree that it is to the organisation‟s advantage if the
sales and marketing divisions collaborate. The realisation of the importance of
collaboration and coordination in the sales and marketing divisions had similar
results. (Table 1 below.)
Table 1: Perception of importance of coordinating and collaborating with regard to activities
Question 2.2 Position
Total Sales Marketing
Strongly agree 66,70% 100,00% 73,30%
Agree 33,30% 26,70%
Total 100,00% 100,00% 100,00%
4.3.2 Assessment of the need for improving collaboration
The response to the open-ended Question 2.3 on how respondents think
collaboration can improve elicited strong responses from both the sales and
marketing respondents. All of the respondents felt that collaboration needed

39
improvement and various suggestions on how to achieve this were provided. These
suggestions were integrated with the rest of the data and new factors that have an
impact on collaboration will be discussed separately.
4.4 ANTECEDENTS OF COLLABORATION BETWEEN SALES AND MARKETING
DIVISIONS
4.4.1 Cultural factors
Cultural factors were identified as a known antecedent of collaboration and were
investigated in Question 3 of the questionnaire.
Firstly, the results relating to the perceived importance associated with the division
within the organisation will be discussed. Secondly, a discussion on the importance
associated with specific activities during the buying cycle will follow. Thirdly, the role
played by the sales and marketing divisions within the sales organisation and the
specific allocation of activities during the buying cycle will be examined. Next, the
relationship between the perceived importance of an activity in the buying cycle and
the role allocation thereof will be analysed and discussed. Lastly, the credibility of
sales and marketing divisions will be discussed.
4.4.1.1 The role of the marketing division in the organisation
The question was asked as to whether the market or sales division has a more
important role in increasing market share and sales turnover. The majority of sales
and marketing respondents disagreed that marketing has a more important role.
(See Table 2 below.)

40
Table 2: Marketing division plays a more important role in increasing market share and sales
turnover
Question 3.2 Position
Total Sales Marketing
Agree 16,7% 33,3% 20,0%
Disagree 75,0% 66,7% 73,3%
Strongly
disagree 8,3% 6,7%
Total 100,0% 100,0% 100,0%
From the qualitative data, it is evident that marketers and salespeople expect
marketing to be involved with tenders at government institutions and at head office
level with private hospital groups for formulary status and contracts. In this way, a
demand for products at head office level is initiated and marketing should build these
relationships. The sales division views the marketing division as being responsible
for analysing figures to assist with budget setting, forecasting and trend identification.
4.4.1.2 The role of the sales division in the organisation
The respondents‟ belief, however, that the sales division does not play a more
important role was not as definite. The majority of all respondents agreed that the
sales division plays a more important role in increasing market share and sales
turnover. The majority of marketing (66,7%) agreed with this statement. (Table 3
below.)
Table 3: Sales division plays a more important role in increasing market share and sales
turnover
Question 3.3 Position
Total Sales Marketing
Strongly agree 25,0% 20,0%
Agree 41,7% 66,7% 46,7%
Disagree 33,3% 33,3% 33,3%
Total 100,0% 100,0% 100,0%
41
The qualitative data reveals that marketing expects the sales force to bring in the
sales and act as a catalyst in company performance. They also expect the sales
division to develop new customers according to opportunities provided by new
formularies and tenders and to analyse specific territories to track sales.
The sales division views its main role as achieving target by driving sales and
turnover while increasing market share. Attracting and maintaining customers by
creating demand and offering relevant solutions are also very important to them.
They feel that they are responsible for following up on enquiries and customer
complaints with the relevant people to facilitate a speedy resolution. An in-depth
understanding of their specific territory is needed for them to identify opportunities
and threats at problem areas.
4.4.1.3 Role allocation
The response to open-ended Question 3.4 on the perceived role of the marketing
division and Question 3.5 on the role of the sales division within the organisation
resulted in lengthy responses from both sales and marketing respondents. These
suggestions have been integrated into this chapter and new factors that have an
impact on collaboration will be discussed separately. What did emerge was that the
sales division would like the role allocation to be made clear for each division.
A factor value analysis was done on the allocation of activities during the buying
cycle. The methodology used will be described next. A 4-point Likert scale was used
for Question 3.6, ranging from 1 for marketing, 2 for sales and 3 for marketing and
sales. These responses were then added and divided by the number of respondents,
giving a mean (average) value, ranging from 1,00 to 3,00. However, because the
researcher worked with categorical variables, she could not interpret the mean as it
was. Therefore, the mean for each question was changed into a factor value (FV) or
an Average Score (AS). The FVs were then calculated. A Mean of 1,5 is therefore
equal to a FV of 0,5 (or 50%). A FV of 0,333 or less indicated that the activity was
allocated to marketing, and a FV between 0,34 and 0,667 indicated that the activity
was allocated to sales. A FV greater than 0,667 indicated that the activity was

42
allocated to both marketing and sales. These factor values were then used to
determine which activities were allocated to marketing, which to sales and which to
both departments. The highlighted rows in Table 4 illustrate the difference in the
perceived activity role allocation by sales and marketing division respondents. (See
Table 4 below for results.)
Table 4: Allocation of activities during the buying cycle
Question 3.6 Overall sample Sales Marketing
N Mean FV Department N Mean FV Department N Mean FV Department
Competitive
analysis 15 2,200 0,733
Marketing
and Sales 12 2,167 0,722
Marketing
and Sales 3 2,333 0,778
Marketing
and Sales
Market
research 15 2,333 0,778
Marketing
and Sales 12 2,167 0,722
Marketing
and Sales 3 3,000 1,000
Marketing
and Sales
Market
segmentation 15 1,933 0,644 Sales 12 1,833 0,611 Sales 3 2,333 0,778
Marketing
and Sales
Product
development 15 1,933 0,644 Sales 12 1,833 0,611 Sales 3 2,333 0,778
Marketing
and Sales
Product
positioning 15 2,000 0,667 Sales 12 1,917 0,639 Sales 3 2,333 0,778
Marketing
and Sales
Pricing 15 1,533 0,511 Sales 12 1,250 0,417 Sales 3 2,667 0,889
Marketing
and Sales
Packaging 15 1,133 0,378 Sales 12 1,000 0,333 Marketing 3 1,667 0,556 Sales
Advertising 15 1,533 0,511 Sales 12 1,333 0,444 Sales 3 2,333 0,778
Marketing
and Sales
Competitive
market
intelligence
15 2,533 0,844 Marketing
and Sales 12 2,417 0,806
Marketing
and Sales 3 3,000 1,000
Marketing
and Sales
Personal
selling 15 2,200 0,733
Marketing
and Sales 12 2,250 0,750
Marketing
and Sales 3 2,000 0,667 Sales
Distributor
management 15 1,333 0,444 Sales 12 1,250 0,417 Sales 3 1,667 0,556 Sales
Account
management 15 2,400 0,800
Marketing
and Sales 12 2,333 0,778
Marketing
and Sales 3 2,667 0,889
Marketing
and Sales
Merchandising 15 1,733 0,578 Sales 12 1,750 0,583 Sales 3 1,667 0,556 Sales
After-sales
service 15 2,400 0,800
Marketing
and Sales 12 2,333 0,778
Marketing
and Sales 3 2,667 0,889
Marketing
and Sales
Target
marketing 15 2,133 0,711
Marketing
and Sales 12 2,083 0,694
Marketing
and Sales 3 2,333 0,778
Marketing
and Sales
Sales
forecasting 15 2,533 0,844
Marketing
and Sales 12 2,667 0,889
Marketing
and Sales 3 2,000 0,667 Sales
Value
proposition
development
15 2,267 0,756 Marketing
and Sales 12 2,083 0,694
Marketing
and Sales 3 3,000 1,000
Marketing
and Sales
Customer
messaging 15 2,333 0,778
Marketing
and Sales 12 2,250 0,750
Marketing
and Sales 3 2,667 0,889
Marketing
and Sales

43
According to Table 4, there appears to be uncertainty regarding the following
activities in the buying cycle: market segmentation, product development, product
positioning, pricing and packaging, advertising and personal selling and sales
forecasting.
The respondents agreed that certain activities should be shared. These include
competitive analysis, market research, competitive market intelligence, account
management, after-sales service, target marketing, value propositioning
development and customer messaging. Activities viewed as being the responsibility
of the sales division only include distributor management and merchandising.
The activities in which the sales division would like the marketing division to be
involved relate to sales forecasting and personal selling. The marketing division
would like to see joint involvement in the following activities: market segmentation,
product development, product positioning and advertising.
The qualitative data showed that the marketing department views competitive
analysis as its domain. It wants to analyse and research the business portfolios and
the market, gather data from all in the field and all other sources and then make it
available throughout the organisation. These activities are usually done in the
absence of sales division involvement.
The sales division expects the marketing department to identify which products to
sell, otherwise known as focus products, and drive the product positioning strategy
and promotions. It expects marketing to have these products approved by medical
aids with market-related prices, but would like to be involved in pricing decisions. In
addition, there is a perception by the sales division that the marketing division should
do more marketing since, at the moment, the sales people feel they are doing most
of the hands-on marketing.

44
4.4.1.4 Perceived importance of activity in buying cycle and role allocation
The relationship between the perceived importance of an activity in the buying cycle
and the role allocation thereof was investigated via a factor value analysis of the data
gathered from Questions3.1 and 3.6 from the questionnaire. The aim is to provide a
basic picture of the interrelationship between the two categorical variables and to
assist in finding the interactions between them.
In the factor value analysis, a 4-point Likert scale was used for Question 3.1, ranging
from 1 (not important) to 4 (very important). These responses were then added and
divided by the number of respondents, giving a mean (average) value ranging from
1,00 to 4,00 with 2,00 as the middle value (lower than 2,00 indicates that
respondents regard the activity as unimportant – thus, the closer the mean to 4,00,
the more important the activity. However, because the researcher worked with
categorical variables, she could not interpret the mean as it was. Therefore, the
mean for each question was changed into a factor value (FV) or an Average Score
(AS). The FVs were then calculated. A Mean of 2,00 is therefore equal to a FV of 0,5
(or 50%). A high FV (> 0.5) indicates that the majority of the respondents regard the
activity as being important. These factor values were then used to rank the activities
from most important (with highest FV) to least important (with lowest FV). The results
can be seen in Table 5 below.
Table 5: The importance of sales and marketing activities during the buying cycle
Question 3.1 Overall sample Sales Marketing
N Mean FV Rank N Mean FV Rank N Mean FV Rank
Competitive
analysis 15 3,600 0,900 4 12 3,500 0,875 4 3 4,000 1,000 1
Market research 15 3,667 0,917 3 12 3,583 0,896 3 3 4,000 1,000 1
Market
segmentation 15 3,533 0,883 5 12 3,417 0,854 5 3 4,000 1,000 1
Product
development 15 3,467 0,867 6 12 3,333 0,833 6 3 4,000 1,000 1
Product
positioning 15 3,800 0,950 1 12 3,750 0,938 1 3 4,000 1,000 1
Pricing 15 3,533 0,883 5 12 3,500 0,875 4 3 3,667 0,917 2
Packaging 15 3,133 0,783 11 12 3,167 0,792 8 3 3,000 0,750 3
Advertising 15 3,267 0,817 9 12 3,083 0,771 9 3 4,000 1,000 1

45
Question 3.1 Overall sample Sales Marketing
N Mean FV Rank N Mean FV Rank N Mean FV Rank
Competitive
market
intelligence
15 3,733 0,933 2 12 3,667 0,917 2 3 4,000 1,000 1
Personal selling 15 3,800 0,950 1 12 3,750 0,938 1 3 4,000 1,000 1
Distributor
management 15 3,333 0,833 8 12 3,167 0,792 8 3 4,000 1,000 1
Account
management 15 3,667 0,917 3 12 3,583 0,896 3 3 4,000 1,000 1
After-sales
service 15 3,733 0,933 2 12 3,667 0,917 2 3 4,000 1,000 1
Target marketing 15 3,533 0,883 5 12 3,417 0,854 5 3 4,000 1,000 1
Sales forecasting 15 3,533 0,883 5 12 3,417 0,854 5 3 4,000 1,000 1
Value proposition
development 15 3,333 0,833 8 12 3,167 0,792 8 3 4,000 1,000 1
Customer
messaging 15 3,400 0,850 7 12 3,250 0,813 7 3 4,000 1,000 1
Promotions 15 3,200 0,800 10 12 3,083 0,771 9 3 3,667 0,917 2
From the results in Table 5, it appears that personal selling and product positioning
are seen as being the most important activities in the buying cycle both by the sales
and marketing respondents. However, the results were influenced by the marketing
respondents who marked most of the activities as being very important and gave
very little indication to the difference in level of importance they allocate to different
activities. The overall sample allocated the following level of importance to activities
from the most to the least important: personal selling, product positioning,
competitive intelligence, after-sales service, market research and account
management.
The qualitative data shows that the sales force has to contend with more than one
product manager pushing for time and sales on their specific portfolio products.
4.4.1.5 The relationship between the perceived importance of an activity in the
buying cycle and the role allocation thereof
A Chi-square test was used to determine whether a relationship exists between the
variables‟ perceived importance of an activity in the buying cycle and the role
thereof. For the activities in Questions 3.1 and 3.6, the test determined whether the

46
importance of a particular activity is associated with the department to which it is
allocated. A p-value of less than 0,1 means that there is an association between the
two.
The activities with a p-value of less than 0,1 include: competitive analysis, market
research, value proposition development, customer messaging and promotions. This
means that their importance is associated with their allocation to the sales and/or
marketing department. The rest of the activities have p-values that are greater than
0,1, which means that there is no association between their importance and their
allocation to the different departments. (See Table 6 below for results.)
Table 6: Results of Chi-square tests to determine whether a relationship exists between the
variables
Importance Department
allocation Activities Statistic P-value
Q3.1.1 Q3.6.1 Competitive analysis 2,963 0,085
Q3.1.2 Q3.6.2 Market research 4,636 0,098
Q3.1.3 Q3.6.3 Market segmentation 0,579 0,447
Q3.1.4 Q3.6.4 Product development 3,951 0,139
Q3.1.5 Q3.6.5 Product positioning 4,286 0,117
Q3.1.6 Q3.6.6 Pricing 2,022 0,732
Q3.1.7 Q3.6.7 Packaging 4,286 0,117
Q3.1.8 Q3.6.8 Advertising 4,773 0,189
Q3.1.9 Q3.6.9 Competitive market intelligence 3,223 0,200
Q3.1.10 Q3.6.10 Personal selling 0,937 0,333
Q3.1.11 Q3.6.11 Distributor management 2,844 0,828
Q3.1.12 Q3.6.12 Account management 5,859 0,210
Q3.1.13 Q3.6.14 After-sales service 0,511 0,475
Q3.1.14 Q3.6.15 Target marketing 3,367 0,186
Q3.1.15 Q3.6.16 Sales forecasting 1,727 0,189
Q3.1.16 Q3.6.17 Value proposition development 10,000 0,040
Q3.1.17 Q3.6.18 Customer messaging 8,611 0,072
Q3.1.18 Q3.6.19 Promotions 22,755 0,001
4.4.2 Credibility of the sales and marketing divisions
Credibility refers to the ability to create and maintain a personal rapport with one
another based on appreciation of one another‟s work. For the purposes of this

47
research, credibility relates to personal rapport, level of trustworthiness and
perceived expertise of an individual in his or her position.
4.4.2.1 Reliability and normality test on variables constructed to test credibility
A reliability test was conducted with regard to the variables constructed in the
questionnaire, relating to credibility by determining the Cronbach alpha value of each
variable. The variables were constructed by summing up all the responses to the
relevant questions associated with each of the variables. The variables included: the
credibility of the marketing division; the credibility of the sales division; sales
division‟s involvement in the marketing strategy process; the source of market
information; the validity of market information; and communicating market-related
information. (See Table 7 for question numbers used to construct variables.)
Table 7: Questions used to construct variables
Variable Questions used
Credibility of the marketing division Q3.7.1 - Q3.7.4
Credibility of the sales division Q3.8.1 - Q3.8.3
Sales division‟s involvement in marketing
strategy process
Q6.1 - Q6.6 (excluding
Q6.2)
Source of market information Q5.3.1 - Q5.3.5
Validity of market information Q5.4.1 - Q5.4.2
Communicating market-related information Q5.5.1 - Q5.5.3
The Cronbach alpha values were then calculated in order to determine the reliability
of the constructed variables. The Cronbach alpha value determines the reliability of
the scale used and tests whether or not the items used for a construct/variable
actually measure that particular construct. A value of above 0,5 is necessary to
conclude that a scale is reliable. From the constructed variables, the Cronbach's
alpha values are all greater than 0,5. (Table 8 below.)

48
Table 8: Cronbach alpha values of variables constructed to assess credibility
Variables Cronbach's
Alpha
No. of
items
Marketing divisions credibility 0,569 4
Sales divisions credibility 0,680 3
Sales division involvement in
marketing strategy process aspect 0,830 5
Source of market information 0,765 5
Validity of market information 0,773 2
Communicating market related
information 0,691 3
4.4.2.2 Chi-square tests on division credibility
To measure the credibility of a division, the test determines whether or not the
credibility in the sales division is associated with that of the marketing division in
terms of expertise and proximity. The remaining factor (trustworthiness) was not
included because the questions are not exactly the same. A p-value of less than 0,1
means that there is an association between the 2.
It was concluded that proximity has a p-value of 0,000 which is less than 0,1. This
means that the credibility in the sales division is associated with that of the marketing
division with regard to the proximity factor or 'antecedent'. Expertise has a p-value of
0,283 which is greater than 0,1. This means that the credibility of the sales division is
not associated with that of the marketing division with regard to the expertise factor.
4.4.2.3 Marketing division members’ credibility
(a) Marketing division‟s expertise
The majority of the sales division (75%) agreed that the marketing strategy has merit
and is appropriate for the South African market, with only 25% in disagreement. By
contrast, the majority of the marketing respondents disagreed (66,6%) and 33,3%
agreed to this. (Table 9 below.)

49
Table 9: Perception of the marketing divisions’ expertise
Question 3.7.1 Position
Total Sales Marketing
Agree 75,00% 33,30% 66,70%
Disagree 25,00% 66,70% 33,30%
Total 100,00% 100,00% 100,00%
The majority of all respondents disagreed (60%) that the marketing division has a
good understanding of the South African market. Marketing respondents,
themselves, disagreed (66,7%) with only one marketing respondent (33,3%)
agreeing. The majority of the sales respondents (58,3%) disagreed, whereas a
further 25% strongly disagreed to the statement. (Table 10 below.)
Table 10: Marketing understanding of South African market
Question 3.7.2 Position
Total Sales Marketing
Strongly agree 25,00% 20,00%
Agree 8,30% 33,30% 13,30%
Disagree 58,30% 66,70% 60,00%
Strongly
disagree 8,30% 6,70%
Total 100,00% 100,00% 100,00%
The qualitative data shed more light on the respondents‟ perception of marketing‟s
expertise and understanding of the South African market.
The sales division expects marketing to be able to gather accurate market
information on their own. Sales division respondents suggested that the product
managers should call on key opinion leaders in the fields of their product portfolio for
market information in addition to that with which the sales force provides them so as
to stay in touch with what is happening in the market. Regular co-traveling and going
into theatres with salespeople is viewed as essential. Marketers are expected to
have superior knowledge of the products for which they are responsible to assist the
sales division.

50
Sales division respondents commented that the level of knowledge of some
members in the marketing team is lacking. By spending more time in theatres with
their local key opinion leaders, they will gain practical knowledge and insight into the
South African market. Only then can marketers do thorough market research on
future trends and new medical procedures, and evaluate the feasibility of new
products and relevance to the South African market. The sales division appears to
want marketing to adopt a more active and visible approach in the field. They want
marketing to grow and maintain relationships with key opinion leaders on their own
as well.
(b) Marketing trustworthiness
Respondents were divided as to whether the marketing department can generate
valid sales leads, with no clear majority viewpoint emerging. 66,7% of the marketing
respondents agreed, but 33,3% disagreed. The majority of sales respondents
disagreed (50%), but 41,7% agreed, with a minority of 8,3% strongly agreeing.
(Table 11.)
Table 11: Trustworthiness of marketing division to generate valid sales leads
Question 3.7.3 Position
Total Sales Marketing
Strongly agree 8,30% 6,70%
Agree 41,70% 66,70% 46,70%
Disagree 50,00% 33,30% 46,70%
Total 100,00% 100,00% 100,00%
The qualitative data brings to light a perception by the sales division that the
marketing team needs to be more in the field to stay in touch with what is happening
in the market and, consequently, produce trusted sales leads.
It also expects the product managers to co-travel with the sales force across the
country on a regular basis. The product managers should interact directly with the
key opinion leaders in the field across the country to help them understand the South
African market of their portfolios. A mentioned example is the necessity of having all

51
new products attain NAPPI coding before launching them in the South African
market where private hospitals will not buy products that have not been approved by
the biggest medical aid, Discovery, since otherwise the hospitals will have to pay for
the products themselves.
(c) Sales division credibility
(i) The sales division‟s expertise
All the marketing respondents (100%) and the majority of the sales division (66,7%)
agreed that the sales division has the necessary knowledge and expertise to assist
in marketing strategies. (Table 12.)
Table 12: Expertise of the sales division
Question 3.8.1 Position
Total Sales Marketing
Strongly agree 16,70% 13,30%
Agree 66,70% 100,00% 73,30%
Disagree 16,70% 13,30%
Total 100,00% 100,00% 100,00%
The qualitative data revealed that the marketing division felt that the sales division
needs training with regard to selling skills and objection handling. This was perceived
to be important in order to provide accurate forecasting to assist with marketing tasks
related to inventory levels.
(ii) Sales trustworthiness
The majority (66,7%) of the respondents (marketing and sales respondents) agreed
that the sales division should follow up on marketing leads. The remaining 33,3% of
the sales respondents strongly agreed that the sales division can be trusted to follow
up marketing leads. (Table 13.)

52
Table 13: Sales division can be trusted to follow up marketing leads
Question 3.8.2 Position
Total Sales Marketing
Strongly agree 33,30% 26,70%
Agree 66,70% 66,70% 66,70%
Disagree 33,30% 6,70%
Total 100,00% 100,00% 100,00%
(iii) Sales proximity
There is no clear majority response. Marketing respondents (66,7%) agreed and
strongly agreed (33,3%). Sales respondents strongly agreed (50%) and agreed
(41,7%), with a minority of 8,3% disagreeing that training provided by marketing
enhances collaboration. (Table 14.)
Table 14: Training provided by marketing enhances collaboration
Question 3.8.3 Position
Total Sales Marketing
Strongly agree 50,00% 33,30% 46,70%
Agree 41,70% 66,70% 46,70%
Disagree 8,30% 6,70%
Total 100,00% 100,00% 100,00%
4.4.3 Economic factors
Cross tabulations were used to summarise the categorical data to create a
contingency table. This provided a basic picture of the interrelation between the two
variables and therefore assisted in finding interactions between them. The sub-
antecedents of incentives and budget allocation will now be discussed.
4.4.3.1 Incentives
The majority of the sales respondents (66,7%) and 66,7% of the marketing
respondents viewed the current commission structure as being motivational. Only
33,3% viewed the structure as not being motivational. (Table 15.)

53
Table 15: Is the current commission structure motivational?
Question 4.1.1 Position
Total Sales Marketing
Yes 66,70% 66,70% 66,70%
No 33,30% 33,30% 33,30%
Total 100,00% 100,00% 100,00%
All of the marketing respondents (100%) and a greater majority (91,7%) of the sales
respondents agreed that the performance bonus of the marketing division should be
linked to portfolio performance. Only 8,3% of the sales respondents disagreed.
(Table 16.)
Table 16: The marketing division’s performance bonus should be linked to portfolio
performance
Question 4.1.2 Position
Total Sales Marketing
Yes 91,70% 100,00% 93,30%
No 8,30% 6,70%
Total 100,00% 100,00% 100,00%
(a) Budgets
(i) Sharing of the budget between the sales and marketing departments
The majority of sales respondents (58,3%) and marketing respondents (66,7%)
would prefer that sales and marketing divisions do not share a budget. The
remaining 41,7% of sales respondents and 33,3% of marketing respondents would
prefer the sales and marketing divisions to share a budget. (Table 17.)
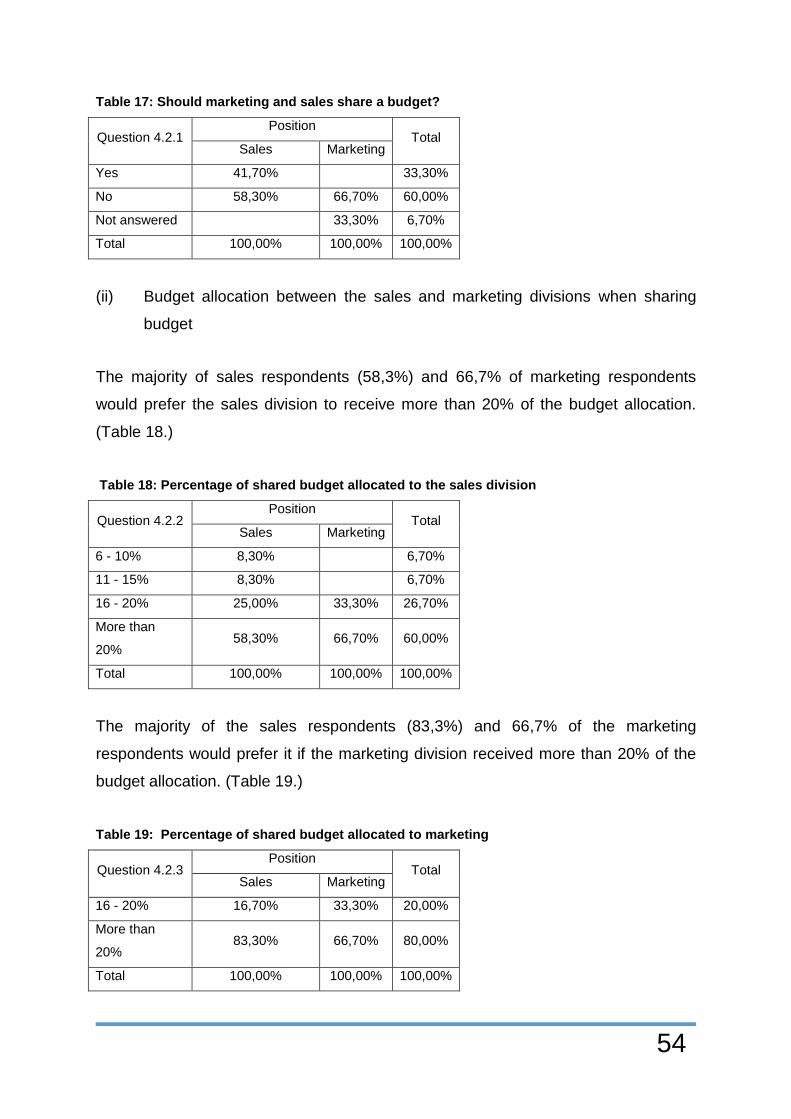
54
Table 17: Should marketing and sales share a budget?
Question 4.2.1 Position
Total Sales Marketing
Yes 41,70% 33,30%
No 58,30% 66,70% 60,00%
Not answered 33,30% 6,70%
Total 100,00% 100,00% 100,00%
(ii) Budget allocation between the sales and marketing divisions when sharing
budget
The majority of sales respondents (58,3%) and 66,7% of marketing respondents
would prefer the sales division to receive more than 20% of the budget allocation.
(Table 18.)
Table 18: Percentage of shared budget allocated to the sales division
Question 4.2.2 Position
Total Sales Marketing
6 - 10% 8,30% 6,70%
11 - 15% 8,30% 6,70%
16 - 20% 25,00% 33,30% 26,70%
More than
20% 58,30% 66,70% 60,00%
Total 100,00% 100,00% 100,00%
The majority of the sales respondents (83,3%) and 66,7% of the marketing
respondents would prefer it if the marketing division received more than 20% of the
budget allocation. (Table 19.)
Table 19: Percentage of shared budget allocated to marketing
Question 4.2.3 Position
Total Sales Marketing
16 - 20% 16,70% 33,30% 20,00%
More than
20% 83,30% 66,70% 80,00%
Total 100,00% 100,00% 100,00%
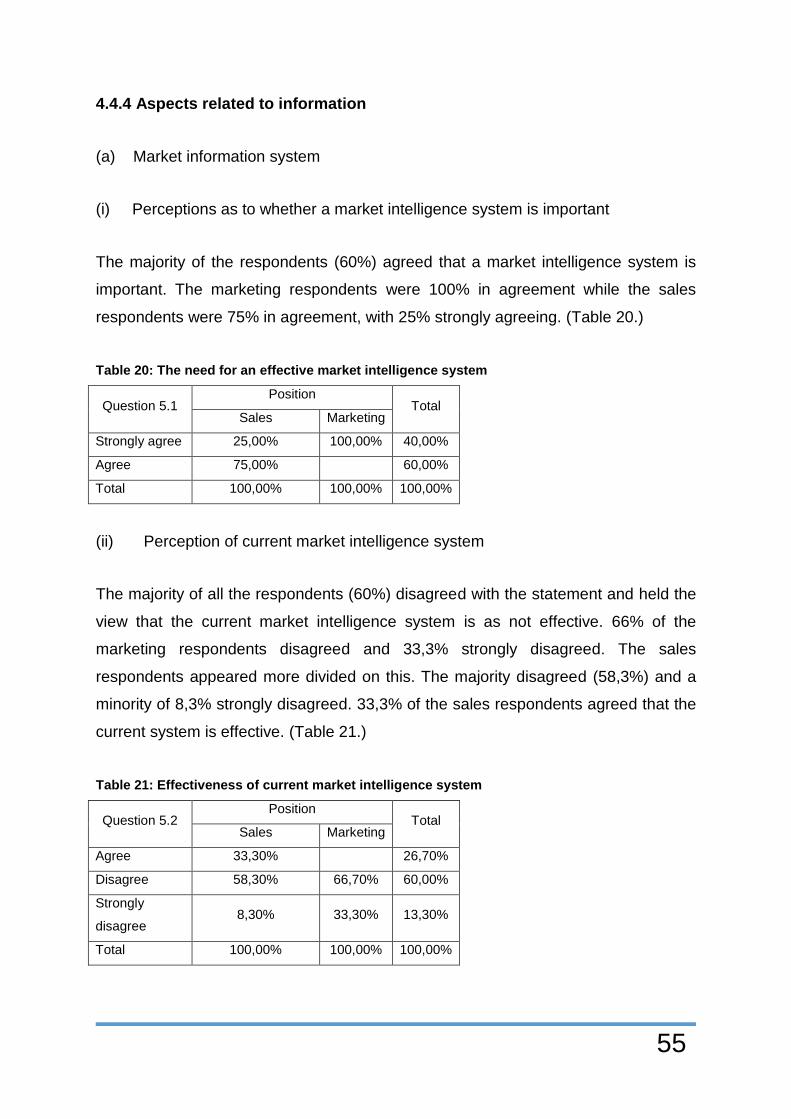
55
4.4.4 Aspects related to information
(a) Market information system
(i) Perceptions as to whether a market intelligence system is important
The majority of the respondents (60%) agreed that a market intelligence system is
important. The marketing respondents were 100% in agreement while the sales
respondents were 75% in agreement, with 25% strongly agreeing. (Table 20.)
Table 20: The need for an effective market intelligence system
Question 5.1 Position
Total Sales Marketing
Strongly agree 25,00% 100,00% 40,00%
Agree 75,00% 60,00%
Total 100,00% 100,00% 100,00%
(ii) Perception of current market intelligence system
The majority of all the respondents (60%) disagreed with the statement and held the
view that the current market intelligence system is as not effective. 66% of the
marketing respondents disagreed and 33,3% strongly disagreed. The sales
respondents appeared more divided on this. The majority disagreed (58,3%) and a
minority of 8,3% strongly disagreed. 33,3% of the sales respondents agreed that the
current system is effective. (Table 21.)
Table 21: Effectiveness of current market intelligence system
Question 5.2 Position
Total Sales Marketing
Agree 33,30% 26,70%
Disagree 58,30% 66,70% 60,00%
Strongly
disagree 8,30% 33,30% 13,30%
Total 100,00% 100,00% 100,00%

56
(b) Source and validity of market data
In terms of the validity of market information, the Chi-square test determines whether
or not the validity of information in the sales division is associated with that of the
marketing division. A p-value of less than 0,1 means that there is an association
between the two.
To conclude, for the validity of market information, the p-value is 0,685 which is
greater than 0,1. This means that the validity of information in the sales division is
not associated with that of the marketing division.
The results with regard to the sources of market information will now be discussed.
(i) Database information
The majority of all respondents (60%) viewed the purchasing of database information
as important. The majority (66,7%) of the marketing respondents strongly agreed,
while the remaining 33,3% agreed to the need. The majority (66,7%) of the sales
respondents also agreed and 16,7% strongly agreed. But there is 16,7% who
disagreed with the importance of database information (Table 22).
Table 22: The importance of purchasing database information
Question 5.3.1 Position
Total Sales Marketing
Strongly agree 16,70% 66,70% 26,70%
Agree 66,70% 33,30% 60,00%
Disagree 16,70% 13,30%
Total 100,00% 100,00% 100,00%
(ii) National tradeshow participation
The majority of the respondents agreed (60%). The majority (66,7%) of the
marketing respondents strongly agreed. (66,7%) of the sales respondents agreed,
whereas the remaining 33,3% strongly agreed (Table 23).

57
Table 23: The importance of presence at national tradeshows
Question 5.3.2 Position
Total Sales Marketing
Strongly agree 33,30% 66,70% 40,00%
Agree 66,70% 33,30% 60,00%
Total 100,00% 100,00% 100,00%
(iii) Product workshops
The majority of the respondents (53,3%) strongly agreed, while 100% of the
marketing respondents strongly agreed to the importance of product workshops.
58% of the sales respondents agreed and 41,7% strongly agreed with the statement
(Table 24).
Table 24: The importance of organising product workshops
Question 5.3.3 Position
Total Sales Marketing
Strongly agree 41,70% 100,00% 53,30%
Agree 58,30% 46,70%
Total 100,00% 100,00% 100,00%
(iv) Holding seminars for specialists
The majority of the respondents (53,3%) strongly agreed to the importance of
holding seminars for specialists. 66,7% of the marketing respondents strongly
agreed and 33,3% agreed. 50% of the sales respondents agreed and 50% strongly
agreed (Table 25).
Table 25: The importance of holding seminars for specialists
Question 5.3.4 Position
Total Sales Marketing
Strongly agree 50,00% 66,70% 53,30%
Agree 50,00% 33,30% 46,70%
Total 100,00% 100,00% 100,00%

58
(v) Talking with end users
The majority of the respondents (86,7%) strongly agreed to the importance of talking
to end users. All of the marketing respondents (100%) strongly agreed. The majority
of sales respondents (83,3%) strongly agreed and the remaining 16,7% agreed to
the importance thereof (Table 26).
Table 26: The importance of talking to end users
Question 5.3.5 Position
Total Sales Marketing
Strongly agree 83,30% 100,00% 86,70%
Agree 16,70% 13,30%
Total 100,00% 100,00% 100,00%
The qualitative data shows that the sales division holds a customer-centred
approach with the emphasis on growing and maintaining good customer
relationships by spending time with the customers in the field. As a result of this
customer-centred approach, the marketing division views the sales division as being
in the position to take note of the trends in the industry and giving through
information on the opportunities and potential corrective actions needed.
(c) Communicating market-related information
In communicating market-related information, the Chi-square test determines
whether or not the communication of information in the sales division is associated
with that of the marketing division. A p-value of less than 0,1 means that there is an
association between the two.
To conclude, in communicating market-related information, the p-value is 0,020
which is less than 0,1. This means that the communication of market-related
information in the sales division is associated with that of the marketing division.

59
(i) The marketing division makes recent market information available to sales
division
All of the marketing respondents agreed that they make marketing information
readily available to the sales division. The sales respondents differed, with the
majority (41,7%) disagreeing and 16,7% strongly disagreeing. Only 33,3% agreed
and a minority of 8,3% strongly agreed (Table 27). These findings were corroborated
by the results of the open-ended questions.
Table 27: Available recent market information by the marketing division to the sales division.
Question 5.5.1 Position
Total Sales Marketing
Strongly agree 8,30% 6,70%
Agree 33,30% 100,00% 46,70%
Disagree 41,70% 33,30%
Strongly
disagree 16,70% 13,30%
Total 100,00% 100,00% 100,00%
As seen in the qualitative data, the respondents from the sales division complained
about the absence of two-way communication regarding market information.
(ii) Available recent market information by the sales division to the marketing
division
66,7% of the marketing division agreed and 33,3% disagreed with the statement.
The sales respondents were divided on this issue. 41,7% agreed and 16,7% strongly
agreed that the sales division makes marketing information available to the
marketing division. But 41,7% of the sales respondents disagreed and therefore
believe that the sales division does not make market information available to the
marketing division (Table 28).

60
Table 28: Available recent market information by the sales division to the marketing division
Question 5.5.2 Position
Total Sales Marketing
Strongly agree 16,70% 13,30%
Agree 41,70% 66,70% 46,70%
Disagree 41,70% 33,30% 40,00%
Total 100,00% 100,00% 100,00%
(iii) Updated market information is available to all members of the sales and
marketing divisions
The majority (66,7%) of the sales respondents and the majority of marketing
respondents (67%) disagreed that market information is available to all. 16,7% of the
sales respondents and 33,3% of the marketing respondents agreed with the
statement (Table 29).
Table 29: Updated market information available to all members of the sales and marketing
divisions
Question 5.5.3 Position
Total Sales Marketing
Strongly agree 8,30% 6,70%
Agree 16,70% 33,30% 20,00%
Disagree 66,70% 66,70% 66,70%
Strongly
disagree 8,30% 6,70%
Total 100,00% 100,00% 100,00%
4.4.5 The involvement of the sales division in the marketing strategy process
(a) The involvement of the sales division in marketing strategy will increase
success
The majority of the respondents agreed that the marketing strategy will have an
increased success rate if the sales division is involved. More specifically, 66,7% of
the sales respondents and 33,3% of the marketing respondents agreed. The majority

61
of the marketing respondents (66,7%) and 27,3% of the sales respondents strongly
agreed with the statement. There was a minority (9,1%) of sales respondents who
strongly disagreed that the involvement of the sales division will increase the
success rate of the marketing strategy (Table 30).
Table 30: The involvement of the sales division in marketing strategy will increase success
Question 6.1 Position
Total Sales Marketing
Strongly agree 27,30% 66,70% 35,70%
Agree 63,60% 33,30% 57,10%
Strongly
disagree 9,10% 7,10%
Total 100,00% 100,00% 100,00%
(b) Implementation and execution phase
The majority of the respondents (40%) agreed that the sales division should only be
involved once the marketing strategy is ready for execution and implementation. The
majority of the sales respondents (50%) agreed with the statement and 33,3%
disagreed. A smaller minority (8,3%) of the respondents strongly agreed and the
remaining 8,3% strongly disagreed. The marketing respondents were equally divided
with 33,3% strongly agreeing, 33,3% disagreeing, and 33.3% strongly disagreeing
with the statement (Table 31).
Table 31: Sales only involved once marketing strategy is ready for implementation and
execution
Question 6.2 Position
Total Sales Marketing
Strongly agree 8,30% 33,30% 13,30%
Agree 50,00% 40,00%
Disagree 33,30% 33,30% 33,30%
Strongly
disagree 8,30% 33,30% 13,30%
Total 100,00% 100,00% 100,00%

62
(c) Development phase
Sixty per cent (60%) of all the respondents agreed that the sales division should be
involved in the development stage of the marketing strategy. The majority of the
marketing respondents (66,7%) agreed with the statement. A minority of sales
respondents (8,3%) disagrees. The majority of the sales respondents (66,7%) and
33,3% of the marketing respondents agreed (Table 32).
Table 32: Sales division input needed during the development phase of the marketing strategy
Question 6.3 Position
Total Sales Marketing
Strongly agree 25,00% 66,70% 33,30%
Agree 66,70% 33,30% 60,00%
Disagree 8,30% 6,70%
Total 100,00% 100,00% 100,00%
(d) The implementation phase of marketing strategy
The majority of the respondents (66,7%) agreed that the sales division‟s input is
needed during the implementation phase. More specifically, the majority (66,7%) of
the marketing respondents strongly agreed and the remaining 33,3% agreed. The
majority of the sales respondents (75%) agreed and the remaining 25% strongly
agreed (Table 33).
Table 33: Sales division input needed during the implementation phase of marketing strategy
Question 6.4 Position
Total Sales Marketing
Strongly agree 25,00% 66,70% 33,30%
Agree 75,00% 33,30% 66,70%
Total 100,00% 100,00% 100,00%

63
(e) The execution phase of marketing strategy
The majority of the respondents (66,7%) agreed that the sales division‟s input is
needed during the execution phase of the marketing strategy. The marketing
respondents strongly agreed (66,7%) while the remaining 33,3% agreed. The sales
respondents agreed (75%) and 16,7% strongly agreed. There is a minority of sales
respondents (8,3%) who disagreed (Table 34).
Table 34: Sales division’s input is needed during execution phase of marketing strategy
Question 6.5 Position
Total Sales Marketing
Strongly agree 16,70% 66,70% 26,70%
Agree 75,00% 33,30% 66,70%
Disagree 8,30% 6,70%
Total 100,00% 100,00% 100,00%
(f) The timing of sales and marketing activities
The majority of the respondents (73,3%) agreed that the timing of activities is
important for a successful marketing strategy. 66,7% of the marketers agreed and
33,3% strongly agreed. The sales division agreed (75%) and the remaining 25%
strongly agreed (Table 35).
Table 35: The timing of marketing and sales activities is important for a successful marketing
strategy
Question 6.6 Position
Total Sales Marketing
Strongly agree 25,00% 33,30% 26,70%
Agree 75,00% 66,70% 73,30%
Total 100,00% 100,00% 100,00%
The qualitative data provides more insight into the sales division‟s involvement in
marketing strategies.
64
Marketing respondents hold themselves responsible for market research and market
intelligence. They plan and write the marketing plan according to company focus
while developing marketing strategies. They view the sales division as a source of
information which they can access to assist them with their strategies. The sales
division assists by identifying potential customers and establishing the target market
while simultaneously providing valuable feedback. Marketing respondents view the
buy-in of the sales division as essential for the success of their marketing strategy
and would like to „move as one to execute their strategy‟ and collaborate with the
sales division to implement their marketing plan and strategies. Afterwards, the
marketing division will evaluate the results and adjust strategies where necessary.
Sales division respondents expressed the desire to work together with marketing on
marketing strategies. They would like to discuss and provide input with regard to the
marketing plan before implementation. They believe that this is crucial to their buy-in
of strategies. For example, they would like to provide input and to be consulted when
focus products are chosen, especially since some of the sales respondents do not
perceive all the members of the marketing division as having adequate knowledge
and insight into the South African market. The sales respondents do, however,
expect the marketing division to devise properly planned marketing plans in a
professional manner.
An example of conflict during a marketing strategy refers to product launches. The
sales respondents described how, during a new product launch, a brief overview and
positioning of product to sales force should be provided. The full launch pack should
include marketing and training materials, product samples with competitive
information, pricing details, etc. The launch should only be done once NAPPI codes
and negotiations with private hospital groups have been concluded; not before. The
sales respondents, however, commented that the available time that marketing has
to do proper product launches is short, but that they should rather wait until
everything is in place before launching products.

65
4.5 Steps toward increasing collaboration between the sales and marketing
divisions
The qualitative data from the three open-ended questions yielded data on more than
the known antecedents of collaboration. Respondents made suggestions with regard
to the ways in which they thought the collaboration could be improved between the
sales and marketing divisions in their specific organisation. These in-house
recommendations will be discussed in the next section.
4.5.1 Management attitudes towards coordination and collaboration
The marketing respondents would like management to endorse cooperation in all
departments with less division between management from sales and marketing
divisions. They also want consistent and clear communication to be reinforced by
management.
4.5.2 Shared frame of reference
Both the marketing and sales division respondents shared a desire for a joint frame
of reference. The marketing respondents would like to drive the company goal and
strategy together with the sales team by aligning their activities with the opportunities
uncovered by the sales division. This could be done by working more closely
together and acting as a unit to drive the same goal and message. But a marketing
member remarked that „[i]ndividuals may have their own goals and priorities, which
may hinder efforts and make carefully planned marketing efforts fail‟.
The sales division also shares the desire for a shared frame of reference. They
would like the sales and marketing divisions to work together to improve customer
satisfaction while working towards achieving the company strategy.

66
4.5.3 Communication
4.5.3.1 Communicating market-related information
In communicating market-related information, the chi-square test determines
whether or not the communication of information in the sales division is associated
with that of the marketing division. A p-value of less than 0,1 means that there is an
association between the two.
In conclusion, in communicating market-related information, the p-value is 0,020
which is less than 0,1. This means that the communication of market-related
information in the sales division is associated with that of the marketing division.
4.5.3.2 Interdepartmental communication
There is a need for an improved market intelligence system to facilitate
communication. The members of the sales division suggested that members should
work with one another to gain knowledge and receive advice from colleagues. The
lack of two-way communication was also apparent, with both the sales and
marketing divisions‟ respondents indicating a need for improved communication,
specifically with regard to market-related information between their divisions.
Recommendation: The members of the sales division suggested having a two-way
communication format in place where the marketing team discusses trends and new
therapies and the sales force communicates feedback from the end users. The
desire to „Keep an open channel of communication between sales and marketing‟
according to a sales division member is clear. In addition, members of the sales
division suggested implementing scheduled meetings that can act as a platform to
exchange market information and product-related information. This can also be used
to discuss issues of service improvement and communicating the long-term plan and
the bigger picture to the sales force. Marketing tools such as iPads or tablets would
make it easier to make all the relevant information on the extended range of products
available.

67
4.5.4 Transparent flow of information
There is an expectation by the sales division respondents that the marketing
department should keep salespeople up to date with the latest research and studies
on products. Marketers should assist the sales division with the correct information
on products being sold as well as on those which will be sold in the near future with
the necessary promotional ideas. A free flow of bi-directional information between
the sales and marketing divisions is therefore expected. However, it appears that
there is a perceived lack of feedback from the marketing division to the members of
the sales division. Members of the sales division commented on how the marketing
division asks for market information but neither gives adequate feedback nor
communicates the information to the rest of the organisation.
An example given by a member of the sales division relates to competitor pricing on
products given through to a product manager. Consequently, however, the
information was not communicated to the rest of the sales division by the product
manager. There appears to be a bottle neck of information at product managers.
In turn, the marketing respondents expect transparent reports from the sales division
on market-related information as well as on all sales activities related to their product
portfolios. The access to sales and marketing activities and reports by the sales and
marketing divisions can therefore be seen as necessary for collaboration.
Recommendation: Just as the marketing division has access to sales reports, so the
sales division would like to have access to marketing reports. This would foster a
better understanding of what the different divisions try to achieve and the obstacles
they encounter. In addition, this is an opportunity to share stories with regard to
successes and failures.
To facilitate the free flow of information, the sales respondents suggested a quick
online referencing system in which the latest product information and competitive
information is made available to all. This would be the specific product manager‟s

68
responsibility.
4.5.5 Interdepartmental consultation
The need for increased interdepartmental consultation was found in the qualitative
data. Marketing division respondents suggested scheduled, regular and frequent
meetings with the sales division to discuss marketing strategies, evaluate
developments in the market and recalculate the marketing plan. This was suggested
in order to promote two-way communication. The marketing division suggested that
these interdepartmental meetings take place over an eight week cycle, whereas the
sales respondents suggested meeting with the marketing department to exchange
ideas at least every three months.
Recommendation: The sales division respondents suggested that both divisions
should be involved in all processes with on-going consultation on overlapping
activities.
4.5.6 Sources of interdepartmental conflict
4.5.6.1 Status barriers
One member of the marketing division viewed the sales division as a sub-unit of
marketing and suggested that the sales division should follow the marketing goal. In
addition, the sales division should provide marketing with all market information and
competitive information as requested. A sales division respondent remarked that „the
opinions and ideas of the salespeople are not considered‟. In addition, other sales
division respondents requested that salespeople and marketers „listen to one
another‟. The sales division considers itself to be „keeping everything together‟.
4.5.6.2 The setting of sales targets
There is conflict with regard to the targets established with or without very little input
from individuals in the sales division. Product managers are perceived by the sales

69
division as pushing for unrealistic sales targets. What needs to kept in mind with the
setting of sales targets is that this particular organisation is a subsidiary of an
international company with centralised marketing activities and country-specific
revenue targets.
4.5.6.3 Forecasting
Provide forecasting that is as accurate as possible.
4.5.6.4 Inventory management and availability
The marketing division expects the sales division to assist with inventory levels and
indicated the need for accurate forecasting by the sales division. In turn, the sales
division expects the marketing division to make samples of new products available
well in advance of the product launch so that the sales force can familiarise
themselves with it. This relates back to a comment made by a sales division
respondent: „Make samples available in time; it is very frustrating if we are expected
to sell products but have no samples or stock!‟
Sales division respondents also expect the marketing division to ensure the
availability of focus products, products on tender and formulary, as well as existing
product lines. The product managers are viewed as being responsible for checking
the backorders on a daily basis, communicating alternative products, giving feedback
on why the item is on backorder and the next expected delivery date. Members of
the sales division expressed their frustration due to the unavailability or insufficient
stock of products pushed by product managers. Members of the sales division bring
in order numbers but the order cannot be fulfilled due to insufficient stock.
Recommendations: Members of the sales division suggested that a method to
ensure quick and accurate access to stock availability should be developed.
Accurate forecasting is needed for adequate inventory levels.

70
4.5.6.5 Marketing material viewed to be insufficient
Marketing respondents hold themselves accountable for providing the sales team
with the necessary tools regarding education, product knowledge and information, as
well as formulary status and tenders in place. The sales division promotes and
demonstrates products by means of in-service training to end users and, as such,
need relevant, detailed and up-to-date marketing and sales materials. These
materials should be relevant and effective for use by the sales force.
The expectation is that the marketing activities should be driven by the product
managers‟ portfolios by creating and providing advertising and promotional ideas to
improve the brand with sales pitch ideas and objection responses. In this way,
marketing could assist the sales division in a more congruent way.
Recommendation: The sales division suggested a drop box per product manager on
his or her portfolio products with all the relevant information on the products and
marketing materials related to it. It would be the responsibility of the product
manager to keep this electronic resource up to date.
4.5.6.5 The need for organisational learning and an improved market
intelligence system
The sales respondents want to know their products well and would like regular and
more in-depth training and retraining during the year. Similarly, marketers want to
organise more in-depth clinical training and provide opportunities for retraining the
sales team throughout the year to make them more effective. In addition, the sales
respondents would like marketers to be more involved in product workshops held in
the field by salespeople for the end users.
This need for organisational learning is highlighted in a comment by a sales
respondent: „Please provide proper in-service training, not just making the brochures
available…‟.

71
The marketing respondents themselves indicated that the sales tools provided by the
product managers to the sales force are insufficient and should be updated.
4.5.6.6 The need for a clear marketing strategy
The respondents from the sales division expect the marketing division to drive and
lead branding and other marketing activities. Product managers in the existing
structure are viewed as not being focussed on marketing activities. Several sales
respondents commented on the workload of the product managers not really
allowing sufficient time for more marketing activities. They did, however, state that an
increase in active marketing is needed.
Recommendation: The sales division respondents suggested the development of a
marketing subdivision under marketing dedicated to training and education. This
marketing subdivision can work closely together with training and research at
academic institutions. The aim is to infuse the company‟s brand with new
technologies and be in the know of the latest developments.
4.6 Summary
Overall, the respondents agreed that collaborating and coordinating their activities
would be to the advantage of the organisation. The majority strongly felt that the
current collaboration could and should be improved. What appears to be lacking is a
shared frame of reference and the ability to create and maintain a personal rapport
with one another based on appreciation of one another‟s work. Each division expects
the other to help them achieve their divisional objectives, but not one another‟s
objectives.
Despite the apparent conflict and insufficient collaboration, there was an underlying
wish by both sales and marketing respondents to collaborate in terms of shared
goals. This can be seen as a positive sign towards future collaborative
transformational strategies.

72
The respondents commented on the impact of the company‟s rapid expansion over
the last two years on them. Both marketing and sales respondents feel that there has
been a loss in focus with the extended range of products. The extended job
descriptions of the sales and marketing divisions lead to frustration and
miscommunication. Furthermore, the increased workload and insufficient increase in
head count allows less time to plan and communicate properly. They would like the
infrastructure and internal procedures of the organisation to keep up with the rapid
growth of the organisation.
73
CHAPTER 5
CONCLUSIONS AND RECOMMENDATIONS
5.1 THEORETICAL BACKGROUND
In any business selling a product or service, there is always conflict. Marketing is the
overall function whereas sales is only a part of marketing. The relationship between
the sales and marketing functions and/or departments is a source of organisational
conflict. A sub-optimal relationship will exhibit conflict, mutual stereotyping and non-
cooperation. Physical separation and different outlooks also contribute to a sub-
optimal interface (Malshe, 2010:13).
The challenge lies in creating a broader, shared frame of reference. This is needed
since an independent frame of reference can hinder cross-cultural integration. An
example of this is the political barriers, such as lack of leadership support in cross-
functional teams leading to failure (Beverland et al., 2006:388).
The transparent flow of information contributes to a sense of transparency and
promoting trustworthiness. By communicating activities across the interface, the
marketing division has the opportunity to highlight its knowledge of sales activities as
well as business savvy (Malshe, 2010:17).
This study identified the following collaborative drivers: management attitudes
towards coordination, communication, interdepartmental conflict, organisational
learning and market intelligence (Le Meunier-FitzHugh & Piercy, 2010:613).
5.2 RECOMMENDATIONS FROM LITERATURE
By implementing cross-functional processes and creating joint sales-marketing,
taskforces or group turf barriers can be reduced (Piercy, 2006). In addition, reducing
sales and marketing intergroup differentiation leads to improved collaboration (Le
Meunier-FitzHugh & Piercy, 2007:939).

74
The perceived status barriers need to be removed; sales need a strategic voice; and
structural issues, such as shared rewards need to be addressed. This will lead to
improved performance metrics such as shorter sales cycles, reduced market-entry
costs, and reduced cost of sales (Kotler, 2006:70).
Open and respectful communication between the sales and marketing divisions can
provide a basis for the clarification of misunderstandings and keep the other division
up to date with marketing initiatives. In addition, this can provide an opportunity for
feedback and asking for help when needed. This transparent flow of information
contributes to a sense of transparency, promoting trustworthiness. By
communicating activities across the interface, marketers have the opportunity to
highlight their knowledge of sales activities, as well as their business savvy (Malshe,
2010:17).
5.3 SUMMARY OF EMPIRICAL FINDINGS
5.3.1 Cultural aspects
5.3.1.1 The importance assigned to activities in the buying cycle
The activities with a p-value of less than 0,1 are competitive analysis, market
research, value proposition development, customer messaging and promotions. This
means that their importance is associated with their allocation to the sales and/or
marketing department.
Recommendation: To develop intra organisational guidelines on role allocation
activities during the buying cycle.
5.3.1.2 Role allocation of activities in buying cycle
There appears to be uncertainty regarding the role allocation of activities during the
buying cycle. The following activities were identified: product development, product

75
positioning, pricing, advertising, promotions, account management, after-sales
service, target marketing and sales forecasting.
Recommendation: To develop intra-organisational guidelines on role allocation
activities during the buying cycle to reduce uncertainty. Also identify shared activities
and assign responsibility to them.
5.3.1.3 The credibility of the sales and marketing divisions
The marketing department‟s expertise with regard to its understanding and insight
into the South African market is brought into question. This casts doubt on its ability
to develop marketing strategies for the South African market. There is also reduced
trust in the marketing division‟s ability to generate valid sales leads. Overall, the
credibility of the sales division is associated with that of the marketing division with
regard to the proximity factor or 'antecedent'.
Recommendation: To increase the frequency of co-travelling of the members of the
marketing and sales divisions. Another recommendation is to schedule regular
meetings between sales and marketing divisions to foster a two-way, open and
honest communication channel. Furthermore, opportunities for the members of the
marketing and sales divisions to undergo further studies in their fields of expertise
should be provided.
5.3.1.4 Information aspects
The current marketing intelligence system is viewed as being less than effective by
the majority of all the respondents.
Recommendation: To investigate alternative market intelligence systems to promote
easy access to all within the sales organisation.
The ability of the sales division to gather market information and act as a source of
valid market information is viewed by the majority of respondents as being valid.

76
There is a minority of marketing respondents (33,3%), however, who cast this in
doubt. At the same time, the ability of the marketing division to gather valid market
information is also doubted by a minority of sales respondents (cf. Table 11).
Recommendation: To investigate and establish what constitutes valid market
information for members of the sales division and for members of the marketing
division in particular. There could be a difference in expectations regarding the type
of information and its sources.
5.3.1.5 Sales divisions involvement in the marketing strategy
Although the majority of the respondents agreed that the sales division should be
involved in the marketing strategy, there was no consensus as to when, how or how
often and to what degree they should be involved. The strategy-making,
implementation and execution phases were indicated for the involvement of the
sales division to a lesser or greater degree.
Recommendation: To conduct an intra-organisational survey and consult senior
sales and marketing individuals to determine the sales division‟s contributions
needed during the marketing strategy to facilitate a successful marketing strategy.
5.3.1.6 Other factors identified as being important for collaboration
There is a definite need for clear and transparent two-way communication between
the sales and marketing divisions. In addition, more regular, scheduled meetings
between the sales and marketing divisions are needed where the quality of the
exchange is more important than the quantity or duration of the meetings. These will
help foster a sense of collaboration within the organisation.

77
5.4 Recommendations for achieving greater collaboration between the sales
and marketing divisions
The change should be driven by senior management since a positive senior
management attitude towards collaboration leads to reduced inter-functional conflict.
A culture of organisational learning and open information sharing should be
encouraged. Improvement in communication between the sales and marketing
divisions is also needed. Regular scheduled meetings between sales and marketing
divisions should be organised to foster relationship building across divisions and
create a platform for information sharing and contributions. The ability to create and
maintain a personal rapport with one another based on appreciation of one another‟s
work will also benefit from increased contact between members of the sales and
marketing divisions.
The current market intelligence system should be reviewed in detail and an
alternative, effective market intelligence system should be implemented to provide
quick and accurate access to market information to all parties concerned.
5.5 LIMITATIONS OF THE STUDY
This study was conducted on a single organisation and on a small sample group of
sales and marketing individuals. Thus, the results cannot be generalised. It is
recommended that a larger study should be conducted on more than one sales
organisation in South Africa with positions differentiating from sales and product
managers up to management. The questionnaire section on economical antecedents
could be adjusted to be more specific.

78
REFERENCES
Atteya. N. M. 2012. The Conflict Management Grid: A Selection and Development
Tool to Resolve the Conflict between the Marketing and Sales Organizations.
International Journal of Business and Management, 7(13):28.
Auh. S. & Menguc. B. 2013. Knowledge sharing behaviours of industrial salespeople:
an integration of economic, social psychological, and sociological
perspectives. European journal of marketing, 47(8):1333-1355.
Baye, M. R. 2010. Managerial Economics and Business Strategy. Boston: McGraw-
Hill Publishing.
Beverland, M., Steel, M. & Dapiran. G.P. 2006. Cultural frames that drive sales and
marketing apart: an exploratory study. Journal of Business and Industrial
Marketing, 21(6):386-394.
Biemans, W.G., Brencic, M.M. & Malshe, A. 2010. Marketing-sales interface
configurations in B2B firms. Industrial Marketing Management, 39:183-194.
Blocker, C.P., Cannon, J.P., Panagopoulos, N.G. & Sager, J.K. 2012. The role of the
sales force in value creation and appropriation: new directions for research.
Journal of Personal selling and Sales Management, 32:15-28.
Cooper, R.C. & Schindler, P.S. 2011. Business Research Methods. Boston: McGraw
Hill Publishing.
Creswell, J.W. 2014. A concise introduction to mixed methods research. Los
Angeles: SAGE Publication.
Creswell, J.W. 2014. Research design: qualitative, quantitative, and mixed methods
approach. Los Angeles: SAGE Publication.
Dawes. P. & Massey. G.R. 2006. A study of relationship effectiveness between
marketing and sales managers in business markets. Journal of Business and
Industrial marketing, 21(6):346-360.

79
Dalvi. M.R. & Ebrahimi. H. 2013. Investigating the Effects of Reward on the
Cooperation in the Sale and Marketing Department from Managers'
Perspective (Isfahan Food Industries Case Study). International Journal of
Academic Research in Business and Social Sciences, 3(11):144-153.
Goetz. O., Hoelter.A .A. & Krafft. M. 2013. The role of sales and marketing in market-
orientated companies. Journal of personal selling and sales management,
33(4):353-371.
Green, K.W., Whitten, D. & Inman, R.A. 2012. Aligning marketing strategies
throughout the supply chain to enhance performance. Industrial Marketing
Management, 42(6):1008.
Guenzi, P. & Trolo, G. 2006. Developing marketing capabilities for customer value
creation through marketing-sales integration. Industrial Marketing
Management, 35(8):974-988.
Guidelines for assessing quality of multi method research. Available from:
www.sagepub.com/journals/Journal201775#tabview=manuscriptSubmission
Homburg, C., Jensen, O. & Krohmer, H. 2008. Configurations of marketing and
sales: taxonomy. Journal of marketing, 72(2):133-154.
Homburg. C. & Jensen. O. 2007. The Thought Worlds of Marketing and Sales:
Which Differences Make a Difference? The Journal of Marketing, 71(3):124-
142.
Hughes. D. E., Le Bon. J. & Malshe. A. 2013. The marketing-sales interface at the
interface: creating market-based capabilities through organisational synergy.
Journal of personal selling and sales management, 32(1):57-72.
Hulland, J., Nenkov, G.Y. & Barclay, D.W. 2012. Perceived marketing–sales
relationship effectiveness: a matter of justice. Journal of the Academy of
Marketing Science, 40(3):450-467.

80
International journal of multiple research approaches.
http://obssr.od.nih.gov/mixed_methods_research
Ivankova, N.V., Creswell, J.W. & Stick, S.L. 2006. Using mixed methods sequential
explanatory design: from theory to practice. Field methods, 18(3-20).
Jones, E., Brown, S.P., Zoltners, A.A. & Weitz, B.A. 2005. The changing
environment of selling and sales management. Journal of Personal Selling
and Sales Management, 25(2):105-111.
Kitching, K. 2013. Economics for Managers, MMB711. Business school: University of
the Free State, South Africa
Kotler, P., Rackham, N. & Krishnaswamy, S. 2006. Ending the war between sales
and marketing. Harvard Business Review, 84(7-8):68-78.
Kotler, P. & Achrol, R.S. 2012, "Frontiers of the marketing paradigm in the third
millennium", Journal of the Academy of Marketing Science, 40(1): 35-52.
LaForge, R. W., Ingram, T. N. & Cravens, F. W. 2009. Strategic alignment for sales
organisation transformation. Journal of Strategic Marketing, 17(3-4):199-219.
Lane. N. & Le Meunier-FitzHugh. K. 2009. Collaboration between sales and
marketing, market orientation and business performance in business-to-
business organisations. Journal of strategic marketing, 17(3/4):291-306.
Le Bon, J. & Merunka, D. 2006. The impact of individual and managerial factors on
salespeople's contribution to marketing intelligence activities. International
Journal of Research in Marketing, 23(4):395-408.
Le Meunier-FitzHugh. K. & Piercy. N. F. 2007. Exploring collaboration between sales
and marketing. European Journal of Marketing, 41(7/8):939-955.
Le Meunier-FitzHugh, K. & Piercy, N.F. 2007. Does collaboration between sales and
marketing affect business performance? Journal of Personal Selling and
Sales Management, 27(3):207-220.

81
Le Meunier-FitzHugh, K. & Piercy, N.F. 2008/2009. The importance of organisational
structure for collaboration between sales and marketing. Journal of General
Management, 34(1):19-36.
Le Meunier-FitzHugh. K. & Piercy. N. F. 2010. Drivers of sales and marketing
collaboration in business-to-business selling organisation. Journal of
Marketing Management, 25(5-6):611-633.
Le Meunier-FitzHugh. & Piercy. N.F. 2011. Exploring the relationship between
market-orientation and sales and marketing collaboration. Journal of personal
selling and sales management, 31(3):287-296.
Le Meunier-FitzHugh. K. & Massey. G. R. 2011. The impact of aligned rewards and
senior management attitudes on conflict and collaboration between sales and
marketing. Industrial Marketing Management, 40:1161-1171.
Liu, S.S. & Comer, L.B. 2007. Salespeople as information gatherers: associated
success factors. Industrial Marketing Management 36(5):565-574.
Lyus, D., Rogers, B. & Simms, C. 2011. The role of sales and marketing integration
in improving strategic responsiveness to market change. Journal of Database
Marketing and Customer Strategy Management, 18:39-49.
Malshe, A. 2011. An exploration of key connections within sales-marketing interface.
Journal of Business and Industrial Marketing, 26(1):45-57.
Malshe, A. 2010. How is marketers' credibility construed within the sales-marketing
interface? Journal of business research, 63(1):13-19.
Malshe. A. 2009. Strategic sales organizations: transformation challenges and
facilitators within the sales-marketing interface. Journal of strategic marketing,
17(¾):271-289.
Malshe, A. & Sohi, R.S. 2009. Sales Buy-In of Marketing Strategies: Exploration of
its Nuances, Antecedents, and Contextual Conditions. Journal of Personal
Selling and Sales Management, 29(3):207-226.
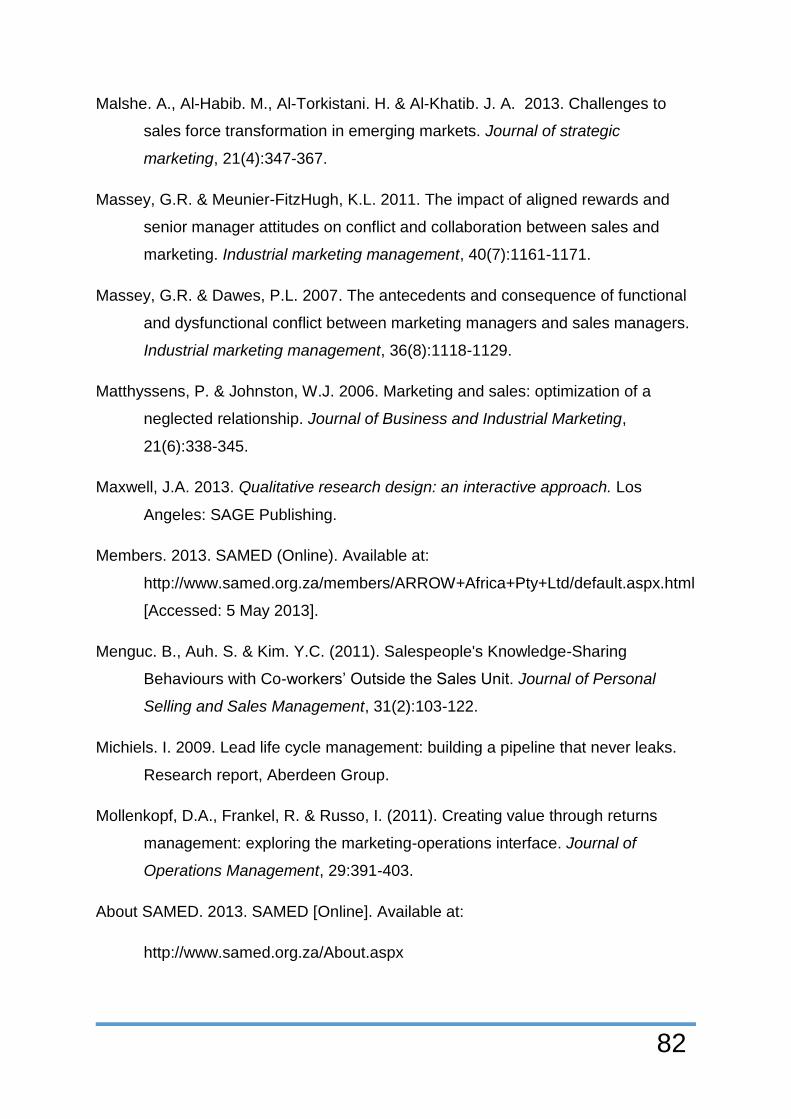
82
Malshe. A., Al-Habib. M., Al-Torkistani. H. & Al-Khatib. J. A. 2013. Challenges to
sales force transformation in emerging markets. Journal of strategic
marketing, 21(4):347-367.
Massey, G.R. & Meunier-FitzHugh, K.L. 2011. The impact of aligned rewards and
senior manager attitudes on conflict and collaboration between sales and
marketing. Industrial marketing management, 40(7):1161-1171.
Massey, G.R. & Dawes, P.L. 2007. The antecedents and consequence of functional
and dysfunctional conflict between marketing managers and sales managers.
Industrial marketing management, 36(8):1118-1129.
Matthyssens, P. & Johnston, W.J. 2006. Marketing and sales: optimization of a
neglected relationship. Journal of Business and Industrial Marketing,
21(6):338-345.
Maxwell, J.A. 2013. Qualitative research design: an interactive approach. Los
Angeles: SAGE Publishing.
Members. 2013. SAMED (Online). Available at:
http://www.samed.org.za/members/ARROW+Africa+Pty+Ltd/default.aspx.html
[Accessed: 5 May 2013].
Menguc. B., Auh. S. & Kim. Y.C. (2011). Salespeople's Knowledge-Sharing
Behaviours with Co-workers‟ Outside the Sales Unit. Journal of Personal
Selling and Sales Management, 31(2):103-122.
Michiels. I. 2009. Lead life cycle management: building a pipeline that never leaks.
Research report, Aberdeen Group.
Mollenkopf, D.A., Frankel, R. & Russo, I. (2011). Creating value through returns
management: exploring the marketing-operations interface. Journal of
Operations Management, 29:391-403.
About SAMED. 2013. SAMED [Online]. Available at:
http://www.samed.org.za/About.aspx

83
(Accessed: 5 May 2013).
Piercy, N. (2010). Evolution of strategic sales organisations in business-to-business
marketing. Journal of Business and Industrial Marketing, 25(5):349-359.
Piercy, N. 2010, "Improving marketing: operations cross-functional relationships",
Journal of strategic marketing, (18)4:337-356.
Piercy, N. 2007, "Framing the problematic relationship between the marketing and
operations functions", Journal of strategic marketing, (15)2/3:185-207.
Piercy, N.F. & Le Meunier-FitzHugh, K. 2008, "The importance of organisational
structure for collaboration between sales and marketing", Journal of general
management, (34)1:19-35.
Plano Clark, V.L., Garrett, A.L. & Lesley-Pelecky 2009. Applying three strategies for
integrating quantitative and qualitative databases.
Representing the SA Medical Device Industry. (2013). (Online). Available:
http://www.samed.org.za/default.aspx.html [Accessed: 5 May 2013].
Rollins, M., Bellenger, D.N. & Johnston, W.J. (2012). Does customer information
usage improve a firm‟s performance in business-to-business markets?
Industrial Marketing Management, 41(6):984-994.
Rouzies, D., Anderson, E., Kohli, A.J., Michaels, R.E., Wetz, B.A. & Zoltners, A.A.
(2005). Sales and marketing integration: a proposed framework. Journal of
Personal Selling and Sales management, 25(2):113-122.
Sabnis, G., Chatterjee, S. C., Grewal, R. & Lilien, G. (2013). The sales lead black
hole: on sales reps‟ follow-up of marketing leads. Journal of marketing, 7:52-
67.
Sohi, R.S. & Malshe, A. 2009, "What makes strategy making across the sales-
marketing interface more successful?", Journal of the Academy of Marketing
Science, 37(4):400-421.

84
Storbacka. K., Ryals. L., Davies. I. A. & Nenonen. S. (2009). The changing role of
sales: viewing sales as a strategic, cross-functional process. Bradford:
Emerald Group Publishing, Ltd.
Tang, C.S. (2010). A review of marketing–operations interface models: From co-
existence to coordination and collaboration. International Journal of
Production Economics, 125(1):22-40.
Troilo, G., De Luca, L.M. & Guenzi, P. (2009). Dispersion of influence between
marketing and sales: its effects on superior customer value and market
performance. Industrial Marketing Management, 38(8):872-882.
Troilo. G. & Luca. L.M. (2009). Dispersion of influence between marketing and sales:
its effects on superior customer value and market performance. Industrial
marketing management, 38(8):872-882.
Taskakhori, A. & Teddlie. C. 2010. SAGE handbook of mixed methods in social and
behavioural research.
Webster, F.E. & Lusch, R.F. (2013). Elevating marketing: marketing is dead! Long
live marketing. Journal of the Academy of Marketing Science, 41(4):389-399.
Welcome to Teleflex. 2013. (Online). Available:
http://www.teleflex.com/en/index.html [Accessed: 5 May 2013].
West, D., Ford, J. & Ibrahim, E. 2010. Strategic Marketing: creating competitive
advantage. Oxford: Oxford University Press.
Yu, A.S.O. & Figueiredo, P.S. (2010).Development resource planning: complexity of
product development and the capacity to launch new products. The journal of
product innovation management, 27(2):253-266.
Zoltners. A (2004). Sales and Marketing Interface. Paper presented at the Sales
Force Summit, University of Houston, Texas. Journal of mixed method
research. Available from http://mmrsagepub.com
85
ADDENDA
QUESTIONNAIRE COVER LETTER
QUESTIONNAIRE
COLLABORATION BETWEEN SALES AND MARKETING DIVISIONS
Dear Colleagues
This questionnaire is designed to investigate the possible factors that have an
influence on collaboration between the sales and marketing divisions within a sales
organisation.
Your feedback will assist me in identifying the specific factors that have an impact on
your particular organisation. This, in turn, may be used to make recommendations
towards increasing your collaborative practices.
Therefore you are kindly requested to complete this questionnaire honestly and to
the best of your ability.
Please complete this questionnaire anonymously and your confidentiality will be
assured.
Kind regards
Linda Veale

86
QUESTIONNAIRE
Dear Colleagues
This questionnaire is designed to investigate the possible factors that have an
influence on collaboration between the sales and marketing divisions within a sales
organisation.
Your feedback will assist me in identifying the specific factors that have an impact on
your particular organisation. This in turn may be used to make recommendations
towards increasing your collaborative practices.
Therefore you are kindly requested to complete this questionnaire honestly and to
the best of your ability.
Please complete this questionnaire anonymously and your confidentiality will be
assured.
Kind regards
Linda Veale

87
1. Biographical details
Please mark the appropriate block with an X
1.1 What is your gender?
Male
Female
1.2 In which age category do you fall?
Less than 30 years old
31-40 years
41-50 years
51 and older
1.3 In which position are you are currently employed?
Sales management
Marketing management
Product manager
Product specialist
Territory manager
1.4 How many years have you been in your current position?
Less than 2 years
2-5 years
6-10 years
More than 10 years
1.5 Please indicate your highest educational level
Matric or Grade 12
Diploma
Undergraduate Degree
Post graduate Degree
Master degree

88
2. Introductory questions
2.1 The existence of a collaborative relationship between sales and marketing divisions is to the advantage of the sales organisation
Strongly agree Agree Disagree Strongly disagree
2.1 It is important for sales and marketing divisions to coordinate and collaborate their activities
Strongly agree Agree Disagree Strongly disagree
2.3 How do you think the collaboration between sales and marketing
can be improved in your organisation?
Please discuss in the space provided below

89
3. Cultural aspects
Please select the importance you attach to each activity 3.1 The importance of sales and marketing activities during the buying cycle
Activity Not
important Less
important Important
Very important
Competitive analysis
1 2 3 4
Market research 1 2 3 4
Market segmentation
1 2 3 4
Product development
1 2 3 4
Product positioning
1 2 3 4
Pricing 1 2 3 4
Packaging 1 2 3 4
Advertising 1 2 3 4
Competitive market intelligence
1 2 3 4
Personal selling 1 2 3 4
Distributor management
1 2 3 4
Account management
1 2 3 4
After-sales service
1 2 3 4
Target marketing 1 2 3 4
Sales forecasting 1 2 3 4
Value proposition development
1 2 3 4
Customer messaging
1 2 3 4
Promotions 1 2 3 4

90
3.2. The marketing division has a more important role than the sales force in increasing market share and sales turnover
Strongly agree Agree Disagree Strongly disagree
3.3 The sales division has a more important role than the marketing department in increasing market share and sales turnover
Strongly agree Agree Disagree Strongly disagree
3.4 What do you think is the Marketing divisions role in the sales organisation?
3.5 What do you think is the Sales division’s role in the sales organisation?

91
3.6 Allocation of activities during the buying cycle
Activity Marketing
activity Sales activity
Marketing and sales activity
Competitive analysis
Market research
Market segmentation
Product development
Product positioning
Pricing
Packaging
Advertising
Competitive market intelligence
Personal selling
Distributor management
Account management
Merchandising
After-sales service
Target marketing
Sales forecasting
Value proposition development
Customer messaging
Promotions

92
3.7 Marketing divisions credibility
Expertise
3.7.1 Marketing's proposed strategy always has merit and is appropriate to the South African market
Strongly agree Agree Disagree Strongly disagree
3.7.2 All the he product managers have a good understanding of the South African market place
Strongly agree Agree Disagree Strongly disagree
Trustworthiness
3.7.3 The marketing division generate valid sales leads
Strongly agree Agree Disagree Strongly disagree
3.7.4 All the product managers have a good understanding of the South African market place
Strongly agree Agree Disagree Strongly disagree
Proximity
3.7.5 The co-travelling of Product Managers with the Sales force is a method that enhance collaboration
Strongly agree Agree Disagree Strongly disagree

93
3.8 Sales divisions credibility
Expertise
3.8.1 The sales division members has the necessary knowledge and experience to assist in marketing strategies
Strongly agree Agree Disagree Strongly disagree
Trustworthiness
3.8.2 The sales division members can be trusted to follow up on marketing leads
Strongly agree Agree Disagree Strongly disagree
Proximity
3.8.3 The attendance of training held by Product Managers by sales division members is a method that enhances collaboration
Strongly agree Agree Disagree Strongly disagree
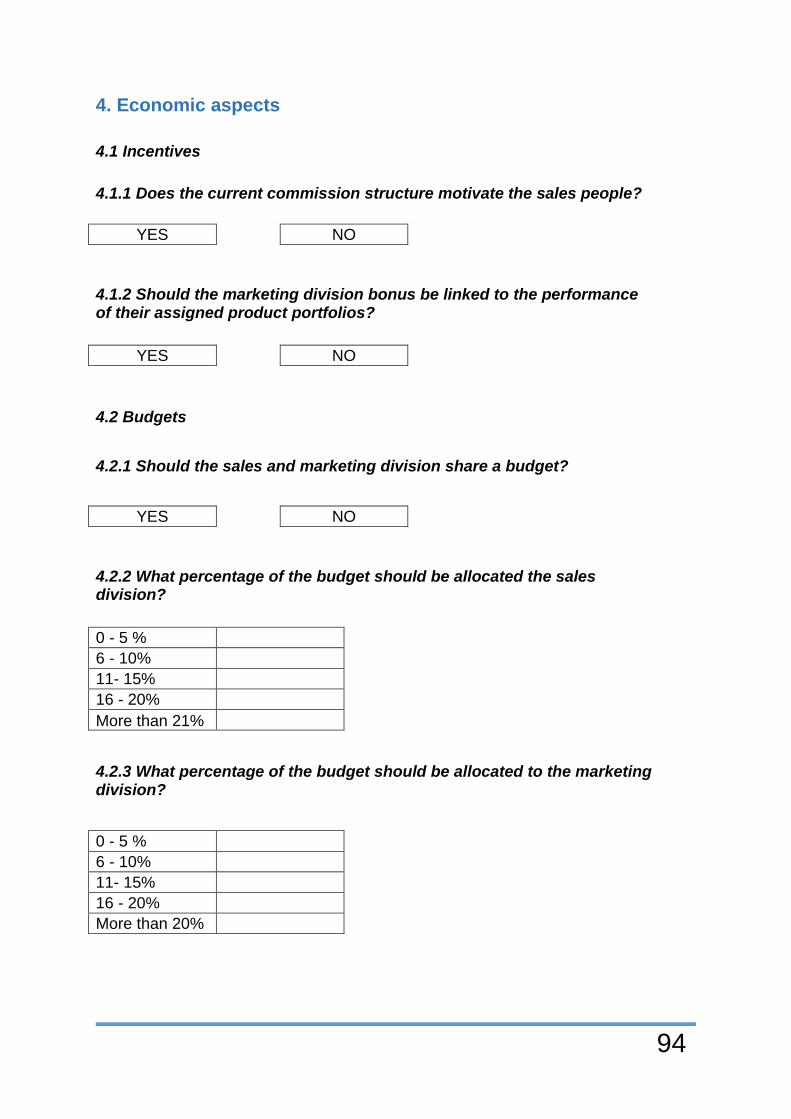
94
4. Economic aspects
4.1 Incentives
4.1.1 Does the current commission structure motivate the sales people?
YES
NO
4.1.2 Should the marketing division bonus be linked to the performance of their assigned product portfolios?
YES
NO
4.2 Budgets
4.2.1 Should the sales and marketing division share a budget?
YES
NO
4.2.2 What percentage of the budget should be allocated the sales division?
0 - 5 %
6 - 10%
11- 15%
16 - 20%
More than 21%
4.2.3 What percentage of the budget should be allocated to the marketing division?
0 - 5 %
6 - 10%
11- 15%
16 - 20%
More than 20%

95
5. Information aspects
5.1 An effective market intelligence system for gathering and communicating market related information is needed
Strongly agree Agree Disagree Strongly disagree
5.2 The current market intelligence system is effective
Strongly agree Agree Disagree Strongly disagree
5.3 Source of market information
5.3.1 Purchasing data base information is important
Strongly agree Agree Disagree Strongly disagree
5.3.2 The presence of the organisation at national trade shows is important
Strongly agree Agree Disagree Strongly disagree
5.3.3 Organising product workshops is important
Strongly agree Agree Disagree Strongly disagree
5.3.4 Holding product seminars for specialists is important
Strongly agree Agree Disagree Strongly disagree
5.3.5 Talking to the end users of products is important
Strongly agree Agree Disagree Strongly disagree

96
5.4 Validity of market information
5.4.1 The members of the sales force are able to gather valid market information
Strongly agree Agree Disagree Strongly disagree
5.4.2 The members of the marketing divisions are able to gather valid market information
Strongly agree Agree Disagree Strongly disagree
5.5 Communicating market related information
5.5.1 Members of the marketing divisions make recent market information readily available to the sales division
Strongly agree Agree Disagree Strongly disagree
5.5.2 The sales division make recent market information readily available to the marketing division
Strongly agree Agree Disagree Strongly disagree
5.5.3 Updated market information is available for all members of the sales and marketing divisions
Strongly agree Agree Disagree Strongly disagree

97
6. Sales division involvement in marketing strategy process aspect
6.1 The involvement of the sales division in the marketing strategy process will increase the chance of a successful marketing strategy
Strongly agree Agree Disagree Strongly disagree
6.2 The marketing division should communicate the marketing plan to the sales division only once it is ready for implementation and execution
Strongly agree Agree Disagree Strongly disagree
6.3 The input of the sales force is needed during the development phase of the marketing strategy
Strongly agree Agree Disagree Strongly disagree
6.4 The input of the sales force is needed during the implementation phase of the marketing strategy process
Strongly agree Agree Disagree Strongly disagree
6.5 The input of the sales force is needed during the execution phase of the marketing strategy process
Strongly agree Agree Disagree Strongly disagree
6.6 Timing of marketing and sales activities during a marketing strategy is important for a successful marketing strategy
Strongly agree Agree Disagree Strongly disagree
Thank you!