Embed Size (px)
Citation preview

Investment and Collaboration Opportunities between India and EU
Iris Herrmann, Partner, Strategy&
IndiaChem 2021
March 19, 2021

Strategy&
2020 lead to dramatic GDP drops, especially in India – 2021 and 2022 pave the way for economic recovery
1) AT, DE, FR, IT, NL, PG, GR, SP
Source: Economist Intelligence Unit (Base scenario); Strategy& analysis
Sources (excerpt)
2
AS OF FEB. 16th, 2021
Further Parameters: Unemployment rate, Consumer Price Index, USD Exchange Rate, Long-Term Bond Yields, National Stock Index, Oil Price, Gold Price
Actual Base (no COVID-19)
2020 2021 20232022
Scenario evaluation (GDP focus) - our synthesis of market views
China
GDP Growth (%)
EU1)
GDP Growth (%) -6.8
GDP Growth (%) -1.8
KSA
UK
GDP Growth (%) -9.8
India
GDP Growth (%) -10.2
GDP Growth (%) -6.3
USA
GDP Growth (%) -5.0
Germany
1.3
1.8
1.5
7.3
1.8
1.6
5.4
1.2
2.0
1.9
6.9
1.6
1.5
6.2
1.3
1.7
1.8
7.3
1.9
1.6
5.5
Effective vaccine
2021 20232022
3.9 2.15.0
3.2 1.03.5
4.3 2.35.0
7.2 4.18.3
4.5 2.14.7
4.0 3.14.2
7.4 4.98.3
Mutations and measures
2021 20232022
2.5 1.13.6
2.1 0.82.4
3.6 2.04.1
6.5 2.47.1
3.0 1.53.9
2.0 1.92.8
5.5 1.96.02.3

Strategy&
Pre-COVID output levels of over 4/5 of industries likely to be restored in India by 2023Impact on industries (Gross Value Added %)
Industry
[%]
Impact
Germany
Growth of Gross Value Added
1) Comparison of YE 2019 to YE 20223 GVA (in %); 2) Based on 2020 GDP growth rate
Source: Strategy& analysis, IHS Markit
India
3
GVA from 2021 to 2023 in Scenario I – Effective vaccine 2023 YE1)
Hospitality & Leisure
Utilities
Aerospace & Defense
Freight transportation
Cons. goods & retail (food)
Agriculture
Industrial manufacturing
Pharma & life sciences
Financial services
Services
Automotive
Telecommunications
Healthcare
Technology & software
Entertainment & media
Cons. goods & retail (non-food)
Real Estate
7.3
5.8
2.0
7.1
4.8
8.2
6.5
6.7
9.2
8.0
8.8
8.1
7.3
6.8
8.1
8.1
7.3
VERY NEGATIVE
NEGATIVE
VERY NEGATIVE
POSITIVE
SLIGHTLY NEGATIVE
VERY NEGATIVE
NEGATIVE
NEGATIVE
NEGATIVE
NEGATIVE
VERY NEGATIVE
POSITIVE
NEUTRAL
NEUTRAL
NEGATIVE
VERY NEGATIVE
SLIGHTLY NEGATIVE
-2.7
2.7
-2.8
37.8
26.2
-8.9
2.4
11.1
5.1
11.1
2.4
38.1
36.0
8.4
6.3
3.4
12.8
Base Case
2021 w/o crisis
4.8
6.1
5.7
2.0
8.0
6.6
7.2
6.4
7.0
7.2
9.2
7.9
8.8
8.0
6.7
8.1
7.2
7.0
7.2
1.9
8.8
8.2
8.3
5.9
7.7
6.2
9.5
9.2
9.1
8.8
8.8
7.8
9.1
8.0
4.7
3.0
1.9
6.5
4.2
4.5
3.1
2.7
5.9
3.8
4.0
5.9
3.1
6.9
2.6
3.7
7.9
-18.2
-19.2
14.3
2.3
-11.4
-12.0
-4.6
-11.6
12.5
-15.9
-0.6
-9.8
-23.9
-14.2
-9.7
8.0
-14.9
2021 2022 20232020
AS OF FEB. 16th, 2021

Strategy&
Growth is expected to remain strong going forward across the entire chemicals value chainIndian Chemical Industry Outlook
Investment and Collaboration
Opportunities between India and EUSource: IHS Connect, PwC Strategy&
March 18, 2021
4
41 (31%)
67 (36%)
49 (26%)
38 (29%)
51 (39%)
2014
72 (38%)
Specialty Chemicals &
Agrochemicals
2019
73 (24%)
143 (46%)
93 (30%)
2025
309
Pharmaceuticals &
Biotech
Basic &
Petrochemicals
129
188
+8%
+9% CAGR
2014-19 2019-25
4.0% 7.2%
13.6% 12.2%
5.8% 5.4%
Indian Chemical Industry 2014-2025Turnover (bn USD), % share of segments
• Indian chemical industry, as well as key
segments relevant for chemicals, delivered
steady growth and are expected to continue
growing (post-COVID) long-term
Investment and growth opportunities
• Today’s trade deficit in chemicals calls for
investments into self-sufficiency in
petrochemical intermediates
• Accelerate building at scale production plants,
e.g. forming strategic partnerships with local
refineries to secure feedstock
• Ramping up exports of specialty chemicals to
increase India’s global share of value
• Partner with major chemical MNCs or technology
licensors for access to technology
• Enhance capabilities to offer tailored product
applications and solutions, such as
compounding (partnering, M&A)
Investment and growth opportunities

Strategy&
Global chemical industry trends translate into opportunities for India Global Chemicals Trends Opportunities for India
Investment and Collaboration
Opportunities between India and EUMarch 18, 2021
5
Accelerating commoditization
Consolidation for greater scale, portfolio prioritization downstream
Deglobalization
Trade conflicts cause uncertainty and shift in global supply chains
Sustainability
ESG impact becomes management imperative, stricter regulations
Digitization
Technology as lever for efficiency and productivity
Shift of economic power
Emerging players drive consolidation and strive for self-sufficiency
O&G players exploring petrochemicals and downstream opportunities; ease
feedstock challenges, achieve scale to fortify competitiveness
Supplement chemicals supply for downstream players reducing dependence
from China, offering an accessible market
Sourcing from China under scrutiny following disruptions due to stricter EHS
norms; opening chances for Indian players in certain segments short-term
Expand profit margins through enhancing digital and analytics capabilities,
access to young and skilled workforce
Benefit from rising domestic demand in chemical end-use sectors and
improved ease of doing business
Strategy&
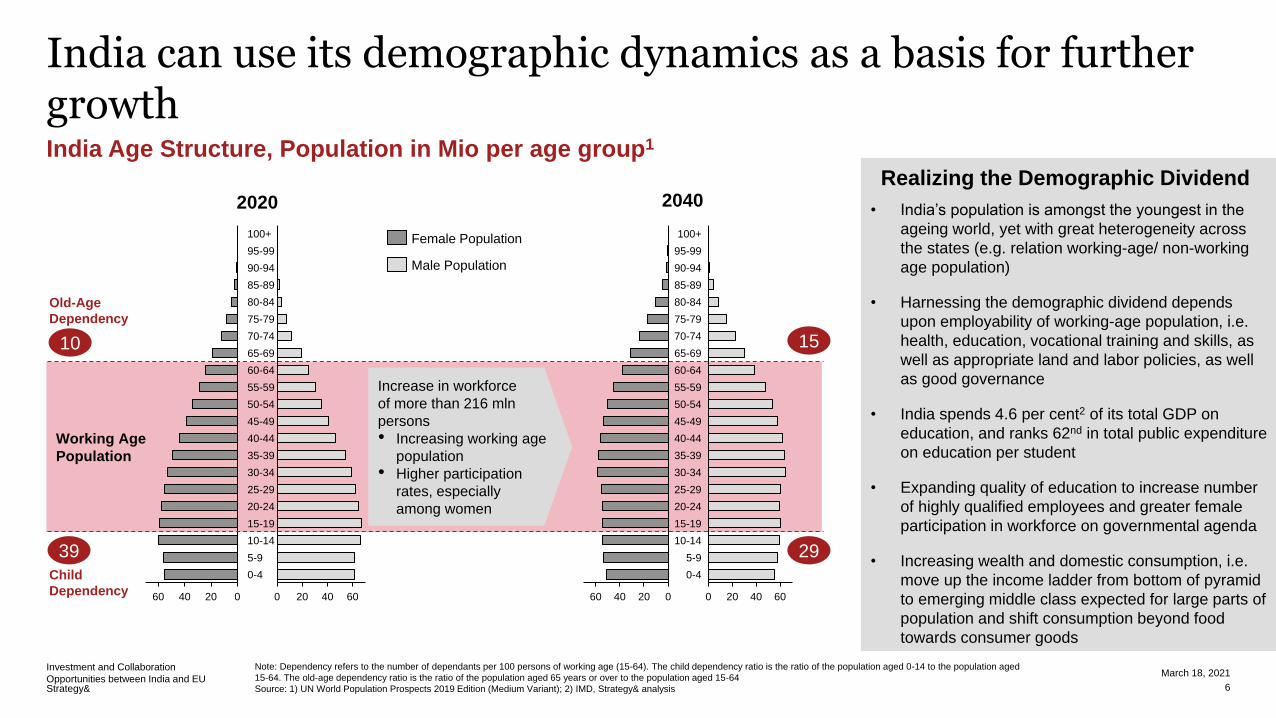
• India’s population is amongst the youngest in the
ageing world, yet with great heterogeneity across
the states (e.g. relation working-age/ non-working
age population)
• Harnessing the demographic dividend depends
upon employability of working-age population, i.e.
health, education, vocational training and skills, as
well as appropriate land and labor policies, as well
as good governance
• India spends 4.6 per cent2 of its total GDP on
education, and ranks 62nd in total public expenditure
on education per student
• Expanding quality of education to increase number
of highly qualified employees and greater female
participation in workforce on governmental agenda
• Increasing wealth and domestic consumption, i.e.
move up the income ladder from bottom of pyramid
to emerging middle class expected for large parts of
population and shift consumption beyond food
towards consumer goods
India can use its demographic dynamics as a basis for further growthIndia Age Structure, Population in Mio per age group1
Investment and Collaboration
Opportunities between India and EU
Note: Dependency refers to the number of dependants per 100 persons of working age (15-64). The child dependency ratio is the ratio of the population aged 0-14 to the population aged
15-64. The old-age dependency ratio is the ratio of the population aged 65 years or over to the population aged 15-64
Source: 1) UN World Population Prospects 2019 Edition (Medium Variant); 2) IMD, Strategy& analysis
March 18, 2021
6
Working Age
Population
0204060
25-29
80-84
100+
95-99
90-94
40-44
85-89
15-19
75-79
70-74
65-69
60-64
55-59
5-9
50-54
45-49
35-39
30-34
20-24
10-14
0-4
0 20 40 60 060 40 20 40200 60
10-14
95-99
100+
90-94
85-89
65-69
80-84
40-44
75-79
15-19
70-74
60-64
20-24
45-49
55-59
5-9
30-34
50-54
35-39
25-29
0-4
Female Population
Male Population
39
10
29
15
Old-Age
Dependency
Child
Dependency
2020 2040
Increase in workforce
of more than 216 mln
persons
• Increasing working age
population
• Higher participation
rates, especially
among women
Realizing the Demographic Dividend

Strategy&
Key to foster growth are the PCPIR clusters which are being refocused for attracting investmentsPCPIR manufacturing hubs
Investment and Collaboration
Opportunities between India and EU 1) FY2019 committed and actual investments
2) Source: FICCI Whitepaper PCPIR Policy Review 2019, India Business Review
March 18, 2021
7
• Petroleum, Chemical and Petrochemical Investment
Region (PCPIR) set up to
• Attract (FDI) investment to reach world scale
• Enable downstream integration
• Cluster knowledge and competencies in one area
• Except for Dahej, PCPIRs have not been able to attract
desired investment and growth due to issues ranging from
overall infrastructure development to project financing
• New policy 2020-35 revising the concept2
• Size of each investment region cut down from 250 sq
km to 50 sq km, with a specific cluster integration
strategy
• Dovetailing the PCPIRs with the National Infrastructure
Pipeline could give a major push to overcome upfront
capital investment needs (viability gap funding)
Dahej, Gujarat
Cuddalore, Tamil Nadu
Vishakhapatnam, Andhra Pradesh
Paradip, Odisha13.6
6.8
6.4
Invest
bn$1 2007
2019
2020
• Anchor tenant: OPaL
• Major investors:
Reliance, BASF,
Aditya Birla, Welpun,
GACL, Adani, SRF,
GSPL, Torrent,
Lanxess
• WIP: Nayara Energy,
Godrej, Agrovet,
Polyplastics,
Thermax, Astral
Pipes, Neogen
Chemicals
• Anchor tenant: IOCL
• Major investors: IFFCO,
Paradip Phosphates Ltd,
Paradip Carbon Ltd and
Deepak Fertilizers &
Petrochemicals
• MoU on Paradip plastic park
• Anchor tenant (NOCL)
• No major investments have been
made in the region.
• Anchor tenant: HPCL Visakh refiner
• Major investors: Coromandel Fertilizers, NTPC
Simhadri Power Plant and Andhra
Petrochemicals, Hetero Drugs
• Kakinada region has 7 power projects and 2
chemical and fertilizer plants2035

Strategy&
More EaseLess Ease
India remains an attractive investment hub for chemical companiesSuccess drivers for India
Investment and Collaboration
Opportunities between India and EU 1) IMF World Economic Outlook Database 2020/ 20212) World Bank's ease of doing business index
March 18, 2021
8
5
10
Malaysia
Ease of Doing Business Index 2020 (Global Rank)2
GDP Growth Projection 2021 (%)1
India
Pakistan
Indonesia
Vietnam
China
India 2010
Japan South Korea
UKGermany
France
#63 in 2020
#122 in 2010
Ease of doing
business
Rising domestic
demand
Competitive cost
and capabilities
Accessibility and
Infrastructure
• Increasingly liberal regulatory frameworks in line with
international practices, relaxation of FDI norms
• Recent changes to corporate tax rates that have
shaped a more supportive ecosystem
• End-use sectors (agro, consumer, retail, auto, health,
infrastructure,…) spur ~50% of incremental growth
• Expected to drive chemical demand, creating
lucrative value pools across chemical subsegments
• Attractiveness as a manufacturing destination due to
competitive labor costs and plant building cost
• Specialty players with distinctive capabilities and
established supply relationships with global networks
• Overcome lack of well-developed infrastructure with
global standard, incl availability of reliable utilities
• Enhance partnering with international companies for
access to advanced process technologies
strategyand.pwc.com
© 2020 PwC. All rights reserved.
PwC refers to the PwC network and/or one or more of its member firms, each of which is a separate legal entity. Please see pwc.com/structure for further details.
Disclaimer: This content is general information purposes only, and should not be used as a substitute for consultation with professional advisors.
Thank you