Embed Size (px)
Citation preview

GUIDELINES V 5.0THE CONSOLIDATED REPORTING
OF YOUR COFACE PORTFOLIO
Coface Dashboard

2 / 3 /
TABLE OF CONTENT
To start ............................................................................................................................................................ page 05
How to Use the Coface Dashboard?.................................................................................................... page 07
Program at a Glance ................................................................................................................................... page 10
Risk Domain .................................................................................................................................................... page 15
Recent activity .................................................................................................................................... page 15
Risk Profile .......................................................................................................................................... page 16
Response time ................................................................................................................................... page 18
Consolidation of buyers ................................................................................................................. page 19
Risk transfer ....................................................................................................................................... page 20
Complete data ................................................................................................................................... page 23
Real outstanding & 3rd party ...................................................................................................... page 24
Import Your Outstanding Amounts ........................................................................................... page 25
Information Products ..................................................................................................................... page 30
Claims domain............................................................................................................................................... page 31
Claims recent activity. ..................................................................................................................... page 33
Claims overview. .............................................................................................................................. page 34
Claims summary. .............................................................................................................................. page 36
Claims analysis.................................................................................................................................. page 39
Synthesis ....................................................................................................................................................... page 40
Rules of calculation ..................................................................................................................................... page 41
COFACE

4 / 5 /
This booklet will help you understand and use the Coface Dashboard to access clear information and go from an overview to more detail.
The Coface Dashboard is a management information tool (credit risk intelligence) for clients and brokers to centrally or regionally have full insight and control over their credit insurance program. The tool presents information in a comprehensive way on both a consolidated and individual policy basis.
With the Coface Dashboard, we help you to:
✓ Have deeper insight into global credit risk, improvements and deteriorations ✓ Save time, focus where it matters most and enhance control✓ Identify and consolidate accumulated risk exposure by groups of buyers✓ Performance indicators are provided and will help you focus on the real areas of improvement✓ Develop various metrics to help you put figures on intuition and qualitative analyses✓ Immediately notice changes in risk policy in volume and quality✓ Report the flow of new events regarding volumes and major cases deserving your attention✓ Follow up your outstanding amounts uploaded and get reports adjusted to your real
exposure as in your accounting ✓ List your portfolio’s claims and analyze them through key performance indicators✓ Get the status of your coverage in the end✓ Follow indicators evolution through years✓ Identify main flows impact on your exposure during recent activity (8 weeks)✓ Benefit from a current picture of main indicators✓ Identify on a dynamic world map the geographical distribution of your covered outstanding
as well as key indicators per country.
TO S
TAR
T
TO START

6 / 7 /
GE
NE
RA
L R
ULE
S
HO
W T
O U
SE T
HE
CO
FAC
E D
ASH
BO
AR
D?
GENERAL RULES
Access to Coface Dashboard
• The access to Coface Dashboard is done through Coface Portal on www.cofanet.coface.com. Once identified you just have to click on the Coface Dashboard logo to open the Program at a Glance page and the menu with Risk Domain, Claim Domain and Synthesis.
• The tool can be operated on : Firefox 4 (or more recent) Internet Explorer 8 (or more recent) Chrome 51 (or more recent)
• English is the only existing language in the Coface Dashboard
• Restricted access can be set for each user (e.g. only the policies of a given region)
Scope of calculation and data display:
• The updating of the risk data is made on a weekly basis during the weekend.-> The Coface Dashboard might be under maintenance for a couple of hours.
• Add to my favorites reports : Aims at saving the common filters used for a report such as periods, currency and your views selected
• All the active decisions, reductions and cancellations no older than 2 years are included
• Decisions which have expired or been withdrawn on the selected month are no longer displayed
• Decisions are displayed in the reports depending on the effective date (which might differ from the decision date) (Except for the reports of the Recent Activity domain)
Content
• Program at a glance• The Risk domain includes 7 sections
and 24 reports• The Claims domain includes 2 sections and 6 reports• Synthesis
Layout
• The reports display tables and charts• You can create your own set of favorite reports to gain
time• Settings can be changed inside each report (without having to go back to the main menu)• PDF documents can be generated in ready-to-use
layouts• Interactive cells open new windows with more detailed
information (going as deep as the list of individual buyers)
• All reports can be printed and exported (into Excel, PDF, CSV …)
Business Intelligence
• Navigation follows your analysing (e.g. focus on credit limits or @rating limits; compare risk profiles of requests versus approved limits
• All reports include online help with detailed explanation of calculation rules• While clicking on all the reports you can have an in depth view of your buyer extracted from the
list of buyer reports
HOW TO USE THE COFACE DASHBOARD?

8 / 9 /
HO
W T
O U
SE T
HE
CO
FAC
E D
ASH
BO
AR
D?
HO
W T
O U
SE T
HE
CO
FAC
E D
ASH
BO
AR
D?
• Try not to use the ’Back’ button in your internet browser and navigate through the Coface Dashboard menus. However, to go back to the Welcome / Program at a glance page you can click on Coface logo at the top of the page.
• Most tables in the Coface Dashboard can be sorted in increasing or decreasing order simply by clicking once or twice on the header of any column of the table.
• In most reports, some data are signalled as ‘interactive’ with blue and underlined signs. By clicking on the interactive link you will open a new report providing more detail about the data displayed. In some reports there is more than one level of detail provided before reaching the ‘List of Buyers’.
• The Coface Dashboard contains many info tips appearing in a small «hover box» with information about the item being hovered over.
• By clicking on the white arrow you can export the gross data on a csv table. In addition if you click on the other arrow you can collapse or expand the panel
• By clicking on the export picto you can choose to export the table on a xls or pdf file :
Navigation tips
Expand/Collapse boards and download data in csv
Through the criteria and views option, the Coface Dashboard enables you to:• Check previous months to develop comparisons and identify trends• Create reports in all the currencies of your Program• Freeze the exchange rates to avoid currency fluctuation effects
Your criteria:
Period:• As the updating is on a weekly basis, the latest selected month may represent a number of weeks
and not a full month.
Exchange rate: • Last updated: the average exchange rate from the previous month (on the current date)• Program: the reference exchange rate of the Program is a fixed exchange rate at the last renewal
date of the Program. It is valid for one insurance year and may be chosen to freeze effects of foreign exchange variations in your comparisons.
Your views:
• Policies in force are displayed in green• Cancelled policies are displayed in red for a 5-year
period after the termination date mentioned in the ‘Synthesis’ tab. ‘Your views’ provides a grouping of polices in pre-defined sub-programs in order to reflect your organisation (in regions, divisions, lines of business, reporting lines etc.)
• The grouping must respect two principles:- A given policy can only be included in one ’View’- No policy can be split between two ‘Views’
In case you need any customization, add or remove users or modify your criteria and your views, please contact your account manager.
Criteria and Views:
10 / 11 /
PR
OG
RA
M A
T A
GLA
NC
E
PROGRAM AT A GLANCE
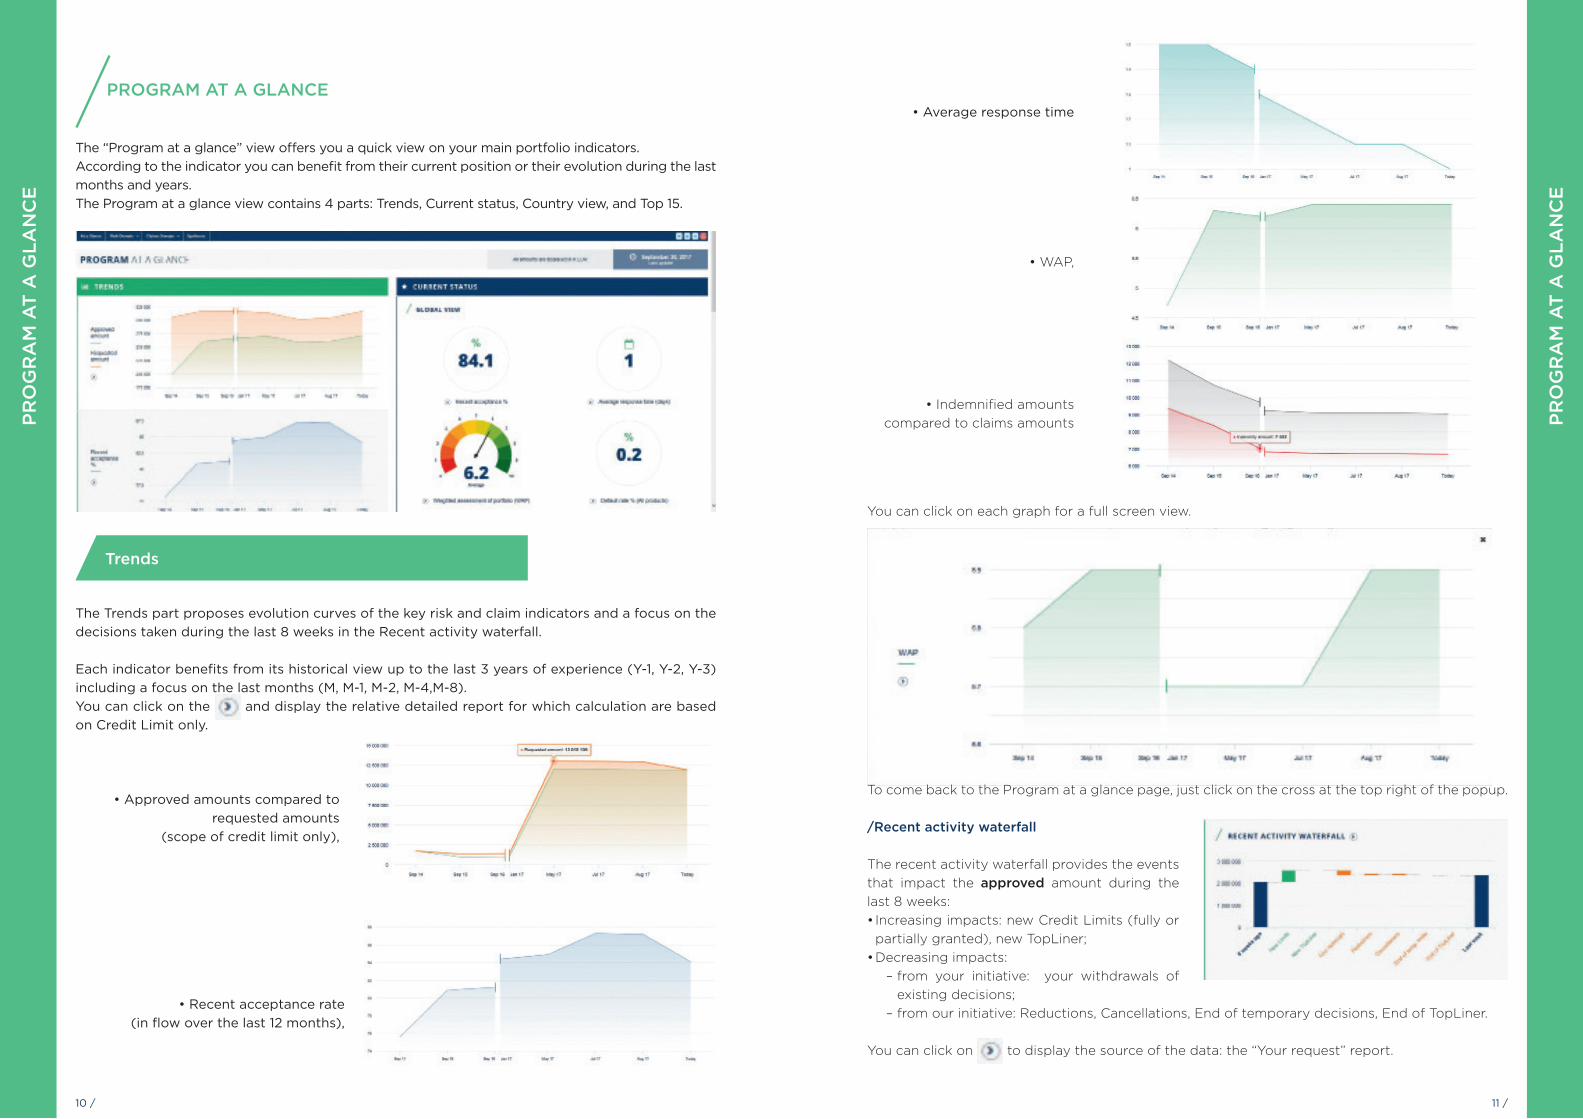
The “Program at a glance” view offers you a quick view on your main portfolio indicators. According to the indicator you can benefit from their current position or their evolution during the last months and years. The Program at a glance view contains 4 parts: Trends, Current status, Country view, and Top 15.
Trends
The Trends part proposes evolution curves of the key risk and claim indicators and a focus on the decisions taken during the last 8 weeks in the Recent activity waterfall.
Each indicator benefits from its historical view up to the last 3 years of experience (Y-1, Y-2, Y-3) including a focus on the last months (M, M-1, M-2, M-4,M-8). You can click on the and display the relative detailed report for which calculation are based on Credit Limit only.
• Approved amounts compared to requested amounts
(scope of credit limit only),
• Recent acceptance rate (in flow over the last 12 months),
PR
OG
RA
M A
T A
GLA
NC
E
• WAP,
• Average response time
• Indemnified amounts compared to claims amounts
You can click on each graph for a full screen view.
To come back to the Program at a glance page, just click on the cross at the top right of the popup.
/Recent activity waterfall
The recent activity waterfall provides the events that impact the approved amount during the last 8 weeks: • Increasing impacts: new Credit Limits (fully or
partially granted), new TopLiner;• Decreasing impacts:
– from your initiative: your withdrawals of existing decisions;
– from our initiative: Reductions, Cancellations, End of temporary decisions, End of TopLiner.
You can click on to display the source of the data: the “Your request” report.

12 / 13 /
PR
OG
RA
M A
T A
GLA
NC
E
PR
OG
RA
M A
T A
GLA
NC
E
Current status
/Global view
The current status of 4 major indicators is displayed
For each of them you can get further details in the corresponding report if you click on :
• Recent acceptance rate (in %): “Acceptance rate”/ “Request over 12 months” report. • Average response time (in days): “Comparative view by policy” report.• Weighted assessment of portfolio (WAP): “WAP” report• Default rate (in %) (all products like in claim analysis): “Claims analysis” report.
/Share of temporary decisions
This graph proposes a simple breakdown of your covered outstanding amount per type of decision in force:
• Permanent: it includes Credit Limit, @rating Limit and Express Credit Limit,• Temporary (out of TopLiner decisions): it includes all Credit Limit delivered for a
determinated time, • TopLiner: only TopLiner decisions are taken into account.
You can click on to display the “Temporary Decisions” report.
Country view
This world map shows all the countries where you are present with the Coface Country Risk Assessment color code.
To drill down, click on the map to benefit from a full screen view and then you can: • Mouse over a country to display the tooltip with your program details in this country: Recent
acceptance, average response time, WAP, default rate, approved amount, number of buyers and the Country Risk Assessment.
• Click on a chosen CRA in the caption to only display countries with the selected value, you can switch from one CRA to another one, and you can click on “Show all” to display all countries where you are present
You can click on to display the “Country view” report.

14 / 15 /
Top 15
The top 15 is the list of your main buyers sorted by approved amount.The Top 3 is displayed on Program at a glance:
Just click on “see more” to display the Top 15 buyers with the cumulated figures on your program and the buyer details: Easynumber, requested amount, approved amount, DRA, claim amount and indemnity amount.
You can open the content of the table in an xls file if you click on the xls picto at the top right of the popup.
RIS
K D
OM
AIN
/ R
EC
EN
T A
CT
IVIT
Y
Your Requests: The report shows the number and the amount of new limit requests you have made. As the Coface Dashboard is updated weekly on the weekends, you won’t be able to see your requests of the ongoing week. You can also check the removals through the dedicated tab, including the expired Topliner cover
Reduction and Cancellation:Provides an analysis of the reductions and cancellations decided in the last 8 weeks before the date of observation
Your top ten: Shows the top ten approved amounts/reductions/ cancellations over the last 8 weeks
Recent Activity
RISK DOMAIN
PR
OG
RA
M A
T A
GLA
NC
E

16 / 17 /
RIS
K D
OM
AIN
/ R
ISK
PR
OF
ILE
Buyer Risk Profile: The report uses the Coface DRA to analyze your portfolio of risks. It explores the counterparty dimension of credit risk
The Buyer Risk profile is the one at the end of the selected period or the current one if the selected period is the current week.
Country Risk Profile:It uses the Coface country risk assessment to analyze the portfolio of risks exploring the macro-economic and country risk dimensions of credit risk
Country View: This report shows a breakdown of your portfolio of risks by country, including key metrics of the Coface Dashboard
Risk Profile
RIS
K D
OM
AIN
/ R
ISK
PR
OF
ILE
Weighted Assessment of Portfolio (WAP): It uses the Coface buyer score to establish a portfolio assessment, making comparisons very easy. You can find the WAP per policy: -on approved amounts-on requested amounts. (credit limits only)
Buyer Risk Profile Evolution:This report uses the Coface DRA to develop a quantitative approach of positive and negative developments of your portfolio.
Comparative Evolution by Policy: It uses the Coface buyer DRA to establish a synthetic approach of the evolutions of your portfolio, making comparisons very easy.
List of buyers

18 / 19 /
RIS
K D
OM
AIN
/ R
ESP
ON
SE T
IME
We answer in less than...: This report provides our internal statistics on the response time observed in the Program
Comparative view by policy: It provides an average timeframe, making comparisons very easy (by policy or between any samples you create making use of the various filters available). By clicking on the policy you can have the detail of the countries in addition to the list of buyers you have when you click on the timeframe.
Response Time
RIS
K D
OM
AIN
/ B
UY
ER
’S G
RO
UP
Consolidation by a group of buyers: This report uses our monitoring of financial links between your buyers to support your consolidation tasks.The company is identified as belonging to a group if it is directly or indirectly owned by this group, even through a minority share.
A group is displayed if at least 2 decisions exist on at least 2 subsidiaries of this group in your program.
Number of subsidiaries: buyer group subsidiaries concerned.Number of contracts involved: number of contracts concerned.
Consolidation of buyers
Buyers in several contracts: This report displays the list of the buyers on which you requested credit decisions through at least two of your contracts. Click on a buyer to see the details of all the credit decisions involved.

20 / 21 /
Acceptance Rate: Compares for each contract the amounts requested with the sum of the amounts approved. It also provides the ratios per country, for your initial selection or for the contract of your choice simply click on the contract name.
Risk transfer
RIS
K D
OM
AIN
/ R
ISK
TR
AN
SFE
R
Risk transfer
Full/Partial/Refused: Provides elements to understand the overall acceptance rate, using the 3 major types of decisions. Reductions are reported as partial and cancellations as refused.
Note:Partial status includes ReductionsRefusal status includes Cancellations
Temporary decisions:The temporary decisions displays decisions for which the end date of cover is planned when the decision is taken (credit limit and TopLiner covers) whatever the amount granted: fully
The motivation codes of your decisions are grouped into 10 categories:• Structural weaknesses, insufficient net worth, too
limited size• Loss making, poor profitability orientation• Concern about liquidity / solvency• Unpaid debts reported• Legal proceedings against the buyer• Adverse group / management background• Buyer’s position weakened by a very difficult economic
environment• New information may help revising• Technical (linked to buyer information)• Other
A decision may carry two or more reasons which are all counted. Some reasons not falling obviously in one of the eight categories are omitted as well as free text indications from risk underwriter.2 calculation options are at your disposal through 2 tabs:- Scope of your entire portfolio (‘stock’)- Only the decisions made in the last 12 months (‘Flow over 12 months’)
Reasons behind restrictive answers: Uses the reasons provided in all our restrictive decisions to develop a quantitative approach of the most frequent weaknesses observed among buyers.
RIS
K D
OM
AIN
/ R
ISK
TR
AN
SFE
R
4 calculation scopes are at your disposal through 4 tabs:
- Stock: all the decisions (TopLiner cover excluded) in force are displayed.
- Flow over the last 12 months : the picture of all the new requests (TopLiner excluded) and Coface decisions (reductions and cancellations) during the last 12 months.
- Requests over 12 months: the picture of the new requests made during the last 12 months (reductions,cancellations, and TopLiner cover requests excluded)
- Stock including TopLiner: the calculation rule of this tab is the same as in “Stock” but includes TopLiner covers, it is only displayed if at least one TopLiner decision is present.
agreed, partially agreed, under reduction or under cancellation.The table displays as many lines as there are several products for a contract. Please note TopLiner decisions aren’t taken into account in this report.N.B : “scheduled decision” indicates if several period of cover are included in the decision regarding
this buyer.

22 / 23 /
RIS
K D
OM
AIN
/ R
ISK
TR
AN
SFE
R
Risk transfer by band: Aims at identifying potential trends depending on the size of your requests. You may ask us to change the setting if you feel that different pivot amounts would produce a better analysis. In case you change the currency in “your criteria”, the band values will be accordingly modified
TopLiner Cover: This reports shows the impact of TopLiner covers
List of buyers: Report : Displays the full list of buyers for you either to download or to use the various filters available (country, product, DRA)
Export : This report displays the full list of buyers in an Excel “ready to use” format that will allow you to quickly apply formulas once the file is opened in Excel
Full export: This report enables you to download a complete list of buyers with all the risk data computed in the Coface Dashboard. It includes the data in the currency of the request and the currency selected after conversion.
Complete Data
RIS
K D
OM
AIN
/ C
OM
PLE
TE
DA
TA
24 / 25 /
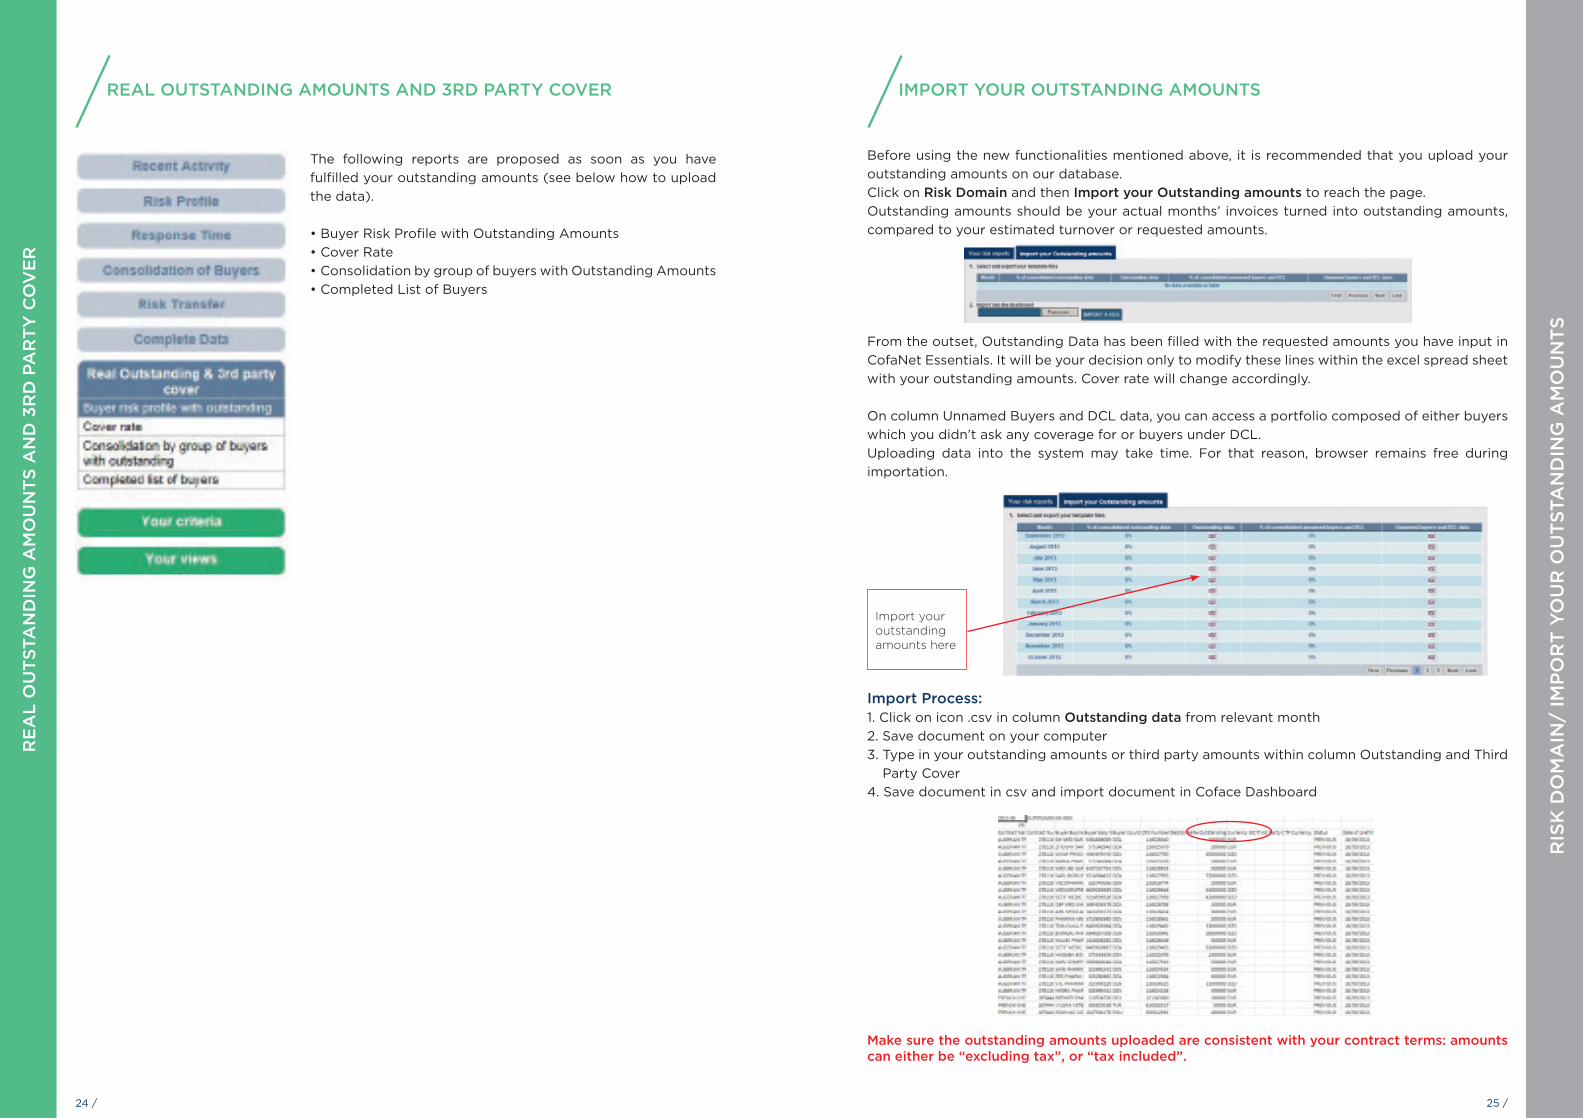
Before using the new functionalities mentioned above, it is recommended that you upload your outstanding amounts on our database. Click on Risk Domain and then Import your Outstanding amounts to reach the page.Outstanding amounts should be your actual months’ invoices turned into outstanding amounts, compared to your estimated turnover or requested amounts.
From the outset, Outstanding Data has been filled with the requested amounts you have input in CofaNet Essentials. It will be your decision only to modify these lines within the excel spread sheet with your outstanding amounts. Cover rate will change accordingly.
On column Unnamed Buyers and DCL data, you can access a portfolio composed of either buyers which you didn’t ask any coverage for or buyers under DCL.Uploading data into the system may take time. For that reason, browser remains free during importation.
Import Process: 1. Click on icon .csv in column Outstanding data from relevant month2. Save document on your computer3. Type in your outstanding amounts or third party amounts within column Outstanding and Third
Party Cover4. Save document in csv and import document in Coface Dashboard
IMPORT YOUR OUTSTANDING AMOUNTS
RIS
K D
OM
AIN
/ IM
PO
RT
YO
UR
OU
TSTA
ND
ING
AM
OU
NTS
Import your outstanding amounts here
Make sure the outstanding amounts uploaded are consistent with your contract terms: amounts can either be “excluding tax”, or “tax included”.
RE
AL
OU
TSTA
ND
ING
AM
OU
NTS
AN
D 3
RD
PA
RT
Y C
OV
ER
The following reports are proposed as soon as you have fulfilled your outstanding amounts (see below how to upload the data).
• Buyer Risk Profile with Outstanding Amounts• Cover Rate• Consolidation by group of buyers with Outstanding Amounts• Completed List of Buyers
REAL OUTSTANDING AMOUNTS AND 3RD PARTY COVER

26 / 27 /
RIS
K D
OM
AIN
/ IM
PO
RT
YO
UR
OU
TSTA
ND
ING
AM
OU
NTS
Cover Rate: The cover rate section gives the covered portion of your real outstanding amounts. The cover rate section is broken down by entities and developed over the months. The cover rate section is split in two similar boards:
• whether you wish to display Coface Covered Amount, including Primary amounts and TopLiner
• or the Total Covered Amounts, including Primary amounts, TopLiner and Third Party cover.
This report is derived from the Acceptance Rate report
RIS
K D
OM
AIN
/ IM
PO
RT
YO
UR
OU
TSTA
ND
ING
AM
OU
NTS
Buyer Risk Profile with Outstanding (previous month):The Buyer Risk Profile with Outstanding amounts gives a risk assessment of your portfolio based on every month outstanding amounts you uploaded in the Coface Dashboard. Likewise in Risk Profile section, Portfolio is broken down by DRA. A Third Party Cover has been added in case you wish to declare Third Party elements and let the reports reflect all your covers in force.
Column Total Covered Amounts is the sum of Third Party Cover, the Topliner cover and the Primary Amount approved.
This report is derived from the Buyer Risk Profile report.

28 / 29 /
RIS
K D
OM
AIN
/ IM
PO
RT
YO
UR
OU
TSTA
ND
ING
AM
OU
NTS
Completed list of buyers: The full list of buyers gives a full overview of your portfolio, with insights on the covered amounts, the outstanding amounts, the DRA and the type of Credit Limit.
RIS
K D
OM
AIN
/ IM
PO
RT
YO
UR
OU
TSTA
ND
ING
AN
D 3
rd P
AR
TY
CO
VE
R
Consolidation by group of buyers: This report calculates the consolidated risk exposure based on the real outstanding amount you have uploaded.
This section is a consolidated version of your portfolio. It gives you, by groups of buyers sorted in an alphabetical order, the outstanding amounts uploaded, the cover rate, the TopLiner cover and the third party cover when they exist. You can also get detailed commercial information such as the number of contracts or limits involved on each group of buyers.
This report is derived from the Consolidation by group of buyers report.

30 / 31 /
CLA
IMS
DO
MA
IN
Access claims domain here
Click on Claims Domain tab
Your Coface Dashboard looks like the screenshot below, including three main panels: - Your claims report: with Claims recent activity and Claims overview- Your criteria- Your views.
Start by choosing how many periods you want your portfolio to be divided in. There are up to 4 periods that you can select. Choose your program as well.
By default, dates are lined up on the renewal date of your contract. They found their utility in the Claims summary only. Your claims information will be segmented in as many periods as you have decided as well. Periods can be of different size. Shifting a date will not alter the others.
Select and define your periods
Choose the branches your want to include
in the report
RIS
K D
OM
AIN
/ IN
FO
RM
AT
ION
PR
OD
UC
TS
In addition to your insurance products, your information products are stored in theCoface Dashboard: Customised Credit Opinion and Monitored @rating Credit Opinion. They can be found in the following list of reports:List of buyers, Buyer Risk Profile, Country Risk Profile, Country view, Acceptance rate, Full Partial Refused, We answer in less than…, Comparative view by policy, Your requests, Reductions and cancellations, Your Top Ten.
@Rating and Monitored @rating Credit Opinions follow the same rules as per how they are integrated in any calculation.
Credit limits and Customised Credit Opinions follow the same rules as per how they are integrated in any calculation.
Acceptance rate rules are the same whether Customised Credit Opinions or Credit limits are at stake. The same applies for @rating limits or Monitored @rating credit opinion.
Customised Credit Opinions and Monitored @rating Credit Opinion are not taken into account in the calculation of WAP report.
In the average response time calculation now is taking into account Customised Credit Opinions and Monitored @rating Credit Opinion.
In all these reports, information products are available in the reports mentioned above through this drop-down menu or are included in the perimeter if there is no drop-down menu.
INFORMATION PRODUCTS (specific to some contracts)

32 / 33 /
The Use factor % is used for the calculation of the Default Rate only. It is up to your judgment to modify it accordingly to the distinction you can make between the credit limits approved and the real outstanding of your portfolio. The Use factor is aimed at bringing the sum of your credit limits as closely as possible to the sum of your real outstanding. The Default rate will consequently be closer to the reality.
➡ For instance, if the total of your credit limits approved amounts is 100 M and the total of your outstanding amounts is 70 M, you will then input 70 as a use factor.
Before browsing Claims domain reports, you can choose the type of exchange rate and the currency you want the data to be given into.
Color codeBrowsing some boards, you come across data displayed in a green color. Claims for which the indemnity amount and date are in green have been paid off. Those still in black or blue are still pending.
Exchange rateThe fixed exchange rate is aimed at freezing all figures with a single exchange rate that remains stable for the next 5 years, starting 01/01/2013.It makes comparisons between data possible without any time bias and currency fluctuation.
CLA
IMS
DO
MA
IN
CLA
IMS
DO
MA
IN
CLAIMS RECENT ACTIVITY
Your last NOA This report displays the last Notifications of Overdue Account that you sent us. Data including major key performance indicators are divided into four different periods: Last week, 4 weeks, 3 months and 6 months. Your last NOA menu is divided into two boards with a single currency in K units or in original currencies.
Claims eventsThis report displays the occurrence of the following claims events over the last week, 4 weeks, 3 months, or 6 months: NOA, Paid Indemnity, Recoveries before Indemnities, Recoveries after Indemnities and Change of status. The Change of Status indicator counts the number of changes in the Specific Status of the claims files.
Click on any number from the selected periods to fall down on the specific claims files involved in those claims events.

34 / 35 /
CLA
IMS
DO
MA
IN
CLAIMS OVERVIEW
Some new indicators are implemented: - Indemnity Rate (Measures by how much on the selected program, you have been paid off)- Average Claim Amount (Average of all the Claims recorded) - Recovery Rate (Measures how much Coface has recovered from the claim amount)- Rejection Rate (Measures the weight of the claims amounts Coface will not indemnify)
Differences between the initial claim amount, the claim amount and the covered amount in your database and those displayed in the Coface Dashboard can sometimes be explained by the inclusion or exclusion of taxes and VAT. The initial claim amount is what has been declared to Coface initially. Details of calculation are in the Rules of Calculation
*In the considered perimeter, are included the opened claim files, and the closed claim files for which the last indemnity was paid off within the last 2 years or, in case that information could not be found, for which the NOA date would be included within the last 36 months.
List of companies on which you have had an open claim
• The Indemnity amount is the amount Coface has indemnified its clients over a claim file. The Recoveries after the indemnity are the amounts Coface has recovered from a Claim after an indemnity had already been given.
• In the special status, comments are made about the nature of the claim or its status. Status can either be: {Insolvency, Political Risk, Dispute, or Rejection}.
• The rejection rate is made of all the Claims files tagged as rejected entirely. Are rejected the claims for which all invoices have been rejected.
• The Covered amount is inferior or equal to the guaranteed claim’s amount (Total amount of a claim eligible to Coface cover according to the terms and conditions of the contract).
You can choose to display the claims in their original currency or in the same currency. Click on Original Currency tab to select another panel where Initial Claims amounts, Claims amounts, and Indemnity amounts are set into their invoicing currency.
CLA
IMS
DO
MA
IN
List of claims
This board will list all the claims you have had so far on a selected program for the considered perimeter*. The initial Claim amount is the claim amount as you declared it. The Claim amount is the initial claim amount to which have been withdrawn, if they do exist, amounts that have been paid off in the meantime. RFI stands for Requested For Intervention, a gap of days between your Notification of Overdue Account and the actual day when you require our intervention.

36 / 37 /
Invoice Date tabHere in the example, 3 periods have been chosen, based on calendar years. In the Invoice Date tab, claims are allocated by invoicing months included in each period.
There are three different tabs in the Claims Summary section: the Invoice date, the Initial NOA Date, the Loss occurring. The 1st invoice date reports differ only by the way Claims are accounted.
In these reports, the list of claims has been summed up accordingly to the periods you have initially chosen. And by default, you will come upon the Invoice Date tab.
CLA
IMS
DO
MA
IN
In the exemple:In period 1, invoices are up to 150 k. They stand for 60% of the total claim file. In period 2, invoices are up to 100 k. They stand for 40% of the total claim file.
Initial NOA date
In the Initial NOA Date tab, claims files are recorded as part of the period in which the NOA date has been declared. At a claim file scale, all invoices related to the particular file, whether they are included in that period or are from previous periods, shall be included in the NOA period.
click here
Loss occurring rule
In this tab, you can grasp the proportion of claims related to your contracts under the Loss Occuring rule, in opposition to the Risk Attaching rule.Their segmentation follows the same rules as for the Initial NOA Date tab, claim file is recorded in the period in which the insolvency (most of the cases) was pronounced. When there is no case of insolvency, claims files are gathered in the In bonis line.
First Invoice date
CLA
IMS
DO
MA
IN
Claims Summary:
In the example above, Claim file is recorded as part of period 2 for 200 k.
In the first invoice date tab, claims files are recorded as part of the period in which the 1st invoice covered has been issued, in the example below the period 1.

38 / 39 /
The Details Claims Summary is accessible by clicking on a selected period within the list of periods.
click here
The Details Claims Summary gives the list of claims for the given period. It essentially differs from the list of claims board by the column entitled “ % in the period ”. That column indicates for each claim the percentage of the total claim amount allocated to the considered period. For the NOA date and the Loss occuring rule, the repartition should always be 100%.
CLA
IMS
DO
MA
IN
Claims Analysis:
This section of reports gathers six key metrics indicators of your Claims and compares each of them individually through the periods. All the claims recorded on the selected program are included in the key metrics.
List of metrics:- Sum of Claim amounts - Sum of Indemnity amounts- Average initial claim amount- Default Rate (defintion in the Rules of Calculation)- Recovery Rate (defintion in the Rules of Calculation)- Rejection Rate (defintion in the Rules of Calculation)
Select key metric
Click here to select the key metrics you wish to assess
Risk related information Claims related information
CLA
IMS
DO
MA
IN
Claims (All values)Claims (All values)Sum of claim amountSum of indemnity amountAverage claim amountDefault rateRecovery rateRejection rate
Full Export Claims:
This report enables you to download a complete list of claims with all the claims data computed in the Coface Dashboard.

40 / 41 /
SYN
TH
ESI
S
SYNTHESIS
- On tab Summary, you can find a board gathering data from Commercial and Risk tabs.
- On tab Risk, you will find a board displaying and summing-up all risk-related data that you could find in the other tabs, ranging from Risk Profile section to Real Outstanding and 3rd Party sections.
- On tab Claims, are gathered some of the major indicators that you can find in the Claims Domains, including the default rate of the previous year and a comparison of the sum of claims amounts between the on-going year and the previous year.
- On tab Commercial, you will find a board displaying some contract-related data, such as the contracts status and their starting date.
- On Summary (original currency) tab, you will find the template of the standard Summary tab with the amounts in the original currency.
Access Synthesis board here
The synthesis is an overview board providing the main indicators shown in the domains.
The number of calculations it requires explains a slightly longer time for display.
Beyond, the number of columns makes the PDF difficult to read so that exporting into Excel to select useful information maybe necessary.
Here the Summary tab of Synthesis Domain
RU
LES
OF
CA
LCU
LAT
ION
Credit limit and Customised Credit Opinions: Approved amount / requested amount x 100Special cases:- Decisions with scheduled periods: The acceptance rate is calculated as at the selected month, depending on the effective period of the decision.- Decisions with several operation numbers:Only the requested amount from the primary decision is used for the ratio.The approved amounts of each complementary decision are aggregated.
@rating limit and Monitored @rating Credit Opinions:The calculation of approved amount/requested amount cannot be computed because there isn’t any requested amount, but a granted amount only.In order to be closer to reality and not to overweight @rating limits, in the overall ratio, the tool takes into account a use factor of 60% of the amount. It means that a theoretical requested amount of 60% of the highest @rating value is used.Example:
Express credit limit:A similar method is used to avoid overweighting Express Credit Limits (ECLs), with a use factor of 50%.
Acceptance rate calculation:
RULES OF CALCULATION
The scope of calculation includes manual and automatic decisions but all management acts are excluded (decisions which have a nil response time)Sum of the number of days between the day the request has been received and the day the decision has been made / number of decisions for traditional Credit limits, Customised Credit Opinions, @rating insured and Express Credit Limits only. If a request is made on an unknown buyer, we use the date of receipt of the initial request (and not the date of identification of the buyer).The average response time is calculated in every report on the flow of requests made in the last 12 months before the selected month.
Average response time:
Risk domain indicators :

42 / 43 /
Balance:
The The Coface Dashboard counts the number of upward / downward changes in the buyer DRA of the portfolio between the selected month and the previous month.A change is counted only if the buyer is in the portfolio in both months.The balance is the difference between the number of upgrades and the number of downgrades over the last 6 months. It can be positive or negative.
Buyer risk profile evolution:
The The Coface Dashboard counts the number of upward / downward changes in the DRA of your portfolio between the selected month and the previous month.
A change is counted only if the buyer is in the portfolio in both months.
Comparative evolution by policy:
The Coface Dashboard counts the number of upward / downward changes in the buyer s DRA of your portfolio between the selected month and the previous month.A change is counted only if the buyer is in the portfolio in both months.The balance is the difference between the number of upgrades and the number of downgrades.It can be positive or negative.This report provides for each period the difference between the number of downgrades and the number of upgrades on the understanding that the column labelled “Balance” gives the cumulated balance over the six months.
TopLiner Cover:
Use factor
This report provides a detailed analysis of your TopLiner covers by Contract. The table is divided in 3 parts; all the TopLiner covers including the decisions of the 12 months prior to the selected period, all the TopLiner covers in force in the selected period and last part shows the weight of the TopLiner covers (in force) in your total portfolio of cover. The period and the currency can be changed in this report by using “your criteria”
TopLiner Covers over the last 12 months: number of TopLiner covers could be purchased for the same buyer in a period of 12 months, we may have more covers than buyers involved;
- Average amount in force: Sum of (TopLiner covers agreed X number of days coverd by the TopLiner/360). It aims at giving the average value of the total TopLiner covers in force over the last
- Average premium rate in %: Sum of premium paid/ Total amount of TopLiner covers. NB: if a TopLiner cover is cancelled and replaced before its expiry date, it will contribute in full to the above calculation.
By clicking on any value in “No of buyers with TopLiner”, the corresponding “List of byers” is displayed, showing for each couple buyer/ contract, the initial credit limit and TopLiner cover.
The Use factor % is used for the calculation of the Default Rate only. It is up to your judgment to modify it accordingly to the distinction you can make between the credit limits approved and the real outstanding of your portfolio. The Use factor is aimed at bringing the sum of your credit limits as closely as possible to the sum of your real outstanding. The Default rate will consequently be closer to the reality.
-> For instance, if the total of your credit limits approved amounts is 100 M and the total of your outstanding amounts is 70 M, you will then input 70 as a use factor.
Before browsing Claims domain reports, you can choose the type of exchange rate and the currency you want the data to be given into.
RU
LES
OF
CA
LCU
LAT
ION
RU
LES
OF
CA
LCU
LAT
ION
TopLiner in force: the WAP TopLiner is the sum of (DRA of the buyer X TopLiner cover / Total amount of the TopLiner covers)
NB: the special rules of calculation of the WAP report, like the DRA of the guarantor or the DRA other country, are not used here, the calculation is simplified.
By clicking on any value in “No of buyers with TopLiner”, the corresponding “List of buyers” is displayed, showing for each couple buyer: contract, the initial credit limit and the TopLiner cover (s).
TopLiner weight in overall cover: On the upper part of the screen, based on the filter “Credit limit” or Product (All Values), the value of TopLiner will either be compared with credit limits only or with cover products Total number of buyers: the number of buyers with covers in force in the selected month.Total insured amount: the sum of the approved amounts of all the products in force including TopLiner covers.TopLiner weight in %: Amount of TopLiner covers in force/ Total insured amount.
Weighted assessment of portfolio (WAP):
This indicator gives a quick assessment of the portfolio under analysis, using the Coface buyer DRA. For this ratio, the special method used for the acceptance rate is not used.Special cases:
- For pure political risk limits, the country risk assessment is expressed as a value on the scale of buyer DRA in order to get a consistent calculation.
- Decisions conditional upon a third party guarantee are given the best score of the guarantor(s). 2 calculation scopes are at your disposal through 2 tabs:- “Detail per approved amount” which includes Credit limits, @rating limits and Express
Credit Limits.- “Detail per requested amount” which includes Credit limits only.
Weighting is using an exponential scale of the default rates, making riskier low DRA and lighter high DRA. The final result is converted back to the standard DRA scale.
Country risk assessment:
Every quarter, Coface updates information about country assessments, country analysis andforecasts, as published by our Country Risk and Economic Research department.

44 / 45 /
Ratio assesses the covered portion of the unpaid invoices being notified.
Ratio is ∑ Covered amounts ∑ Declared amounts
Declared amount = ∑ Invoices’ amount - ∑ recoveries before indemnityInvoices’ amount is the sum of all the file’s invoices
Ratio gives the average initial claim amount of all the claims recorded during a certain period of time
Ratio is ∑ Initial claims amount ∑ Number of claims recorded
Ratio takes the portion of your claims amounts recorded during a year and compares it to the estimation of your outstanding amounts.
Ratio is ∑ Declared amounts recorded during Y-1∑ Approved amounts at 01/01/Y-1 * Use factor
Ratio gives the Indemnified portion of the unpaid invoices being notified.
Ratio is ∑ Indemnity amounts∑ Declared amounts
Where the Indemnity amount is the sum of the Indemnified amounts and the provisional indemnity amounts.
Cover rate in Claims Domain: Recovery rate:
Average initial claim amount:
Default rate:
Indemnity rate:
A Claim file is considered as rejected if all the sub-claims it encompasses have been rejected. The rejection rate measures the portion of claims amounts not indemnified among the total claim amounts. Ratio gives the recovered portion of the total Claims amounts, before and after any indemnity.
Ratio is ∑ Invoices’ amount of the rejected files
∑ Invoices’ amount TOTAL
Rejection rate:
Claims domain indicators:
RU
LES
OF
CA
LCU
LAT
ION
RU
LES
OF
CA
LCU
LAT
ION
Ratio gives the recovered portion of the total Claims amounts, before and after any indemnity.
Ratio is ∑ Recoveries before and after indemnity
∑ Invoices’ amounts

The Coface Dashboard in a nutshell…• Clear and straightforward information• Group exposures displayed at a click• Easy management of subsidiaries with individual acceptance
rates, WAP’s and turnaround times• Ask about our performance, acceptance rates, turnaround times…• Document export presentation as if it were your own
COFACEMARXERGASSE 4C1030 VIENNA - AUSTRIAwww.coface.at