Embed Size (px)
Citation preview

Codington County Pre-Disaster Mitigation Plan
2017-2021 Prepared by: First District Association of Local Governments 124 1st Avenue NW Watertown, SD 57201 Phone: 605-882-5115 Fax: 605-882-5049 www.1stdistrict.org For: Federal Emergency Management Administration

TABLE OF CONTENTS
CHAPTER 1 – INTRODUCTION .................................................................................................................. 1
Introduction ...................................................................................................................................... 1
Authority for Pre-disaster Mitigation Plan ......................................................................................... 2
Purpose ............................................................................................................................................ 2
Use of Plan ....................................................................................................................................... 2
Scope of Plan ................................................................................................................................... 3
What is Hazard Mitigation ................................................................................................................ 3
Codington County Profile ................................................................................................................. 4 o Population .................................................................................................................................. 4 o Social and Economic Description .............................................................................................. 6 o Physical Description and Climate .............................................................................................. 6 o Transportation and Utility Infrastructure .................................................................................... 7 o Medical and Emergency Services ............................................................................................. 7
CHAPTER 2 – PREREQUISITES ................................................................................................................ 8
Adoption by Local Governing Body .................................................................................................. 8
Multi-jurisdictional Plan Participation ............................................................................................... 8 CHAPTER 3 – PLANNING PROCESS ...................................................................................................... 11
Background .................................................................................................................................... 12
Documentation of Planning Process .............................................................................................. 12 o Methodology ............................................................................................................................ 12 o Planning Framework ................................................................................................................ 12 o Risk Identification & Assessment/Mitigation Strategy/Review of Plan .................................... 16
CHAPTER 4 – RISK ASSESSMENT ......................................................................................................... 19
Identification of Hazards................................................................................................................. 19
Types of Natural Hazards in the PDM Jurisdiction Area ................................................................ 21
Hazard Profile ................................................................................................................................ 25 o Dam Failure ............................................................................................................................. 25 o Drought and Fire ...................................................................................................................... 26 o Flood ........................................................................................................................................ 27 o Hail .......................................................................................................................................... 28 o Lightning .................................................................................................................................. 30 o Tornado ................................................................................................................................... 31 o Extreme Temperatures ............................................................................................................ 31 o Thunderstorm and High Wind.................................................................................................. 32 o Winter Storms .......................................................................................................................... 33
Assessing Vulnerability: Overview ................................................................................................. 34
Assessing Vulnerability: Repetitive Loss Properties ...................................................................... 39
Assessing Vulnerability: Severe Repetitive Loss Properties ......................................................... 40
Assessing Vulnerability: Identifying Structures .............................................................................. 41
Assessing Vulnerability: Estimating Potential Losses .................................................................... 46 o Flooding ................................................................................................................................... 49 o Tornado ................................................................................................................................... 50
Assessing Vulnerability: Analyzing Development Trends ............................................................. 50
Unique or Varied Risk Assessment ............................................................................................... 51
CHAPTER 5 – MITIGATION STRATEGY .................................................................................................. 59
Mitigation Requirements ................................................................................................................ 59
Mitigation Overview ........................................................................................................................ 59
National Flood Insurance Program Participation ........................................................................... 81
Implementation of Mitigation Actions ............................................................................................. 82 CHAPTER 6 – PLAN MAINTENANCE ...................................................................................................... 83
Monitoring, Evaluating, and Updating The Plan ............................................................................ 83
Continued Public Participation/Involvement................................................................................... 83
Annual Reporting Procedures ........................................................................................................ 84
Five-Year PDM Review .................................................................................................................. 84
Plan Amendments .......................................................................................................................... 84
Incorporation into Existing Planning Mechanisms ......................................................................... 85
Potential Funding Sources ............................................................................................................. 86
Federal ........................................................................................................................................... 87
Local ............................................................................................................................................... 90
Non-Governmental ......................................................................................................................... 90
LIST OF TABLES
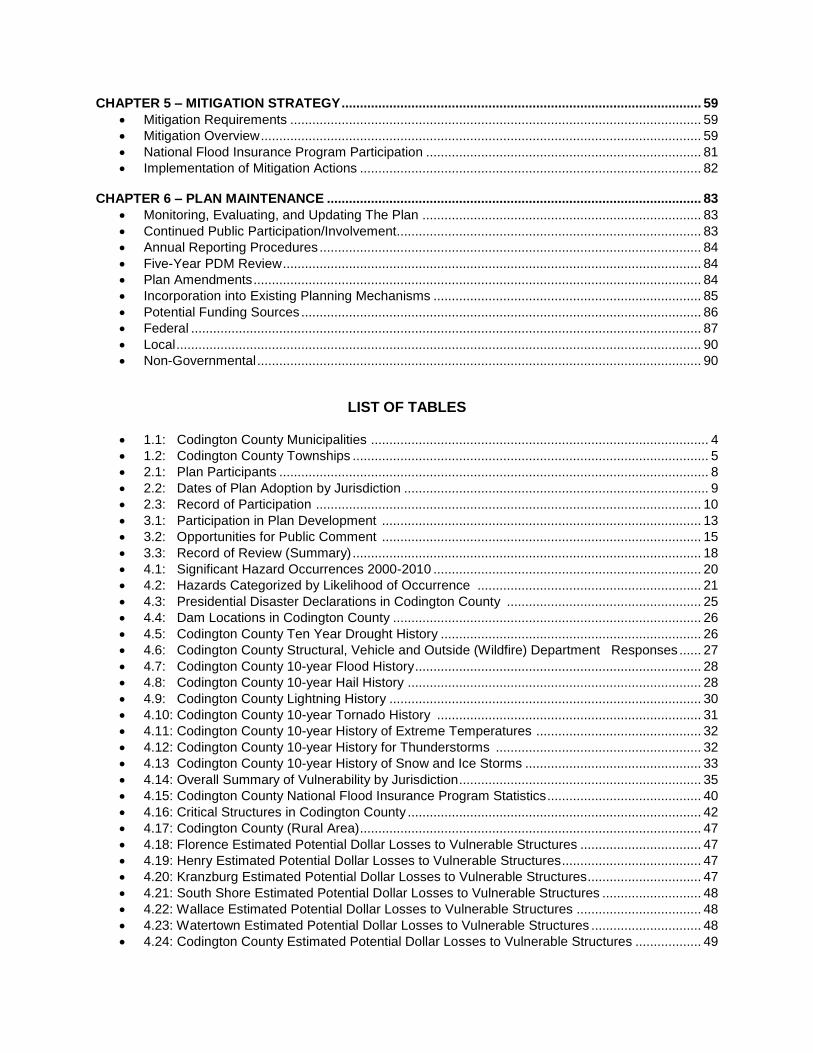
1.1: Codington County Municipalities ............................................................................................ 4
1.2: Codington County Townships ................................................................................................. 5
2.1: Plan Participants ..................................................................................................................... 8
2.2: Dates of Plan Adoption by Jurisdiction ................................................................................... 9
2.3: Record of Participation ......................................................................................................... 10
3.1: Participation in Plan Development ....................................................................................... 13
3.2: Opportunities for Public Comment ....................................................................................... 15
3.3: Record of Review (Summary) ............................................................................................... 18
4.1: Significant Hazard Occurrences 2000-2010 ......................................................................... 20
4.2: Hazards Categorized by Likelihood of Occurrence ............................................................. 21
4.3: Presidential Disaster Declarations in Codington County ..................................................... 25
4.4: Dam Locations in Codington County .................................................................................... 26
4.5: Codington County Ten Year Drought History ....................................................................... 26
4.6: Codington County Structural, Vehicle and Outside (Wildfire) Department Responses ...... 27
4.7: Codington County 10-year Flood History .............................................................................. 28
4.8: Codington County 10-year Hail History ................................................................................ 28
4.9: Codington County Lightning History ..................................................................................... 30
4.10: Codington County 10-year Tornado History ........................................................................ 31
4.11: Codington County 10-year History of Extreme Temperatures ............................................. 32
4.12: Codington County 10-year History for Thunderstorms ........................................................ 32
4.13 Codington County 10-year History of Snow and Ice Storms ................................................ 33
4.14: Overall Summary of Vulnerability by Jurisdiction .................................................................. 35
4.15: Codington County National Flood Insurance Program Statistics .......................................... 40
4.16: Critical Structures in Codington County ................................................................................ 42
4.17: Codington County (Rural Area) ............................................................................................. 47
4.18: Florence Estimated Potential Dollar Losses to Vulnerable Structures ................................. 47
4.19: Henry Estimated Potential Dollar Losses to Vulnerable Structures ...................................... 47
4.20: Kranzburg Estimated Potential Dollar Losses to Vulnerable Structures ............................... 47
4.21: South Shore Estimated Potential Dollar Losses to Vulnerable Structures ........................... 48
4.22: Wallace Estimated Potential Dollar Losses to Vulnerable Structures .................................. 48
4.23: Watertown Estimated Potential Dollar Losses to Vulnerable Structures .............................. 48
4.24: Codington County Estimated Potential Dollar Losses to Vulnerable Structures .................. 49

Codington County Pre-Disaster Mitigation Plan 10-12-12 Page 1
4.25: Codington-Clark Electric Co-op Inc....................................................................................... 49
4.26: HAZUS-MH Base Flood (1 Percent Chance) Loss Estimation Results (2007) ................... 50
4.27: Codington County Annualized Losses from Tornadoes ....................................................... 50
5.1: Proposed Mitigation Activities ............................................................................................... 66
5.2: Communities Participating in the National Flood Program, Codington County, SD ............. 81
LIST OF FIGURES
1.1: Political Map ........................................................................................................................... 5
4.1: Codington Hazard Vulnerability Map .................................................................................... 52
4.2: Town of Florence Hazard Vulnerability Map ......................................................................... 53
4.3: Town of Henry Hazard Vulnerability Map ............................................................................. 54
4.4: Town of Kranzburg Hazard Vulnerability Map ...................................................................... 55
4.5: Town of South Shore Hazard Vulnerability Map ................................................................... 56
4.6: Town of Wallace Hazard Vulnerability Map .......................................................................... 57
4.7: City of Watertown Hazard Vulnerability Map ........................................................................ 58
5.1: Codington Potential Mitigation Project Map ......................................................................... 74
5.2: Town of Florence Potential Mitigation Project Map ............................................................. 75
5.3: Town of Henry Potential Mitigation Project Map .................................................................. 76
5.4: Town of Kranzburg Potential Mitigation Project Map ........................................................... 77
5.5: Town of South Shore Potential Mitigation Project Map ........................................................ 78
5.6: Town of Wallace Potential Mitigation Project Map ............................................................... 79
5.7: City of Watertown Potential Mitigation Project Map .............................................................. 80

Codington County Pre-Disaster Mitigation Plan 10-12-12 Page 2
CHAPTER 1 INTRODUCTION
INTRODUCTION Codington County (County) is vulnerable to natural hazards that have the possibility of causing serious threat to the health, welfare, and security of our citizens. The cost of response and recovery, in terms of potential loss of life or loss of property, from potential disasters can be lessened when attention is turned to mitigating their impacts and effects before they occur or re-occur. The Codington County Board of Commissioners, in conjunction with the South Dakota Office of
Emergency Management and the Federal Emergency Management Agency (FEMA), has
agreed to update this plan to assist all participating entities in the county in their mission to
mitigate losses from natural hazards throughout Codington County, South Dakota and the
communities located therein.
This plan is an update of the Pre-Disaster Mitigation Plan (PDM) that was developed by the County in 2012. The document will serve as a strategic planning tool for use by the county and its communities in its efforts to mitigate against future disaster events. The plan identifies and analyzes the natural disasters that may occur in the County in order to understand the county’s vulnerabilities and propose mitigation strategies that minimize future damage caused by those hazards. This knowledge will help identify solutions that can significantly reduce threat to life and property. The plan is based on the premise that hazard mitigation works. With increased attention to mitigating natural hazards, communities can do much to reduce threats to existing citizens and avoid creating new problems in the future. In addition, many mitigation actions can be implemented at minimal cost. In the past 10 years, there have been 20 major Disaster Declarations which have occurred fully
or partially within the state of South Dakota, including 7 which occurred in 2010. Codington
County is no stranger to natural and man-made disasters. All or portions of Codington County
have been included in three Presidential Disaster Declarations in the last 10 years. In order to
prevent and reduce the cost that is incurred by businesses, citizens, and property owners from
these disasters, the Codington County Pre-Disaster Mitigation Plan developed. This plan
identifies hazards that occur throughout Codington County and mitigation projects that will aid in
preventing and reducing the effects of those disasters on the property and lives within. Special
consideration has been given to critical infrastructure throughout the county.
This is not an emergency response or emergency management plan. Certainly, the plan can be used to identify weaknesses and refocus emergency response planning. Enhanced emergency response planning is an important mitigation strategy. However, the focus of this plan is to support better decision making directed toward avoidance of future risks and the implementation of activities or projects that will eliminate or reduce the risk for those that may already have exposure to a natural hazard threat.

Codington County Pre-Disaster Mitigation Plan 10-12-12 Page 3
AUTHORITY FOR PRE-DISASTER MITIGATION PLAN
In October of 2000, the Disaster Mitigation Act (DMA2K) was signed to amend the 1988 Robert T. Stafford Disaster Relief and Emergency Assistance Act. Section 322 (a-d) requires that local governments, as a condition of receiving federal disaster mitigation funds, have a pre-disaster mitigation (PDM) plan in place that: 1. Identifies hazards and their associated risks and vulnerabilities; 2. Develops and prioritizes mitigation projects; and 3. Encourages cooperation and communication between all levels of government and the
public. The objective of this plan is to meet the hazard mitigation planning needs for the County and participating entities. Consistent with the Federal Emergency Management Agency’s guidelines, this plan will review all possible activities related to disasters to reach efficient solutions, link hazard management policies to specific activities, educate and facilitate communication with the public, build public and political support for mitigation activities, and develop implementation and planning requirements for future hazard mitigation projects. PURPOSE The County PDM is a planning tool to be used by the County, as well as other local, state and federal units of government, in their efforts to fulfill federal, state, and local hazard mitigation planning responsibilities; to promote pre and post disaster mitigation measures, short/long range strategies that minimize suffering, loss of life, and damage to property resulting from hazardous or potentially hazardous conditions to which citizens and institutions within the county are exposed; and to eliminate or minimize conditions which would have an undesirable impact on our citizens, economy, environment, or the well-being of the County. This plan will aid city, township, and county agencies and officials in enhancing public awareness to the threat hazards have on property and life, and what can be done to help prevent or reduce the vulnerability and risk of each County jurisdiction. USE OF PLAN
The plan will be used to help the county and communities and their elected and appointed officials:
Plan, design and implement programs and projects that will help reduce their community’s vulnerability to natural hazards
Facilitate inter-jurisdictional coordination and collaboration related to natural hazard mitigation planning and implementation.
Develop or provide guidance for local emergency response planning.
Be compliant with the Disaster Mitigation Act of 2000. SCOPE OF PLAN
Provide opportunities for public input and encourage participation and involvement regarding the mitigation plan.
Identify hazards and vulnerabilities within the county and local jurisdictions.

Codington County Pre-Disaster Mitigation Plan 10-12-12 Page 4
Combine risk assessments with public and emergency management ideas.
Develop goals based on the identified hazards and risks.
Review existing mitigation measures for gaps and establish projects to sufficiently fulfill the goals.
Prioritize and evaluate each strategy/objective.
Review other plans for cohesion and incorporation with the PDM.
Establish guidelines for updating and monitoring the plan.
Present the plan to the Codington County Commissioners and the participating communities within the county for adoption.
WHAT IS HAZARD MITIGATION? Hazard mitigation is defined as any cost-effective action(s) that has the effect of reducing, limiting, or preventing vulnerability of people, property, and the environment to potentially damaging, harmful, or costly hazards. Hazard mitigation measures, which can be used to eliminate or minimize the risk to life and property, fall into three categories. First are those that keep the hazard away from people, property, and structures. Second are those that keep people, property, and structures away from the hazard. Third are those that do not address the hazard at all but rather reduce the impact of the hazard on the victims such as insurance. This mitigation plan has strategies that fall into all three categories. Hazard mitigation measures must be practical, cost effective, and environmentally and politically acceptable. Actions taken to limit the vulnerability of society to hazards must not in themselves be more costly than the value of anticipated damages. The primary focus of hazard mitigation actions must be at the point at which capital investment decisions are made and based on vulnerability. Capital investments, whether for homes, roads, public utilities, pipelines, power plants, or public works, determine to a large extent the nature and degree of hazard vulnerability of a community. Once a capital facility is in place, very few opportunities will present themselves over the useful life of the facility to correct any errors in location or construction with respect to hazard vulnerability. It is for these reasons that zoning and other ordinances, which manage development in high vulnerability areas, and building codes, which ensure that new buildings are built to withstand the damaging forces of hazards, are often the most useful mitigation approaches a jurisdiction can implement. Previously, mitigation measures have been the most neglected programs within emergency management. Since the priority to implement mitigation activities is generally low in comparison to the perceived threat, some important mitigation measures take time to implement. Mitigation success can be achieved, however, if accurate information is portrayed through complete hazard identification and impact studies, followed by effective mitigation management. Hazard mitigation is the key to eliminating long-term risk to people and property in South Dakota from hazards and their effects. Preparedness for all hazards includes: response and recovery plans, training, development, management of resources, and mitigation of each jurisdictional hazard. This plan evaluates the impacts, risks and vulnerabilities of natural hazards within the jurisdictional area of the entire county. The plan supports, provides assistance, identifies and describes mitigation projects for each of the local jurisdictions who participated in the plan update. The suggested actions and plan implementation for local governments could reduce the impact of future natural hazard occurrences. Lessening the impact of natural hazards can prevent such occurrences from becoming disastrous, but will only be accomplished through

Codington County Pre-Disaster Mitigation Plan 10-12-12 Page 5
coordinated partnership with emergency managers, political entities, public works officials, community planners and other dedicated individuals working to implement this program.
CODINGTON COUNTY PROFILE Population Codington County is in northeastern South Dakota. The county has a geographic area of 720 square miles and its Census 2010 population was 27,227, which averages to 37.8 persons per square mile. Just over fifteen percent of the population is older than age 65. Education levels of persons include eighty-eight percent high school graduates and twenty-two percent college level. The county seat is Watertown, which is situated at the intersection of US Highway 81 and US Highway 212. Table 1.1 shows the population and number of housing units of the county’s municipalities. Table 1.2 lists the seventeen County Townships by population. The County has continued to experience population growth since 1930. This is due primarily to the growth of the City of Watertown, which serves as the governmental, employment and trade center for the county and region.
Table 1.1: Codington County Municipalities
Name Population Location Elevation Housing Units
Florence 374 45 03' 20'' N 97 19' 34'' W
1,768 feet 146
Henry 267 44 52' 51'' N 97 27' 46'' W
1,790 feet 106
Kranzburg 172 44 53' 11'' N 96 54' 36'' W
1,960 feet 64
South Shore 225 45 06' 06'' N 96 55' 49'' W
1,980 feet 99
Wallace 85 45 05' 06'' N 97 28' 39'' W
1,770 feet 42
Watertown 21,482 44 54' 45'' N 97 10' 00'' W
1,739 feet 10,050
Unincorporated Areas
4,622 44 57' 30'' N 97 11' 11'' W
1,890
Codington County 27,227 44 57' 30'' N 97 11' 11'' W
12,397
Source: 2010 Census, www.Lat-Long.com, www.usbeacon.com

Codington County Pre-Disaster Mitigation Plan 10-12-12 Page 6
Table 1.2: Codington County Townships
Township Population Township Population
Dexter 194 Lake 646
Eden 98 Leola 74
Elmira 442 Pelican 718
Fuller 281 Phipps 75
Germantown 165 Rauville 282
Graceland 105 Richland 154
Henry 94 Sheridan 433
Kampeska 321 Waverly 189
Kranzburg 351 Source: 2010 Census
Figure 1.1 Political Map

Codington County Pre-Disaster Mitigation Plan 10-12-12 Page 7
Social and Economic Description
The County’s economy is dependent upon its agricultural and manufacturing sectors. Most non-agricultural employment is in manufacturing, education, health care, or service industries. Watertown is the governmental, employment and retail hub for the county and region. The remaining rural communities in the County serve as bedroom communities to Watertown and provide “small town” atmosphere to those residents. A large majority of the residents within these communities commute to Watertown or other employment centers. Most of the communities have limited retail and service sectors which provide basic needs to its residents. Florence, Henry, and the unincorporated community of Waverly also have K-12 elementary/secondary schools. Unemployment rates in South Dakota have slowly declined over the last five years to around
3%, while Codington County has an estimated 4.2% unemployment rate over the last five years.
According to the 2010 Census 12.7% of the population of Codington County falls below the
poverty line. The City of Watertown is the largest community in Codington County. Watertown
serves as the county seat and retail hub of the county. Most of the smaller communities in
Codington County serve as bedroom communities and have limited retail and service sectors
which provide basic needs to their residents.
Physical Description and Climate
A majority of the land area within the County is very lightly settled (less than 7 persons per square mile in the unincorporated areas of the county) with most of the land consisting of grassland, pasture and cropland. The topography of the County is mostly flat to undulating. The County’s elevation has a range of approximately 1,740 feet above sea level to approximately 1,980 feet above sea level. The northeast corner of the county drains to the east, through the North Fork of the Yellow Bank River, and then into the Minnesota River. The remainder of the county drains into the Big Sioux River which divides the county: approximately forty percent lies east of the river and sixty percent to the west. The valley of the Big Sioux River is a gently undulating outwash from two to twelve miles wide. It is not uncommon for the Big Sioux River to experience minimum stream flow in the County during some winter and late summer months. Conversely, during wet years, the Big Sioux can accumulate enough moisture so as to cause flooding conditions, as was the case in 1997, 2001 and 2011. The headwaters for the Big Sioux River are found approximately forty miles north of the County. The river flows in a southerly direction. Contained within the drainage pattern are twenty-one meandered lakes including Lake Pelican and Lake Kampeska. Lake Kampeska has approximately 5,000 surface acres. The County’s climate is considered Mid-Continental with hot summers and cold winters. Normal summer temperatures are eighty degrees Fahrenheit and winter temperature twenty-one degrees (about twelve degrees in January). Average annual precipitation is twenty inches (approximately eighty percent of the precipitation falls between the months of April and September), and the average annual snowfall is twenty-four inches, although as much as eighty inches and as little as five inches have fallen annually. Due to the strong winds that usually accompany the snowfall, it is common to find open fields bare while snow piles up in the sheltered areas.

Codington County Pre-Disaster Mitigation Plan 10-12-12 Page 8
Transportation and Utility Infrastructure The County has a total of one thousand one hundred thirty-two (1,132) total miles of roads split amongst one interstate, I-29, two federal highways, US 81 & US 212, one state highway, SD 20, its county highways, as well as the road systems in seventeen townships and eight towns (6 incorporated, 2 unincorporated). The high pressure large diameter Northern Border Natural Gas line, and Magellan gas line pass through the county along with many high tension power lines, both AC and DC circuits. Figure 1.1 shows the county’s municipalities and road network. The Burlington Northern Santé Fe railroad runs from the northeast corner of the county to the southwest. The City of Watertown has a commercial service airport. Commercial Service Airports are publicly owned airports that boarded at least 2,500 passengers each calendar year and receive scheduled passenger service. The cities of Watertown and South Shore have their own water systems, while Sioux Rural Water, Clark Rural Water and Grant-Roberts water systems serve rural households in the county, including the residents of Florence, Henry, Kranzburg, South Shore, and Wallace. Watertown’s water comes from well fields located a few miles north of the city. Regarding wastewater disposal, all of the municipalities within the County have municipal wastewater collection and treatment systems. Rural residences rely on individual septic tanks and drainfields. The density of septic systems and their potential to cause water contamination is an environmental concern. Although residential growth is not expected to be significant in the county, new developments need to be controlled through planning and development guidelines. Electric power is provided to rural county residents and people in the communities by the Codington-Clark Electric Cooperative, Northwestern Energy and Otter Tail Power. Watertown operates its own municipal power system. The primary telephone companies serving the County’s rural population are ITC Telecommunications and RC Technologies. Cellular phone service is available in most parts of the county, but there are still places in the county where signals are weak. Medical and Emergency Services The primary medical facility in the county is the Prairie Lakes Health Care System, a regional health care facility which has an eighty-one bed maximum capacity. The facility has the capacity to provide basic services, emergency procedures, critical care and other advanced services. Watertown has full-time fire and ambulance department. Florence, Henry, and South Shore have fully operational fire departments. All three departments are staffed by volunteers, and respond to both structural and wildland fires. South Shore also has an ambulance service.

Codington County Pre-Disaster Mitigation Plan 10-12-12 Page 9
CHAPTER 2 PREREQUISITES
ADOPTION BY LOCAL GOVERNING BODY The local governing body that oversees the update of the Codington County Pre-Disaster Mitigation Plan is the Codington County Board of Commissioners. The Commission has tasked the Codington County Emergency Management Office with the responsibility of ensuring that the PDM is compliant with Federal Emergency Management Agency (FEMA) Guidelines and corresponding regulations.
MULTI-JURISDICTIONAL PLAN PARTICIPATION Requirement 201.6(c)(5). Local Mitigation Plan Review Tool – E2.
Requirement 201.6(c)(5). Local Mitigation Plan Review Tool – E1.
This plan is a multi-jurisdictional plan which serves the entire geographical area located within the boundaries of Codington County, South Dakota. The County has six incorporated municipalities. All of the incorporated municipalities located within the County elected to participate in the planning process and the update of the existing PDM. The participating local jurisdictions include the following municipalities:
Table 2.1: Plan Participants
Continuing Participants Do Not Participate*
Florence Kampeska Village
Henry Grover Village
Kranzburg Rauville Village
South Shore Waverly Village
Wallace All 17 Townships
Watertown
Codington County *All villages and townships were represented at the 2017 Annual Codington County Townships Meeting and are eligible to benefit from future mitigation projects identified by the County.
All of the non-participants are unincorporated communities with very small populations (50 people or less) with the exception of Kampeska. Kampeska is located 5.5 miles west of Watertown (1 mile southwest of Lake Kampeska) with an estimated population of 100. Grover is located 7.5 miles southwest of Watertown and has an estimated population of twelve. Rauville is located 3.5 miles north of Watertown and has an estimated population of twelve. Waverly is located 7 miles northeast of Watertown and has an estimated population of thirty-seven. While none of the unincorporated communities directly participated in the PDM update, they were represented by their local Township Officials at a meeting in 2017.
Codington County Pre-Disaster Mitigation Plan 10-12-12 Page 10
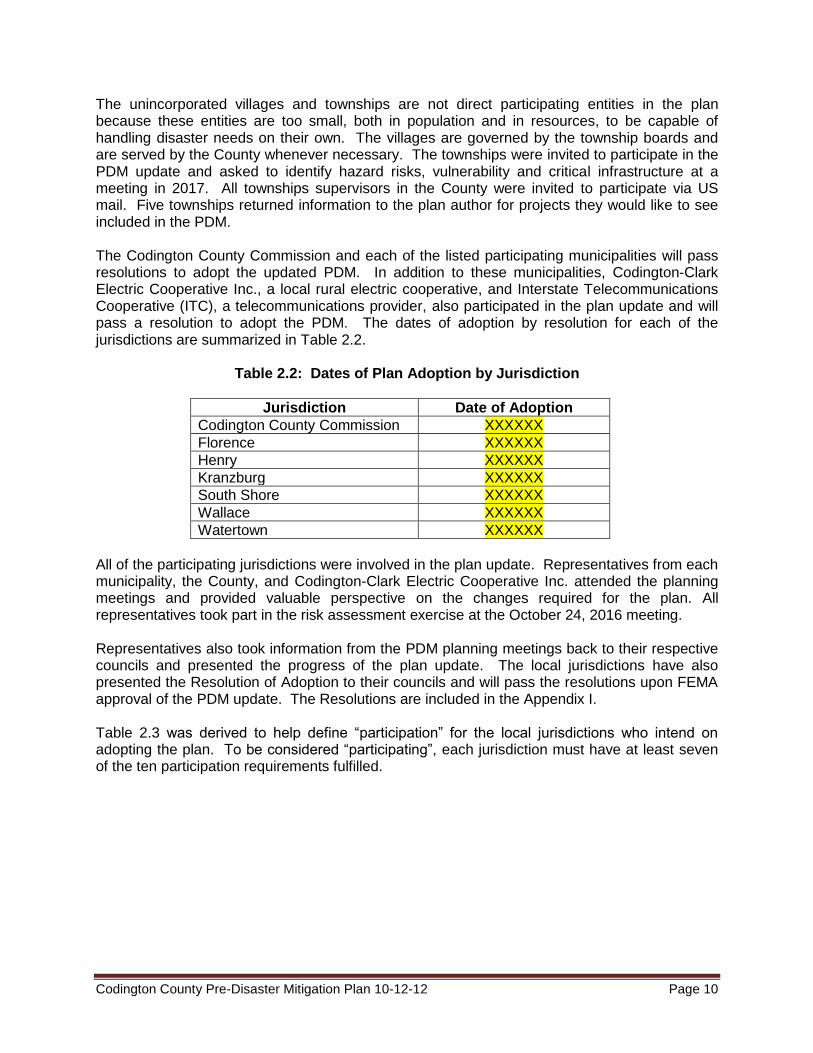
The unincorporated villages and townships are not direct participating entities in the plan because these entities are too small, both in population and in resources, to be capable of handling disaster needs on their own. The villages are governed by the township boards and are served by the County whenever necessary. The townships were invited to participate in the PDM update and asked to identify hazard risks, vulnerability and critical infrastructure at a meeting in 2017. All townships supervisors in the County were invited to participate via US mail. Five townships returned information to the plan author for projects they would like to see included in the PDM. The Codington County Commission and each of the listed participating municipalities will pass resolutions to adopt the updated PDM. In addition to these municipalities, Codington-Clark Electric Cooperative Inc., a local rural electric cooperative, and Interstate Telecommunications Cooperative (ITC), a telecommunications provider, also participated in the plan update and will pass a resolution to adopt the PDM. The dates of adoption by resolution for each of the jurisdictions are summarized in Table 2.2.
Table 2.2: Dates of Plan Adoption by Jurisdiction
Jurisdiction Date of Adoption
Codington County Commission XXXXXX
Florence XXXXXX
Henry XXXXXX
Kranzburg XXXXXX
South Shore XXXXXX
Wallace XXXXXX
Watertown XXXXXX
All of the participating jurisdictions were involved in the plan update. Representatives from each municipality, the County, and Codington-Clark Electric Cooperative Inc. attended the planning meetings and provided valuable perspective on the changes required for the plan. All representatives took part in the risk assessment exercise at the October 24, 2016 meeting. Representatives also took information from the PDM planning meetings back to their respective councils and presented the progress of the plan update. The local jurisdictions have also presented the Resolution of Adoption to their councils and will pass the resolutions upon FEMA approval of the PDM update. The Resolutions are included in the Appendix I. Table 2.3 was derived to help define “participation” for the local jurisdictions who intend on adopting the plan. To be considered “participating”, each jurisdiction must have at least seven of the ten participation requirements fulfilled.

Codington County Pre-Disaster Mitigation Plan 10-12-12 Page 11
Table 2.3: Record of Participation
Nature of
Participation Florence Henry Kranzburg
South Shore
Wallace Watertown Codington
County
Attended Meetings or work sessions (a minimum of 1 meetings will be considered satisfactory).
Submitted inventory and summary of reports and plans relevant to hazard mitigation.
Submitted the Risk Assessment Worksheet.
Submitted description of what is at risk (including local critical facilities and infrastructure at risk from specific Hazards worksheet)
Submitted a description or map of local land-use patterns (current and proposed/expected).
Developed goals for the community.
Developed mitigation actions with an analysis/explanation of why those actions were selected.
Prioritized actions emphasizing relative cost-effectiveness.
Reviewed and commented on draft Plan.
Hosted opportunities for public involvement (allowed time for public comment at a minimum of 2 city council meetings after giving a status report on the progress of the PDM update)
Requirement Met
Requirement Not Met

Codington County Pre-Disaster Mitigation Plan 10-12-12 Page 12
CHAPTER 3 PLANNING PROCESS
BACKGROUND The effort that led to the development of this plan is part of the larger, integrated approach to hazard mitigation planning in South Dakota that is led by the South Dakota Office of Emergency Management. Production of the plan was the ultimate responsibility of the Codington County Emergency Management Director, who served as the county’s point of contact for all activities associated with this plan. Input was received from the PDM Planning Team that was put together by the Emergency Management Director and whose members are listed below in Table 3.1. The plan itself was written by an outside contractor, First District Association of Local Governments (First District) of Watertown, South Dakota, one of the state’s six regional planning entities. The office has an extensive amount of experience in producing various kinds of planning documents, including municipal ordinances, land use plans, and zoning ordinances, and it is an acknowledged leader in geographic information systems (GIS) technology in South Dakota. First District assisted the County in the development of the county’s original PDM in 2004. The following staff members of the First District Association of Local Governments were involved in the production of the plan. Todd Kays, Executive Director, Luke Muller, Planner, and Ted Haeder, Economic Development Officer were the project managers of the plan. Kays, Muller, and Haeder attended the PDM Planning Team meetings as the plan was being developed. Also assisting was Amy Arnold, Geographic Information Systems Specialist, who produced all the maps for the plan, directed the floodplain risk analysis (see next section), and completed the county land cover analysis discussed in the previous chapter. Several other individuals at the state level provided additional support and information that was quite useful. They include: Jim Poppen, South Dakota State Hazard Mitigation Officer – provided guidance and direction as the plan was being developed. Marc Macy, South Dakota State National Flood Insurance Program Coordinator – provided classification and information regarding value and number of flood insurance policies and claims. South Dakota State Fire Marshall Office – provided information on fire in the county. Tim Schaal, South Dakota State Dam Inspector – provided information on hazardous dams located in the county. DOCUMENTATION OF THE PLANNING PROCESS Requirement 201.6(b)(2). Local Mitigation Plan Review Tool – A2.
Methodology
Mitigation planning is a process that communities use to identify policies, activities, and tools to implement mitigation actions. The process that was used to develop this plan consisted of the following steps:

Codington County Pre-Disaster Mitigation Plan 10-12-12 Page 13
Planning Framework
Risk Identification and Assessment
Mitigation Strategy
Review of Plan
Plan Adoption and Maintenance Planning Framework The planning framework component identified five objectives:
Develop Plan to Plan;
Establish PDM Planning Team;
Define Scope of the Plan;
Identify Governmental Entities/Stakeholders; and
Establish PDM Planning Team Prior to receiving funding public meetings were held at the Codington County Courthouse to inform the public about the required PDM update. Funding from FEMA and the South Dakota Office of Emergency Management to prepare the mitigation plan was received by the county in October 2010. Once funding was secured, the Codington County Emergency Management Director and the First District acted as the PDM Planning Team began to discuss the strategy to be used to develop the plan. The first task was to identify those entities/stakeholders that would have direct and indirect interests in the update of the PDM.
Prior to the first public informational meeting, the Chairman of the Codington County Commissioners and Codington County Emergency Management Director wrote letters to all the stakeholders, community organizations, municipalities, townships, utility providers and emergency responders and concerned residents who might wish to volunteer their time and serve on a committee, and to those who would act as a resource for the PDM Planning Team. The letters included a brief description of the PDM. Public input was solicited via notices regarding the PDM planning process in local media outlets and via the Internet.
Each individual who was contacted for the PDM Planning Team had at least one of the following attributes to contribute to the planning process:
Significant understanding of how hazards affect the county and participating jurisdictions.
Substantial knowledge of the county’s infrastructure system.
Resources at their disposal to assist in the planning effort, such as maps or data on past hazard events.
Table 3.1 lists the PDM Planning Team members, and it includes their attendance at the planning meetings, all of which were open to the public, that were held as the plan was being developed. An agenda was sent out to the PDM Planning Team prior to each meeting, and the meeting minutes were sent to them afterward to keep everybody informed of what was discussed and any decisions that were made.

Codington County Pre-Disaster Mitigation Plan 10-12-12 Page 14
Table 3.1: Participation in Plan Development
Last
Name First Name
Entity Represented Meeting Attendance
Meeting
1 Meeting
2 Meeting
3
Meeting 4
Atyeo Dave SD Dept of Transportation
Boehnke Arlen Henry School District
Callan Pat Town of Florence
Drake Tom City of Watertown
Eide Dave Codington Clark Electric Co-op
Froke Randy Town of Henry
Fuller Dave Henry Fire Dept.
Goodall Kelby Henry Fire Dept.
Goodall Toni Henry Fire Dept.
Hallauer Joyce Prairie Lakes Hospital
Herbeck Jason Prairie Lakes Hospital
Howell Brad Codington Co. Sheriff
Johnson Bob Codington/Clark Electric
Johnson Paul SDSU Extension
Kays Todd First District Association of Local Governments
Karnopp Marty Codington County EM
Kranz Kevin Town of Kranzburg
Kranz Doug Watertown Fire Dept.
Marquardt Lavern Codington County Commissioner/LEPC
McMahon Scott Watertown Police Dept.
Meier Mark Watertown Municipal Utilities
Muller Luke First District Association of Local Governments
Olson Chuck ITC
Small Rick Codington Co. Highway
Stacey Darrell Watertown School District
Sutton Jim Codington County EM
Van Sickle Gordon Town of Henry
Wall Greg South Shore Fire Dept.
Zaug Dave Codington Clark Electric Co-op
Leadership and guidance in the planning effort and at the planning meetings was provided by the First District staff and the Codington County Emergency Management Director. An agenda was distributed to each PDM Planning Team member prior to each meeting, but free-flowing discussion was always encouraged. When PDM Planning Team members had questions about

Codington County Pre-Disaster Mitigation Plan 10-12-12 Page 15
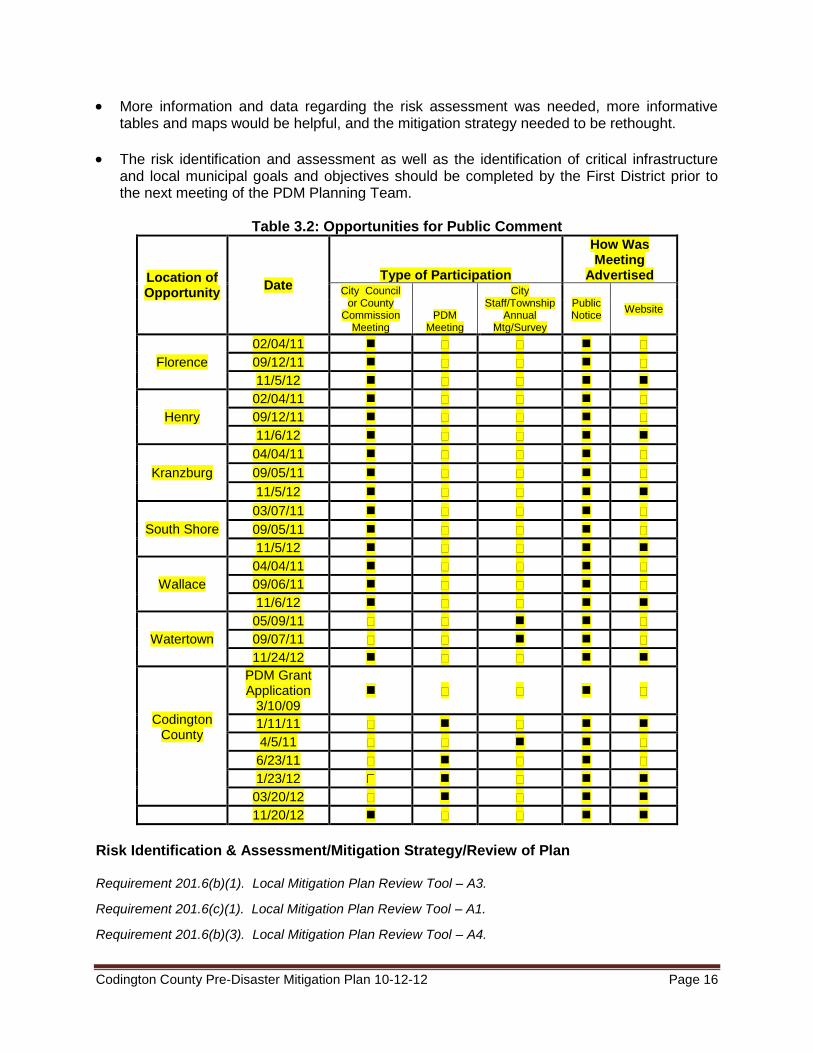
a topic of discussion, either First District staff or the Emergency Management Director would step in. Generally speaking, the planning process associated with the plan’s development was relaxed and informal. No subcommittees were formed, and all decisions were made by mutual consensus of the PDM Planning Team members - no votes were taken or motions made. Everyone’s opinion was respected, nobody was discouraged from voicing their opinion, and no one was made to feel any less important than anyone else. As the PDM Planning Team was being assembled, arrangements were made for the first PDM Planning Team meeting, which took place at the First District Association of Local Governments office on October 24, 2016. An agenda was distributed to prospective PDM Planning Team members. Appendix A, B, and C include a copies of each meeting agenda, the signup sheet from each meeting, and the minutes from each meeting. Those who attended the October meeting for the PDM update were asked to volunteer to serve on the PDM Planning Team. The PDM Planning Team was tasked with fostering coordination between the various entities involved; reviewing the drafts and providing comments after First District Association of Local Governments staff initiated changes to the existing plan. There were no external contributors such as contractors or private businesses, other than Codington-Clark Electric Cooperative Inc. and ITC. Each of the local jurisdictions had a member of their respective councils represent the municipalities in the plan. The representatives from the municipalities were asked to share the progress of the plan at their council meetings and to ensure that those attending the council meetings were aware that they are invited to make comments on and participate in the process of updating the new plan. Comments provided by local residents at the city council and PDM Planning Team meetings were collected and incorporated into the plan. The public was provided several opportunities to comment on the plan during the drafting stages at the PDM Planning Team Meetings, Codington County Townships’ Annual Meeting and City Council Meetings. There were several work sessions and public hearings held to keep the public updated and involved in the plan, however, there was no public comment on the plan from the public that attended the meetings. Those who were most involved were the representatives PDM Planning Team and representatives from the municipalities. The municipalities put the PDM update on the agenda at their council meetings and allowed people to comment at the meetings. Table 3.2 identifies the location and date of each opportunity that was provided for the public to comment and how it was advertised. The first meeting of the PDM Planning Team served to introduce the participants to the concept of mitigation planning; why the plan was being updated and how the process would proceed in the months to come (scheduling, assigning responsibilities, etc.). The meeting also included a review of the existing plan, which led to two important decisions. First, it was the consensus opinion of the PDM Planning Team that a comprehensive rewrite of the plan would be needed. The PDM Planning Team decided that:
The 2012 PDM included all of the necessary requirements found in the most recent crosswalk provided by FEMA. Thus, to ensure that the updated plan included everything required by the crosswalk, the PDM Planning Team and community meetings used the crosswalk to guide the discussions.
Codington County Pre-Disaster Mitigation Plan 10-12-12 Page 16
More information and data regarding the risk assessment was needed, more informative tables and maps would be helpful, and the mitigation strategy needed to be rethought.
The risk identification and assessment as well as the identification of critical infrastructure and local municipal goals and objectives should be completed by the First District prior to the next meeting of the PDM Planning Team.
Table 3.2: Opportunities for Public Comment
Location of Opportunity
Date Type of Participation
How Was Meeting
Advertised City Council
or County Commission
Meeting PDM
Meeting
City Staff/Township
Annual Mtg/Survey
Public Notice
Website
Florence
02/04/11 09/12/11 11/5/12
Henry
02/04/11 09/12/11 11/6/12
Kranzburg
04/04/11 09/05/11 11/5/12
South Shore
03/07/11 09/05/11 11/5/12
Wallace
04/04/11 09/06/11 11/6/12
Watertown
05/09/11 09/07/11 11/24/12
Codington County
PDM Grant Application
3/10/09
1/11/11
4/5/11 6/23/11 1/23/12
03/20/12 11/20/12
Risk Identification & Assessment/Mitigation Strategy/Review of Plan Requirement 201.6(b)(1). Local Mitigation Plan Review Tool – A3.
Requirement 201.6(c)(1). Local Mitigation Plan Review Tool – A1.
Requirement 201.6(b)(3). Local Mitigation Plan Review Tool – A4.
Codington County Pre-Disaster Mitigation Plan 10-12-12 Page 17
Requirement 201.6(b)(2). Local Mitigation Plan Review Tool – A2.
The Risk Identification and Assessment component identified three objectives: Collect and Organize Data, Develop GIS Data, and Analyze Data. The Mitigation Strategy component identified five objectives: Review Existing PDM and other plans Formation of Goals/Objectives, Compile existing resources to accomplish goals/objectives, Public review of Goals/Objectives, and PDM Planning Team Review of goals/objectives. The Review of PDM component identified three objectives: Writing of PDM, Public Review of PDM, PDM Planning Team Review of PDM. Prior to the second PDM Planning Team meeting, First District Staff met with the participating municipalities, Codington County Townships, City and County staffs, Codington-Clark Electric Cooperative Inc., and ITC at public noticed meetings to identify hazards and critical facilities, assess vulnerability, discuss development trends, and develop mitigation goals. Meeting dates are referenced in Table 3.2. First District staff also conducted research regarding the history of disaster events in the county, including events that had occurred since the original plan was developed. First District also conducted a technical review of existing documents. This review incorporated existing plans, studies, reports, technical information, zoning and flood damage prevention ordinances into the PDM Update. It should be noted that most of the planning documents of each of the communities had been previously developed by the First District. However, some of the smaller communities did not have such planning documents. Additionally, the 2012 PDM was used as a resource for the new plan because most of the natural hazard profile research had already been completed when it was drafted. In addition to the 2012 PDM, the First District reviewed several other existing documents including but not limited to the State of South Dakota Hazard Mitigation Plan, Codington County Hazardous Materials Plan, and Flood Insurance Rate Maps for the local jurisdictions. A summary of the technical review and incorporation of existing plans is included in Table 3.3. Risk Identification/Assessment was discussed at the PDM Planning Team meeting in October 2016. First District staff reviewed the hazards identified in the State of South Dakota Hazard Mitigation Plan and that risk assessment portion of the existing PDM. First District staff also provided an overview of the information regarding Critical Facilities, Risk Identification, Hazard Vulnerability and mitigation goals identified by the County’s municipalities. The list of hazards that the PDM Planning Team decided to focus on is presented in Chapter 4. A profile of each of the hazards was begun at this meeting. The profile included information from each of the participating jurisdictions about how the hazard affected their community. Discussion also occurred regarding the existing strategies being used to mitigate each hazard, with a particular emphasis on the critical and essential facilities in each community. The PDM Planning Team also dealt with the Mitigation Strategy at the October 2016 meeting. Formation of the strategy began with a review of the results of the risk assessment, which led to discussion about the goals to be achieved with the mitigation plan. The list of goals is included in Chapter 5.

Codington County Pre-Disaster Mitigation Plan 10-12-12 Page 18
At the third meeting in January 2012 the PDM Planning Team reviewed the updates prepared by the First District and discussed specific mitigation actions. The PDM Planning Team began by reviewing the list of proposed actions included in the previous mitigation plan and discussion followed about the progress that had been made on implementing the actions. Specific mitigation actions recently identified by the participating jurisdictions were also discussed. The rest of the meeting was spent prioritizing the mitigation actions and discussing how the plan would be implemented. It was emphasized that cooperation between the county and the participating jurisdictions was especially important, and discussion occurred about how this could best be achieved. Representatives from the jurisdictions were made aware of the critical role they needed to play to ensure the success of the mitigation strategy, such as implementing specific mitigation actions. The Emergency Management Director emphasized the importance of ensuring that no local decisions be made or actions taken contrary to the goals of this plan. Also, responsible parties were identified for reporting on progress being made to implement the proposed mitigation actions, for evaluating the plan’s overall effectiveness, and for getting the public more involved in the planning process. At the end of the meeting the First District was instructed to conduct an internal review of the document and forward the document to the South Dakota Office of Emergency Management for their review and comment. The draft plan was also to be posted on the First District Association of Local Governments and Codington County websites and emailed to all of the participants and to the emergency managers in the neighboring counties of: Clark, Day, Grant, and Hamlin. Everyone who received an email copy of the plan draft was allowed forty-five days to comment on the draft. A fourth and final meeting of the PDM Planning Team was subsequently held in March 2012 to review and discuss final draft as amended based upon comments from the State. At the meeting the PDM Planning Team recommended that the plan be submitted to FEMA. The final draft of the plan was again posted on the First District Association of Local Governments and Codington County websites and emailed to all of the participants.

Codington County Pre-Disaster Mitigation Plan 10-12-12 Page 19
NA The jurisdiction does not have this program/policy/technical document O The jurisdiction has the program/policy/technical document, but did not review/incorporate it in the mitigation plan C The jurisdiction is regulated under the County’s policy/program/technical document\
The jurisdiction reviewed the program/policy/technical document
Table 3.3: Record of Review (Summary)
Existing Program/Policy/Technical
Documents
Local Jurisdiction
Florence Henry Kranzburg South Shore Wallace Watertown
Codington County
Comprehensive Plan NA
Flood Damage Prevention Ordinance
NA NA NA NA
Flood Insurance Studies or Engineering studies for streams
NA
NA
NA
NA
Hazard Vulnerability Analysis (by the local Emergency Management Agency)
C C C C C C C
Emergency Operations Plan NA NA NA NA NA
Zoning Ordinance NA
Building Code NA NA NA NA NA NA
Drainage Ordinance NA NA NA NA NA NA
Critical Facilities maps
Existing Land Use maps NA
Elevation Certificates NA NA NA NA NA
State Hazard Mitigation Plan
HAZUS NA NA NA NA NA NA NA
Codington County Pre-Disaster Mitigation Plan 10-12-12 Page 20
CHAPTER 4 RISK ASSESSMENT
IDENTIFICATION OF HAZARDS Requirement 201.6(c)(2)(i). Local Mitigation Plan Review Tool – B1.
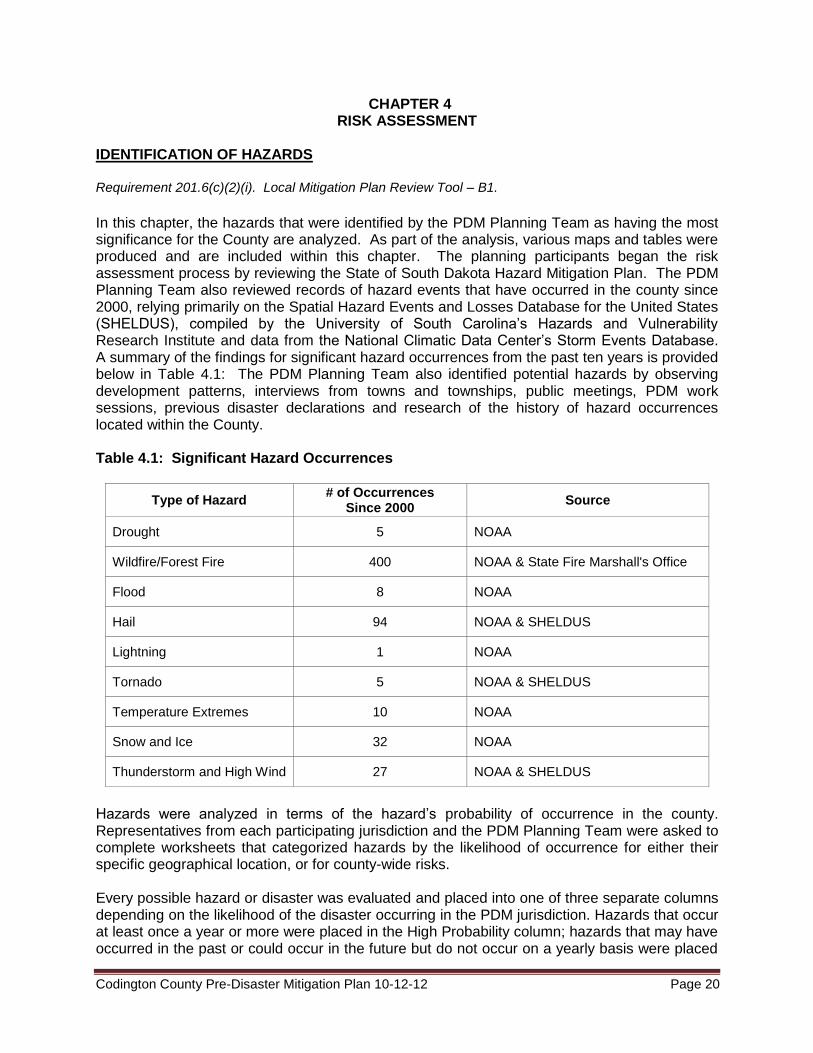
In this chapter, the hazards that were identified by the PDM Planning Team as having the most significance for the County are analyzed. As part of the analysis, various maps and tables were produced and are included within this chapter. The planning participants began the risk assessment process by reviewing the State of South Dakota Hazard Mitigation Plan. The PDM Planning Team also reviewed records of hazard events that have occurred in the county since 2000, relying primarily on the Spatial Hazard Events and Losses Database for the United States (SHELDUS), compiled by the University of South Carolina’s Hazards and Vulnerability Research Institute and data from the National Climatic Data Center’s Storm Events Database. A summary of the findings for significant hazard occurrences from the past ten years is provided below in Table 4.1: The PDM Planning Team also identified potential hazards by observing development patterns, interviews from towns and townships, public meetings, PDM work sessions, previous disaster declarations and research of the history of hazard occurrences located within the County. Table 4.1: Significant Hazard Occurrences
Type of Hazard # of Occurrences
Since 2000 Source
Drought 5 NOAA
Wildfire/Forest Fire 400 NOAA & State Fire Marshall's Office
Flood 8 NOAA
Hail 94 NOAA & SHELDUS
Lightning 1 NOAA
Tornado 5 NOAA & SHELDUS
Temperature Extremes 10 NOAA
Snow and Ice 32 NOAA
Thunderstorm and High Wind 27 NOAA & SHELDUS
Hazards were analyzed in terms of the hazard’s probability of occurrence in the county. Representatives from each participating jurisdiction and the PDM Planning Team were asked to complete worksheets that categorized hazards by the likelihood of occurrence for either their specific geographical location, or for county-wide risks. Every possible hazard or disaster was evaluated and placed into one of three separate columns depending on the likelihood of the disaster occurring in the PDM jurisdiction. Hazards that occur at least once a year or more were placed in the High Probability column; hazards that may have occurred in the past or could occur in the future but do not occur on a yearly basis were placed

Codington County Pre-Disaster Mitigation Plan 10-12-12 Page 21
in the low probability column; and hazards or disasters that have never occurred in the area before and are unlikely to occur in the PDM jurisdiction any time in the future were placed in the Unlikely to Occur column. While man-made hazards were listed on the worksheets and discussed briefly during the completion of the worksheets, the PDM Planning Team decided to eliminate man-made hazards from the PDM because those types of hazards are difficult to predict and assess due to wide variations in the types, frequencies, and locations. Types and scopes of manmade hazards are unlimited. Due to the topographical features of the County and the nature of the natural hazards that affect the geographical area covered by this PDM, most areas of the county have similar likelihood of being affected by the natural hazards identified. Only the natural hazards from the High Probability and Low Probability Columns will be further evaluated throughout this plan, with an emphasis on the High Probability hazards. All manmade hazards and hazards in the Unlikely to Occur column will not be further evaluated in the plan. Table 4.2 is an adjusted list of hazards produced from the FEMA worksheets completed by each participating jurisdiction and the PDM Planning Team. Table 4.2: Hazards Categorized by Likelihood of Occurrence
TYPES OF NATURAL HAZARDS IN THE PDM JURISDICTION AREA Requirement 201.6(c)(2)(i). Local Mitigation Plan Review Tool – B1.
Some descriptions of the natural hazards likely to occur in the County were taken directly from the 2012 Codington County PDM. Some were revised for better clarity. For the purpose of consistency throughout the plan, additional definitions were included to reflect all of the hazards
High Probability Low Probability Unlikely to Occur
Extreme Cold Aircraft Accident** Avalanche
Extreme Heat Biological** Civil Disorder
Flood Communication
Disruption** Coastal Storm
Freezing Rain/Sleet/Ice Drought Dam Failure
Hail Hazardous Material** Earthquake***
Heavy Rain Ice Jam Hurricane
Heavy Snow Tornado Landslide
Lightning Transportation** National Emergency
Rapid Snow Melt Urban Fire Radiological
Strong Winds Wild Fire Subsidence
Thunderstorm Volcanic Ash
Utility Interruption** Volcanic Explosion
** Aircraft accidents, biological, hazardous material, transportation, utility interruptions and communication disruption are not natural hazards but often occur as a result of natural hazards such as ice storms and strong winds. ***Earthquakes are marked with an asterisk because they occur but are so small that the effects are minimal. Thus, mitigation measures specifically for earthquakes are not a priority.

Codington County Pre-Disaster Mitigation Plan 10-12-12 Page 22
that have a chance of occurring in the area and all of the hazards are alphabetized. For all of the hazards identified the probability of future occurrence is expected to be the same for all of the jurisdictions covered in the PDM. Blizzards are a snow storm that lasts at least three hours with sustained wind speeds of thirty-five miles per hour (mph) or greater, visibility of less than one-quarter mile, temperatures lower than 20°F and white out conditions. Snow accumulations vary, but another contributing factor is loose snow existing on the ground which can get whipped up and aggravate the white out conditions. When such conditions arise, blizzard warnings or severe blizzard warnings are issued. Severe blizzard conditions exist when winds obtain speeds of at least forty-five mph plus a great density of falling or blowing snow and a temperature of 10°F or lower. Drought is an extended period of months or years when a region notes a deficiency in its water supply. Generally, this occurs when a region receives consistently below average precipitation. It can have a substantial impact on the ecosystem and agriculture of the affected region. Although droughts can persist for several years, even a short, intense drought can cause significant damage and harm the local economy. This global phenomenon has a widespread impact on agriculture. Dam Failure Dams function to serve the needs of flood control, recreation, and water management. During a flood, a dam’s ability to serve as a control agent may be challenged. An excessive amount of water may result in a dam breach, simply an overflowing. Dams that are old or unstable, dams that receive extreme amounts of water, or dams that get debris pile-up behind their face may result in dam failure, a cracking and/or breaking. The County has two dams, with neither of the dams having the potential to endanger lives and damage property. Earthquakes are a sudden rapid shaking of the earth caused by the shifting of rock beneath the earth's surface. Earthquakes can cause buildings and bridges to collapse, disrupt gas, electric and phone lines, and often cause landslides, flash floods, fires, avalanches, and tsunamis. Larger earthquakes usually begin with slight tremors but rapidly take the form of one or more violent shocks, and are followed by vibrations of gradually diminishing force called aftershocks. The underground point of origin of an earthquake is called its focus; the point on the surface directly above the focus is the epicenter. Extreme Cold What constitutes extreme cold and its effects can vary across different areas of the country. In regions relatively unaccustomed to winter weather, near freezing temperatures are considered “extreme cold,” however, Eastern South Dakota is prone to much more extreme temperatures than other areas in the country. Temperatures typically range between zero degrees Fahrenheit and 100 degrees Fahrenheit, so extreme cold could be defined in the Codington County PDM jurisdiction area as temperatures below zero. Extreme Heat, also known as a Heat Wave, is a prolonged period of excessively hot weather, which may be accompanied by high humidity. There is no universal definition of a heat wave; the term is relative to the usual weather in the area. Temperatures in the County have a very wide range typically between 0 to 100 degrees Fahrenheit, therefore anything outside those ranges could be considered extreme. The term is applied both to routine weather variations and to extraordinary spells of heat which may occur only once a century. Flooding is an overflow of water that submerges land, producing measurable property damage or forcing evacuation of people and vital resources. Floods can develop slowly as rivers swell during an extended period of rain, or during a warming trend following a heavy snow. Even a

Codington County Pre-Disaster Mitigation Plan 10-12-12 Page 23
very small stream or dry creek bed can overflow and create flooding. Two different types of flooding hazards are present within the County. 1. Inundation flooding occurs most often in the spring. The greatest risks are realized typically
during a rapid snowmelt, before ice is completely off all of the rivers. 2. Flash flooding is more typically realized during the summer months. This flooding is primarily
localized, though enough rain can be produced to cause inundation flooding in areas along the Willow Creek, Big Sioux River and its tributaries. Heavy, slow moving thunderstorms often produce large amounts of rain. The threat of flooding would be increased during times of high soil moisture.
Freezing Rain/Ice occurs when temperatures drop below thirty degrees Fahrenheit and rain starts to fall. Freezing rain coats objects with ice, creating dangerous conditions due to slippery surfaces, platforms, sidewalks, roads, and highways. Sometimes ice is unnoticeable, and is then referred to as black ice. Black ice creates dangerous conditions, especially for traffic. Additionally, a quarter inch of frozen rain can significantly damage trees, electrical wires, weak structures, and other objects due to the additional weight bearing down on them. Hail is formed through rising currents of air in a storm. These currents carry water droplets to a height at which they freeze and subsequently fall to earth as round ice particles. Hailstones usually consist mostly of water ice and measure between 5 and 150 millimeters in diameter, with the larger stones coming from severe and dangerous thunderstorms. Heavy Rain is defined as precipitation falling with intensity in excess of 0.30 inches (0.762 cm) per hour. Short periods of intense rainfall can cause flash flooding while longer periods of widespread heavy rain can cause rivers to overflow. Ice Jams occur when warm temperatures and heavy rain cause snow to melt rapidly. Snow melt combined with heavy rains can cause frozen rivers to swell, which breaks the ice layer on top of the river. The ice layer often breaks into large chunks, which float downstream and often pile up near narrow passages and other obstructions, such as bridges and dams. Landslide is a geological phenomenon which includes a wide range of ground movement, such as rock falls, deep failure of slopes and shallow debris flows, which can occur in offshore, coastal and onshore environments. Although the action of gravity is the primary driving force for a landslide to occur, there are other contributing factors build up specific sub-surface conditions that make the area/slope prone to failure, whereas the actual landslide often requires a trigger before being released. Lightning results from a buildup of electrical charges that happens during the formation of a thunderstorm. The rapidly rising air within the cloud, combined with precipitation movement within the cloud, results in these charges. Giant sparks of electricity occur between the positive and negative charges both within the atmosphere and between the cloud and the ground. When the potential between the positive and negative charges becomes too great, there is a discharge of electricity, known as lightning. Lightning bolts reach temperatures near 50,000˚ F in a split second. The rapid heating and expansion, and cooling of air near the lightning bolt causes thunder. Severe Winter Storms deposit four or more inches of snow in a twelve-hour period or six inches of snow during a twenty-four hour period. Such storms are generally classified into four
Codington County Pre-Disaster Mitigation Plan 10-12-12 Page 24
categories with some taking the characteristics of several categories during distinct phases of the storm. These categories include: freezing rain, sleet, snow, and blizzard. Generally winter storms can range from moderate snow to blizzard conditions and can occur between October and April. The months of May, June, July, August, and September could possibly see snow, though the chances of a storm is very minimal. Like summer storms, winter storms are considered a weather event not a natural hazard, and thus will not be evaluated as a natural hazard throughout this PDM. Sleet does not generally cling to objects like freezing rain, but it does make the ground very slippery. This also increases the number of traffic accidents and personal injuries due to falls. Sleet can severely slow down operations within a community. Not only is there a danger of slipping, but with wind, sleet pellets become powerful projectiles that may damage structures, vehicles, or other objects. Snow is a common occurrence throughout the County during the months from October to April. Average annual snowfall for the county is twenty-four inches. Accumulations in dry years can be as little as five to ten inches, while wet years can see yearly totals up to eighty inches. Snow is a major contributing factor to flooding, primarily during the spring months of melting. Strong winds are usually defined as winds over forty miles per hour, are not uncommon in the area. Winds over fifty miles per hour can be expected twice each summer. Strong winds can cause destruction of property and create safety hazards resulting from flying debris. Strong winds also include severe localized wind blasting down from thunderstorms. These downward blasts of air are categorized as either microbursts or macrobursts depending on the amount geographical area they cover. Microbursts cover an area less than 2.5 miles in diameter and macrobursts cover an area greater than 2.5 miles in diameter. Subsidence is defined as the motion of a surface as it shifts downward relative to a datum. The opposite of subsidence is uplift, which results in an increase in elevation. There are several types of subsidence such as dissolution of limestone, mining-induced, faulting induced, isostatic rebound, extraction of natural gas, ground-water related, and seasonal effects. Summer Storms are generally defined as atmospheric hazards resulting from changes in temperature and air pressure which cause thunderstorms that may cause hail, lightning, strong winds, and tornados. Summer storms are considered a weather event rather than a natural hazard; therefore summer storms are not evaluated as a natural hazard throughout this PDM. Thunderstorms are formed when moisture, rapidly rising warm air, and a lifting mechanism such as clashing warm and cold air masses combine. The three most dangerous items associated with thunderstorms are hail, lightning, and strong winds. Tornados are violent windstorms that may occur singularly or in multiples as a result of severe thunderstorms. They develop when cool air overrides warm air, causing the warm air to rapidly rise. Many of these resulting vortices stay in the atmosphere, though touchdown can occur. The Fujita Tornado Damage Scale categorizes tornadoes based on their wind speed: F0=winds less than 73 m/h F1=winds 73-112 m/h F2=winds 113-157 m/h F3=winds 158-206 m/h F4=winds 207-260 m/h
Codington County Pre-Disaster Mitigation Plan 10-12-12 Page 25
F5=winds 261-318 m/h F6=winds greater than 318 m/h Wildfires are uncontrolled conflagrations that spread freely through the environment. Other names such as brush fire, bushfire, forest fire, grass fire, hill fire, peat fire, vegetation fire, and wild fire may be used to describe the same phenomenon. A wildfire differs from the other fires by its extensive size; the speed at which it can spread out from its original source; its ability to change direction unexpectedly; and to jump gaps, such as roads, rivers and fire breaks. Fires start when an ignition source is brought into contact with a combustible material that is subjected to sufficient heat and has an adequate supply of oxygen from the ambient air. Ignition may be triggered by natural sources such as a lightning strike, or may be attributed to a human source such as “discarded cigarettes, sparks from equipment, and arched power lines. Climate Change is a long-term change in the earth’s climate, especially a change due to an
increase in the average atmospheric temperature. In particular, a change apparent from the mid
to late 20th century onwards and attributed largely to the increased levels of atmospheric carbon
dioxide produced by the use of fossil fuels. Rising temperatures will lead to more climate and
weather hazards of greater intensity such as flooding, droughts, severe storms and winter
storms. Many scientists consider climate change a global phenomenon.
HAZARD PROFILE Requirement 201.6(c)(2)(i). Local Mitigation Plan Review Tool – B1.
Requirement 201.6(c)(2)(i). Local Mitigation Plan Review Tool – B2.
Requirement 201.6(c)(2)(ii). Local Mitigation Plan Review Tool – B3.
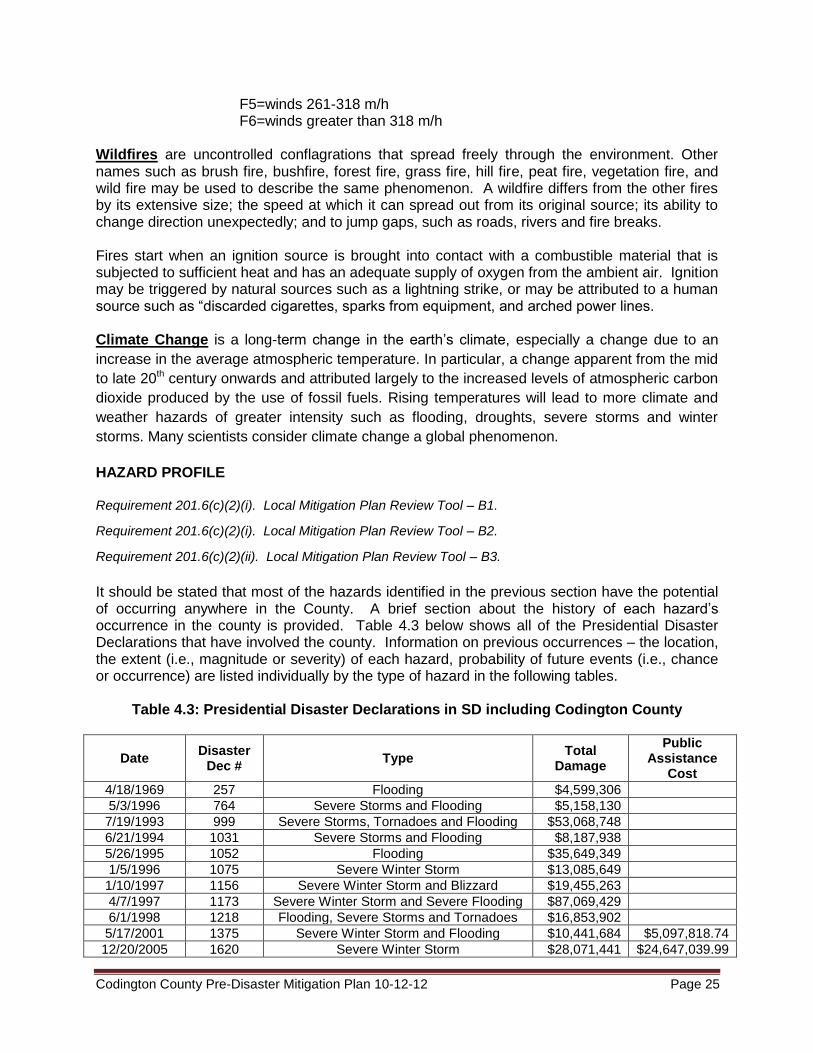
It should be stated that most of the hazards identified in the previous section have the potential of occurring anywhere in the County. A brief section about the history of each hazard’s occurrence in the county is provided. Table 4.3 below shows all of the Presidential Disaster Declarations that have involved the county. Information on previous occurrences – the location, the extent (i.e., magnitude or severity) of each hazard, probability of future events (i.e., chance or occurrence) are listed individually by the type of hazard in the following tables.
Table 4.3: Presidential Disaster Declarations in SD including Codington County
Date Disaster
Dec # Type
Total Damage
Public Assistance
Cost
4/18/1969 257 Flooding $4,599,306
5/3/1996 764 Severe Storms and Flooding $5,158,130
7/19/1993 999 Severe Storms, Tornadoes and Flooding $53,068,748
6/21/1994 1031 Severe Storms and Flooding $8,187,938
5/26/1995 1052 Flooding $35,649,349
1/5/1996 1075 Severe Winter Storm $13,085,649
1/10/1997 1156 Severe Winter Storm and Blizzard $19,455,263
4/7/1997 1173 Severe Winter Storm and Severe Flooding $87,069,429
6/1/1998 1218 Flooding, Severe Storms and Tornadoes $16,853,902
5/17/2001 1375 Severe Winter Storm and Flooding $10,441,684 $5,097,818.74
12/20/2005 1620 Severe Winter Storm $28,071,441 $24,647,039.99

Codington County Pre-Disaster Mitigation Plan 10-12-12 Page 26
5/13/2010 1915 Flooding $21,319,859.61
5/13/2011 1984 Flooding $26,952,484.70
8/2/2013 4137 Severe Storms, Tornadoes and Flooding $1,711,263
2/1/2017 4298 Severe Winter Storm $9,130,061 SOURCE: http://www.fema.gov/news/disasters.fema
While the PDM Planning Team reviewed all hazard occurrences that have been reported in the last 100 years, the list for some of the hazards was extremely long. The information provided in the tables is not a complete history report, but rather an overview of the hazard events which have occurred over the last ten years. The PDM Planning Team felt the hazard trend for the last ten years could be summarized in this section and decided to include any new occurrence that have taken place since the previous PDM was drafted. DAM FAILURE Dam breach or failure is of lesser concern for the citizens of the County than flooding. Codington County has a number of structures which control or regulate flow from one water body to another. South Dakota Department of Environment and Natural Resources identifies only two dams in the County (listed below). Neither dam is listed as vulnerable to failure. 4.4 Dam Locations in Codington County
Owner Location
US Fish and Wildlife Service Section 17-118-55
Murphy Farm Partnership SE ¼ Section 20-117-55
DROUGHT AND WILDFIRE South Dakota's climate is characterized by cold winters and warm to hot summers. There is usually light moisture in the winter and marginal to adequate moisture for the growing season for crops in the eastern portion of the state. Semi-arid conditions prevail in the western portion. This combination of hot summers and limited precipitation in a semi-arid climatic region places South Dakota present a potential position of suffering a drought in any given year. The climatic conditions are such that a small departure in the normal precipitation during the hot peak growing period of July and August could produce a partial or total crop failure. The fact South Dakota's economy is closely tied to agriculture only magnifies the potential loss which could be suffered by the state's economy during drought conditions. Roughly every fifty years a significant drought is experienced within the county, while many less severe droughts can occur at times every three years. Table 4.5 identifies the ten-year drought history for the County.

Codington County Pre-Disaster Mitigation Plan 10-12-12 Page 27
Table 4.5: Codington County Drought History
SOURCE: http://droughtmonitor.unl.edu/archive.html
Major Drought Occurrences:
1987-1990: An abnormally low amount of precipitation in the summer of 1987 combined with a hot and dry summer during 1988, left South Dakota in dire straits. Agricultural income was down 0.8% and wheat price per bushel decreased significantly.
1930s: During the infamous dust bowl years, Codington County was not spared a fair share of problems. Particularly dry summers were in 1934 and 1936.
1880s-1890s: The years 1887, 1894-1896, 1898-1901 were very dry years. The National Weather Service has several fire danger informational items located on their website.
A strong possibility exists for simultaneous emergencies during droughts. Wildfires are the most common. While researching the hazard occurrences that have taken place in the County, it became evident that the information found on the NOAA and SHELDUS websites was incomplete. Therefore, other sources were contacted whenever possible. Specifically, NOAA had zero occurrences listed for wildfires in the County, but the State Fire Marshal’s Office was contacted to verify that information. Helen King, the State Fire Marshal, said her information is derived from the reports submitted by the local fire departments who respond to the fires. She explained that since many of the fire departments in the County are Volunteer Fire Departments many times wildfires are extinguished and reports are never filed with the State. Thus, the information provided by the State Fire Marshall’s office is not entirely complete either. For the purpose of this PDM we have used the numbers provided by the State Fire Marshal’s Office as a point of reference in determining the likelihood of a wildfire hazard occurrence within the jurisdiction. The information provided by King identifies 213 structure fire responses, 129 vehicle fire responses, and 400 outside fire responses reported since 2000. The cause of the outside fires is not listed, so it is not known for certain whether all or some of these fires resulted due to a natural hazard occurrence or as a result of human behavior. Additionally, King provided information about the number of injuries and fatalities reported as a result of these fires. According to King’s records, nine civilian injuries and three civilian fatalities were reported and four firefighter injuries were reported since 2001. Table 4.6 identifies the number of fire department responses to structural, vehicle and outside fires that have been experienced within the county. It should be noted that the number of responses does not necessarily mean that there were 400 outside (wildfire) fires as some fires required multiple departments to respond. The 2004 PDM did not list or identify the history of wildfire occurrences.
Location Date Start Date End Type
Codington County 5/16/2000 5/23/2010 Moderate Drought
Codington County 06/01/02 6/30/2002 Moderate Drought
Codington County 9/2/2003 5/25/2004 Moderate to Severe Drought
Codington County 7/25/2006 8/29/2006 Moderate to Severe Drought
Codington County 7/24/2007 9/4/2007 Moderate to Severe Drought
Codington County 5/16/2000 5/23/2010 Moderate Drought

Codington County Pre-Disaster Mitigation Plan 10-12-12 Page 28
Table 4.6: Codington County Structural, Vehicle and Outside (Wildfire) Department Responses
Year Structural
Fires Vehicle Fires
Outside Fires
2001 29 12 17
2002 24 12 29
2003 17 15 42
2004 15 19 50
2005 37 19 59
2006 22 14 76
2007 19 12 37
2008 13 5 22
2009 5 0 22
2010 32 21 46
Total 213 129 400 SOURCE: South Dakota State Fire Marshall Office
FLOOD Flooding is a temporary overflow of water onto lands not normally covered by water producing measurable property damage or forcing evacuation of people and resources. Floods can result in injuries and even loss of life when quickly moving water is involved. Six inches of moving water is enough to sweep a vehicle off a road. Disruption of communication, transportation, electric service, and community services, along with contamination of water supplies and transportation accidents are very possible. Table 4.7 is a ten-year flood history in the County from 2000 to 2010.
Table 4.7: Codington County Flood History
Location or County Type Date Time Property Damage
Watertown Flash Flood 08/20/02 9:00 p.m. 0
Watertown Airport Flash Flood 04/21/07 8:10 p.m. 0
Codington County Flood 04/07/01 1:00 a.m. 785K
Watertown Flood 03/19/07 11:00 a.m. 0
Rauville Flood 03/16/09 9:00 a.m. 0
Florence Flood 03/14/10 8:00 a.m. 0
Wallace Flood 03/15/10 8:00 a.m. 0
Watertown Airport Flood 04/01/10 0.00 a.m. 0 SOURCE: http://www4.ncdc.noaa.gov
HAIL Table 4.8 indicates hail occurrences by location throughout the county. However, the information provided by the NOAA and SHELDUS websites was incomplete due to inconsistent reporting after such hazards occur. Obviously, with such a high number of occurrences it is reasonable to expect that at least some property or crop damage was sustained in the communities during some of the occurrences, even though the damage may not have been

Codington County Pre-Disaster Mitigation Plan 10-12-12 Page 29
reported or recorded. It is possible that such damage was not reported because it was believed to be insignificant at the time, or because those responsible for reporting such information did not report to the proper agencies.
Table 4.8: Codington County Hail History
Location or County Date Time Type Magnitude
Watertown 03/07/00 7:15 p.m. Hail 0.75 in.
Watertown 06/01/00 2:02 a.m. Hail 0.75 in.
Wallace 06/23/00 12:33 a.m. Hail 1.00 in.
Watertown 08/05/00 9:50 p.m. Hail 0.75 in.
Watertown 04/06/01 8:55 p.m. Hail 0.88 in.
Henry 06/06/01 6:35 p.m. Hail 0.88 in.
Watertown 06/09/01 11:02 p.m. Hail 0.75 in.
Florence 07/22/01 6:56 p.m. Hail 1:00 in.
Rauville 07/22/01 7:15 p.m. Hail 1.50 in.
Waverly 07/22/01 7/33 p.m. Hail 0.75 in.
Kranzburg 08/20/02 2:35 p.m. Hail 1.00 in.
Watertown 08/20/02 3:05 p.m. Hail 0.88 in.
Wallace 07/20/03 1:30 a.m. Hail 1.00 in.
Wallace 07/29/03 2:00 p.m. Hail 1.75 in.
Wallace 07/29/03 2:05 p.m. Hail 0.75 in.
South Shore 07/29/03 3:05 p.m. Hail 0.75 in.
Wallace 09/17/03 10:00 p.m. Hail 0.75 in.
Watertown 05/29/04 6:04 p.m. Hail 0.75 in.
South Shore 06/07/04 9:20 p.m. Hail 0.75 in.
Florence 06/15/04 11:51 a.m. Hail 0.88 in.
Watertown 07/21/04 4:40 p.m. Hail 1.00 in.
Watertown 07/21/04 4:47 p.m. Hail 0.75 in.
Watertown 08/15/04 6:58 p.m. Hail 0.88 in.
South Shore 08/15/04 7:10 p.m. Hail 0.88 in.
Henry 05/07/05 5:45 p.m. Hail 0.88 in.
Henry 05/07/05 6:00 p.m. Hail 0.88 in.
Henry 05/08/05 3:37 p.m. Hail 0.88 in.
Kranzburg 05/08/05 3:50 p.m. Hail 1.00 in.
Watertown 05/08/05 4:07 p.m. Hail 1.75 in.
Watertown 05/08/05 4:45 p.m. Hail 1.00 in.
Watertown 05/08/05 4:50 p.m. Hail 1.75 in.
Watertown 06/07/05 11:00 p.m. Hail 1.00 in.
Watertown 07/03/05 1:15 a.m. Hail 0.88 in.
Watertown 09/12/05 5:11 p.m. Hail 0.75 in.
Kranzburg 05/02/06 6:18 p.m. Hail 0.75 in.
Kranzburg 05/02/06 6:28 p.m. Hail 1.00 in.
Wallace 06/13/06 1:55 p.m. Hail 1.00 in.
Wallace 06/13/06 2:00 p.m. Hail 0.88 in.
Wallace 06/13/06 2:00 p.m. Hail 0.88 in.
Wallace 06/13/06 2:00 p.m. Hail 1.25 in.
Wallace 06/13/06 2:02 p.m. Hail 1.00 in.
Wallace 06/13/06 2:05 p.m. Hail 1.00 in.

Codington County Pre-Disaster Mitigation Plan 10-12-12 Page 30
Wallace 06/13/06 2:24 p.m. Hail 1.00 in.
Henry 06/14/06 1:30 p.m. Hail 0.88 in.
Henry 06/14/06 1:30 p.m. Hail 1.75 in.
Henry 06/14/06 1:32 p.m. Hail 0.75 in.
Henry 06/14/06 1:35 p.m. Hail 1.00 in.
Henry 06/14/06 1:45 p.m. Hail 0.75 in.
Henry 06/14/06 1:46 p.m. Hail 1.00 in.
Henry 08/10/06 6:56 p.m. Hail 1.00 in.
Henry 08/10/06 7:54 p.m. Hail 0.75 in.
Henry 09/16/06 4:53 p.m. Hail 1.75 in.
Watertown Airport 04/02/07 7:35 p.m. Hail 1.00 in.
Watertown Airport 04/21/07 7:52 p.m. Hail 1.00 in.
Watertown Airport 04/21/07 7:58 p.m. Hail 0.75 in.
Watertown Airport 04/21/07 8:10 p.m. Hail 1.00 in.
Waverly 07/16/07 12:40 p.m. Hail 0.88 in.
Kranzburg 07/16/07 12:45 p.m. Hail 1.00 in.
Rauville 07/16/07 12:45 p.m. Hail 0.88 in.
Rauville 07/16/07 12:45 p.m. Hail 1.00 in.
Waverly 07/16/07 12:45 p.m. Hail 0.75 in.
Waverly 07/16/07 12:45 p.m. Hail 1.00 in.
Waverly 07/16/07 12:50 p.m. Hail 0.88 in.
Waverly 07/16/07 12:55 p.m. Hail 0.88 in.
Waverly 07/16/07 12:55 p.m. Hail 0.88 in.
Kranzburg 07/16/07 1:00 p.m. Hail 0.75 in.
Kranzburg 07/16/07 1:00 p.m. Hail 0.88 in.
Kranzburg 07/16/07 1:00 p.m. Hail 1.00 in.
Kranzburg 07/16/07 1:00 p.m. Hail 1.00 in.
Kranzburg 07/16/07 1:00 p.m. Hail 1.00 in.
Waverly 07/16/07 1:00 p.m. Hail 0.75 in.
Waverly 07/16/07 1:00 p.m. Hail 0.75 in.
Waverly 07/16/07 1:00 p.m. Hail 1.00 in.
Waverly 07/16/07 1:09 p.m. Hail 0.75 in.
Grover 09/20/07 5:00 a.m. Hail 1.75 in.
Grover 06/12/08 3:45 p.m. Hail 1.00 in.
Rauville 07/10/08 8:00 a.m. Hail 0.88 in.
Florence 07/10/08 8:05 a.m. Hail 0.75 in.
Watertown Airport 07/28/08 10:35 p.m. Hail 0.75 in.
Florence 06/18/09 6:30 p.m. Hail 0.75 in.
Florence 06/18/09 6:33 p.m. Hail 0.75 in.
Kranzburg 07/06/09 12:30 p.m. Hail 0.88 in.
Henry 07/06/09 3:05 p.m. Hail 1.00 in.
Grover 07/06/09 3:20 p.m. Hail 0.75 in.
Wallace 07/09/09 1:19 a.m. Hail 1.25 in.
South Shore 04/30/10 4:00 p.m. Hail 0.75 in.
Watertown 05/24/10 12:00 a.m. Hail 1.00 in.
Henry 07/06/10 8:00 p.m. Hail 0.88 in.
Henry 07/06/10 8:00 p.m. Hail 1.00 in.
Florence 07/06/10 8:45 p.m. Hail 1.00 in.

Codington County Pre-Disaster Mitigation Plan 10-12-12 Page 31
Henry 07/17/10 4:45 p.m. Hail 2.00 in.
Watertown 09/01/10 9:35 p.m. Hail 0.88 in.
Henry 09/14/10 11:29 p.m. Hail 1.00 in. SOURCE: http://www4.ncdc.noaa.gov
LIGHTNING The extent or severity of lightning can range from significant to insignificant depending on where it strikes and what structures are hit. Water towers, cell phone towers, power lines, trees, and common buildings and structures all have the possibility of being struck by lightning. People who leave shelter during thunderstorms to watch or follow lightning also have the possibility of being struck by lightning. The lightning history for the past ten years only denotes one occurrence where damage was reported; however, possibility exists that the information reported is incomplete.
4.9 Codington County Lightning History
Location Date Time Type Property Damage
Watertown 06/09/01 11:30 p.m. Lightning 50K SOURCE: http://www4.ncdc.noaa.gov
TORNADO The annual risk for intense summer storms is very high. The entire County is susceptible to summer storms. Warning time for summer storms is normally several hours, sufficient for relocation and evacuation if necessary. However, tornadoes may occur with little or no warning. Between the years of 1950 and 2006, the County confirmed twenty-nine tornadoes. Table 4.10 includes the tornado history in the County since 2000.
Table 4.10: Codington County Tornado History
Location Date Time Type Magnitude Injuries Property Damage
Wallace 07/25/00 1:10 p.m. Tornado F0 0 0
Watertown 06/24/03 6:35 p.m. Tornado F0 0 0
Watertown 06/13/05 2:23 p.m. Tornado F0 0 0
Watertown 06/13/05 2:49 p.m. Tornado F0 0 0
Watertown 06/13/05 2:51 p.m. Tornado F0 0 0 SOURCE: http://www4.ncdc.noaa.gov
Each year, many storms and a few tornadoes affect the county. Summer storms in the County usually produce a wide range of damage making damage estimates very difficult. A complete listing of all summer storms having occurred within the county is not possible due to inaccurate reporting. The National Weather Service reports online were the primary source for this information.

Codington County Pre-Disaster Mitigation Plan 10-12-12 Page 32
EXTREME TEMPERATURES Extreme temperatures in the County are common occurrences. It is expected that at least two times each year there will be extreme heat or extreme cold in the area. The following information was found on the SHELDUS and NOAA websites. It is possible that people in the area have adapted to this type of extreme temperatures and thus such weather events are not reported as often as they occur. It is also possible that the information has only in recent years been tracked or reported. Table 4.11 identifies dates and times of the temperature extremes.
The location in table 4.11 is not specifically identified in the table by jurisdiction due to the vast area across the State of South Dakota affected by extreme temperatures. On January 13, 2009, after a clipper system dropped from one to four inches of snow, Arctic air and blustery north winds pushed into the area. The coldest air and the lowest wind chills of the season spread across much of central and northeast South Dakota. Wind chills fell to thirty-five to fifty degrees below zero late in the evening of the thirteenth and remained through the fourteenth. By the morning of January 15, 2009 the Arctic high pressure area settled in across northeast South Dakota, bringing wind chills as low as sixty degrees below zero. Many vehicles did not start because of the extreme cold and several schools had delayed starts. Daytime highs remained well below zero across the area. This was one of the coldest days that most areas experienced since the early 1970s. The records were broken by 1 to as much as 7 degrees. Some of the record lows included, -31 degrees at Sisseton; -32 degrees at Milbank; -35 degrees near Summit; and -39 degrees at Castlewood. Some near record low temperatures included -29 degrees at Redfield and Victor; and -34 degrees at Watertown. With these types of temperature extremes the biggest concern for people is exposure because prolonged exposure means almost certain death.
The counterpart to extreme cold is extreme heat which also has dangerous implications to humans, livestock, and critical structures and facilities if certain conditions are present. A temperature extreme occurrence took place between July 28 and July 30, 2006 when record heat and high humidity affected central, north central, and northeast South Dakota. Heat indices rose to 105 to 115 degrees across the area. Also in 2011 extreme heat and high humidity caused the deaths of many head of livestock in the County.
Table 4.11: Codington County History of Extreme Temperatures
Location Date Time Type
Codington County 7/28/06 11:00 a.m. Heat
Codington County 04/03/07 12:00 a.m. Extreme Cold/Wind Chill
Codington County 01/29/08 9:00 a.m. Extreme Cold/Wind Chill
Codington County 02/10/08 7:00 a.m. Extreme Cold/Wind Chill
Codington County 12/15/08 2:00 a.m. Extreme Cold/Wind Chill
Codington County 12/20/08 10:00 p.m. Extreme Cold/Wind Chill
Codington County 01/13/09 9:00 p.m. Extreme Cold/Wind Chill
Codington County 01/07/10 4:00 p.m. Extreme Cold/Wind Chill
Codington County 02/02/11 12:00 a.m. Extreme Cold/Wind Chill

Codington County Pre-Disaster Mitigation Plan 10-12-12 Page 33
Codington County 02/08/11 5:00 a.m. Extreme Cold/Wind Chill
SOURCE: http://www4.ncdc.noaa.gov
THUNDERSTORMS/HIGH WIND Thunderstorms and high wind occurrences in the County are also very common. According to the National Climatic Data Center Storm Events database, the County experienced ninety-two wind events from 1955-2006. Table 4.12 denotes the extent and severity of such hazards occurring in the last ten years. The County continues to educate residents of the dangers of such storms through public service announcements and other printed media.
Table 4.12: Codington County History for Thunderstorms
Location Date Time Type Mag
Codington County 4/5/2000 10:00 a.m. High Wind 62 kts.
Watertown 5/22/2000 3:29 p.m. Thunderstorm 51 kts.
Codington County 8/5/2000 9:15 p.m. High Wind 56 kts.
Florence 6/9/2001 10:35 p.m. Thunderstorm Wind 61 kts.
Watertown 06/09/01 10:59 p.m. Thunderstorm Wind 51 kts.
Codington County 02/11/02 12:00 p.m. High Wind 54 kts.
Florence 07/21/02 3:00 a.m. Thunderstorm Wind 56 kts.
Watertown 07/03/03 11:15 p.m. Thunderstorm Wind 56 kts.
Codington County 12/12/04 3:29 a.m. High Wind 54 kts.
Location Date Time Type Mag
Codington County 03/10/05 7:00 a.m. High Wind 58 kts.
Florence 05/07/05 7:55 p.m. Thunderstorm Wind 56 kts.
Florence 06/07/05 11:30 p.m. Thunderstorm Wind 65 kts.
Watertown Airport 07/31/08 4:16 a.m. Thunderstorm Wind 54 kts.
South Shore 07/31/08 4:20 a.m. Thunderstorm Wind 53 kts.
Codington County 10/26/2008 8:45 a.m. High Wind 63 kts.
Wallace 07/07/09 1:50 p.m. Thunderstorm Wind 61 kts.
Wallace 07/07/09 1:15 p.m. Thunderstorm Wind 61 kts.
Henry 07/07/09 2:12 p.m. Thunderstorm Wind 52 kts.
Florence 07/31/09 4:10 p.m. Thunderstorm Wind 52 kts.
Wallace 07/31/09 4:12 p.m. Thunderstorm Wind 52 kts.
Henry 07/31/09 4:20 p.m. Thunderstorm Wind 52 kts.
Rauville 07/31/09 4:33 p.m. Thunderstorm Wind 61 kts.
Henry 06/21/10 12:30 a.m. Thunderstorm Wind 70 kts.
Watertown Airport 06/23/10 12:31 a.m. Thunderstorm Wind 59 kts.
Watertown 06/23/10 12:45 a.m. Thunderstorm Wind 52 kts.
Henry 07/17/10 5:00 p.m. Thunderstorm Wind 61 kts.
Codington County 10/26/10 3:00 p.m. High Wind 53 kts.
SOURCE: http://www4.ncdc.noaa.gov

Codington County Pre-Disaster Mitigation Plan 10-12-12 Page 34
WINTER STORMS Table 4.13 shows just how common snow and ice storms are in the County. While such storms would be considered extreme in many parts of the State, the consistent nature of such weather hazards are expected in this area. Thus, planning and response mechanisms for snow and ice storms are vital to the County and are routine procedures in the County due to the common nature of such storms. Winter storms in South Dakota are known to cover large geographical areas, often an entire county or multiple counties can be affected by a single storm. All of the storms identified in Table 4.13 were considered to have occurred countywide. Due to the multiple occurrences of winter storms each year, an exhaustive compilation is not possible.
Table 4.13 Codington County History of Snow and Ice Storms
Location Date Time Type
Codington County 11/11/00 4:00 p.m. Winter Storm
Codington County 12/16/00 12:45 a.m. Blizzard
Codington County 12/28/00 8:00 a.m. Blizzard
Codington County 01/29/01 5:00 p.m. Winter Storm
Codington County 02/24/01 1:00 p.m. Winter Storm
Codington County 02/27/01 1:00 a.m. Winter Storm
Codington County 04/22/01 5:00 a.m. Ice Storm
Codington County 11/26/01 1:00 a.m. Winter Storm
Codington County 03/14/02 3:00 a.m. Winter Storm
Codington County 02/02/03 12:00 a.m. Winter Storm
Codington County 11/21/03 2:00 p.m. Heavy Snow
Codington County 01/25/04 12:00 p.m. Heavy Snow
Codington County 01/21/05 6:00 p.m. Blizzard
Codington County 11/27/05 10:00 a.m. Ice Storm
Codington County 12/29/05 8:00 a.m. Winter Storm
Codington County 12/30/06 5:00 a.m. Winter Storm
Codington County 02/23/07 11:00 p.m. Winter Storm
Codington County 02/28/07 11:00 a.m. Heavy Snow
Codington County 03/02/07 9:30 a.m. Blizzard
Codington County 12/01/07 7:00 a.m. Heavy Snow
Codington County 03/20/08 2:00 p.m. Heavy Snow
Codington County 04/10/08 1:00 p.m. Blizzard
Codington County 04/25/08 6:00 a.m. Winter Storm
Codington County 11/06/08 3:40 p.m. Winter Storm
Codington County 12/13/08 6:00 p.m. Blizzard
Codington County 01/12/09 4:00 a.m. Blizzard
Codington County 03/30/09 9:00 p.m. Blizzard
Codington County 01/22/10 1:00 p.m. Winter Storm

Codington County Pre-Disaster Mitigation Plan 10-12-12 Page 35
Codington County 12/11/10 8:00 a.m. Blizzard
Codington County 12/30/10 12:30 p.m. Blizzard
Codington County 12/31/10 12:00 p.m. Blizzard
SOURCE: http://www4.ncdc.noaa.gov
Climate Change Climate change is a global phenomenon. Human related activities are releasing increasing quantities of carbon dioxide and other heat trapping gases into the Earth’s atmosphere causing increases in temperatures worldwide. Dennis Todey, Extension State Climatologist, predicts increased precipitation in the northern Great Plains with more heavy precipitation events and flooding. Warmer temperatures will lengthen the growing season and increase the number of frost free days. Total snow fall accumulations will decrease. Overall, climate change will increase the number and intensity of weather hazards in the region. ASSESSING VULNERABILITY: OVERVIEW Requirement 201.6(c)(2)(i). Local Mitigation Plan Review Tool – B1.
Requirement 201.6(c)(2)(i). Local Mitigation Plan Review Tool – B2.
Requirement 201.6(c)(2)(ii). Local Mitigation Plan Review Tool – B3.
Hazards were also analyzed in terms of the level of the community or county’s vulnerability to the hazard. Vulnerability to the hazard is the susceptibility of life, property, and the environment to injury or damage if a hazard occurs. Representatives from each participating jurisdiction and the PDM Planning Team were asked to complete worksheets that rated their perception to vulnerability of hazards for either their specific geographical location, or for county-wide risks. A low vulnerability hazard is one that has very low damage potential to either life or property (minor damage to less than 5% of the jurisdiction). A “medium” vulnerability hazard is unlikely to threaten human life, although some people may be at risk, but may pose moderate damage potential (causing partial damage to 5% to 10% of the jurisdiction, on an irregular occurrence). A “high” vulnerability hazard may threaten human life, and more than ten percent of the jurisdiction may be at risk on a regular occurrence. Table 4.14 above is an overall summary of vulnerability by jurisdiction produced from the FEMA worksheets completed by each participating jurisdiction and PDM Planning Team.
Table 4.14: Overall Summary of Vulnerability by Jurisdiction
Type of Disaster
Codington County
Town of Florence
Town of
Henry
Town of Kranzburg
Town of South Shore
Town of Wallace
City of Watertown
Townships
Drought H L H H H H L H
Earthquake N N N N L L N N
Extreme Cold H H H H L H H H
Extreme Heat H H H H L H H H
Flood H L L M L H H H
Freezing Rain/Sleet/Ice
H H H H H H H H
Hail H L H H M H H M
Heavy Rain M H H H L H M H
Heavy Snow H H H H M H M H

Codington County Pre-Disaster Mitigation Plan 10-12-12 Page 36
Ice Jam L N N N N N H N
Landslide N N N N N N N N
Lightning L L L H L L M L
Rapid Snow Melt H H L H L H M H
Strong Winds H H H H H M H H
Thunderstorm M M H H M M M M
Tornado M H H H H H L L
Urban Fire L M L H M L L N
Utility Interruption
H H M H H H M H
Wild Fire M N N N L L L M
N : Not applicable; not a hazard to the jurisdiction
L : Low risk/vulnerability; little damage potential (minor damage to less than 5% of the jurisdiction)
M : Medium risk/vulnerability; moderate damage potential (causing partial damage to 5-10% of the jurisdiction, and irregular occurrence)
H : High risk/vulnerability; significant risk/major damage potential (for example, destructive, damage to more than 10% of the jurisdiction and/or regular occurrence)
The following paragraphs summarize the description of the jurisdiction’s vulnerability to each hazard and the impact of each hazard on the jurisdiction. Blizzards are characterized by high winds, blowing snow, cold temperatures, and low visibility. Blizzards create conditions such as icy roads, closed roads, downed power lines and trees. The County’s population is especially vulnerable to these conditions because people tend to leave their homes to get to places such as work, school, and stores rather than staying inside. Traffic is one of the biggest hazards in the County during a blizzard because people often get stuck, stranded, and lost when driving their vehicles which usually prompts others such as family and or emergency responders to go out in the conditions to rescue them. Drought can be defined as a period of prolonged lack of moisture. High temperatures, high winds, and low relative humidity all result from droughts and are caused by droughts. A decrease in the amount of precipitation can adversely affect stream flows and reservoirs, lakes, and groundwater levels. Crops and other vegetation are harmed when moisture is not present within the soil. South Dakota's climate is characterized by cold winters and warm to hot summers. There is usually light moisture in the winter and marginal to adequate moisture for the growing season for crops in the eastern portion of the state. Semi-arid conditions prevail in the western portion. This combination of hot summers and limited precipitation in a semi-arid climatic region present a potential position of suffering a drought in any given year. The climatic conditions are such that a small departure in the normal precipitation during the hot peak growing period of July and August could produce a partial or total crop failure. South Dakota's economy is closely tied to agriculture only magnifies the potential loss which could be suffered by the state's economy during drought conditions. Roughly every fifty years a significant drought is experienced within the county, while less severe droughts have occurred as often as every three years. Earthquakes occur in the area, but have not had a great enough magnitude or intensity in the past ten years to be reported. The magnitude and intensity of an earthquake is measured by the Richter scale and the Mercalli scale. An earthquake of noteworthy magnitude has not occurred in the county for decades, but it would be reasonable to expect that a large earthquake would have comparative impact on the County as it would anywhere else. The County does not
Codington County Pre-Disaster Mitigation Plan 10-12-12 Page 37
have skyscrapers or very many tall buildings, but it also does not have codes in place that require homes or buildings to be retrofitted. Extreme Cold temperatures often accompany a winter storm, so you may have to cope with power failures and icy roads. Whenever temperatures drop decidedly below normal and as wind speed increases, heat can leave your body more rapidly. These weather-related conditions may lead to serious health problems. Extreme cold is a dangerous situation that can bring on health emergencies in susceptible people, such as those without shelter or who are stranded, or who live in a home that is poorly insulated or without heat. Exposure is the biggest threat/vulnerability to human life, however, incidences of exposure are isolated and thus unlikely to happen in masses. Extreme Heat Severe heat waves have caused catastrophic crop damage, thousands of deaths from hyperthermia, and widespread power failures due to increased use of air conditioning. Loss of power and crop damage are the largest vulnerability to the county during extreme heat. Both have an effect on quality of life, however, neither are detrimental to the existence of the population of the County. Flooding can result in injuries and even loss of life when quickly moving water is involved. Six inches of moving water is enough to sweep a vehicle off a road. Disruption of communication, transportation, electric service, and community services, along with contamination of water supplies and transportation accidents are very possible. The county is networked with a series of creeks and tributaries, which are part of the Big Sioux River watershed. This area receives several large thunderstorms per year that can cause intense rainfall for short periods of time, resulting in water feeding the Big Sioux River through its respective tributaries. In addition to flooding caused by rainfall, the area surrounding the Big Sioux River is subject to flood damage because of the possibility of extensive snowpack and subsequent spring snowmelt flooding. There have also been past issues dealing with the maintenance and clearing of drainage channels in the area that have resulted in obstructions restricting the flow of water during a storm. Many residents live in the 100-year flood plain located in the Big Sioux River watershed. Conditions, at times, make response and evacuation operations, very difficult, adversely affecting the safety of residents. The flooding of township roads is a concern for the entire county. Township officials have identified areas that are either vulnerable or have experienced recurring damages. These areas are identified in maps contained in Appendix E. Freezing Rain causes adverse conditions such as slippery surfaces and extra weight buildup on power lines, poles, trees, and structures. The additional weight can often cause weak structures to cave in and cause tree branches and power lines to break and fall. The County and the local jurisdictions within are susceptible to these conditions due to the types of structures and surfaces that exist in the county that cannot be protected from freezing rain. Traffic on the roads and highways tend to be the biggest hazard during freezing rain conditions because vehicles often slide off the road which prompts emergency responders and others to have to go out on rescue missions in the adverse conditions. Hail causes damage to property such as crops, vehicles, windows, roofs, and structures. The County and its local jurisdictions are vulnerable to hail, like most other areas in the State due to
Codington County Pre-Disaster Mitigation Plan 10-12-12 Page 38
the nature of the hazard. Mitigating for hail is difficult and is usually found in the form of insurance policies for structures, vehicles, and crops. Heavy Rain causes damage to property such as homes and roads. Often when heavy rains occur in the County it may cause sewers to backup in homes due to excess water entering the wastewater collection lines. The excess water sometimes has no place to go and thus basements fill up with water which results in damage to water heaters, furnaces, and damage to living quarters for people who live in basement apartments. Roads and bridges can be washed out, thus causing traffic hazards for travelers and commuters. Many times the roads have to be closed causing rural traffic to have to take alternate routes which can sometimes be an additional five to ten miles out of the way. All areas of the County are vulnerable when heavy rains occur. Storm sewers are built for the typical storm and therefore do not accommodate for excessive or heavy rains. Ice Jams cause damage to bridges, roads, and culverts due to water currents pushing large chunks of ice under or through small openings. There are eight bridges inside the City limits of Watertown, located on Broadway Street, Highway 212, 4th Avenue South, Kemp Avenue, 3rd Avenue, 10th Avenue and 14th Avenue 3rd Street and 21st street, which are at risk for ice jams. There are also many other unspecified areas throughout the county that are vulnerable to ice jams. Landslides have a low chance of occurring in the County due to the relatively flat topography. Lightning often strikes the tallest objects within the area. In towns trees and poles often receive the most strikes. In rural areas, shorter objects are more vulnerable to being struck. Electrical lines and poles are also vulnerable because of their height and charge. In addition, many streetlights function with sensors. Since thunderstorms occur primarily during hours of darkness, lightning strikes close to censored lights cause the lights to go out, causing a potential hazard for drivers. Flickering lights and short blackouts are not at all uncommon in the county. One of lightning’s dangerous attributes includes the ability to cause fires. Since the entire county is vulnerable to lightning strikes and subsequent fires, these fires will be treated under the fire section of this PDM. Most injuries from lightning occur near the end of thunderstorms. Individuals who sought shelter leave those areas prior to the entire completion of the thunderstorm. Believing it is safe to freely move around, concluding lightning strikes catch them off guard. Severe Winter Storms have a high risk of occurrence. Approximately five snowstorms each resulting in five to ten inches of snow occur in the County area annually. Heavy snow can immobilize transportation, down power lines and trees and cause the collapsing of weaker structures. Livestock and wildlife are also very vulnerable during periods of heavy snow. Most storms can be considered to have occurred countywide. Due to the multiple occurrences of winter storms each year, an exhaustive compilation is not possible. Additionally, winter storms often result in some forms of utility mishaps. High voltage electric transmission/distribution lines run the length of the County. These lines are susceptible to breaking under freezing rain and icy conditions and severing during high blizzard winds. Within the county, particularly within Watertown, there are fiber optics associated with phone transmissions that are the lifeline to communications. Any electrical complications bring associated risk of food spoilage, appliance burnout, loss of water, and potential harm for in-

Codington County Pre-Disaster Mitigation Plan 10-12-12 Page 39
house life support users. Limited loss of power is not uncommon on an annual basis. A typical power interruption lasts from one to three hours. Most residents are prepared to deal with this type of inconvenience. The greatest danger during winter weather is traveling. Many individuals venture out in inclement weather. Reasons include the necessity of getting to work, going to school, going out just to see how the weather is, and to rescue stranded persons. Snow Drifts are caused by wind blowing snow and cold temperatures. These drifts can be small finger drifts on roadways causing cautionary driving, or twenty to forty foot high drifts that block entire highways, roads, and farmyards for several days. Populations at highest vulnerability for this type of hazard are rural homeowners, which account for approximately seventeen percent of the county, and the elderly. As with any weather event, those dependent upon healthcare supplies and other essentials will also bear the brunt of highway closures and slowed transportation due to snow and ice. Emergency services will also be delayed during winter storms. Snow removal policies and emergency response is at excellent performance and no projects will be considered in this area. Generators provide back-up power to many critical facilities within the municipalities and in rural areas. However, some of the critical facilities that could be utilized in disaster situations do not have backup generators. Also, some facilities have generators that only power a portion of operations. Strong Winds can be detrimental to the area. Trees, poles, power lines, and weak structures are all susceptible and vulnerable to strong winds. When strong winds knock down trees, poles, power lines, and structures it creates additional traffic hazards for travelers and commuters. Strong winds are a common occurrence in all parts of the County. The farming community tends to be vulnerable because many old farm sites have weak, dilapidated, or crumbling structures or structures such as grain bins which can easily be blown over. Another area of particular vulnerability would be those areas with dense tree growth where dead or decaying trees lose their stability and can be blown over or knocked down easily. Thunderstorms cause lightening and sometimes large amounts of rain in a small timeframe. The entire county experiences thunderstorms on a regular basis and is only vulnerable when weather events outside the norm occur. Specific vulnerabilities are further identified in the paragraphs for “Lightening” and “Heavy Rains”. Tornadoes present significant danger and occur most often in South Dakota during the months of May, June, and July. The greatest period of tornado activity (about 82 percent of occurrence) is from eleven a.m. to midnight. Within this time frame, most tornadoes occur between four p.m. and six p.m. The annual risk for intense summer storms is very high. Often associated with summer storms are utility problems. High voltage electrical transmission lines run the length of the County. These lines are susceptible to breaking during high winds and hail. Tall trees located near electrical lines can be broken in wind or by lightning strikes and land on electrical lines, severing connections. Any electrical complications bring associated risk of food spoilage, appliance burnout, loss of water, and potential harm to in-house life support dependents. Limited loss of power is common on an annual basis. Typical power interruptions last around one to three hours. Most residents are prepared to deal with this.

Codington County Pre-Disaster Mitigation Plan 10-12-12 Page 40
Wildfires occur primarily during drought conditions. Wildfires can cause extensive damage, both to property and human life, and can occur anywhere in the county. Even though wildfires can have various beneficial effects on wilderness areas for plant species that are dependent on the effects of fire for growth and reproduction, large wildfires often have detrimental atmospheric consequences, and too frequent wildfires may cause other negative ecological effects. Current techniques may permit and even encourage fires in some regions as a means of minimizing or removing sources of fuel from any wildfire that might develop. Since there are no remote forested regions in the County, wildfires can be easily spotted and are capable of being maintained. The County does not have any areas that are considered wildland-urban interface because property outside city limits is primarily agricultural land, thus, there are no urban interface areas of risk in the County. In addition, fire interference with traffic on highways is not a major concern. The most important factor in mitigating against wildfires continues to be common sense and adherence to burning regulations and suggestions disseminated by the County. Moisture amounts have the biggest impact on fire situations. During wet years, fire danger is low. More controlled burns are conducted and fewer mishaps occur. During dry years, severe restrictions are placed on any types of burns. For information on dealing with open/controlled burning within the county, see SDCL 34-29B and SDCL 34-35. Climate Change is a global issue. Climate change exacerbates many of the identified weather
hazards such as drought, extreme temperatures, severe storms, flooding, tornadoes and
wildfires. Current climate conditions in the northern Great Plains already put a strain on
communities and cause millions of dollars in damages. Climate change will only add to these
problems.
ASSESSING VULNERABILITY: NATIONAL FLOOD INSURANCE PROGRAM COMPLIANCE
Requirement 201.6(c)(3)(ii). Local Mitigation Plan Review Tool – C2.
Codington County participates in the National Flood Insurance Program (NFIP). There are two
communities located in the County that do not participate in NFIP. Those communities are:
Henry and Wallace. The Cities of Florence, Kranzburg, South Shore, and Watertown have
been mapped and participate in the NFIP. The County will continue to participate and ensure
compliance of the participating local jurisdictions located within the flood plain. Table 4.15
shows County entities that participate in the NFIP.

Codington County Pre-Disaster Mitigation Plan 10-12-12 Page 41
Table 4.15: Communities Participating in the National Flood Program, Codington County
Community Name Community ID Current Map Effective Date
Codington County 460260 1/16/2009
Florence 460306 1/16/2009
Henry N/A Not Participating
Kranzburg 460010 1/16/2009
South Shore 460188 1/16/2009
Wallace N/A Not Participating
Watertown 460016 1/16/2009
The Codington County Zoning Office maintains the flood zone maps and utilizes DFIRMS for all
planning mechanism occurring in the unincorporated areas of the county; specifically,
development of new structures. Each individual participating community has a designated
floodplain administrator that requires elevation certificates and issues floodplain development
permits for structures constructed within Zone A of the identified flood hazard areas. The
DFIRMS are used to determine where the natural drainage occurs and ensures that new
development will not interrupt the natural drainage. The Codington County Zoning Office and
City of Watertown Engineering Department have DFIRMS in electronic format and thus will
utilize and maintain the maps in the electronic format.
ADDRESSING VULNERABILTY: REPETITIVE LOSS PROPERTIES Requirement 201.6(c)(2)(ii). Local Mitigation Plan Review Tool – B4.
Due to various geomorphologic and topographical conditions, periodic flooding affects numerous areas in both incorporated and unincorporated areas of the County. High concentrations of residential development occurred adjacent to Lake Pelican and Lake Kampeska prior to the initial flood hazard boundaries being identified on January 24, 1978. As a result, numerous structures already existed at the time of adoption of the first map and continue to be lived in today. Further, the City of Watertown was established in 1879 in areas identified today as floodprone and expanded significantly in areas now identified as flood hazard areas until the identification of the flood hazard boundaries in 1978. As a result numerous structures with residential, commercial, public/quasi-public and industrial uses associated with them are located within Flood Hazard Areas currently identified as Zone AE, AO, A, and C. Many structures located within the County have experienced flooding or are required to be insured against flood due to their proximity to special flood hazard areas. The County has a total of nine hundred five (905) flood insurance policy holders. The vast majority of those policies, eight hundred thirty-one (831), insure property within the City of Watertown.

Codington County Pre-Disaster Mitigation Plan 10-12-12 Page 42
Table 4.15: Codington County National Flood Insurance Program Statistics
Community Name
Current NFIP
Policies
Number of Claims
Paid Since 1978
Total Value of Claims Paid
Policies for
Structures in A-
Zones
Repetitive Loss
Properties
City of Watertown 831 396 $5,211,720.00 294 75
Unincorporated areas of Codington County 74 25 $336,383.00 18 2
Totals 905 421 $5,548,103.00 312 77 SOURCE: South Dakota State NFIP Coordinator
The PDM Planning Team focused attention particularly on flood related issues. An issue of primary concern the number of times specific properties and structures on those properties flood. The County, more specifically the City of Watertown has a large incidence of repetitive loss claims in comparison to other jurisdictions in South Dakota. Repetitive loss properties are those for which two or more losses of at least $1,000 each have been paid under the National Flood Insurance Program (NFIP) within any ten-year period since 1978. A total of seventy-seven are classified as “repetitive loss properties.” As was previously mentioned a goal of the County is to protect specific areas in the county from flooding. This goal aims to protect properties prone to flood losses, but does not discount the possibility that in some cases structures located in the floodplain may need to be removed. ADDRESSING VULNERABILTY: SEVERE REPETITIVE LOSS PROPERTIES Requirement 201.6(c)(2)(ii). Local Mitigation Plan Review Tool – B4.
The Flood Insurance Reform Act of 2004 identified another category of repetitive loss, severe repetitive loss, and defined it as “a single family property (consisting of one-to-four residences) that is covered under flood insurance by the NFIP and has incurred flood-related damage for which four or more separate claims payments have been paid under flood insurance coverage with the amount of each claim payment exceeding $5,000 and with cumulative amount of such claims payments exceeding $20,000; or for which at least two separate claims payments have been made with the cumulative amount of such claims exceeding the reported value of the property.” As of 2008 the County is home to the only property (a campground) that meets this definition in South Dakota. Losses to this property, which has multiple structures, between March 1986 and April 2001 equaled $337,374.

Codington County Pre-Disaster Mitigation Plan 10-12-12 Page 43
ASSESSING VULNERABILITY: IDENTIFYING STRUCTURES Requirement 201.6(c)(2)(ii). Local Mitigation Plan Review Tool – B3.
One of the primary purposes of this PDM is identifying critical facilities, emergency shelters, and summer storm shelters and equipping those facilities with the means to provide the necessary energy for access to sanitation and maintain important functions during a natural hazard occurrence. In the event of a disaster as a result of severe summer or winter storms, a terrorist attack, or a hazardous materials incident, the County and participating entities will have the ability to prevent further loss of life by generator powered critical facility shelters. The City of Watertown has many structures that are vital to emergency operations. Each jurisdiction was responsible for listing critical infrastructure within their communities. Table 4.16 is a list of critical facilities that would cause the greatest distress in the county if destruction occurred. The information provided in Table 4.16 was compiled via survey of the participating communities.

Codington County Pre-Disaster Mitigation Plan 10-12-12 Page 44
Table 4.16: Critical Structures in Codington County
Jurisdiction/ Entity
Location Address Sector Sub sector Name Owner Type
Alltel/AT&T Codington County 314 347th
Avenue Telecommunications Cell Phone Tower Alltel/AT&T Private
Codington-Clark Electric COOP
Phipps Township Utility Power Lines, 10 miles
Codington-Clark Electric COOP
Public
Codington-Clark Electric COOP
Kranzburg Township
Utility Power Lines, 1mile Codington-Clark Electric COOP
Public
Codington-Clark Electric COOP
Fuller Township Utility Power Lines, 3 miles
Codington-Clark Electric COOP
Public
Codington-Clark Electric COOP
Sheridan Township Utility Power Lines, 4 miles
Codington-Clark Electric COOP
Public
Codington-Clark Electric COOP
Dexter Township Utility Power Lines, 46 miles
Codington-Clark Electric COOP
Public
Codington-Clark Electric COOP
Leola Township Utility Power Lines, 5 miles
Codington-Clark Electric COOP
Public
Codington-Clark Electric COOP
Germantown Township
Utility Power Lines, 5 miles
Codington-Clark Electric COOP
Public
Codington-Clark Electric COOP
Elmira Township Utility Power Lines, 6 miles
Codington-Clark Electric COOP
Public
Codington-Clark Electric COOP
Lake Township Utility Power Lines, 6 miles
Codington-Clark Electric COOP
Public
Codington-Clark Electric COOP
Richland Township Utility Power Lines, 6 miles
Codington-Clark Electric COOP
Public
Codington-Clark Electric COOP
Pelican Township Utility Power Lines, 6 miles
Codington-Clark Electric COOP
Public
Codington-Clark Electric COOP
Eden Township Utility Power Lines, 7 miles
Codington-Clark Electric COOP
Public
Interstate Tele-communications
Town of Henry First Street Non Emergency Response Facility
Fiber Optic and Phone Line
Interstate Tele-Communications
Private
Interstate Tele-communications
Town of South Shore
Main Street Non Emergency Response Facility
Fiber Optic and Phone Line
Interstate Tele-Communications
Private
Interstate Tele-communications
Rural Codington County
1329 41st St SE
Non Emergency Response Facility
Fiber Optic and Phone Line
Interstate Tele-Communications
Private
Magellan Mid Stream Partners
City of Watertown 1000 17th St NE Non Emergency Response Facility
Petroleum Pipeline Magellan Mid Stream Partners
Private
Northern Border Pipeline
Rural Codington County
NW to SE from Graceland Township to Pelican Township
Non Emergency Response Facility
Natural Gas Supply Northern Border Pipeline
Private
Northern Natural Gas
Rural Codington County
From Section 1-116-53 southwest toward Willow Lake, SD
Non Emergency Response Facility
Natural Gas Supply Northern Natural Gas
Private
North Sioux Conifer Road
Rural Codington County
Section 14-117-53 Non Emergency Response Facility
Water Supply – Wells
North Sioux Conifer Road
Public
Northwestern Energy
Rural Codington County
North from South border of Pelican Township to City of Watertown
Non Emergency Response Facility
Natural Gas Supply Northwestern Energy
Private
NBPL – TBS Rural Codington County
45371 178th
St Non Emergency Response Facility
Natural Gas Supply NBPL – TBS Public

Codington County Pre-Disaster Mitigation Plan 10-12-12 Page 45
Jurisdiction/ Entity
Location Address Sector Sub sector Name Owner Type
Western Area Power Headquarters
Rural Codington County
1330 41st St SE Non Emergency Response Facility
Electrical Supply Western Area Power Headquarters
Public
Florence Town of Florence 308 Main Avenue Emergency Services Fire Department Florence Fire Department
Public
Florence Town of Florence 308 Main Avenue Government Facility Community Center Florence Community Center
Public
Florence Town of Florence 515 Main Avenue Government Facility Emergency Operations Center
Florence School Public
Florence Town of Florence 202 Thorson Ave Non Emergency Response Facility
Sanitary Sewer Sewer Lagoon Public
Florence Town of Florence 471 Thorson Ave Non Emergency Response Facility
Sanitary Sewer Lift Station Public
Florence Town of Florence Intersection of Seever’s Ave. and 5
th
Street
Non Emergency Response Facility
Water Distribution Point
Water System Pump House
Public
Florence Town of Florence 1004 6th
Street Population to Protect Elderly Housing Country View Assisted Living Center
Private
Florence Town of Florence 515 Main Avenue Public Institution School Florence School Public
Florence Town of Florence 312 4th St Telecommunications Switch/Router
Interstate Telecom (ITC)
Private
Henry Town of Henry 218 3rd
Street Emergency Services Fire Department Henry Fire Department
Public
Henry Town of Henry 210 Main Street Government Facility Community Center Henry Community Center
Public
Henry Town of Henry 210 Main Street Government Facility Emergency Operations Center
Henry Fire Department
Public
Henry Town of Henry 210 Main Street Government Facility Emergency Shelter Henry Community Building
Public
Henry Town of Henry Non Emergency Response Facility
Sanitary Sewer Lift Station Public
Henry Town of Henry 200 Second Street Population to Protect Low Income Housing
Westside Apartments
Private
Henry Town of Henry 111 North Cedar Public Institution School
Henry Elementary and Secondary School
Public
Kranzburg Town of Kranzburg 103 St Peter St NE Education Institution Private School Holy Rosary School
Private
Kranzburg Town of Kranzburg 151 Dakota Ave N. Government Facility Town Hall Kranzburg Town Hall
Public
Kranzburg Town of Kranzburg East Hwy 212 Non Emergency Response Facility
Sanitary Sewer Lagoon
Kranzburg Sewer Lagoon
Public
Kranzburg Town of Kranzburg 103 St Peter St NE Population to Protect Day Care Holy Rosary Day Care
Private
Kranzburg Town of Kranzburg 316 St Mary St E. Population to Protect Elderly Housing Kranzburg Housing Inc.
Private
Kranzburg Town of Kranzburg 204 Hastings Ave NW Private Home Emergency Operations Center
Kevin Krantz House
Private
South Shore Town of South Shore
102 N. Main Street Emergency Services Building South Shore Fire Department
Public
South Shore Town of South Shore
102 N. Main Street Government Facility Building South Shore City Hall
Public

Codington County Pre-Disaster Mitigation Plan 10-12-12 Page 46
Jurisdiction/ Entity
Location Address Sector Sub sector Name Owner Type
South Shore Town of South Shore
102 N. Main Street Government Facility Emergency Shelter South Shore City Hall
Public
South Shore Town of South Shore
West Lake Front Drive
Population to Protect Campground Punished Woman Lake Campground
Private
South Shore Town of South Shore
101 S. Broad Street Population to Protect Day Care Tiny Tots Daycare
Private
South Shore Town of South Shore
210 W. Berry Ave Population to Protect Day Care Our Savior’s Lutheran Church
Private
South Shore Town of South Shore
300 S. Main Street Population to Protect Day Care Rhonda Schaefer Day Care
Private
South Shore Town of South Shore
203 Trailer Court Lane
Population to Protect Manufactured Home Court
Private Residences
Private
South Shore Town of South Shore
203 S. School Street Non Emergency Response Facility
Vacant School Building
South Shore School
Public
Wallace Town of Wallace 611 Main Street Emergency Services Fire Department Wallace Fire Department
Public
Wallace Town of Wallace 611 Main Street Government Facility Emergency Operations Center
Wallace Fire Department
Public
Wallace Town of Wallace 643 Main Street Government Facility Emergency Shelter Town Hall Public
Watertown City of Watertown 222 9th Ave SE Communications
Telephone, cable, Internet Services
Mid-continent Private
Watertown City of Watertown 22 2nd
St SE Communications Telephone, cable, Internet Services
Knology Private
Watertown City of Watertown 1511 9th
Ave SE Communications Telephone, cable, Internet Services
Swiftel Communications
Private
Watertown City of Watertown 200 E Kemp Ave Communications Telephone, cable, Internet Services
Lake Area Communications
Private
Watertown City of Watertown 1018 6th ST Communications Telephone, cable, Internet Services
RC Technologies Private
Watertown City of Watertown 128 Maple St NE Government Facility Building Watertown Police Station
Public
Watertown City of Watertown 14 1st Ave SE Government Facility Building Codington County Courthouse
Public
Watertown City of Watertown 14 1st Ave SE Government Facility Building
Codington County Sheriff’s Office
Public
Watertown City of Watertown 129 1st Ave NW Government Facility Building
Watertown Fire Department
Public
Watertown City of Watertown 500 Golf Course Road
Government Facility Building Watertown Fire Department
Public
Watertown City of Watertown 1201 10th
St NW Government Facility Emergency Fuel Facility
Codington County Highway Department
Public
Watertown City of Watertown 730 Arrow Ave Government Facility Emergency Fuel Facility
Watertown Street Department
Public
Watertown City of Watertown 119 S. Maple St Government Facility Emergency Power Facility
Watertown Detention Center
Public
Watertown City of Watertown 125 S. Broadway St Government Facility Emergency Shelter Watertown City Auditorium
Public
Watertown City of Watertown 125 S. Broadway St Government Facility Emergency Shelter Watertown City Auditorium
Public

Codington County Pre-Disaster Mitigation Plan 10-12-12 Page 47
Jurisdiction/ Entity
Location Address Sector Sub sector Name Owner Type
Watertown City of Watertown 1910 W. Kemp Ave Government Facility Emergency Shelter Codington County Extension Center
Public
Watertown City of Watertown 200 9th St NE Government Facility Emergency Shelter
Watertown High School
Public
Watertown City of Watertown 77 S Lake Dr Government Facility Emergency Shelter Stokes-Thomas City Park, Lake Kampeska
Public
Watertown City of Watertown 1200 N Lake Dr Government Facility Emergency Shelter Memorial Park, Lake Kampeska
Public
Watertown City of Watertown Non Emergency Response Facility
Railroad
Burlington Northern, Santé Fe (BNSF) DM&E
Private
Watertown City of Watertown 1000 Golf Course Rd Non Emergency Response Facility
Water Supply – Pump House
Derby Downs Public
Watertown City of Watertown 605 2nd
St NW Non Emergency Response Facility
Water Supply – Pump House
Mellette School Public
Watertown City of Watertown 300 14th
St SE Non Emergency Response Facility
Water Supply – Pump House
Larson Substation Area
Public
Watertown City of Watertown 405 14th Ave NW Non Emergency Response Facility
Water Supply - Storage Tanks
14th Ave NW Public
Watertown City of Watertown 302 14th St SE Non Emergency Response Facility
Water Supply - Storage Tanks
14th St SE Public
Watertown City of Watertown 1028 18th St NE Non Emergency Response Facility
Water Supply – Storage Tanks
19th
St NE Public
Watertown City of Watertown 16769 SD HWY 20 Non Emergency Response Facility
Water Supply – Storage Tanks
North Lake Drive Public
Watertown City of Watertown 955 S. Lake Dr. Non Emergency Response Facility
Water Supply – Storage Tanks
South Lake Drive Public
Watertown City of Watertown 1415 6th
Ave NW Non Emergency Response Facility
Water Supply – Wells
Treatment Plant Public
Watertown City of Watertown 119 S Maple St Non Emergency Response Facility
Water Supply – Wells
Detention Center Area
Public
Watertown City of Watertown 311 1st Ave NE
Non Emergency Response Facility
Electrical Supply Uptown Substation
Public
Watertown City of Watertown Fish Road SW Non Emergency Response Facility
Electrical Supply Pelican Substation
Public
Watertown City of Watertown 300 14th
St SE Non Emergency Response Facility
Electrical Supply East Substation Public
Watertown City of Watertown 3225 9th
Ave SW Non Emergency Response Facility
Electrical Supply West Substation Public
Watertown City of Watertown 901 4th Ave SW
Non Emergency Response Facility Electrical Supply
Watertown Municipal Utilities (Main Location)
Public
Watertown City of Watertown Loop around Watertown
Non Emergency Response Facility
Electrical Supply Transmission Line and Fiber Ring
Public
Watertown City of Watertown 701 20th
Ave SW Non Emergency Response Facility
Natural Gas Supply Peak Shaving Plant
Public
Watertown City of Watertown 702 20th
Ave SW Non Emergency Response Facility
Natural Gas Supply NNG - TBS Public
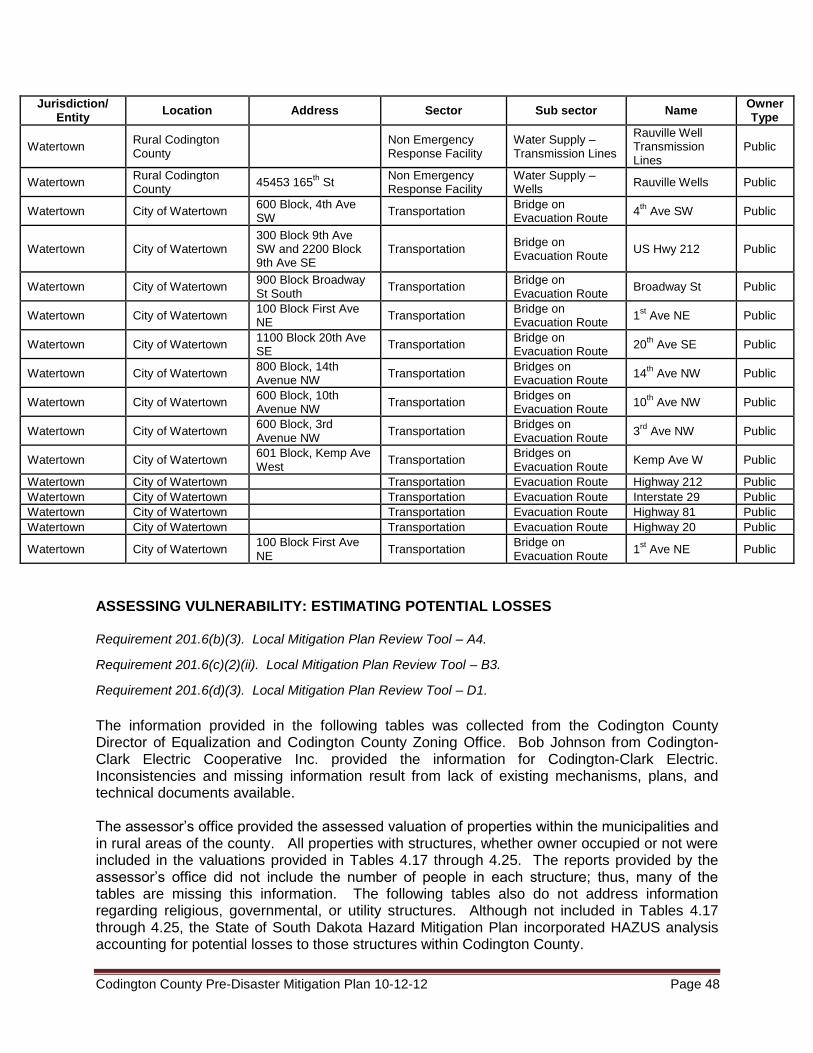
Codington County Pre-Disaster Mitigation Plan 10-12-12 Page 48
Jurisdiction/ Entity
Location Address Sector Sub sector Name Owner Type
Watertown Rural Codington County
Non Emergency Response Facility
Water Supply – Transmission Lines
Rauville Well Transmission Lines
Public
Watertown Rural Codington County
45453 165th
St Non Emergency Response Facility
Water Supply – Wells
Rauville Wells Public
Watertown City of Watertown 600 Block, 4th Ave SW
Transportation Bridge on Evacuation Route
4th
Ave SW Public
Watertown City of Watertown 300 Block 9th Ave SW and 2200 Block 9th Ave SE
Transportation Bridge on Evacuation Route
US Hwy 212 Public
Watertown City of Watertown 900 Block Broadway St South
Transportation Bridge on Evacuation Route
Broadway St Public
Watertown City of Watertown 100 Block First Ave NE
Transportation Bridge on Evacuation Route
1st Ave NE Public
Watertown City of Watertown 1100 Block 20th Ave SE
Transportation Bridge on Evacuation Route
20th
Ave SE Public
Watertown City of Watertown 800 Block, 14th Avenue NW
Transportation Bridges on Evacuation Route
14th
Ave NW Public
Watertown City of Watertown 600 Block, 10th Avenue NW
Transportation Bridges on Evacuation Route
10th
Ave NW Public
Watertown City of Watertown 600 Block, 3rd Avenue NW
Transportation Bridges on Evacuation Route
3rd
Ave NW Public
Watertown City of Watertown 601 Block, Kemp Ave West
Transportation Bridges on Evacuation Route
Kemp Ave W Public
Watertown City of Watertown Transportation Evacuation Route Highway 212 Public
Watertown City of Watertown Transportation Evacuation Route Interstate 29 Public
Watertown City of Watertown Transportation Evacuation Route Highway 81 Public
Watertown City of Watertown Transportation Evacuation Route Highway 20 Public
Watertown City of Watertown 100 Block First Ave NE
Transportation Bridge on Evacuation Route
1st Ave NE Public
ASSESSING VULNERABILITY: ESTIMATING POTENTIAL LOSSES Requirement 201.6(b)(3). Local Mitigation Plan Review Tool – A4.
Requirement 201.6(c)(2)(ii). Local Mitigation Plan Review Tool – B3.
Requirement 201.6(d)(3). Local Mitigation Plan Review Tool – D1.
The information provided in the following tables was collected from the Codington County Director of Equalization and Codington County Zoning Office. Bob Johnson from Codington-Clark Electric Cooperative Inc. provided the information for Codington-Clark Electric. Inconsistencies and missing information result from lack of existing mechanisms, plans, and technical documents available. The assessor’s office provided the assessed valuation of properties within the municipalities and in rural areas of the county. All properties with structures, whether owner occupied or not were included in the valuations provided in Tables 4.17 through 4.25. The reports provided by the assessor’s office did not include the number of people in each structure; thus, many of the tables are missing this information. The following tables also do not address information regarding religious, governmental, or utility structures. Although not included in Tables 4.17 through 4.25, the State of South Dakota Hazard Mitigation Plan incorporated HAZUS analysis accounting for potential losses to those structures within Codington County.

Codington County Pre-Disaster Mitigation Plan 10-12-12 Page 49
Table 4.17: Codington County (Rural Area) Estimated Potential Dollar Losses to Vulnerable Structures
Type of Structure Number of Structures Value of Structures Number of People
# in County
# in HA
% in HA
$ in County $ in HA % in HA
# in Rural Areas
# in HA
% in HA
Residential 1,697 37 2.18 $155,691,230 $3,394,564 2.18 4,622 103 2.23
Commercial/Industrial 99 2 2.02 $10,117,997 $204,383 2.02
Agricultural 921 34 3.69 $20,158,861 $743,862 3.69
Mobile Homes 235 5 2.13 $4,814,957 $102,446 2.13 Included in “Residential”
Total 2,952 78 2.64 $190,783,045 $4,445,255 2.33 4,622 103 2.23
Table 4.18: Florence Estimated Potential Dollar Losses to Vulnerable Structures
Type of Structure Number of Structures Value of Structures Number of People
# in City # in HA
% in HA
$ in City $ in HA
% in HA
# in City # in HA
% in HA
Residential 123 0 0 $7,284,594 0 0 374 0 0
Commercial/Industrial 22 0 0 $1,455,290 0 0
Agricultural 2 0 0 $2,754 0 0
Manufactured Home 28 0 0 $1,171,884 0 0
Total 175 0 0 $9,914,522 0 0 374 0 0
Table 4.19: Henry Estimated Potential Dollar Losses to Vulnerable Structures
Type of Structure Number of Structures Value of Structures Number of People
# in City # in HA
% in HA
$ in City $ in HA
% in HA
# in City # in HA
% in HA
Residential 101 0 0 $3,365,113 0 0 267 0 0
Commercial/Industrial 14 0 0 $537,410 0 0
Agricultural 1 0 0 $2,510 0 0
Manufactured Home 38 0 0 $1,123,834 0 0
Total 154 0 0 $5,028,867 0 0 267 0 0
Table 4.20: Kranzburg Estimated Potential Dollar Losses to Vulnerable Structures
Type of Structure Number of Structures Value of Structures Number of People
# in City # in HA
% in HA
$ in City $ in HA
% in HA
# in City # in HA
% in HA
Residential 61 0 0 $3,697,128 0 0 172 0 0
Commercial/Industrial 13 0 0 $399,494 0 0
Agricultural 1 0 0 $68,790 0 0
Manufactured Home 10 0 0 $297,325 0 0
Total 85 0 0 $4,462,737 0 0 172 0 0

Codington County Pre-Disaster Mitigation Plan 10-12-12 Page 50
Table 4.21: South Shore Estimated Potential Dollar Losses to Vulnerable Structures
Type of Structure Number of Structures Value of Structures Number of People
# in City # in HA
% in HA
$ in City $ in HA
% in HA
# in City # in HA
% in HA
Residential 103 0 0 $3,664,102 0 0 225 0 0
Commercial/Industrial 22 $914,763
Agricultural 2 $6,460
Manufactured Home 18 $501,577
Total 145 0 0 $5,086,902 0 0 225 0 0
Table 4.22: Wallace Estimated Potential Dollar Losses to Vulnerable Structures
Type of Structure Number of Structures Value of Structures Number of People
# in City # in HA
% in HA
$ in City $ in HA
% in HA
# in City # in HA
% in HA
Residential 48 0 0 $811,440 0 0 85 0 0
Commercial/Industrial 17 0 0 $582,480 0 0
Agricultural 2 0 0 0 0
Manufactured Home 4 0 0 $87,634 0 0
Total 71 0 0 $1,481,554 0 0 85 0 0
Table 4.23: Watertown Estimated Potential Dollar Losses to Vulnerable Structures
Type of Structure Number of Structures Value of Structures Number of People
# in City
# in HA*
% in HA
$ in City $ in HA % in HA
# in City
# in HA
% in HA
Residential 7,467 1,192 15.96 $713,322,845 $113,846,326 15.96 21,482 3,011 14.02
Commercial/Industrial 1,062 156 14.69 $295,170,186 $43,358,332 14.69
Agricultural 1 $3,160
Manufactured Home 973 215 22.09 $10,408,488 $2,299,923 22.09 Included in
“Residential”
Total 9,503 1,563 16.45 $1,018,904,679 $159,504,581 15.65 21,482 3,011 14.02 NOTE: *1,192 residential structures include: 917 single family dwelling units, 199 units in multiple family dwellings.
Table 4.24: Codington County Estimated Potential Dollar Losses to Vulnerable Structures
Type of Structure Number of Structures Value of Structures Number of People
# in County
# in HA
% in HA
$ in County $ in HA % in HA
# in County
# in HA
% in HA
Residential 9,600 1,229 12.80 $887,836,452 $117,240,890 13.21 27,227 3,114 11.44
Commercial/Industrial 1,249 158 12.65 $309,177,620 $43,562,715 14.09
Agricultural 930 34 3.66 $20,242,535 $743,862 3.68
Manufactured Homes 1,306 220 16.85 $18,405,699 $2,402,369 13.05 Included in “Residential”
Total 13,085 127 0.013 $1,235,662,306 $163,949,836 13.27 27,227 3,114 11.44

Codington County Pre-Disaster Mitigation Plan 10-12-12 Page 51
Notes: # in HA: Number in structures in hazard area was determined using land use surveys performed since 2008, aerial
photography and DFIRM boundaries provided by FEMA. Some structures included may have received LOMA’s, removing them from the flood plain, since the effective date of the current DFIRM.
$ in HA: Value of structures in hazard area was estimated by determining the average value per structure and multiplying that
value by the number of properties or structures used with a corresponding land use. # in [Jurisdiction]: The number of people was based on the 2010 Census. # in Hazard Area: The number of people in a hazard area was determined by multiplying the average household size of a given
community as identified by the number of structures in the identified hazard area, and multiplying that number by the rate of occupancy for the community (All statistics from the US Census 2010).
Table 4.25: Codington-Clark Electric Co-op Inc.
Estimated Potential Dollar Losses to Vulnerable Structures
Type of Structure Total Number of
Structures
Total Value of
Structures
HAZARDS
Flood Strong Winds
Tornado Winter Storms
Poles 2100 $1,867,200 Yes Yes Yes Yes Underground Equipment
75 $90,000 Yes No No No
Transformers/Wire 100 Transformers 97 Miles of Overhead Line
$1,479,000 Yes Yes Yes Yes
Substations N/A N/A No No No No SOURCE: Codington-Clark Electric Cooperative Inc.
As part of the State of South Dakota Hazard Mitigation Plan, data were prepared for specific hazard types. Although the data is not current, the modeling used in the plan would be difficult to replicate or improve upon. The following sections describing vulnerability to flooding and tornadoes is based largely on the corresponding sections in the State of South Dakota Hazard Mitigation Plan. Flooding Portions of the Big Sioux Watershed were identified in the State of South Dakota Hazard Mitigation Plan as priority regions and jurisdiction. Based on its history of flood problems, the County was deemed a high priority jurisdiction in South Dakota’s Plan. For that reason HAZUS-MH analysis was performed in conjunction with the completion of the State’s Plan. The results were based on flooding with a one percent chance of occurrence or commonly referred to as a “100-year flood” and display the potential base flood losses to the County. Most startlingly the results indicate a flood of the projected magnitude would displace three thousand twenty seven (3,027) people. The full results of HAZUS-MH analysis for the County are displayed in Table 4.26

Codington County Pre-Disaster Mitigation Plan 10-12-12 Page 52
Table 4.26: HAZUS-MH Base Flood (1 Percent Chance) Loss Estimation Results (2007)
Building Damage
Loss Ratio*
Contents Damage and
Inventory Loss
Total Economic Building
Loss
Number of Displaced
People
People Needing Shelter
$28,917,000 1.70% $48,403,000 $81,843,000 3,027 2,301 SOURCE: State of South Dakota Hazard Mitigation Plan. p 3-147; Table 3-41. South Dakota Office of Emergency Management. 2011.
*Loss ratio is the percent of the total building inventory value that could be damaged from flooding in any given year.
Tornado As part of the State of South Dakota Hazard Mitigation Plan HAZUS-MH analysis was performed calculating potential building exposure to tornadoes in the state. Total value of structures lost due to tornadoes from 1950 – 2009 was calculated, inflated to current (2009) dollars. A loss ratio was then calculated by dividing the total damage by the total building exposure. Table 4.27 identifies data specific to the annualized losses from tornadoes for the County as identified in the State of South Dakota Hazard Mitigation Plan.
Table 4.27: Codington County Annualized Losses from Tornadoes
Total Events 1950-2009
Total Property Damage (inflated) 1950-2009
Annualized Losses
Total Building Exposure Loss Ratio
29 $20,494,124.00 $341,569.00 $1,678,645.00 0.0002 SOURCE: State of South Dakota Hazard Mitigation Plan. p. 3-179; Table 3-67. South Dakota Office of Emergency Management. 2011.
ASSESSING VULNERABILITY: ANALYZING DEVELOPMENT TRENDS Requirement 201.6(b)(3). Local Mitigation Plan Review Tool – A4.
Requirement 201.6(c)(3). Local Mitigation Plan Review Tool – C1.
Requirement 201.6(d)(3). Local Mitigation Plan Review Tool – D1.
Requirement 201.6(d)(3). Local Mitigation Plan Review Tool – D2.
The land use and development trends for each jurisdiction were identified by the representatives from each of the jurisdictions. The only communities in the County that are experiencing any growth and/or development at this time are Watertown and Florence and some rural areas around Watertown. The rest of the jurisdictions have experienced declining populations over the past ten years and at this time are just trying to maintain the population they have. Despite declining populations the smaller jurisdictions, except for Wallace, maintain Comprehensive Land Use Plans for growth and development.

Codington County Pre-Disaster Mitigation Plan 10-12-12 Page 53
UNIQUE OR VARIED RISK ASSESSMENT Requirement 201.6(c)(2)(i). Local Mitigation Plan Review Tool – B1.
Requirement 201.6(c)(2)(ii). Local Mitigation Plan Review Tool – B3.
Requirement 201.6(d)(3). Local Mitigation Plan Review Tool – D1.
After conducting the risk assessment for each jurisdiction, the PDM Planning Team decided that all areas of the county have an equal chance of a natural hazard occurrence in their area. While the extent to which each jurisdiction is affected by such hazards varies slightly between the local jurisdictions, the implications are the same. Thus the PDM Planning Team decided that all jurisdictions in the County, with the exception of Watertown because of its size, are equally affected by the types of hazards/risks that affect the PDM jurisdiction. Thus, the unique or varied risk requirement is not applicable to the Codington County PDM. On the following pages, a hazard vulnerability map is shown for each of the jurisdictions participating in this PDM. The maps identify critical infrastructure and one hundred year flood plain. Since the other major hazards facing the county are not geographically based. Winter storms and severe summer storms are about as likely to occur in one part of the county as another. Similarly, wildfires can occur almost anywhere in the county, although they are more likely to occur in areas with extensive grassland cover or shrubs. While specific locations for above ground electrical distribution lines are not identified on the map(s), they are located throughout the County and are vulnerable to both flooding and severe weather. (See Figures 4.1 through 4.7).

Codington County Pre-Disaster Mitigation Plan 10-12-12 Page 54
Figure 4.1: Codington County Hazard Vulnerability Map
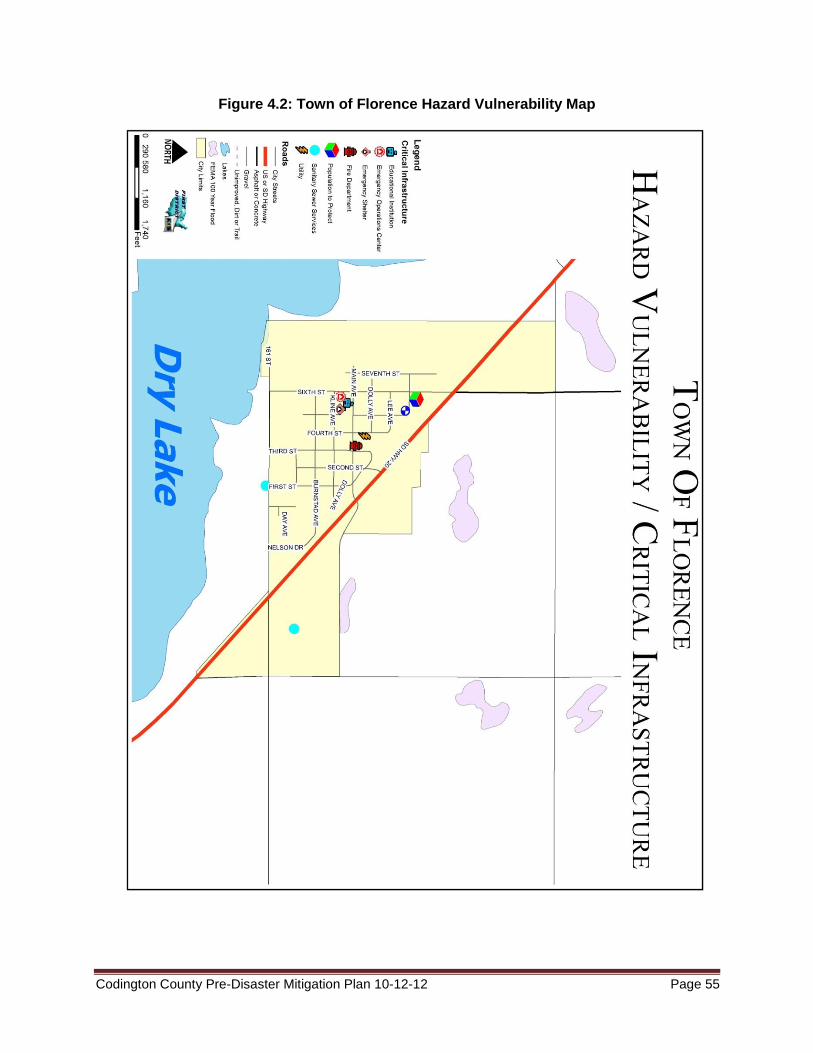
Codington County Pre-Disaster Mitigation Plan 10-12-12 Page 55
Figure 4.2: Town of Florence Hazard Vulnerability Map

Codington County Pre-Disaster Mitigation Plan 10-12-12 Page 56
Figure 4.3: Town of Henry Hazard Vulnerability Map

Codington County Pre-Disaster Mitigation Plan 10-12-12 Page 57
Figure 4.4: Town of Kranzburg Hazard Vulnerability Map

Codington County Pre-Disaster Mitigation Plan 10-12-12 Page 58
Figure 4.5: Town of South Shore Hazard Vulnerability Map
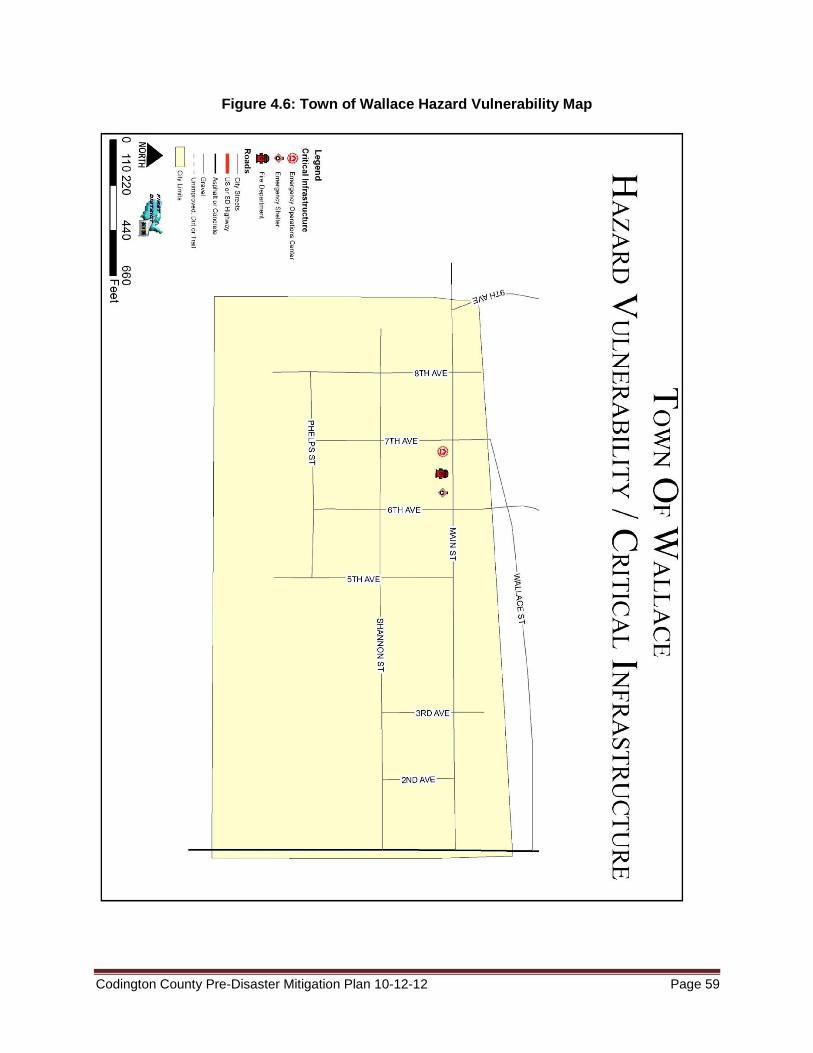
Codington County Pre-Disaster Mitigation Plan 10-12-12 Page 59
Figure 4.6: Town of Wallace Hazard Vulnerability Map

Codington County Pre-Disaster Mitigation Plan 10-12-12 Page 60
Figure 4.7: City of Watertown Hazard Vulnerability Map
Codington County Pre-Disaster Mitigation Plan 10-12-12 Page 61
CHAPTER 5 MITIGATION STRATEGY
MITIGATION OVERVIEW Requirement 201.6(c)(3)(i). Local Mitigation Plan Review Tool – C3.
Requirement 201.6(c)(3)(ii). Local Mitigation Plan Review Tool – C4.
Requirement 201.6(c)(3)(iii) & (iv). Local Mitigation Plan Review Tool – C5.
Requirement 201.6(d)(3). Local Mitigation Plan Review Tool – D3.
The State Hazard Mitigation Plan addresses several mitigation categories including warning and forecasting, community planning, and infrastructure reinforcement. The County and participating entities’ greatest needs are mitigating flood hazards, backup generators for critical infrastructure, construction of storm shelters, and public awareness. After the completion of the risk assessment (identification of hazards, probability of hazards and vulnerability to hazards), it was the mutual consensus of the PDM Planning Team that mitigation strategies of the PDM should focus on the following hazards: winter storms, severe summer storms, flooding, wildfires (urban/rural) The PDM Planning Team completed the goal identification process by considering the county’s and participating jurisdictions’ vulnerability to each identified hazard, and the severity of the threat posed by each hazard. Much of the discussion focused on damage caused by past events, and what could be done to ensure that future damage will be lessened or eliminated. By reviewing each jurisdiction’s Comprehensive Land Use Plan (if available), the participants also considered how future development might affect the county’s and participating jurisdictions’ vulnerability to the hazards they face. When identifying goals, numerous activities or projects were identified with broadly defined benefits to numerous jurisdictions within the County. Numerous actions were agreed by the PDM Planning Team to have broad reaching benefits but due to scope or varying levels of importance to individual jurisdictions no specific cost, timeframe, or priority was assigned. Likewise many infrastructure projects and policies throughout all communities would mitigate hazards but were not located in the most vulnerable areas. Those activities/policies are listed below with the goals and priorities for each of the hazards as determined by the PDM Planning Team. For example all communities benefit from flood-proofing lift stations or burying above ground electric utility lines. Specific projects are listed in Table 5.1 and represented in Figures 5.1 through 5.7).

Codington County Pre-Disaster Mitigation Plan 10-12-12 Page 62
1. Reduce the loss of life, property, infrastructure, critical facilities, cultural resources
and impacts from severe weather, flooding and other natural disasters.
2. Improve public safety during severe weather, flooding and other natural disasters.
3. Improve the County’s Emergency Preparedness and Disaster Response and Recovery capabilities.
Goal #1: Protect specific areas of Codington County from flooding. Goal #2: Educate and inform Codington County residents regarding flooding safety. Goal #3: Reduce the extent to which utility mishaps affect areas during flooding events. Actions/Projects to reduce risk through policy implementation
Purchase LiDAR
Public education. Disseminate information regarding how to deal with flooding. This would include transportation issues, home protection strategies, safety issues, and how to move forward after a flooding situation
Conduct necessary studies addressing drainage (storm water flow/runoff, etc)
Participation in the National Flood Insurance Program for those jurisdictions not currently participating.
Ensure continued National Flood Insurance Program compliance.
Work to improve the level of communication and coordination with the State NFIP coordinator.
Encouraging homeowners in flood-prone areas to purchase flood insurance.
Adoption and enforcement of zoning for those jurisdictions without zoning.
Developing a county/city drainage ordinance.
Develop building code standards
Continue enforcement of building codes
Identify and prioritize capital/structural mitigation projects that are cost effective and technically feasible
Actions/Projects to change the characteristics or impacts of hazards
Add additional stream gages along rivers within the county.
Installing or upgrading storm sewer piping.
Installing or enlarging drainage culverts.
Installing or enlarging detention/retention ponds.
Curbing and guttering of city streets to improve storm water flow.
Clean out debris in drainage areas, tributaries, etc to improve water flow
Waterproof lift stations.
Install valves, plugs in sanitary and storm sewer system.
Principal Goals
Mitigation Activities for Flooding Hazards

Codington County Pre-Disaster Mitigation Plan 10-12-12 Page 63
Establish county, community, and township coalitions to pursue Acquisitions, raising and relocation of flood-prone structures and repetitive loss priorities.
Preservation and expansion of open space along the river and enhancement of existing berm areas.
Resolve and act upon Big Sioux River/Mahoney Creek Detention/Retention Structure.
Work with property owners to implement deed restrictions for open lots/vacant properties along the Big Sioux River to prevent development.
Actions to reduce loss potential of infrastructure to hazards
Fortify existing levees
Replace and raise bridges
Elevating roads in flood-prone areas
Making structural retrofits to facilities – Elevation, Rip-rap projects, etc.
Goal #1: Increase public awareness and education on severe weather issues. Goal #2: Improve public safety during severe weather. Goal #3: Reduce the extent to which utility mishaps affect areas during severe weather
situations. Goal #4: Reduce crippling effects of winter storms, especially regarding smaller communities. Actions/Projects to reduce risk through policy implementation
Public education. Disseminate information regarding how to deal with severe weather (summer/winter). Some of the issues that may be addressed within the information would include: safety issues on downed power lines, electrical and fire dangers, the necessity for generators and advice on using them, protecting property, survival strategies during storms, and purchasing of back-up power for various household and farming operations.
Identify and prioritize capital/structural mitigation projects that are cost effective and technically feasible
Gather data to create a more precise loss estimate for winter storms.
Gather data to create a more precise loss estimate for summer storms.
Improve hazard warning systems and notification to vulnerable populations.
Actions/Projects to change the characteristics or impacts of hazards
Construct tornado safe rooms or community shelters.
Construct storm shelters at manufactured home parks
Construct storm shelters at RV parks.
Survey areas in need of snow shelterbelts and plant trees accordingly.
Install backup generators
Install or plant living snow fences
Construct new or improve existing warning systems
Mitigation Activities for Severe Weather Hazards (summer and winter)

Codington County Pre-Disaster Mitigation Plan 10-12-12 Page 64
Actions/Projects to reduce loss potential of infrastructure to hazards
Upgrading of utility lines.
Burial of utility lines when needed.
Require upgrading of overhead lines when age or disasters provide an opportunity.
Removal of trees near power lines.
Attachment of guy wires to dead-end poles.
Utilization of T2 Conductors
Testing integrity of poles
Usage of anti galloping devices
Making structural retrofits to facilities.
Goal #1: Increase fire fighting capabilities. Goal #2: Reduce the negative effects droughts have on Codington County. Goal #3: Reduce the negative effects wildfires have on Codington County. Actions/Projects to reduce risk through policy implementation
Find funding sources to pay for persons to fill positions while individuals are at training courses.
Adoption and enforcement of property regulations in areas vulnerable to wildfire.
Educate residents on the benefits of conserving water at all times, not just during a drought.
Actions/Projects to change the characteristics or impacts of hazards
Dredge reservoirs to improve water quality. Reservoirs silt in and dredging, water can flow to more places, more quickly, and more easily.
Burn areas to ensure a fire break rather than ignition fuel.
Improve fire protection capabilities by constructing additional water supply and improving infrastructure to allow hookups to hydrants.
Minimize damage to local crops due to drought situations. Develop water rationing measures that will be implemented during a drought situation.
Work with local farmers to investigate the use of more drought resistant crops. Actions/Projects to reduce loss potential of infrastructure to hazards
Ensure that fire departments are adequately equipped to respond to wildfires
Have rural fire departments locate dry fire hydrants.
Mitigation Activities for Fire and Drought Hazards

Codington County Pre-Disaster Mitigation Plan 10-12-12 Page 65
Technological:
Develop a working computer aided mapping project for the County. This would be model using overlays of GIS data, HazMat, and Roads.
Enhance existing computer aided dispatch.
Use HAZUS software to estimate losses in flooding situations. Information may also be able to be used for other hazard areas.
Planning:
Find funding to review and update the regional and local disaster mitigation plans on a five-year cycle.
Incorporate disaster mitigation actions into appropriate local and regional plans – Master Plans, land use, transportation, open space, and capital programming.
Integrate disaster mitigation concerns into subdivision, site plan review, and other zoning reviews. In particular require the consideration of downstream flooding impacts caused by new projects.
Integrate disaster mitigation concerns into transportation projects (e.g. drainage improvements, underground utilities, etc.).
Improve the information available on at-risk properties and repetitive loss structures, in order to refine strategies.
Develop a means for sharing information on a regional basis about successful disaster mitigation planning and programs.
Administration/Coordination:
Identify and pursue funding that builds local capacity and supports grant-writing for mitigation actions identified in the PDM.
Increase communication /coordination between federal, state, regional, county, municipal, private, and non-profit agencies in the area of pre-disaster mitigation.
Maintain and enhance working relationships with the utilities. After meetings with the local jurisdictions and opportunities for public input, a series of mitigation goals were devised to best aid the County in reducing and lessening the effects of hazards. Projects previously identified in the 2012 PDM were carefully analyzed and discussed to determine which of the projects had enough merit to be included in the updated PDM and to determine if the projects meet the hazard mitigation needs of the county (Please see Appendix G). These projects were evaluated based on a cost/benefit ratio and priority. Although this PDM focuses on disaster mitigation rather than disaster preparedness, some communities discussed disaster preparedness projects as well. It was difficult for individual communities to recognize the difference between providing storm shelters and making sure the storm shelters function properly (for example). Actions considered in this category included the acquisition of emergency generators, and erecting or replacing warning sirens in areas that currently are not well served.
General Mitigation Activities

Codington County Pre-Disaster Mitigation Plan 10-12-12 Page 66
Most of the mitigation actions proposed by the jurisdictions were identified by city council members, public works personnel, or PDM Planning Team members from the jurisdiction. Some actions were also proposed by townships and utility providers do to the direct impact of disasters on infrastructure and services they provide. Once each jurisdiction had its list of proposed actions complete, it was submitted to the Emergency Management Director. At the third PDM Planning Team meeting, the actions were reviewed. At the fourth PDM Planning Team meeting a final opportunity was given for the jurisdictions to add any additional actions. Although in some cases additional data will be necessary, a timeframe for completion, oversight, funding sources, and any other relevant issues were addressed. These implementation strategies are geared toward the specific goal and area. Often, these projects will not encounter any resistance from environmental agencies, legal authorities, and political entities. Table 5.1 is a presentation of the mitigation actions proposed by the PDM Planning Team. In addition to identifying the proposed actions, the table includes additional information about each action. Elected officials and staff of each municipality and the county were responsible for providing most of this information for actions in their community, but the other planning participants helped in this process. The following information is provided for each action:
The local priority rating (discussed in the next section).
The time frame to accomplish the action – “Short” means actions that are intended to be initiated within two years, “Medium” is for actions that should be started within five years, and “Long” is for actions that are not anticipated to be started for at least five years.
The party(s) primarily responsible for implementing the action.
The estimated cost - estimates for many of the actions were obtained from knowledgeable sources based on current information. Estimates are subject to change due to specific details of specific projects.
Potential sources of funding (discussed below).
The primary hazard being addressed.
The goal corresponding to the action. As mentioned above, jurisdictions and entities integrally involved in the planning for disasters due to wide ranging implications to them include townships and most utility providers (responses for Watertown Municipal Utilities were gathered with other departments of the City of Watertown Staff). Utility providers were represented on the PDM Planning Team. Each utility provider was asked individually to submit their own mitigation actions. The main mitigation activity proposed by utility providers was the burying of overhead lines in rural areas of the county. In addition, a meeting in which all township supervisors was held on April 5, 2011. At that meeting the Township supervisors were asked to identify potential mitigation projects. The timing of the meeting caused some confusion and led to a narrow scope of projects since the townships were asked to provide detailed information regarding damage caused by spring flooding at the same time. Each individual township provided maps in varying detail regarding potential mitigation activities. Primarily these activities included replacing culverts with larger culverts, elevating or rip-rapping roads, and reconstructing roads. Appendix E includes maps of vulnerable sites and potential mitigation actions proposed by the townships in the County.

Codington County Pre-Disaster Mitigation Plan 10-12-12 Page 67
Particular attention needs to be paid to sources of funding for the actions. Given the existing financial reality of very tight county and municipal budgets, some of the proposed actions realistically cannot be implemented without substantial grant assistance. With such assistance, it is likely that many of the high priority projects can be undertaken without placing an onerous burden on local budgets. Resources for some of the actions available from FEMA through the South Dakota Office of Emergency Management include the Hazard Mitigation Grant Program, Pre-Disaster Mitigation grant program, and Flood Mitigation Assistance grant programs. Other possible sources of funding include: Grant and loan programs/sources
Community Development Block Grant program
Economic Development Administration
FEMA Assistance to Firefighters Grant program
South Dakota Dept of Environment and Natural Resources
South Dakota Dept of Transportation
US Department of Agriculture Rural Development Office Local resources
General obligation bonds
Revenue bonds
Tax Increment Financing (TIF) districts

Codington County Pre-Disaster Mitigation Plan 10-12-12 Page 68
Table 5.1: Proposed Mitigation Activities
CODINGTON COUNTY ACTIONS RATING TIMEFRAME CONTACT COST
FUNDING SOURCE HAZARD GOAL
Install 12" to 18" tile or dig trench to move water away from 442nd Ave between 166 and 167th St. High Short
Codington County Highway Superintendant $10,000.00 HMGP Flooding
Protect Specific Areas of Codington County from
floods.
Rip Rap Shoreline at Memorial Park Medium Medium
Codington County
Maintenance Supervisor $200,000.00 HMGP/DENR Flooding
Protect Specific Areas of Codington County from
floods.
TOWN OF FLORENCE ACTIONS RATING TIMEFRAME CONTACT COST
FUNDING SOURCE HAZARD GOAL
Purchase of Back-up Generator for emergency shelter. High Short
(Florence) Finance Officer $50,000.00 HMGP/OEM
Severe Weather Hazards (Summer
and Winter)
Reduce the extent to which utility mishaps affect areas
during severe weather situations.
Supplies for emergency shelter (cots, blankets, first aid, etc.) High Short
(Florence) Finance Officer $1,000.00 OEM
Severe Weather Hazards (Summer
and Winter) Improve public safety
during severe weather.
Upgrade waterline size throughout the town. Medium Long
(Florence) Finance Officer UNKNOWN HMGP/CDBG Fire
Increase fire fighting capabilities.
Construction of Tornado Shelter. Medium Short
(Florence) Finance Officer $50,000.00 HMGP Tornado
Improve public safety during severe weather.
Construction of Water Tower/Tank. Medium Long
(Florence) Finance Officer UNKNOWN CDBG/RD Fire
Increase fire fighting capabilities.

Codington County Pre-Disaster Mitigation Plan 10-12-12 Page 69
TOWN OF HENRY ACTIONS RATING TIMEFRAME CONTACT COST
FUNDING SOURCE HAZARD GOAL
Purchase of Back-up Generator for Lift Station. High Medium
(Henry)Finance Officer $50,000.00 HMGP/OEM
Severe Weather Hazards (Summer and Winter)
Reduce the extent to which utility mishaps affect areas during severe weather situations.
Construction of Tornado Shelter. High Medium
(Henry)Finance Officer $50,000.00 HMGP Tornado
Improve public safety during severe weather.
Rip Rap sanitary sewer lagoons (secondary cells). Medium Long
(Henry)Finance Officer $65,000.00 DENR Flooding
Protect Specific Areas of Codington County from floods.
Additional hose and pump truck supplies for fire department. High Short Henry Fire Dept $6,000.00 FIRE Fire
Increase fire fighting capabilities.
TOWN OF KRANZBURG ACTIONS RATING TIMEFRAME CONTACT COST
FUNDING SOURCE HAZARD GOAL
Upgrade Siren System Low Medium Town Board President $30,000.00 HMGP
Severe Weather Hazards (Summer and Winter)
Improve public safety during severe weather.
Purchase of Back-up Generator for emergency shelter. High Short
Town Board President $50,000.00 HMGP
Severe Weather Hazards (Summer and Winter)
Reduce the extent to which utility mishaps affect areas during severe weather situations.
Drainage Tile NE corner of community High Short
Town Board President $50,000.00 HMGP Flooding
Protect Specific Areas of Codington County from floods.

Codington County Pre-Disaster Mitigation Plan 10-12-12 Page 70
Construction of Tornado Shelter. Medium Short
Town Board President $50,000.00 HMGP Tornado
Improve public safety during severe weather.
Zoning Regulations Update Medium Short
Town Board President $3,000.00 Local Flooding
Improve public safety during severe weather.
TOWN OF SOUTH SHORE ACTIONS RATING TIMEFRAME CONTACT COST
FUNDING SOURCE HAZARD GOAL
Raise E. Lake Front Drive (3 feet) near elevator Medium Medium
Town Board President $25,000.00 HMGP/DOT Flooding
Protect Specific Areas of Codington County from floods.
Purchase of Back-up Generator for Water System. Medium Medium
Town Board President $50,000.00 HMGP/OEM
Severe Weather Hazards (summer and winter)
Reduce the extent to which utility mishaps affect areas during severe weather situations.
Sanitary Sewer Shut-off Valves Medium Medium
Town Board President $20,000.00 HMGP Flooding
Reduce the extent to which utility mishaps affect areas during severe weather situations.
Zoning Regulations Update Low Short
Town Board President $3,000.00 Local Flooding
Improve public safety during severe weather.

Codington County Pre-Disaster Mitigation Plan 10-12-12 Page 71
TOWN OF WALLACE ACTIONS RATING TIMEFRAME CONTACT COST
FUNDING SOURCE HAZARD GOAL
Coordinated Drainage: Draining of slough on South Edge of Town/Increased culvert size on 437th Ave. High Short
(Wallace) Town Board $35,000.00 HMGP Flooding
Protect Specific Areas of Codington County from floods.
Reconstructing/Raising Phelps St. and reconfiguring drainage associated with it. Medium Medium
(Wallace) Town Board $15,000.00 HMGP/DENR Flooding
Protect Specific Areas of Codington County from floods.
Purchase of Back-up Generator for EOC (Wallace). Low Medium
(Wallace) Town Board $50,000.00 HMGP/OEM
Severe Weather Hazards (summer and winter)
Reduce the extent to which utility mishaps affect areas during severe weather situations.
Construction of Tornado Shelter. Medium Long
(Wallace) Town Board $50,000.00 HMGP Tornado
Improve public safety during severe weather.
CITY OF WATERTOWN ACTIONS RATING TIMEFRAME CONTACT COST
FUNDING SOURCE HAZARD GOAL
Mahoney Creek Dam High Long City Engineer $40,000,000.00 USACE Flooding
Protect Specific Areas of Codington County from floods.
Storm Sewer (11th St East) replace/upsize High Medium City Engineer $1,200,000.00 DOT Flooding
Protect Specific Areas of Codington County from floods.
Broadway Bridge Replacement High Short City Engineer $489,000.00 DOT Flooding
Protect Specific Areas of Codington County from floods.
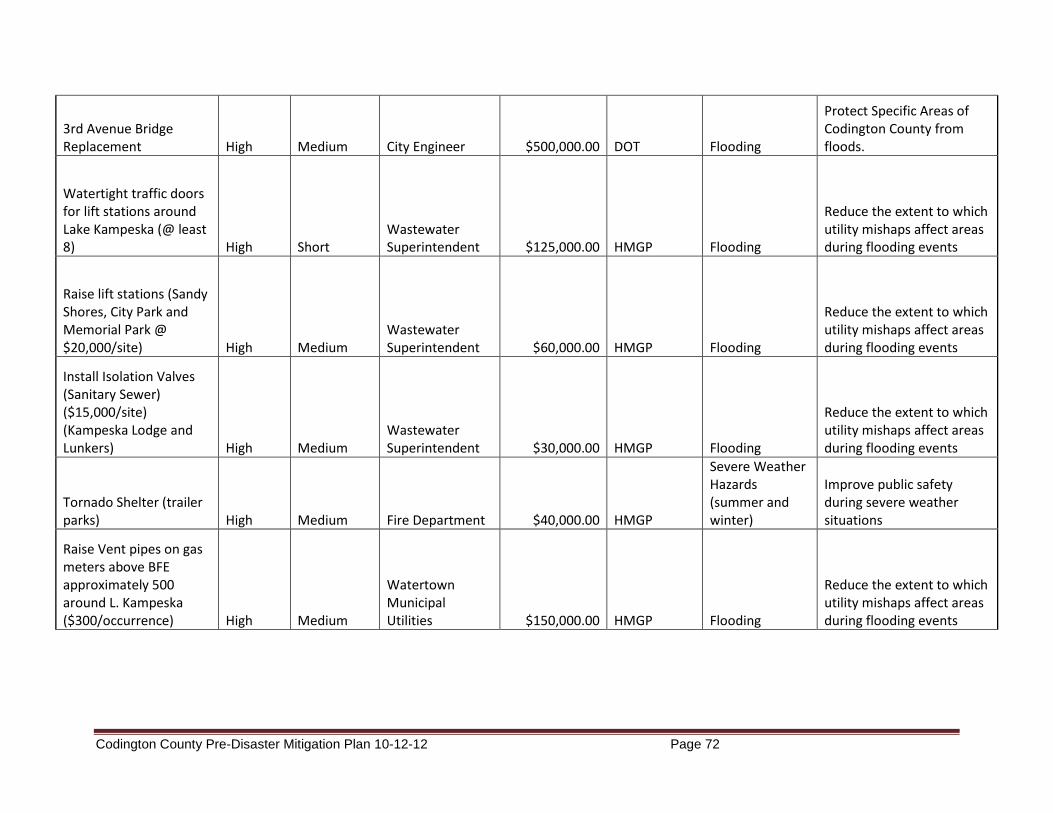
Codington County Pre-Disaster Mitigation Plan 10-12-12 Page 72
3rd Avenue Bridge Replacement High Medium City Engineer $500,000.00 DOT Flooding
Protect Specific Areas of Codington County from floods.
Watertight traffic doors for lift stations around Lake Kampeska (@ least 8) High Short
Wastewater Superintendent $125,000.00 HMGP Flooding
Reduce the extent to which utility mishaps affect areas during flooding events
Raise lift stations (Sandy Shores, City Park and Memorial Park @ $20,000/site) High Medium
Wastewater Superintendent $60,000.00 HMGP Flooding
Reduce the extent to which utility mishaps affect areas during flooding events
Install Isolation Valves (Sanitary Sewer) ($15,000/site) (Kampeska Lodge and Lunkers) High Medium
Wastewater Superintendent $30,000.00 HMGP Flooding
Reduce the extent to which utility mishaps affect areas during flooding events
Tornado Shelter (trailer parks) High Medium Fire Department $40,000.00 HMGP
Severe Weather Hazards (summer and winter)
Improve public safety during severe weather situations
Raise Vent pipes on gas meters above BFE approximately 500 around L. Kampeska ($300/occurrence) High Medium
Watertown Municipal Utilities $150,000.00 HMGP Flooding
Reduce the extent to which utility mishaps affect areas during flooding events

Codington County Pre-Disaster Mitigation Plan 10-12-12 Page 73
Mitigation (elevation, buyout, relocate) of repetitive loss residences ($30,000 per site) Low Long City Engineer $2,250,000.00 HMGP Flooding
Reduce the extent to which utility mishaps affect areas during flooding events
Emergency Shelter (multi-purpose rec center) Low Long Fire Department $50,000.00 HMGP
Severe Weather Hazards (summer and winter)
Improve public safety during severe weather situations
Generator for lift stations (3) Low Medium
Wastewater Superintendent $200,000.00 HMGP/OEM
Severe Weather Hazards (summer and winter)
Reduce the extent to which utility mishaps affect areas during flooding events
Contour Mapping (i.e. LIDAR) Medium Medium City Engineer $30,000.00 HMGP Flooding
Educate and inform Codington County residents regarding flooding safety
Roby Creek drainage improvements (Bank stabilization, clean out, definition, detention/conveyance) Medium Medium City Engineer $500,000.00 DENR/HMGP Flooding
Protect Specific Areas of Codington County from floods.
Big Sioux River Drainage Improvements (Box Culverts on Kemp, Cleanout of RR Tressel) Medium Medium City Engineer $500,000.00 DENR/HMGP Flooding
Protect Specific Areas of Codington County from floods.
19th Street Drainage improvement, curb) Low Medium City Engineer $930,000.00 DOT Flooding
Protect Specific Areas of Codington County from floods.

Codington County Pre-Disaster Mitigation Plan 10-12-12 Page 74
10th Avenue N urban systems Low Medium City Engineer $1,425,000.00 DOT Flooding
Protect Specific Areas of Codington County from floods.
14th Avenue N Drainage and curb Low Long City Engineer $1,320,000.00 DOT Flooding
Protect Specific Areas of Codington County from floods.
Upgraded Back - up generator for uptown fire station Medium Short Fire Department $50,000.00 HMGP/OEM
Severe Weather Hazards (summer and winter)
Reduce the extent to which utility mishaps affect areas during severe weather situations.
Replacement of all weather sirens. High Short Fire Department $325,000.00 HMGP
Severe Weather Hazards (summer and winter)
Improve public safety during severe weather situations
CODINGTON-CLARK ELECTRIC ACTIONS RATING TIMEFRAME CONTACT COST
FUNDING SOURCE HAZARD GOAL
Burial of Overhead Lines (Line E) High Short
Codington-Clark Electric $120,000.00 HMGP
Severe Weather Hazards (winter)
Reduce the extent to which utility mishaps affect areas during severe weather situations.
Burial of Overhead Lines (Line F) High Short
Codington-Clark Electric $156,800.00 HMGP
Severe Weather Hazards (winter)
Reduce the extent to which utility mishaps affect areas during severe weather situations.

Codington County Pre-Disaster Mitigation Plan 10-12-12 Page 75
Burial of Overhead Lines (Line K) High Short
Codington-Clark Electric $134,600.00 HMGP
Severe Weather Hazards (winter)
Reduce the extent to which utility mishaps affect areas during severe weather situations.
Burial of Overhead Lines (Line L) High Short
Codington-Clark Electric $112,700.00 HMGP
Severe Weather Hazards (winter)
Reduce the extent to which utility mishaps affect areas during severe weather situations.
Burial of Overhead Lines (Line S) High Short
Codington-Clark Electric $110,000.00 HMGP
Severe Weather Hazards (winter)
Reduce the extent to which utility mishaps affect areas during severe weather situations.
Burial of Overhead Lines (Line in Sections 15 and 16 of Dexter Township) Medium Medium
Codington-Clark Electric $70,000.00 HMGP
Severe Weather Hazards (winter)
Reduce the extent to which utility mishaps affect areas during severe weather situations.
Burial of Overhead Lines (Line in Sections 14 and 23 Dexter Township) Medium Medium
Codington-Clark Electric $70,000.00 HMGP
Severe Weather Hazards (winter)
Reduce the extent to which utility mishaps affect areas during severe weather situations.
Burial of remaining overhead lines (typically serving 1 customer per mile) Low Medium
Codington-Clark Electric UNKNOWN HMGP
Severe Weather Hazards (winter)
Reduce the extent to which utility mishaps affect areas during flooding events

Codington County Pre-Disaster Mitigation Plan 10-12-12 Page 76
Figure 5.1: Codington County Potential Mitigation Project Map

Codington County Pre-Disaster Mitigation Plan 10-12-12 Page 77
Figure 5.2: Town of Florence Potential Mitigation Project Map

Codington County Pre-Disaster Mitigation Plan 10-12-12 Page 78
Figure 5.3: Town of Henry Potential Mitigation Project Map

Codington County Pre-Disaster Mitigation Plan 10-12-12 Page 79
Figure 5.4: Town of Kranzburg Potential Mitigation Project Map

Codington County Pre-Disaster Mitigation Plan 10-12-12 Page 80
Figure 5.5: Town of South Shore Potential Mitigation Project Map

Codington County Pre-Disaster Mitigation Plan 10-12-12 Page 81
Figure 5.6: Town of Wallace Potential Mitigation Project Map

Codington County Pre-Disaster Mitigation Plan 10-12-12 Page 82
Figure 5.7: City of Watertown Potential Mitigation Project Map
Codington County Pre-Disaster Mitigation Plan 10-12-12 Page 83
IMPLEMENTATION OF MITIGATION ACTIONS Requirement 201.6(c)(4)(ii). Local Mitigation Plan Review Tool – C6.
Requirement 201.6(d)(3). Local Mitigation Plan Review Tool – D3.
Upon adoption of the updated Codington County PDM, each jurisdiction will become responsible for implementing its own mitigation actions. The planning required for implementation is the sole responsibility of the local jurisdictions and private businesses that have participated in the PDM update. All of the municipalities have indicated that they do not have the financial capability to move forward with projects identified in the PDM at this time, however, all will consider applying for funds through the State and Federal Agencies once such funds become available. If and when the municipalities are able to secure funding for the mitigation projects, they will move forward with the projects identified. The City of Watertown and Codington-Clark Electric had several mitigation projects and thus, will prioritize those projects in a manner that will ensure benefit is maximized to the greatest extent possible. A benefit cost analysis will be conducted on an individual basis after the decision is made to move forward with a project. The 2004 PDM was the first approved mitigation plan that the County has ever had on file. At the time the PDM was drafted the requirements for an approved mitigation plan were much different than the current July 1, 2008 crosswalk. Since disaster mitigation was a relatively new concept at that time, mitigation plans were approved with less scrutiny. The same depth of planning was not utilized in the 2004 PDM as was used for the 2011 PDM update. The 2004 PDM had the “bare minimum” to meet the FEMA requirements for a mitigation plan, thus the PDM lacked relevant information that could be utilized and easily integrated into the County’s and Municipalities’ existing planning mechanisms. Thus, the 2004 PDM was not used or incorporated into other planning documents or mechanisms. From a practical standpoint the 2011 PDM update required communities to reflect on past disasters, consider future disasters, and think about how or if future disasters would be handled differently, or better. It is anticipated with the amount of time, energy, and professional guidance involved during the drafting process of the updated PDM, that the County has created a document that has validity and a clear purpose which will be more likely to fit in the existing planning mechanisms that exist county-wide. Additionally, by involving all of the local jurisdictions and by bringing the PDM to the attention of neighboring communities, the planning process has brought more awareness of mitigation to the people residing in the County, which will encourage further involvement in the future.

Codington County Pre-Disaster Mitigation Plan 10-12-12 Page 84
CHAPTER 6 PLAN MAINTENANCE
MONITORING, EVALUATING, AND UPDATING THE PLAN Requirement 201.6(c)(4)(ii). Local Mitigation Plan Review Tool – C6.
The County and all of the participating local jurisdictions thereof will incorporate the findings and projects of the PDM in all planning areas as appropriate. Periodic monitoring and reporting of the PDM is required to ensure that the goals and objectives for the County PDM are kept current and that local mitigation efforts are being carried out. During the process of implementing mitigation strategies, the county or communities within the county may experience lack of funding, budget cuts, staff turnover, and/or a general failure of projects. These scenarios are not in themselves a reason to discontinue and fail to update the PDM. A good plan needs to provide for periodic monitoring and evaluation of its successes and failures and allow for appropriate changes to be made. CONTINUED PUBLIC PARTICIPATION/INVOLVEMENT Requirement 201.6(c)(4)(iii). Local Mitigation Plan Review Tool – A5.
Requirement 201.6(c)(4)(ii). Local Mitigation Plan Review Tool – C6.
During interim periods between the five year re-write, efforts will be continued to encourage and facilitate public involvement and input. The PDM will be available for public view and comment at the Codington County Emergency Management Office located in the Codington County Courthouse and the First District Association of Local Governments office. The PDM will also be available for review on the web at the Codington County website www.Codington.org and at the First District Association of Local Governments homepage www.1stdistrict.org. Comments will always be received whether orally, written or by e-mail. All ongoing workshops and trainings will be open to the public and appropriately advertised. Ongoing press releases and interviews will help disseminate information to the general public and encourage participation. As implementation of the mitigation strategies continues in each local jurisdiction, the primary means of public involvement will be the jurisdiction’s own public comment and hearing process. State law as it applies to municipalities and counties requires this as a minimum for many of the proposed implementation measures. Effort will be made to encourage cities, towns and counties to go beyond the minimum required to receive public input and engage stakeholders. ANNUAL REPORTING PROCEDURES Requirement 201.6(c)(4)(ii). Local Mitigation Plan Review Tool – C6.
The PDM shall be reviewed annually, as required by the County Emergency Management Director, or as the situation dictates such as following a disaster declaration. The Codington

Codington County Pre-Disaster Mitigation Plan 10-12-12 Page 85
County Emergency Management Director will review the PDM annually in November and ensure the following: 1. The County Elected body will receive an annual report and/or presentation on the
implementation status of the PDM; 2. The report will include an evaluation of the effectiveness and appropriateness of the
mitigation actions proposed in the PDM; and 3. The report will recommend, as appropriate, any required changes or amendments to the
PDM. FIVE-YEAR PDM REVIEW Requirement 201.6(c)(4)(i). Local Mitigation Plan Review Tool – A6.
Requirement 201.6(c)(4)(ii). Local Mitigation Plan Review Tool – C6.
Every five years the PDM will be reviewed and a complete update will be initiated. All information in the PDM will be evaluated for completeness and accuracy based on new information or data sources. New property development activities will be added to the PDM and evaluated for impacts. New or improved sources of hazard related data will also be included. In future years, if the County relies on grant dollars to hire a contractor to write the PDM update, the County will initiate the process of applying for and securing such funding in the third year of the PDM to ensure the funding is in place by the fourth year of the PDM. The fifth year will then be used to write the PDM update, which in turn will prevent any lapse in time where the county does not have a current approved PDM on file. The goals, objectives, and mitigation strategies will be readdressed and amended as necessary based on new information, additional experience and the implementation progress of the PDM. The approach to this PDM update effort will be essentially the same as the one used for the original PDM development. The Emergency Management Director will meet with the PDM Planning Team for review and approval prior to final submission of the updated PDM. PLAN AMENDMENTS PDM amendments will be considered by the Codington County Emergency Management Director, during the PDM’s annual review to take place the end of each county fiscal year. All affected local jurisdictions (cities, towns, and counties) will be required to hold a public hearing and adopt the recommended amendment by resolution prior to considerations by the PDM Planning Team. INCORPORATION INTO EXISTING PLANNING MECHANISMS Requirement: §201.6(c)(4)(ii): [The plan shall include a] process by which local governments incorporate the requirements of the mitigation plan into other planning mechanisms such as comprehensive or capital improvement plans, when appropriate. All municipalities in the County, with the exception of the Town of Wallace have a comprehensive and/or capital improvements plan. The Watertown mitigation projects will be

Codington County Pre-Disaster Mitigation Plan 10-12-12 Page 86
considered and prioritized in conjunction with non-mitigation projects, such as water and wastewater infrastructure improvements, new construction of schools, libraries, parks, etc. All other towns with existing comprehensive land use plans will review mitigation projects annually when reviewing their comprehensive land use plan, as is recommended in each of their plans. In addition all municipalities, including the Town of Wallace, will consider the mitigation requirements, goals, actions, and projects when it considers and reviews the budget and other existing planning documents. Preparation of the budget is an opportune time to review the plan since municipalities are required by state law to prepare budgets for the upcoming year and typically consider any expenditure for the upcoming year at that time. The local jurisdictions will post a permanent memo to their files as a reminder for them to incorporate their annual review of the mitigation actions identified into the budget preparation process. This does not require the projects be included in the budget, it merely serves as a reminder to the City officials that they have identified mitigation projects in the PDM that should be considered if the budget allows for it. POTENTIAL FUNDING SOURCES Although all mitigation techniques will likely save money by avoiding losses, many projects are costly to implement. None of the local jurisdictions have the funds available to more forward with mitigation projects at this time; thus, the Potential Funding Sources section was included so that the local jurisdictions can work towards securing funding for the projects. Inevitably, due to the small tax base and small population most of the local jurisdictions do not have the ability to generate enough revenue to support anything beyond the basic needs of the community. Thus mitigation projects will not be completed without a large amount of funding support from State or Federal programs. The County jurisdictions will continue to seek outside funding assistance for mitigation projects in both the pre- and post-disaster environment. Primary Federal and State grant programs have been identified and briefly discussed, along with local and non-governmental funding sources, as a resource for the local jurisdictions.

Codington County Pre-Disaster Mitigation Plan 10-12-12 Page 87
Federal The following federal grant programs have been identified as funding sources which specifically target hazard mitigation projects:
Title: Pre-Disaster Mitigation Program Agency: Federal Emergency Management Agency
Through the Disaster Mitigation Act of 2000, Congress approved the creation of a national program to provide a funding mechanism that is not dependent on a Presidential Disaster Declaration. The Pre-Disaster Mitigation (PDM) program provides funding to states and communities for cost-effective hazard mitigation activities that complement a comprehensive mitigation program and reduce injuries, loss of life, and damage and destruction of property. The funding is based upon a 75% Federal share and 25% non-Federal share. The non-Federal match can be fully in-kind or cash, or a combination. Special accommodations will be made for “small and impoverished communities”, who will be eligible for 90% Federal share/10% non-Federal. FEMA provides PDM grants to states that, in turn, can provide sub-grants to local governments for accomplishing the following eligible mitigation activities: State and local hazard mitigation planning, Technical assistance (e.g. risk assessments, project development), Mitigation Projects, Acquisition or relocation of vulnerable properties, Hazard retrofits, Minor structural hazard control or protection projects Community outreach and education (up to 10% of State allocation)
Title: Flood Mitigation Assistance Program Agency: Federal Emergency Management Agency
FEMA’s Flood Mitigation Assistance program (FMA) provides funding to assist states and communities in implementing measures to reduce or eliminate the long-term risk of flood damage to buildings, manufactured homes and other structures insurable under the National Flood Insurance Program (NFIP). FMA was created as part of the National Flood Insurance Reform Act of 1994 (42 USC 4101) with the goal of reducing or eliminating claims under the NFIP. FMA is a pre-disaster grant program, and is available to states on an annual basis. This funding is available for mitigation planning and implementation of mitigation measures only, and is based upon a 75% Federal share/25% non-Federal share. States administer the FMA program and are responsible for selecting projects for funding from the applications submitted by all communities within the state. The state then forwards selected applications to FEMA for an eligibility determination. Although individuals cannot apply directly for FMA funds, their local government may submit an application on their behalf.

Codington County Pre-Disaster Mitigation Plan 10-12-12 Page 88
Title: Repetitive Flood Claims Program Agency: Federal Emergency Management Agency
FEMA’s Repetitive Flood Claims (RFC) grant program was authorized by the Bunning-Bereuter-Blumenauer Flood Insurance Reform Act of 2004 (P.L. 108–264), which amended the National Flood Insurance Act (NFIA) of 1968 (42 U.S.C. 4001, et al).
Up to $10 million is available annually for FEMA to provide RFC funds to assist States and communities reduce flood damages to insured properties that have had one or more claims to the National Flood Insurance Program (NFIP).
FEMA may contribute up to 100 percent of the total amount approved under the RFC grant award to implement approved activities, if the Applicant has demonstrated that the proposed activities cannot be funded under the Flood Mitigation Assistance (FMA) program.
Title: Hazard Mitigation Grant Program Agency: Federal Emergency Management Agency
The Hazard Mitigation Grant Program (HMGP) was created in November 1988 through Section 404 of the Robert T. Stafford Disaster Relief and Emergency Assistant Act. The HMGP assists states and local communities in implementing long-term mitigation measures following a Presidential disaster declaration. To meet these objectives, FEMA can fund up to 75% of the eligible costs of each project. The state or local cost-share match does not need to be cash; in-kind services or materials may also be used. With the passage of the Hazard Mitigation and Relocation Assistance Act of 1993, federal funding under the HMGP is now based on 15% of the federal funds spent on the Public and Individual Assistance programs (minus administrative expenses) for each disaster. The HMGP can be used to fund projects to protect either public or private property, so long as the projects in question fit within the state and local governments overall mitigation strategy for the disaster area, and comply with program guidelines. Examples of projects that may be funded include the acquisition or relocation of structures from hazard-prone areas, the retrofitting of existing structures to protect them from future damages; and the development of state or local standards designed to protect buildings from future damages. Eligibility for funding under the HMGP is limited to state and local governments, certain private nonprofit organizations or institutions that serve a public function, Indian tribes and authorized tribal organizations. These organizations must apply for HMPG project funding on behalf of their citizens. In turn, applicants must work through their state, since the state is responsible for setting priorities for funding and administering the program.

Codington County Pre-Disaster Mitigation Plan 10-12-12 Page 89
Title: Public Assistance (Infrastructure) Program, Section 406 Agency: Federal Emergency Management Agency
FEMA’s Public Assistance Program, through Section 406 of the Robert T. Stafford Disaster Relief and Emergency Assistance Act, provides funding to local governments following a Presidential Disaster Declaration for mitigation measures in conjunction with the repair of damaged public facilities and infrastructure. The mitigation measures must be related to eligible disaster related damages and must directly reduce the potential for future, similar disaster damages to the eligible facility. These opportunities usually present themselves during the repair/replacement efforts. Proposed projects must be approved by FEMA prior to funding. They will be evaluated for cost effectiveness, technical feasibility and compliance with statutory, regulatory and executive order requirements. In addition, the evaluation must ensure that the mitigation measures do not negatively impact a facility’s operation or risk from another hazard. Public facilities are operated by state and local governments, Indian tribes or authorized tribal organizations and include: *Roads, bridges & culverts *Water, power & sanitary systems *Draining & irrigation channels *Airports & parks *Schools, city halls & other buildings Private nonprofit organizations are groups that own or operate facilities that provide services otherwise performed by a government agency and include, but are not limited to the following: *Universities and other schools *Power cooperatives & other utilities *Hospitals & clinics *Custodial care & retirement facilities *Volunteer fire & ambulance *Museums & community centers
Title: SBA Disaster Assistance Program Agency: US Small Business Administration
The SBA Disaster Assistance Program provides low-interest loans to businesses following a Presidential disaster declaration. The loans target businesses to repair or replace uninsured disaster damages to property owned by the business, including real estate, machinery and equipment, inventory and supplies. Businesses of any size are eligible; along with non-profit organizations.SBA loans can be utilized by their recipients to incorporate mitigation techniques into the repair and restoration of their business.
Title: Community Development Block Grants Agency: US Department of Housing and Urban Development
The community Development Block Grant (CDBG) program provides grants to local governments for community and economic development projects that primarily benefit low- and moderate-income people. The CDBG program also provides grants for post-disaster hazard mitigation and recovery following a Presidential disaster declaration. Funds can be used for activities such as acquisition, rehabilitation or reconstruction of damaged properties and facilities and for the redevelopment of disaster areas.

Codington County Pre-Disaster Mitigation Plan 10-12-12 Page 90
Local
Local governments depend upon local property taxes as their primary source of revenue. These taxes are typically used to finance services that must be available and delivered on a routine and regular basis to the general public. If local budgets allow, these funds are used to match Federal or State grant programs when required for large-scale projects. Non-Governmental
Another potential source of revenue for implementing local mitigation projects are monetary contributions from non-governmental organizations, such as private sector companies, churches, charities, community relief funds, the Red Cross, hospitals, Land Trusts and other non-profit organizations.