Embed Size (px)
Citation preview

Journal of Chemical and Petroleum Engineering 2021, 55(1): 69-81 DOI: 10.22059/jchpe.2020.310442.1330
RESEARCH PAPER
COD Reduction in Petrochemical Wastewater Using the
Solar Photo-Fenton Process
Majid Mohadesi, Babak Aghel*, Mohammad Hamed Razmegir
Department of Chemical Engineering, Faculty of Energy, Kermanshah University of Technology,
Kermanshah, Iran
Received: 22 September 2020, Revised: 27 October 2020, Accepted: 28 October 2020
© University of Tehran 2021
Abstract Water has been recognized as the most fundamental factor in organisms' lives and
the most widely used element in industries, while currently, the world is dealing
with water scarcity in many areas. This emphasizes the importance of preventing
water contamination as well as returning contaminated water produced by
industries to the production and consumption cycle. Yet, the need for environmental
protection is a certain principle that is generalized in today's world. This necessity
has become more important with the growth of industries and technologies and
subsequent contamination. Advanced oxidation technology has been substantially
developed in recent decades, becoming increasingly important in the treatment
process of industrial wastewaters containing resistant organic materials that cannot
be removed through conventional treatment methods to reduce water quality
parameters. The present study has examined the chemical oxygen demand (COD)
in the synthetic monoethyl amine wastewater prepared by the solar Photo-Fenton
process. Principal effective parameters in the advanced oxidation technology,
including the processing time, the concentration of hydrogen peroxide ion, the
concentration of iron (II) ion, and pH, were investigated by the response surface
methodology (RSM) through 30 random experiments using central composite
design method (CCD) to optimize reaction conditions. The most sufficient
operational conditions were achieved at pH=4, [Fe2+] =2 mM, [H2O2] =20 mM, and
t=90 min for the COD removal rate of 77.08%.
Keywords: Central Composite Design,
COD Removal,
Experiment Design,
Solar Photo-Fenton Process,
Wastewater Treatment
Introduction
Today, the human has faced numerous and significant challenges in the field of water
resources management and freshwater supply considering population growth and demographic
changes, development of urbanization and industry, drinking water scarcity, and negative
impacts of climate change [1]. Reuse and recovery of industrial wastewaters can effectively
decrease the global concern on water scarcity [2].
As a widely used material, monoethanolamine (MEA) is an integral part of oil, gas,
petrochemical, power plants, and cement. It is used mainly in gas refineries for the gas
sweetening process as a carbon dioxide absorber from natural gas. Since these mentioned
industries have been regarded as advanced industries of Iran and considering their essential
need for monoethanolamine within their production processes, a large amount of industrial
wastewater containing monoethanolamine would be produced. In this regard, environmental
problems caused by these wastewaters would be concerned due to higher amounts of chemical
oxygen demand (COD) in such wastewaters [3,4].
* Corresponding author:
Email: [email protected] (B. Aghel)

70 Mohadesi et al.
Advanced oxidation processes (AOPs) are applied as a set of chemical treatment methods
for the removal of problematic organic materials as well as for the destruction and
decomposition of natural and synthetic chemicals from wastewaters threatening the
environment and public health. The most significant advantage of this method is producing
high-concentrated hydroxyl radicals (OH•) [5,6]. After fluorine, this radical is the most strong
oxidizing agent capable of oxidizing most organic compounds completely to carbon dioxide,
water, and inorganic acids [7].
Advanced oxidation processes are typically non-selective due to high oxidation reactions
allowing simultaneous treatment of multiple contaminants. This radical non-selectively reacts
with organic molecules fast and spontaneously with no need for other additives. This reaction
rate is about 108-1010 M-1.s-1 [8,9] at the normal temperature and pressure [10].
In this method, hydroxyl radical is produced through the combination of oxidizing agents
(O3 and H2O2), radiation (ultraviolet or ultrasonic), and catalysts (such as Fe2+). Employing
ultraviolet radiation besides an appropriate oxidizing agent like H2O2 is a suitable way to
remove organic contaminants resistant to biodegradation. The absorption of a photon by H2O2
separates it into two hydroxyl radicals. Hydrogen peroxide has been recognized as an excellent
oxidizing agent due to unstable conditions, which easily lose additional atomic oxygen [11,12].
Iron ions are widely used catalysts for the oxidation of a difficult-to-remove class of
contaminants associated with hydrogen peroxide. The Fenton process comprises all reactions
represented in reactions 1 to 6 [13,14]. Ferric and ferrous ions, hydroxyl radical, and hydrogen
peroxide produce hydroperoxyl radical through some other steps of the chemical reaction. The
total removal of organic carbon needs a large amount of oxidizing agent or a long retention time
[15].
(1) Fe2+ + H2O2 → Fe3+ + OH• + OH-
(2) OH• + H2O2 → HO2• + H2O
(3) Fe3+ + H2O2 → Fe2+ + HO2• +H+
(4) OH• + Fe2+ → Fe3+ + OH-
(5) Fe2+ + HO2• + H+ → Fe3+ + H2O2
(6) 2HO2• → H2O2 + O2
In 2015, Palaniandy et al. have examined the use of Fenton reagent and titanium dioxide
simultaneously under sunlight for refinery's wastewaters leading to 62% COD removal as being
close to estimated values. They introduced the solar Photo-Fenton process as an efficient
method for petroleum wastewater treatment with no energy required [16].
Durán et al. have performed an investigation in 2015 on the effect of the solar Photo-Fenton
process on wastewaters produced by beverage manufacturing plants. Water quality
specifications represented 96.6% TOC removal, 99.8% BOD removal, 91% turbidity, and total
COD removal and toxicity in the wastewater [17].
The obvious superiority of the solar Photo-Fenton process relative to the ozone-based
process was also confirmed by Guzmán et al. (2016) by comparing the effects of both
approaches on the COD and DOC removal in citrus wastewaters. However, they measured the
cost of 13.8 Euros per cubic meter of wastewater for using sunlight [18].
The present study sought to investigate the performance of the Photo-Fenton process in the
presence of the sun's ultraviolet radiation instead of using the UV lamp on the removal of
chemical oxygen demand and total organic carbon produced by monoethanolamine present in
the wastewater of gas refinery containing monoethyl amine. In this respect, a multi-variate
experiment was conducted based on the response surface methodology to determine optimal
values of experimental variables for the chemical oxygen demand removal. Moreover, the effect

Journal of Chemical and Petroleum Engineering 2021, 55(1): 69-81 71
of hydrogen peroxide and iron ion concentrations, the processing time, and pH were examined
while controlling the amount of chemical oxygen demand and total organic carbon.
Material and methods
Material
The synthetic wastewater containing 800 ppm monoethyl amine was examined in this study.
Ferrous sulfate heptahydrate (FeSO4.7H2O) as a source of Fe2+, hydrogen peroxide solution
(30% w/w), and MnO2 were prepared from Merck, Germany. All experiments have conducted
using double distilled water.
Experiment procedures
Herein, experiments were conducted in an open pipe reactor made of PVC pipe with four
liters' capacity. The reactor was placed in an open space under direct sunlight to take advantage
of a natural source of ultraviolet radiation. The solution was circulated within the reactor using
a small pump for homogenizing the mixture and preventing the sedimentation of iron ions.
Desired amounts of bivalent iron salt and hydrogen peroxide were injected into the reaction
vessel through two separate syringes. Fig. 1 depicts a schematic setup used in this study. After
performing experiments, samples' COD value was measured using a spectrophotometer (DR
5000, Hach, Jenway, USA) at 600 nm.
Fig. 1. Schematic of the device prepared for the experiments
Each experiment has employed two liters of synthetic monoethyl amine wastewater.
Different concentrations of H2O2, Fe2+, process time, and pH were examined, and the chemical
oxygen demand was measured using standard methods [19]. The following equation determines
the COD removal rate:
(7) COD removal % =[𝐶𝑂𝐷]0 − [𝐶𝑂𝐷]
[𝐶𝑂𝐷]0× 100
[𝐶𝑂𝐷]0 is the COD value at the beginning of the reaction (for the synthetic wastewater), and
[𝐶𝑂𝐷] is for the COD value at the reaction time. Due to the interference of H2O2 with the COD
test, the remaining amount of hydrogen peroxide in samples was removed using MnO2 powder,
and samples were then filtered to separate MnO2 powders [20].
72 Mohadesi et al.
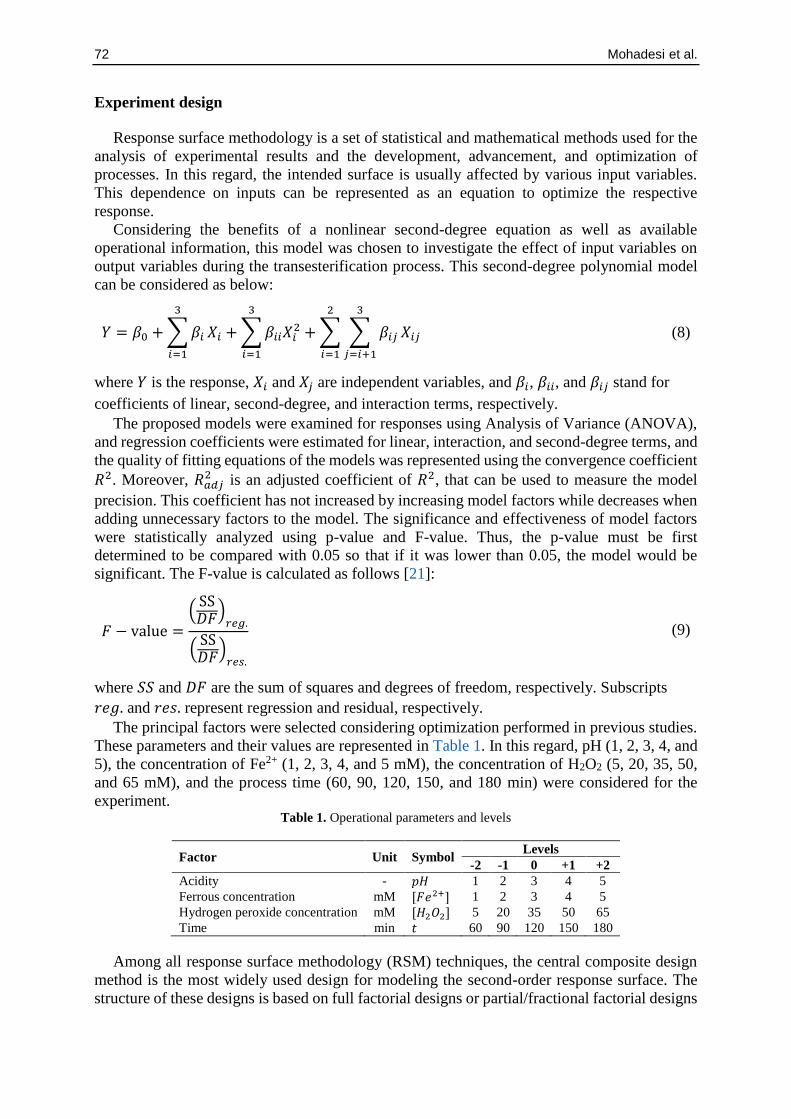
Experiment design
Response surface methodology is a set of statistical and mathematical methods used for the
analysis of experimental results and the development, advancement, and optimization of
processes. In this regard, the intended surface is usually affected by various input variables.
This dependence on inputs can be represented as an equation to optimize the respective
response.
Considering the benefits of a nonlinear second-degree equation as well as available
operational information, this model was chosen to investigate the effect of input variables on
output variables during the transesterification process. This second-degree polynomial model
can be considered as below:
𝑌 = 𝛽0 + ∑ 𝛽𝑖
3
𝑖=1
𝑋𝑖 + ∑ 𝛽𝑖𝑖𝑋𝑖2
3
𝑖=1
+ ∑ ∑ 𝛽𝑖𝑗
3
𝑗=𝑖+1
𝑋𝑖𝑗
2
𝑖=1
(8)
where 𝑌 is the response, 𝑋𝑖 and 𝑋𝑗 are independent variables, and 𝛽𝑖, 𝛽𝑖𝑖, and 𝛽𝑖𝑗 stand for
coefficients of linear, second-degree, and interaction terms, respectively.
The proposed models were examined for responses using Analysis of Variance (ANOVA),
and regression coefficients were estimated for linear, interaction, and second-degree terms, and
the quality of fitting equations of the models was represented using the convergence coefficient
𝑅2. Moreover, 𝑅𝑎𝑑𝑗2 is an adjusted coefficient of 𝑅2, that can be used to measure the model
precision. This coefficient has not increased by increasing model factors while decreases when
adding unnecessary factors to the model. The significance and effectiveness of model factors
were statistically analyzed using p-value and F-value. Thus, the p-value must be first
determined to be compared with 0.05 so that if it was lower than 0.05, the model would be
significant. The F-value is calculated as follows [21]:
𝐹 − value =
(SS𝐷𝐹)
𝑟𝑒𝑔.
(SS𝐷𝐹)
𝑟𝑒𝑠.
(9)
where 𝑆𝑆 and 𝐷𝐹 are the sum of squares and degrees of freedom, respectively. Subscripts
𝑟𝑒𝑔. and 𝑟𝑒𝑠. represent regression and residual, respectively.
The principal factors were selected considering optimization performed in previous studies.
These parameters and their values are represented in Table 1. In this regard, pH (1, 2, 3, 4, and
5), the concentration of Fe2+ (1, 2, 3, 4, and 5 mM), the concentration of H2O2 (5, 20, 35, 50,
and 65 mM), and the process time (60, 90, 120, 150, and 180 min) were considered for the
experiment. Table 1. Operational parameters and levels
Factor Unit Symbol Levels
-2 -1 0 +1 +2
Acidity - 𝑝𝐻 1 2 3 4 5
Ferrous concentration mM [𝐹𝑒2+] 1 2 3 4 5
Hydrogen peroxide concentration mM [𝐻2𝑂2] 5 20 35 50 65
Time min 𝑡 60 90 120 150 180
Among all response surface methodology (RSM) techniques, the central composite design
method is the most widely used design for modeling the second-order response surface. The
structure of these designs is based on full factorial designs or partial/fractional factorial designs

Journal of Chemical and Petroleum Engineering 2021, 55(1): 69-81 73
associated with duplication at the central point and an axial point. Ordinarily, the whole
experiment is divided into two main groups in this type of design. The first group consists of
experiments for the central and factorial part, and the second group is subjected to the central
and axial part experiments. The central part experiments are repeated in both groups
representing two major results, comprising the criterion for measuring the net error value and
stabilizing the difference of predicted responses. Hence, this difference can be stabilized by 3
to 5 repetitions at the central point if the value was equal to 1 [21]. Experiment design comprised
30 experiments proposed by the Design-Expert 7.0.0 Trial software, and all experiments were
conducted randomly to minimize experimental errors (Table 2).
Table2. CCD table along with the independent variables and the COD removal
No.
Manipulated variables Response
𝒑𝑯, - [𝑭𝒆𝟐+], mM [𝑯𝟐𝑶𝟐], mM 𝒕, min COD removal %
1 3 5 35 120 51.36
2 3 3 35 120 32.56
3 4 4 20 150 39.39
4 3 3 35 120 30.82
5 4 2 50 90 54.80
6 3 3 35 120 34.26
7 3 3 35 120 37.70
8 3 3 35 120 29.12
9 3 3 35 180 29.12
10 3 3 65 120 52.75
11 1 3 35 120 29.12
12 5 3 35 120 61.68
13 3 3 35 120 32.56
14 3 3 35 60 39.39
15 2 2 50 150 46.22
16 2 2 20 90 37.70
17 2 2 20 150 49.67
18 4 4 20 90 54.80
19 2 4 20 90 10.32
20 2 4 20 150 17.15
21 3 1 35 120 53.26
22 4 4 50 90 58.24
23 2 2 50 90 32.56
24 4 2 20 90 77.09
25 4 2 20 150 70.21
26 4 2 50 150 8.58
27 2 4 50 90 61.99
28 4 4 50 150 42.84
29 3 3 5 120 58.24
30 2 4 50 150 65.07

74 Mohadesi et al.
Results and Discussion
Analysis of Variance for the response
Table 2 summarizes the results of the experiment design for COD removal. A model was
then achieved by analyzing experiment results precisely. The quality of this mathematical
model was confirmed by the coefficient of determination (𝑅2) and the adjusted coefficient of
determination (𝑅2) as being 93.61% and 89.71%, respectively. Fig. 2 illustrates the precision
of the predicted model, in which predicted and experimental COD values have been compared
with each other. As can be observed, there has been relatively suitable compliance between
experimental data and predicted results. Thus, the COD removal rate has been expressed using
a second-degree polynomial equation with the help of the error least squares method:
(10)
𝐶𝑂𝐷𝑟𝑒𝑚. = 25.905 + 43.335𝑝𝐻 − 57.967[𝐹𝑒2+] − 1.371[𝐻2𝑂2] + 0.852𝑡 −
0.700𝑝𝐻. [𝐻2𝑂2] − 0.249𝑝𝐻. 𝑡 + 0.829[𝐹𝑒2+]. [𝐻2𝑂2] − 0.006[𝐻2𝑂2]. 𝑡 +
2.883𝑝𝐻2 + 4.610[𝐹𝑒2+]2 + 0.024[𝐻2𝑂2]2
where 𝑝𝐻 represents the amount of acidity, [𝐹𝑒2+] and [𝐻2𝑂2] are concentrations of iron and
hydrogen peroxide in mM, and t stands for the retention time in min.
Fig. 2. Comparison of experimental and predicted values for COD removal
Table 3 demonstrates the ANOVA results for the proposed COD removal rate model. The
total and model degrees of freedom and error residual were 29, 11, and 18, respectively. Based
on the results provided in this table, the F-value of the model is large, and the proposed model
is statistically significant. Moreover, the p-value for the model lack-of-fit has been 0.0529,
which was larger than 0.05 representing insignificant lack-of-fit.

Journal of Chemical and Petroleum Engineering 2021, 55(1): 69-81 75
Table 3. Analysis of variance (ANOVA) for COD removal model
According to the proposed model calculation (Eq. 10), terms with p-values less than 0.05
have been more important in the regression model. Considering Table 3, the linear term of 𝑝𝐻,
second-degree terms of 𝑝𝐻2 and [𝐹𝑒2+]2, and interaction terms of 𝑝𝐻. [𝐻2𝑂2], 𝑝𝐻. 𝑡,
[𝐹𝑒2+]. [𝐻2𝑂2], [𝐻2𝑂2]. 𝑡 are significant for the COD removal model.
Effects of operational and optimization parameters
As mentioned earlier, the effects of pH with values of 1, 2, 3, 4, and 5, the concentration of
Fe2+ with values of 1, 2, 3, 4, and 5 mM, the concentration of H2O2 with values of 1, 2, 3, 4,
and 5 mM, and process time with values of 60, 90, 120, 150, and 180 min were examined on
the COD removal rate of the synthetic monoethyl amine wastewater. As specified in Table 3,
interaction terms of 𝑝𝐻. [𝐻2𝑂2], 𝑝𝐻. 𝑡, [𝐹𝑒2+]. [𝐻2𝑂2], [𝐻2𝑂2]. 𝑡 were significant in the COD
removal from the intended wastewater. Figs. 3 to 6 represent the interplay of these variables on
the COD removal.
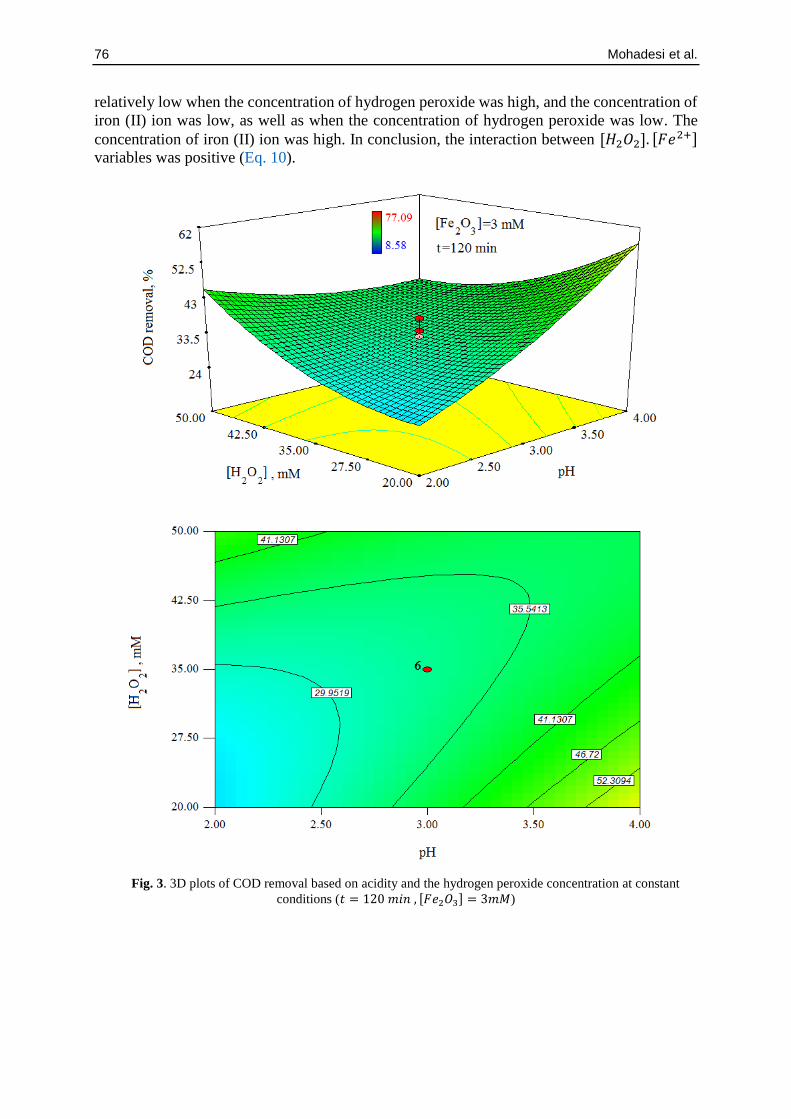
Fig. 3 demonstrates the effect of 𝑝𝐻 and [𝐻2𝑂2] in a contour 3D diagram on the COD
removal rate from the intended wastewater. As can be seen at the least pH value (pH=2), the
COD removal rate has increased by increasing the concentration of hydrogen peroxide from 20
mM to 50 mM. While a reverse trend was seen at higher pH values (pH=4) so that the COD
removal rate was increased by decreasing the concentration of hydrogen peroxide from 50 mM
to 20 mM. Meanwhile, there has been no considerable change in the COD removal rate by
changing the concentration of hydrogen peroxide at medium pH values (i.e., pH=3). The highest
COD removal rate was at pH=4 and [𝐻2𝑂2] = 20 𝑚𝑀.
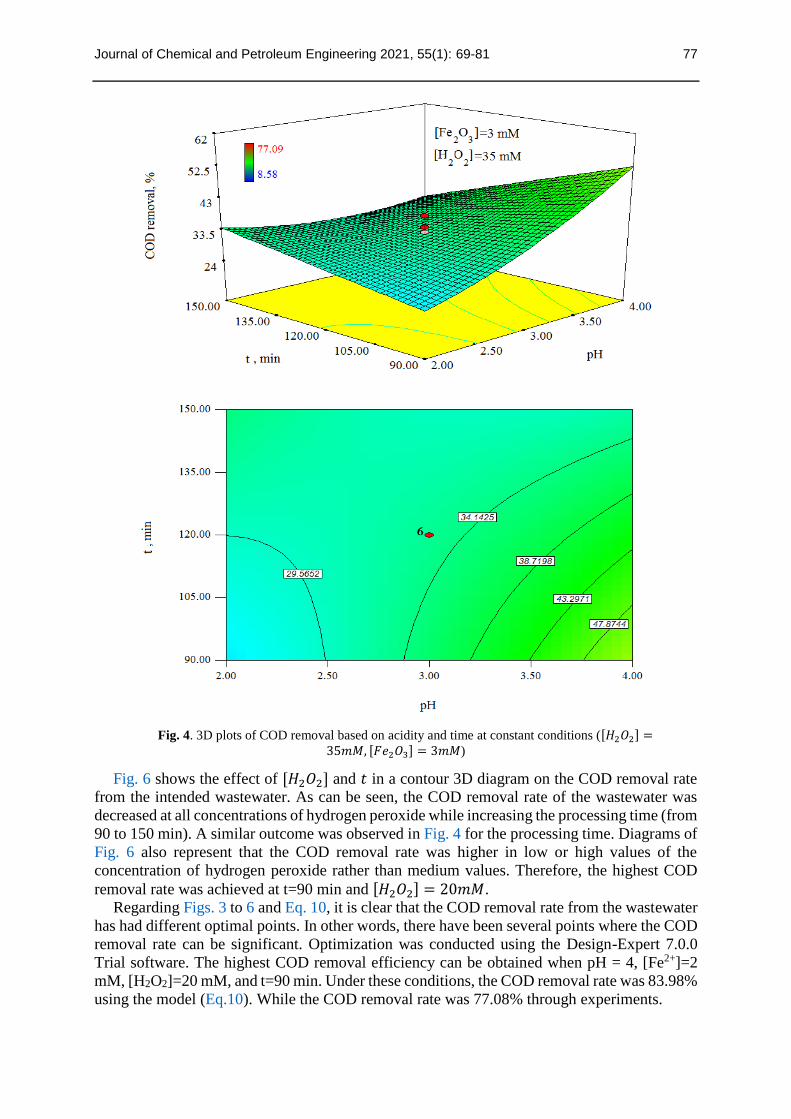
Fig. 4 represents the effect of pH and t in a contour 3D diagram on the COD removal rate
from the intended wastewater. Herein, in lower pH values, the time had no remarkable effect
on the COD removal rate of the wastewater (but a decreasing COD removal can be observed
by increasing the reaction time). While at higher pH values (pH=4), the COD removal rate was
increased by decreasing the time. As another outcome, the COD removal rate was increased by
increasing pH within the least process time. In other words, the highest COD removal rate was
achieved at pH=4 and t=90 min.
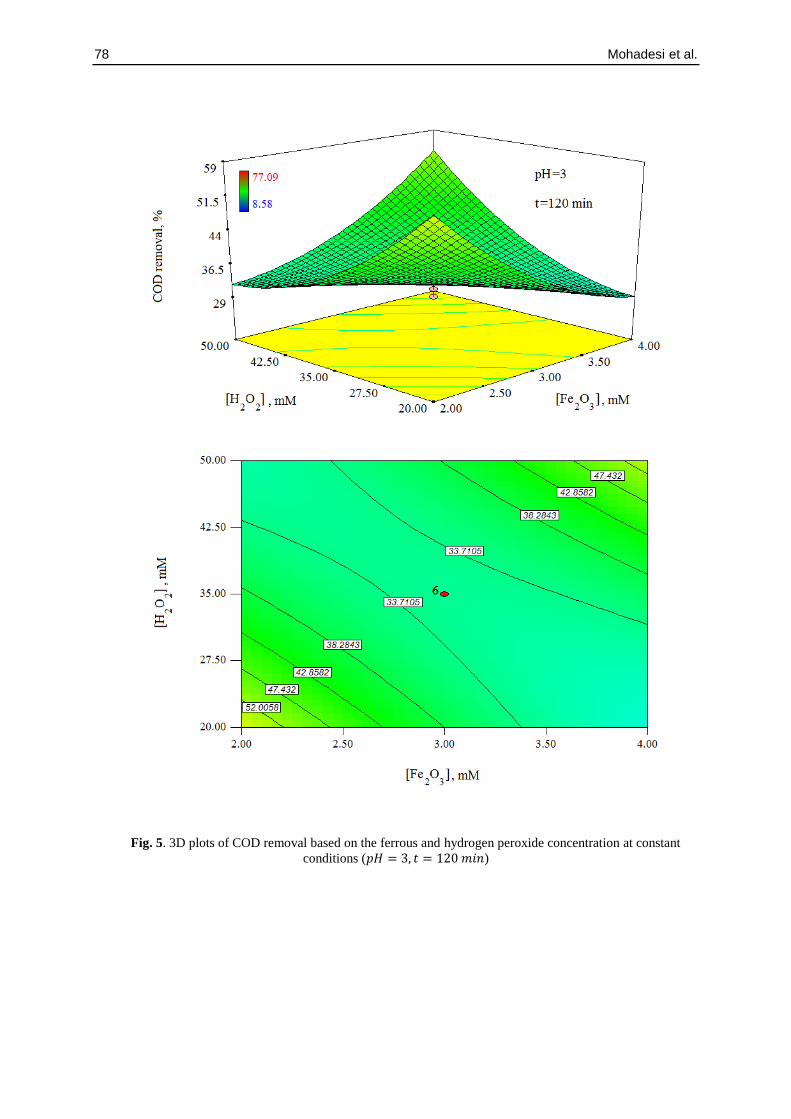
Fig. 5 illustrates the effect of [𝐻2𝑂2] and [𝐹𝑒2+] in a contour 3D diagram on the COD
removal rate from the intended wastewater. The highest amount of COD removal was obtained
at lower concentrations of hydrogen peroxide and iron (II) ion ([𝐻2𝑂2] = 20𝑚𝑀 and[𝐹𝑒2+] =2𝑚𝑀). The COD removal rate was also considerable in higher concentrations of both
([𝐻2𝑂2] = 50𝑚𝑀 and[𝐹𝑒2+] = 4𝑚𝑀). According to this Figure, the COD removal rate was
Source SS DF MS F-Value p-Value
Prob>F Level of Significance
Model 7767.58 11 706.14 23.98 <0.0001 significant
𝑝𝐻 942.38 1 942.38 32.00 <0.0001 significant
[𝐹𝑒2+] 39.60 1 39.60 1.34 0.2613 not significant
[𝐻2𝑂2] 0.37 1 0.37 0.013 0.9117 not significant
𝑡 197.86 1 197.86 6.72 0.184 not significant
𝑝𝐻. [𝐻2𝑂2] 1764.63 1 1764.63 59.92 <0.0001 significant
𝑝𝐻. 𝑡 891.77 1 891.77 30.28 <0.0001 significant
[𝐹𝑒2+]. [𝐻2𝑂2] 2474.81 1 2474.81 84.03 <0.0001 significant
[𝐻2𝑂2]. 𝑡 107.07 1 107.07 3.64 0.0726 non significant
𝑈𝑉2 232.72 1 232.72 7.90 0.0116 significant
[𝐹𝑒2+]2 595.17 1 595.17 20.21 0.0003 significant
[𝐻2𝑂2]2 818.51 1 818.51 27.79 <0.0001 significant
Residual 530.10 18 29.45
Lack of Fit 486.39 13 37.41 4.28 0.0592 not significant
Pure Error 43.71 5 8.74
Cor Total 8297.68 29
76 Mohadesi et al.
relatively low when the concentration of hydrogen peroxide was high, and the concentration of
iron (II) ion was low, as well as when the concentration of hydrogen peroxide was low. The
concentration of iron (II) ion was high. In conclusion, the interaction between [𝐻2𝑂2]. [𝐹𝑒2+] variables was positive (Eq. 10).
Fig. 3. 3D plots of COD removal based on acidity and the hydrogen peroxide concentration at constant
conditions (𝑡 = 120 𝑚𝑖𝑛 , [𝐹𝑒2𝑂3] = 3𝑚𝑀)
Journal of Chemical and Petroleum Engineering 2021, 55(1): 69-81 77
Fig. 4. 3D plots of COD removal based on acidity and time at constant conditions ([𝐻2𝑂2] =
35𝑚𝑀, [𝐹𝑒2𝑂3] = 3𝑚𝑀)
Fig. 6 shows the effect of [𝐻2𝑂2] and 𝑡 in a contour 3D diagram on the COD removal rate
from the intended wastewater. As can be seen, the COD removal rate of the wastewater was
decreased at all concentrations of hydrogen peroxide while increasing the processing time (from
90 to 150 min). A similar outcome was observed in Fig. 4 for the processing time. Diagrams of
Fig. 6 also represent that the COD removal rate was higher in low or high values of the
concentration of hydrogen peroxide rather than medium values. Therefore, the highest COD
removal rate was achieved at t=90 min and [𝐻2𝑂2] = 20𝑚𝑀.
Regarding Figs. 3 to 6 and Eq. 10, it is clear that the COD removal rate from the wastewater
has had different optimal points. In other words, there have been several points where the COD
removal rate can be significant. Optimization was conducted using the Design-Expert 7.0.0
Trial software. The highest COD removal efficiency can be obtained when pH = 4, [Fe2+]=2
mM, [H2O2]=20 mM, and t=90 min. Under these conditions, the COD removal rate was 83.98%
using the model (Eq.10). While the COD removal rate was 77.08% through experiments.
78 Mohadesi et al.
Fig. 5. 3D plots of COD removal based on the ferrous and hydrogen peroxide concentration at constant
conditions (𝑝𝐻 = 3, 𝑡 = 120 𝑚𝑖𝑛)

Journal of Chemical and Petroleum Engineering 2021, 55(1): 69-81 79
Fig. 6. 3D plots of COD removal based on the hydrogen peroxide concentration and time at constant
conditions (𝑝𝐻 = 3, [𝐹𝑒2𝑂3] = 3𝑚𝑀)
Conclusions
The present study sought to reduce the COD value of the synthetic monoethyl amine
wastewater through the solar Photo-Fenton process using the central composite experimental
design. In this regard, the effect of pH, the concentration of iron (II) ion, the concentration of
hydrogen peroxide ion, and the processing time were investigated. Statistical analysis of the

80 Mohadesi et al.
model confirmed that the model was satisfactory to predict COD removal. It was found that
acidity was the main contributor to almost all impact categories. The removal efficiency of
77.08% was achieved by experiments under optimal operational conditions including pH=4,
[Fe2+]=2 mM, [H2O2]=20 mM, and t=90 min. All in all, this work's results may be a useful
tool for the industry since the effective treatment of wastewater is a major problem, and AOPs
strongly required energy and chemical inputs. Therefore, the solar Photo-Fenton process could
provide a clean energy source for AOPs energy requirement.
Acknowledgments
The authors would like to acknowledge the financial support of the Kermanshah University
of Technology for this research.
References
[1] Du Plessis, Anja. Current and Future Water Scarcity and Stress. Water as an Inescapable Risk,
Springer.2019; 13–25 ..
[2] Arzate S, Sánchez JG, Soriano-Molina P, López JC, Campos-Mañas MC, Agüera A, Pérez JS.
Effect of residence time on micropollutant removal in WWTP secondary effluents by
continuous solar photo-Fenton process in raceway pond reactors. Chemical Engineering
Journal. 2017 May 15;316:1114-21.
[3] Liu L, He D, Pan F, Huang R, Lin H, Zhang X. Comparative study on treatment of methylene
blue dye wastewater by different internal electrolysis systems and COD removal kinetics,
thermodynamics and mechanism. Chemosphere. 2020 Jan 1;238:124671.
[4] Mohadesi M, Aghel B, Gouran A, Razmegir MH. Oil Refinery Wastewater Treatment by
Advanced Oxidation Processes for Chemical Oxygen Demand Removal using the Box-Behnken
Method. Journal of Chemical and Petroleum Engineering. 2020 Jun 1;54(1):35-46.
[5] Chuang YH, Szczuka A, Shabani F, Munoz J, Aflaki R, Hammond SD, Mitch WA. Pilot-scale
comparison of microfiltration/reverse osmosis and ozone/biological activated carbon with
UV/hydrogen peroxide or UV/free chlorine AOP treatment for controlling disinfection
byproducts during wastewater reuse. Water research. 2019 Apr 1;152:215-25.
[6] Karimi S, Shokri A, Aghel B. Remediation of spent caustic in the wastewater of oil refinery by
photo-Fenton process. Archives of Hygiene Sciences. 2020 Jul 10;9(3):179-88.
[7] Karci A, Wurtzler EM, Armah A, Wendell D, Dionysiou DD. Solar photo-Fenton treatment of
microcystin-LR in aqueous environment: transformation products and toxicity in different water
matrices. Journal of hazardous materials. 2018 May 5;349:282-92.
[8] Deng Y. Advanced oxidation processes (AOPs) for reduction of organic pollutants in landfill
leachate: a review. International Journal of Environment and Waste Management. 2009 Jan
1;4(3-4):366-84.
[9] Moersidik SS, Nugroho R, Handayani M, Pratama MA. Optimization and reaction kinetics on
the removal of Nickel and COD from wastewater from electroplating industry using
Electrocoagulation and Advanced Oxidation Processes. Heliyon. 2020 Feb 1;6(2):e03319.
[10] Sirés I, Brillas E, Oturan MA, Rodrigo MA, Panizza M. Electrochemical advanced oxidation
processes: today and tomorrow. A review. Environmental Science and Pollution Research. 2014
Jul;21(14):8336-67.
[11] Baena-Moreno FM, Rodríguez-Galán M, Vega F, Vilches LF, Navarrete B, Zhang Z. Biogas
upgrading by cryogenic techniques. Environmental Chemistry Letters. 2019 Sep;17(3):1251-
61.
[12] Yang W, Zhou M, Oturan N, Li Y, Oturan MA. Electrocatalytic destruction of pharmaceutical
imatinib by electro-Fenton process with graphene-based cathode. Electrochimica Acta. 2019
May 10;305:285-94.
[13] Giannakis S. A review of the concepts, recent advances and niche applications of the (photo)
Fenton process, beyond water/wastewater treatment: surface functionalization, biomass

Journal of Chemical and Petroleum Engineering 2021, 55(1): 69-81 81
treatment, combatting cancer and other medical uses. Applied Catalysis B: Environmental. 2019
Jul 5;248:309-19.
[14] Su CC, Chen CM, Anotai J, Lu MC. Removal of monoethanolamine and phosphate from thin-
film transistor liquid crystal display (TFT-LCD) wastewater by the fluidized-bed Fenton
process. Chemical engineering journal. 2013 Apr 15;222:128-35.
[15] Harada T, Yatagai T, Kawase Y. Hydroxyl radical generation linked with iron dissolution and
dissolved oxygen consumption in zero-valent iron wastewater treatment process. Chemical
Engineering Journal. 2016 Nov 1;303:611-20.
[16] Palaniandy P, Aziz HB, Feroz S. Treatment of petroleum wastewater using combination of solar
photo-two catalyst TiO2 and photo-Fenton process. Journal of Environmental Chemical
Engineering. 2015 Jun 1;3(2):1117-24.
[17] Durán A, Monteagudo JM, Gil J, Expósito AJ, San Martín I. Solar-photo-Fenton treatment of
wastewater from the beverage industry: Intensification with ferrioxalate. Chemical Engineering
Journal. 2015 Jun 15;270:612-20.
[18] uzmán J, Mosteo R, Sarasa J, Alba JA, Ovelleiro JL. Evaluation of solar photo-Fenton and
ozone based processes as citrus wastewater pre-treatments. Separation and Purification
Technology. 2016 May 30;164:155-62.
[19] Federation WE, APH Association. Standard methods for the examination of water and
wastewater. American Public Health Association (APHA): Washington, DC, USA. 2005.
[20] El-sousy K, Hussen A, Hartani K, El–Aila H. Elimination of organic pollutants using supported
catalysts with hydrogen peroxide. Jordan Journal of Chemistry (JJC). 2007 Jan 1;2(1):97-103.
[21] Montgomery DC. Design and analysis of experiments. John wiley & sons; 2017.
This article is an open-access article distributed under the terms and conditions
of the Creative Commons Attribution (CC-BY) license.