Embed Size (px)
Citation preview
CAPE COD
Regional Wastewater Management Plan Technology Assessment – Conventional Infrastructure
MARCH 2013

Table of Contents
INTRODUCTION .....................................................................1
ON-SITE SEPTIC SYSTEMS ......................................................2CESSPOOLS AND LEACHING PITS ....................................2TITLE 5 SEPTIC SYSTEMS ...............................................3 INNOVATIVE/ALTERNATIVE TECHNOLOGY .......................4
WASTEWATER TREATMENT GREATER THAN 10,000 GALLONS PER DAY ................................................................................8
WASTEWATER TREATMENT PLANT TECHNOLOGIES .......13COLLECTION SYSTEM ALTERNATIVES ............................16WASTEWATER EFFLUENT DISPOSAL ..............................22SLUDGE BIOSOLIDS AND SEPTAGE MANAGEMENT .........26NON-DISCHARGING TECHNOLOGY ................................28


REGIONAL WASTEWATER MANAGEMENT PLAN | TECHNOLOGY ASSESSMENT - CONVENTIONAL 1
Introduction
Many terms have been used to describe different sizes and kinds of con-ventional wastewater treatment and treatment facilities. These include the words centralized, decentralized, satellite, cluster, and individual on-site. Some of these terms, notably centralized and decentralized, have been defined very differently, leading to confusion. The terms centralized, satellite, cluster, and individual on-site will be used in this document, and the amount of flow will determine the terminology used.
�� On-site systems: Individual on-site systems serve one property and are located on the parcel where the wastewater is generated.
�� Cluster systems: Cluster systems serve up to approximately 30 homes with aggre-gate wastewater flows less than 10,000 gallons per day (gpd).
�� Satellite systems: Satellite systems serve from 30 to 1,000 homes and are intended to treat and dispose of wastewater from one area (wastewater flows between 10,000 and 300,000 gpd).
�� Centralized systems: Centralized systems provide for most or all of a town’s waste-water management needs and might serve portions of neigh-boring towns (wastewater flows in excess of 300,000 gpd).
Figure TAC-1 illustrates the different sizes of conventional wastewater treatment infrastructure described in this section.
FIGURE TAC-1: Conventional WastewaterTreatment Infrastructure

TECHNOLOGY ASSESSMENT - CONVENTIONAL | REGIONAL WASTEWATER MANAGEMENT PLAN2
On-site Septic Systems
Septic systems that process wastewater flows up to 10,000 gpd are regu-lated under Title 5, the state’s sanitary code for on-site wastewater sys-tems (310 CMR 15.00), and are permitted by local boards of health and the Massachusetts Department of Environmental Protection (MassDEP). A primary purpose of Title 5 is to ensure the removal of pathogens from wastewater.
A typical Title 5 septic system on Cape Cod handles less than 2,000 gpd of wastewater. Businesses and multiple homes connected to cluster or shared systems generate flows up to 10,000 gpd. Cluster or shared sys-tems may require pumps and low-pressure sewer to aggregate flows and modular components for advanced denitrifying treatment. Shared sys-tems are typically the responsibility of home-owner associations or are owned by a business under contract with other users.
Permits for standard Title 5 systems are presumptive to the extent that they are not generally monitored for performance after they are permitted and installed. Title 5 generally requires that septic systems be inspected when a property is sold. Local regulations may require periodic pump-ing and reporting by service contractors. Leaching pits and cesspools, although non-conforming with existing health regulations, continue to be allowed until they fail hydraulically, pose a threat to public health, or upon transfer of the property.
Individual on-site septic systems are used to manage about 85% of the wastewater flow from residences and businesses on Cape Cod. These sys-tems range from simple leaching pits and cesspools installed decades ago to conventional Title 5 systems and innovative/alternative (I/A) systems.
CESSPOOLS AND LEACHING PITSCesspools (Figure TAC-2) typically consist of a porous cylinder made of stone, brick, or cement, surrounded by gravel. All liquid and solid wastes are retained in the cesspool and are partially digested by microorganisms at the bottom of the pit. The virtually untreated liquid passively leaches out through the gravel into the soil. A leaching pit is similar to a cesspool

REGIONAL WASTEWATER MANAGEMENT PLAN | TECHNOLOGY ASSESSMENT - CONVENTIONAL 3
but typically pre-cast cement with holes in the sides. They are typically installed in series after a cesspool when it would eventually fail to leach into the ground due to blockage. These systems were primarily designed for wastewater disposal without regard to pathogen or nutrient removal.
TITLE 5 SEPTIC SYSTEMSComponents of Title 5 septic systems consist of a pre-cast tank for waste-water separation (solids from liquids), a distribution box, and a subsur-face leaching trench for effluent disposal (Figure TAC-3). The compo-nents, particularly the leaching components, are designed under strict requirements based on the flow and permeability of the soils. As nitrogen-containing waste material travels through the septic tank and into the leach field, bacterial action mediates its chemical transformation from organic nitrogen to ammonia in the septic tank and then to nitrate below the leach field. Title 5 septic systems were designed to remove pathogens and not nutrients. Nitrate-laden wastewater from on-site septic systems travels without attenuation in groundwater to Cape Cod’s coastal waters.
FIGURE TAC-2: Cesspool

TECHNOLOGY ASSESSMENT - CONVENTIONAL | REGIONAL WASTEWATER MANAGEMENT PLAN4
INNOVATIVE/ALTERNATIVE TECHNOLOGYInnovative/alternative (I/A) septic system designs have been permitted under Title 5 since 1994 when the region first began looking for ways to reduce nitrogen loading from development. Innovative/alternative systems may be used for remedial measures, for unconventional disposal such as irrigation and composting, and for nitrogen removal. Prior to being permit-ted for use, each type of system undergoes a three-phase approval process (Piloting Use, Provisional Use, General Use) to ensure performance at levels at least consistent with Title 5. During the approval process, limited numbers of each type of system may be installed under strict siting and flow conditions and extensive monitoring. Title 5 regulations include special requirements for installation, monitoring, and maintenance of these systems.
Systems achieving Remedial Use approval are allowed solely to replace a failed system where a conventional system could not be sited and where there will be no increase in design flow. Nitrogen Removal Credits are discussed below.
Table TAC-1 lists information about some of the innovative/alternative systems and their approvals.
FIGURE TAC-3: Title 5 Septic System

REGIONAL WASTEWATER MANAGEMENT PLAN | TECHNOLOGY ASSESSMENT - CONVENTIONAL 5
TABLE TAC-1: Innovative/Alternative Systems and their Approval Status
SYSTEM MANUFACTURER PROCESS APPROVAL
Amphidrome F.R. Mahony & Associates, Inc. 273 Weymouth St. Rockland, MA 02370
Submerged Attached Growth-Sequencing Bioreactor
Provisional Approval BOD, TSS, and Nitrogen Reduction: November 16, 2011
FAST for residential (>2,000 gallons per day, or gpd) and non-residential (0 to 10,000 gpd)
Bio-Microbics, Inc. 8450 Cole Parkway Shawnee, KS 66227
Aerobic Treatment
Provisional Approval BOD5, TSS, and Nitrogen Reduction: March 11, 2010
Nitrex Lombardo Associates, Inc. 49 Edge Hill Rd. Newton, MA 02467
Filter with Nitrate-Reactive Media
Provisional Approval BOD5, TSS, and Nitrogen Reduction: September 2, 2010
Bio Barrier MBR Wastewater Treatment System
Bio-Microbics, Inc. 8450 Cole Parkway Shawnee, KS 66227
Aerobic and Anaerobic Treatment
Pilot Approval BOD, TSS, and Nitrogen Reduction: June 8, 2011
Nitrex-Plus Lombardo Associates, Inc. 49 Edge Hill Rd. Newton, MA 02467
Filter with Nitrate-Reactive Media
Pilot Approval BOD5, TSS, and Nitrogen Reduction: February 26, 2007
Omni-Cycle System
OMNI Environmental Systems, Inc. P.O. Box 128/465 East Falmouth Hwy. Falmouth, MA 02536
Recirculating Sand Filter and Anoxic Tank
Pilot Approval BOD5, TSS, and Nitrogen Reduction: January 16, 2009
Omni Recirculating Sand Filter System
OMNI Environmental Systems, Inc. P.O. Box 128/465 East Falmouth Hwy. Falmouth, MA 02536
Recirculating Sand Filter
Pilot Approval BOD5, TSS, and Nitrogen Reduction: April 4, 2005
RUCK North Coast Technologies, LLC 200 Main St., Suite 201 Falmouth, MA 02540
Aerobic RUCK Filter
General Approval Nitrogen Removal: June 28, 2007
SOURCE: Massachusetts Department of Environmental Protection and Barnstable County Department of Health and Environment

TECHNOLOGY ASSESSMENT - CONVENTIONAL | REGIONAL WASTEWATER MANAGEMENT PLAN6
The average effluent nitrogen concentration from a conventional on-site septic system is estimated to be 26 milligrams per liter, according to researchers at the Massachusetts Estuaries Project. Innovative/alterna-tive septic systems have been permitted a Nitrogen Removal Credit based upon an effluent nitrogen concentration of 19 milligrams per liter for a residential property and 25 milligrams per liter for a commercial property under Title 5. Such a credit allows for an increase in design flow per acre in designated Nitrogen Sensitive Areas, which are Zone IIs to public water supply wells, areas with private wells, and formally designated Nitrogen Sensitive Areas (there are currently no designated Nitrogen Sensitive Areas on Cape Cod other than the Zone IIs) and for new construction in areas that have both private wells and on-site septic systems. Title 5 limits septic system design flow to 440 gpd per acre in these areas; Nitrogen Removal Credits can increase the allowable flow from 400 gpd per acre to as much as 550 or 660 gpd per acre.
Nitrogen removal systems go a step further than conventional Title 5 sys-tems by promoting the growth of bacteria that are capable of transforming nitrate into nitrogen gas, which escapes to the atmosphere. They do so in a variety of different ways, all of which involve creating a carbon-rich but oxygen-poor environment in which denitrifying bacteria thrive. With few exceptions, these septic systems have moving parts, such as pumps, fans, and aerators, that require electricity. They are more expensive to install, operate, and maintain than a conventional Title 5 system. More than 1,500 alternative systems are in use on Cape Cod.
FIGURE TAC-4: Three Types of Innovative/Alternative Septic Systems: RUCK, Trickling Filter, and Recirculating Sand Filter
SOURCE: Massachusetts Department of Environmental Protection, Barnstable County Department of Health and the Environment, Cape Cod Commission

REGIONAL WASTEWATER MANAGEMENT PLAN | TECHNOLOGY ASSESSMENT - CONVENTIONAL 7
A few examples of these systems can be seen in Figure TAC-4. More infor-mation about these and many other systems is available at the websites of the Massachusetts Department of Environmental Protection and the Barnstable County Department of Health and the Environment.
Heufelder, Rask, and Burt (2008) analyzed the nitrogen-removal capabil-ity of innovative/alternative denitrifying septic systems installed on Cape Cod for which the sample size was four or greater. The analysis revealed that 69% of the 297 single-family systems and 60% of the 50 multi-family systems have medians that meet a regulatory discharge standard of 19 mg/L or less of total nitrogen. The authors urge caution in interpreting results due to the small sample size (average 6–8) and the high variability within and between individual sites. Unlike the consistent performance of some technologies observed in a test center venue where standard loads are applied, water use and strength of wastewater can vary considerably in individual households.
The state regulatory standard of 19 milligrams per liter is based on con-centration of nutrient in effluent rather than the volume of effluent and thus does not account for the fact that larger volumes of wastewater would result in larger masses of nutrient released.

TECHNOLOGY ASSESSMENT - CONVENTIONAL | REGIONAL WASTEWATER MANAGEMENT PLAN8
Wastewater Treatment Greater than 10,000 Gallons per Day
There are 62 private and public treatment facilities with effluent flows in excess of 10,000 gallons per day (Figure TAC-5 ). They are regulated by MassDEP under the Massachusetts Groundwater Discharge Program.
FIGURE TAC-5: Private and Public Facilities with Groundwater Discharge Permits
SOURCE: Massachusetts Department of Environmental Protection and Cape Cod Commission

REGIONAL WASTEWATER MANAGEMENT PLAN | TECHNOLOGY ASSESSMENT - CONVENTIONAL 9
Because of the environmental sensitivity afforded Cape Cod as a Sole Source Aquifer, the MassDEP typically requires that the effluent nitrogen concentration from a wastewater treatment facility cannot exceed 10 milli-grams per liter. The Cape Cod Commission has established a more stringent nitrogen effluent limit of 5 milligrams per liter for all treatment facilities that fall under the Massachusetts Groundwater Discharge Program.
Permitted wastewater treatment facilities range in size from 10,000 gal-lons up to 4.2 million gallons per day. A quarter of all the permits serve residential development with average flows of 72,000 gpd. Other devel-opment requiring groundwater discharge permits (GWDP) are medical facilities, schools, commercial and institutional, depending on wastewater generation. There are five municipal facilities that treat an average of 1.6 million gpd that have sewer collection areas in portions of the towns of Bourne, Chatham, Barnstable, Falmouth and Provincetown. Table TAC-2 identifies all facilities with a GWDP and provides their design flow.
TABLE TAC-2: Kind, Location, and Design Flow of Centralized and Satellite Wastewater Facilities on Cape Cod
CENTRALIZED WASTEWATER FACILITIES
PERMIT NUMBER
FACILITY LOCATION TOWNDESIGN FLOW (GPD)
21 Barnstable 617 Bearses Way Barnstable 4,200,000
44 Chatham 59 Sam Ryder Road Chatham 1,640,000
168 Falmouth 154 Blacksmith Shop Road
Falmouth 1,200,000
713 Provincetown Old Burn Dump & Route 6
Provincetown 575,000
41 Otis Air Force Base Kittredge Road Sandwich 840,000
SUBTOTAL: 8,065,000
SEPTAGE TREATMENT FACILITIES
PERMIT NUMBER
FACILITY LOCATION TOWNDESIGN FLOW (GPD)
187 Tri-Town 29 Overland Way Orleans 45,000
451 Yarmouth Buck Island/Old Townhouse
Yarmouth 110,000
SUBTOTAL: 155,000
SOURCE: Massachusetts Department of Environmental Protection
(TABLE TAC-2 CONTINUES ON THE NEXT SEVERAL PAGES)

TECHNOLOGY ASSESSMENT - CONVENTIONAL | REGIONAL WASTEWATER MANAGEMENT PLAN10
TABLE TAC-2 (continued)SCHOOLS
PERMIT NUMBER
FACILITY LOCATION TOWNDESIGN FLOW (GPD)
576 Marstons Mills Middle School
730 West Barnstable Road
Barnstable 32,000
670 Bourne Middle School
Waterhouse Road Bourne 35,400
631 Middle School & Elementary School
263 South Street Harwich 16,100
608 Mashpee Jr./Sr. High School
Route 151 Mashpee 18,000
398 Sandwich High School
365 Quaker Meeting House Road
Sandwich 31,000
401 Forestdale School Forestdale Road/Route 130
Sandwich 20,000
402 Ridge School Quaker Meetinghouse Road
Sandwich 20,000
785 Riverview School 551 Route 6A Sandwich 15,000
780 Dennis-Yarmouth High School
296 Station Avenue Yarmouth 17,000
SUBTOTAL: 204,500
MEDICAL FACILITIES AND NURSING HOMES
PERMIT NUMBER
FACILITY LOCATION TOWNDESIGN FLOW (GPD)
847 Cape Regency Healthcare Center
120 South Main Street
Barnstable 22,350
778 Pocasset Assisted Living
100 Dr. Julius Kelley Lane
Bourne 16,350
848 Bourne Manor Ex- tended Care Facility
146 Macarthur Boulevard
Bourne 22,000
599 Brewster Manor 873 Harwich Road Brewster 32,000
746 Pleasant Bay Health Center
383 South Orleans Road
Brewster 26,500
719 Atria-Woodbriar 339 Gifford Street Falmouth 43,750
357 Cranberry Point at Harwich
111 Headwaters Drive
Harwich 12,800
693 Mashpee Medical Facility
5 Industrial Drive Mashpee 6,250
305 Mayflower Place 579 Buck Island Road Yarmouth 25,000
344 Thirwood Place 237 North Main Street Yarmouth 24,000
SUBTOTAL: 231,000
SOURCE: Massachusetts Department of Environmental
Protection

REGIONAL WASTEWATER MANAGEMENT PLAN | TECHNOLOGY ASSESSMENT - CONVENTIONAL 11
LAUNDRIES AND LAUNDROMATS
PERMIT NUMBER
FACILITY LOCATION TOWNDESIGN FLOW (GPD)
164 Bourne Laundromat 105 Trowbridge Bourne 9,600
84 Camp Wono Main Street Brewster 2,300
112 Automatic Coin Laundry
13 Hall Street Dennis 20,000
669 Village Laundromat 432 East Falmouth Highway
Falmouth 10,800
613 Harwich Laundry & Cleaners
Route 28 & Doane Road
Harwich 14,400
SUBTOTAL: 57,100
COMMERCIAL
PERMIT NUMBER
FACILITY LOCATION TOWNDESIGN FLOW (GPD)
728 Cotuit Landing Shop Center
3860 Falmouth Road Barnstable 21,600
672 Patriot Square Shopping Center
492 Route 134 Dennis 17,000
306 Mashpee Commons Great Neck Road Mashpee 180,000
668 South Cape Village 672 Falmouth Road/Route 28
Mashpee 24,000
109 Orleans Bowling Ctr 191 Cranberry Hwy Orleans 12,000
788 Skaket Corners Shopping Center
9 West Road Orleans 20,000
SUBTOTAL: 274,600
RESIDENTIAL
PERMIT NUMBER
FACILITY LOCATION TOWNDESIGN FLOW (GPD)
850 Cotuit Meadows Barnstable 59,000
415 Villages of Brookside Bourne 60,000
633 Ocean Edge Conference Center
Route 6A Brewster 24,400
636 Chatham Bars Inn 297 Shore Road Chatham 35,000
661 Sheraton Four Points Route 6 Eastham 28,500
49 Seacrest Condo Association
350 Quaker Road Falmouth 85,000
738 New Silver Beach WWTF
William Road Falmouth 60,000
(RESIDENTIAL CONTINUES ON THE NEXT PAGE)
TABLE TAC-2 (continued)
SOURCE: Massachusetts Department of Environmental Protection

TECHNOLOGY ASSESSMENT - CONVENTIONAL | REGIONAL WASTEWATER MANAGEMENT PLAN12
TABLE TAC-2 (continued) RESIDENTIAL
PERMIT NUMBER
FACILITY LOCATION TOWNDESIGN FLOW (GPD)
324 Snow Inn 23 Snow Inn Road Harwich 80,000
851 Wequassett Resort & Golf Club
2171 Route 28 Harwich 27,390
263 Windchime Point Great Neck Road Mashpee 40,000
272 Southport on Cape Cod
Route 151 and Old Barnstable Road
Mashpee 172,000
382 Stratford Ponds 28 Main Street/Route 130
Mashpee 35,500
577 Willowbend Development
130 Willowbend Drive
Mashpee 113,000
698 New Seabury Fairway Lane Mashpee 300,000
873 Massasoit Hills Trailer Park
210 West Road South Wellfleet 33,900
640 Harborside Village Kendrick Avenue Wellfleet 21,600
1 Buck Island Condo 100 Willow Wood Dr Yarmouth 30,000
162 The Cove Resort Hotel
183 Main Street/Route 28
Yarmouth 39,000
307 King's Way Condominium
10 King's Circuit Yarmouth 165,000
742 Mill Pond Villages Off Camp Street Yarmouth 44,800
SUBTOTAL: 1,454,090
STATE PARKS
PERMIT NUMBER
FACILITY LOCATION TOWNDESIGN FLOW (GPD)
862 Nickerson State Park 3488 Main Street Brewster 48,600
860Shawme-Crowell State Forest
42 Main Street Sandwich 25,815
861Scussett Beach State Reservation
140 Scusset Beach Road
Sandwich 22,020
SUBTOTAL: 96,435
INSTITUTIONAL
PERMIT NUMBER
FACILITY LOCATION TOWNDESIGN FLOW (GPD)
774WHOI Quisset Campus
Off Oyster Pond Road
Falmouth 32,500
585 Community of Jesus 14 Anchor Drive Orleans 20,943
SUBTOTAL: 53,443
SOURCE: Massachusetts Department of Environmental
Protection
REGIONAL WASTEWATER MANAGEMENT PLAN | TECHNOLOGY ASSESSMENT - CONVENTIONAL 13
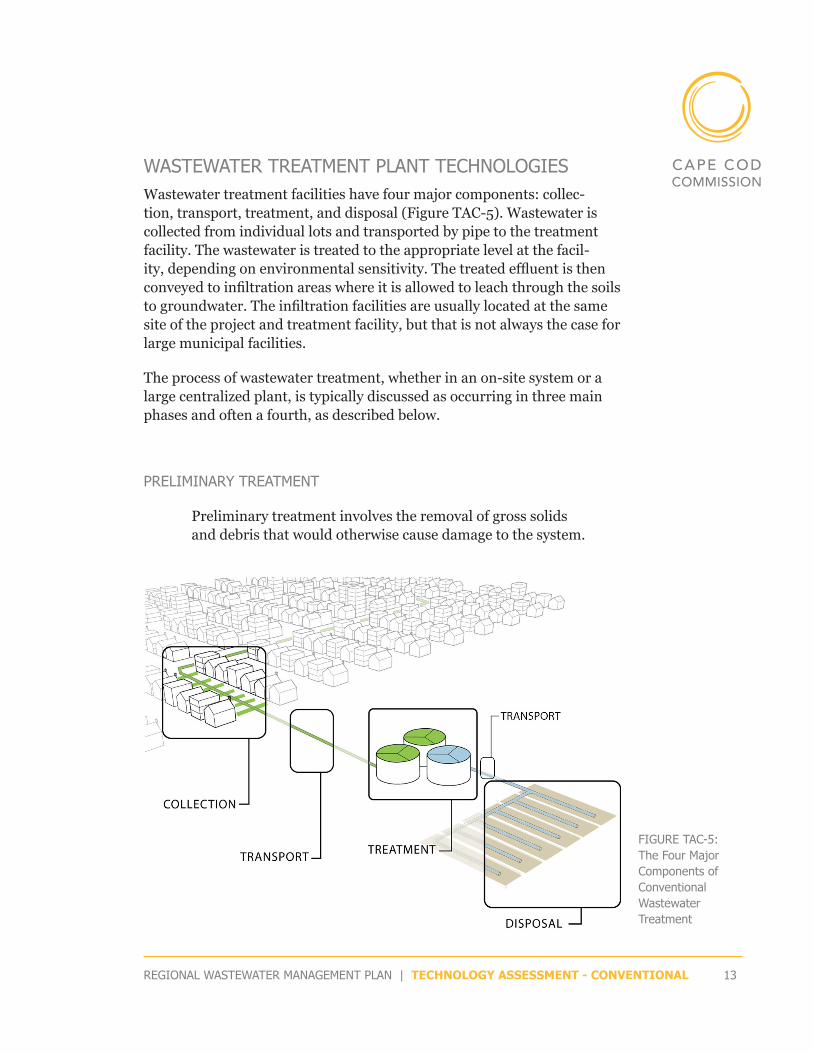
WASTEWATER TREATMENT PLANT TECHNOLOGIESWastewater treatment facilities have four major components: collec-tion, transport, treatment, and disposal (Figure TAC-5). Wastewater is collected from individual lots and transported by pipe to the treatment facility. The wastewater is treated to the appropriate level at the facil-ity, depending on environmental sensitivity. The treated effluent is then conveyed to infiltration areas where it is allowed to leach through the soils to groundwater. The infiltration facilities are usually located at the same site of the project and treatment facility, but that is not always the case for large municipal facilities.
The process of wastewater treatment, whether in an on-site system or a large centralized plant, is typically discussed as occurring in three main phases and often a fourth, as described below.
PRELIMINARY TREATMENT
Preliminary treatment involves the removal of gross solids and debris that would otherwise cause damage to the system.
FIGURE TAC-5: The Four Major Components of Conventional Wastewater Treatment

TECHNOLOGY ASSESSMENT - CONVENTIONAL | REGIONAL WASTEWATER MANAGEMENT PLAN14
Preliminary treatment often also includes grit-removal facilities to remove sand and abrasive material, thereby reducing the wear on system components.
PRIMARY TREATMENT
During primary treatment, heavy solids settle out while liquids, oils, and lighter materials remain floating. These constituents are removed from the top and bottom of the tank through mechanical methods and periodic pumping.
SECONDARY TREATMENT
During secondary treatment, microorganisms break down the dissolved and suspended waste matter, lowering the biological oxygen demand (BOD).
TERTIARY TREATMENT
Tertiary treatment, often referred to as advanced treatment, can refer to a number of different processes, including disinfection and denitrification, and commonly relies on biological processes to achieve higher levels of treatment.
The majority of wastewater is generated at peak times, typically in the mornings and evenings. Treatment plants often practice “flow equalization” to reduce peak loading to the system. Flow equalization takes into account the fluxuations of daily wastewater flows and stores the wastewater in tanks, subsequently pumping into the treatment plant at a regulated rate.
Secondary and tertiary processes are responsible for nutrient removal within wastewater treatment. Treatment of both phosphorus and nitrogen in wastewater is important; however, nitrogen is the dominant focus for nutrient loading on Cape Cod. Nitrogen removal requires two essential steps: nitrification (aerobic environment) and denitrification (anaerobic environment). Nitrification is a two-step biological process that converts ammonia through oxidation to nitrite, followed by the oxidation of the

REGIONAL WASTEWATER MANAGEMENT PLAN | TECHNOLOGY ASSESSMENT - CONVENTIONAL 15
nitrite to nitrate. Denitrification occurs when the oxygen level becomes depleted and nitrate becomes the primary source of oxygen for micro-organisms. Through this process nitrate is then converted to nitrogen gas. Physical/chemical processes can achieve nitrogen removal and additional wastewater treatment, but are not widely used in municipal systems due to the relatively high associated costs when compared to biological treat-ment. Certain types of physical/chemical processes include ion exchange, ammonia stripping, and breakpoint chlorination.
Secondary and tertiary treatment systems are broken into the three main categories discussed below: (1) suspended-growth processes, (2) attached-growth processes, and (3) plant and biological processes.
Suspended growth, achieved through single- and multiple-sludge sys-tems, is a biological approach that provides a supply of microorganisms in the wastewater. This mixture of microorganisms, water, and organic solids (known as mixed liquor suspended solids, or MLSS), is combined with wastewater to assist with the decomposition of organic matter and solids. Excess matter from biological growth is removed and the MLSS is separated for later reuse. Multiple-stage processes for nitrogen and phosphorous removal, multiple-stage/cyclical aeration, membrane biore-actors, oxidation ditches, and sequencing batch reactors are examples of suspended-growth treatment systems.
Attached-growth processes use an inert medium (for example, stone, sand, or plastic) that provides a surface for microorganisms to grow and multiply. These surfaces are exposed to wastewater and the microorganisms that are present consume the organics and solids, producing more microorganisms in the pro-cess. Rotating biological contactors, denitrifying filters, biological aerated filters (BAF), and Amphidrome systems are examples of attached-growth processes.
Lastly, and discussed in greater detail in the following sections, are plant and biological treatment systems. Plant and biological treatment systems utilize the inherent processes in plant material, as well as the accompanying microbiological activity to break down and treat constituents in wastewater. These systems are relatively inexpensive to operate when compared to con-ventional treatment systems; however, less is known about their treatment efficiencies and they often require a large footprint. Hydroponic systems, lagoons, and constructed wetlands, are examples of these systems.
Selection of a treatment technology may depend on space and use con-straints. Unlike systems that employ separate tanks for sequential

TECHNOLOGY ASSESSMENT - CONVENTIONAL | REGIONAL WASTEWATER MANAGEMENT PLAN16
treatment processes, sequencing batch reactors conserve space by using a single tank in which aerobic and anaerobic processes are alternated. Technologies that eliminate the need for clarifiers (e.g., membrane bioreac-tors) or those that limit sludge production (e.g., biological aerated filters and rotating biological contactors) also reduce the footprint of a treatment plant. Conversely, oxidation ditches require a relatively large footprint, but the open concentric channels in which wastewater is treated are eas-ily adapted for expanded flows. In an area with seasonal flows, rotating biological contactors may offer the flexibility required. The application of reverse osmosis (RO) membranes to the treatment of municipal wastewater has also had some success. RO can remove dissolved solids that cannot be removed by biological or other conventional municipal treatment processes. In addition, RO membranes can also lower organics, color, and nitrate levels. However, extensive pretreatment and periodic cleaning are usually needed to maintain acceptable membrane water fluxes (Williams, 2004).
COLLECTION SYSTEM ALTERNATIVESAs with wastewater treatment alternatives, choosing a wastewater collec-tion system—the sewer lines that connect individual parcels to a central point—requires a balance between cost and feasibility, particularly with respect to geographic and hydraulic constraints. For centralized waste-water treatment and disposal, options include conventional technologies such as gravity sewers and force mains and alternative technologies such as low-pressure sewer and vacuum systems.
Gravity sewers are often preferred because infrastructure can be con-trolled by the municipality or public utility operating the system. Where
FIGURE TAC-6: Kinds of Collection Systems

REGIONAL WASTEWATER MANAGEMENT PLAN | TECHNOLOGY ASSESSMENT - CONVENTIONAL 17
alternative systems are favored, easements or regulation may be necessary to ensure that publicly owned pumps and conveyances located on private property are accessible for maintenance, or that private devices are regu-larly maintained and not modified by the property owner.
A brief description of the different technologies is presented below. Figure TAC-6 illustrates the different kinds of collection systems. Detailed infor-mation about the advantages and disadvantages of collection technologies is available in the Comprehensive Wastewater Management Plans that have been completed or are under development in Cape communities.
GRAVITY SEWERS
In a conventional gravity sewer collection system, wastewater flows by gravity from individual properties to a gravity sewer main in the street. Lift pumps and force mains may be necessary where wastewater must be conveyed from lower to higher elevations.
Advantages of a gravity sewer include low-energy needs (as pump stations are the only components requiring power), ease of maintenance, and the ability to handle different flow rates. However, the need to place sewer lines at increasing depth may require more pumping stations and there-fore more energy to operate the systems.
Gravity sewers are most susceptible to infiltration and inflow (I/I). Infiltra-tion is the introduction of water from cracks and breaks in the sewer line, and inflow is the introduction of stormwater to the sewer. The addition of water from I/I may add 20% to the volume of wastewater entering the treatment plant and must be taken into account when sizing the treatment facility.
Property owners are responsible for construction and maintenance of the service connection and pipe linking their property to the sewer in the street.
LOW-PRESSURE SEWERS
With low-pressure sewers, each building or group of buildings located in close proximity to each other has a grinder pump that pumps waste-water into a low-pressure line in the street. The reduced costs for con-struction (shallower depths for installation, smaller pipe sizes, and less

TECHNOLOGY ASSESSMENT - CONVENTIONAL | REGIONAL WASTEWATER MANAGEMENT PLAN18
susceptibility to I/I) may offset the high costs of the grinder pumps in some cases. Extended power outages potentially can cause sewer backups.
Property owners are generally responsible for maintenance of the grinder pump and pay the power charge to operate the pump.
SEPTIC TANK EFFLUENT SEWERS
Septic tank effluent sewer systems use a septic tank for primary treat-ment. The two main types are:
1. a septic tank effluent pump (STEP) system, which pumps wastewater from the septic tank to a pressure sewer in the street. The pumps are less expensive than grinder pumps, but septage must be pumped from the septic tanks, and the pump will not function during power outages.
2. a septic tank effluent gravity (STEG) system, which uses grav-ity to convey wastewater from individual buildings to the street. Because larger solids remain in the septic tank, the sewer can be installed at less of a slope than conventional gravity sewers. STEG systems are not applicable in hilly terrain.
VACUUM SEWERS
In a vacuum sewer system, wastewater from each property flows by gravity to a valve pit that can serve one to four buildings. When wastewater in the valve pit is sufficient, the valve opens and the wastewater is sucked into the main vacuum line, which leads to a vacuum and pumping station where the wastewater is pumped to the treatment facility. The vacuum station is the only component of a vacuum sewer system that requires energy.
Shallow depths of sewer lines, no I/I in the pressurized part of the sys-tem, and ease of maintenance are main advantages of vacuum sewers. However, these systems require more training for operators, require rapid response times for any system problem, and are less flexible in handling variable flow rates.
Provincetown and Hyannis utilize vacuum sewers. Property owners are responsible only for the gravity connections on their lots.

REGIONAL WASTEWATER MANAGEMENT PLAN | TECHNOLOGY ASSESSMENT - CONVENTIONAL 19
HYBRID SYSTEMS
Many sewer systems combine gravity flow with the strategic placement of grinder pumps and pumping stations to eliminate the need to install sewer lines at greater depth.
REDUCING THE COSTS OF A COLLECTION SYSTEM
The wastewater collection system is the single most expensive component of off-site wastewater treatment. To contain costs as much as possible, the layout of a wastewater collection system should incorporate the following guidelines:
�� Connect the lots with the highest amount of nitrogen in waste-water to reduce the number of lots needing to be sewered and thus the cost of collection. For example, if the necessary nitro-gen reduction in a particular watershed is 65%, that goal may be achieved by sewering fewer than 65% of the lots. In general, the lots with the highest nitrogen load are those with the high-est water use.
�� Connect all commercial properties in areas requiring nitrogen reduction, as commercial lots tend to have higher water use and may have higher effluent nitrogen concentrations.
�� Identify road lengths with the highest wastewater flow per mile of street length. This approach will result in a cost-effective and efficient sewer system—one that uses the least amount of pipe per property served.
�� Give priority to lots that are closest to the water body to be pro-tected, and preferably within the 10-year groundwater travel time.
�� Avoid areas requiring grinder pumps or numerous conven-tional pump stations. (Note: From a travel-time perspective, this goal may be contrary to focusing on lots nearest the shore.)
�� Sewer areas that can address multiple issues in addition to nitrogen control; for example, sanitary needs, pond protection, high costs for future Title 5 replacement, and convenience or aesthetic factors.
�� Evaluate potential treatment site locations for their ability to minimize transport costs.

TECHNOLOGY ASSESSMENT - CONVENTIONAL | REGIONAL WASTEWATER MANAGEMENT PLAN20
FIGURE TAC-7: Methods to Reduce
Cost of Collection
Figure TAC-7 illustrates some of these points.

REGIONAL WASTEWATER MANAGEMENT PLAN | TECHNOLOGY ASSESSMENT - CONVENTIONAL 21
CHECKERBOARD COLLECTION SYSTEM
Until very recently, Massachusetts law required towns to connect all prop-erties that had frontage along a sewer line, unless special legislation was passed. This law severely limited a town’s ability to manage growth and forced communities to design wastewater treatment facilities for more capacity than desired. Passage of the Environmental Bond legislation in 2008 changed this mandate, and towns now have the ability to restrict sewer connection under the “checkerboard” provisions of the legislation. A checkerboard system allows a town to restrict sewer service to only those lots in greatest need and/or to preserve limited capacity for waste-water treatment or disposal (Figure TAC-8).
Under the amended Massachusetts General Law 83, a town with a certi-fied local Comprehensive Wastewater Management Plan may adopt Chap-ter 83 authorizing it, by a local majority vote, to construct and maintain a wastewater treatment system to reduce nutrients and protect drinking water.
The amended law has several provisions governing sewer connections, including:
�� Mandating landowners whose property is adjacent to a sewer line to connect to the sewer if the Comprehensive Wastewater
FIGURE TAC-8: Checkerboard Collection System

TECHNOLOGY ASSESSMENT - CONVENTIONAL | REGIONAL WASTEWATER MANAGEMENT PLAN22
Management Plan specifically identifies the property as requir-ing sewage treatment for wastewater flows on the property in existence at the time the act was adopted;
�� Allowing connections for properties served by failed septic sys-tems for which no other on-site solution is possible;
�� Allowing for the connection of affordable housing built under Chapters 40B and 40R;
�� Allowing a property slated for connection but currently serviced by an on-site innovative wastewater treatment system that is provisionally approved by the Massachusetts Department of Environmental Protection (MassDEP) to forego connection to the sewer if the owner pays to monitor and inspect the system under a MassDEP-approved plan;
�� Allowing for additional connections to be made if an existing on-site system cannot be maintained, or for new buildings, as long as the flow does not exceed what would have been allowed by Title 5 and the zoning as it existed at the time of adoption of the act;
�� Authorizing municipalities to expand the system to connect municipal buildings, public restrooms, or other public ser-vice uses as it so defines them to include but not be limited to affordable housing constructed under Chapters 40B and 40R; and
�� Allowing a municipality to amend its plan and add new areas requiring treatment, subject to approval from MassDEP.
For more information, see the checkerboard section in the Land Use, Wastewater Planning, and Growth Management Section.
WASTEWATER EFFLUENT DISPOSAL
Wastewater effluent disposal is a significant challenge on Cape Cod because of the ubiquitous environmental constraints of the sole source aquifer. Disposal options are also limited due to the number of available sites. In watersheds that require the removal of all existing nitrogen loads to meet a Total Maximum Daily Load (TMDL), it will likely be necessary

REGIONAL WASTEWATER MANAGEMENT PLAN | TECHNOLOGY ASSESSMENT - CONVENTIONAL 23
to dispose of treated wastewater in a different watershed. Added costs associated with meeting a higher level of treatment than nitrogen reduc-tion discourages construction of new disposal facilities in wellhead protec-tion areas. As with treatment and collection, effluent disposal alternatives also must balance cost and feasibility.
Several land-based disposal technologies can be used in Massachusetts. Proven technologies include sand infiltration beds, subsurface leaching beds, spray and drip irrigation techniques, and wicks (Figure TAC-9).
SAND INFILTRATION BEDS
Sand infiltration beds are open basins in which treated effluent percolates through the sand, the unsaturated zone of the soil, and then to ground-water. Typically, treatment and disposal facilities are located on the same site, reducing the cost of transporting treated effluent. Compared to subsurface leaching systems (described next), sand infiltration beds have a smaller footprint, but the site cannot be used for other purposes.
FIGURE TAC-9: Land-based Effluent Disposal Technologies
TECHNOLOGY ASSESSMENT - CONVENTIONAL | REGIONAL WASTEWATER MANAGEMENT PLAN24
MassDEP generally allows hydraulic loading rates of 5 gallons per day per square foot of bed area. Maintenance requirements are minimal. Typi-cally, disinfection is required.
SUBSURFACE LEACHING SYSTEMS
Subsurface leaching systems or soil absorption systems (SAS) are the most common disposal method presently employed on Cape Cod, as they are used for on-site septic systems. Although larger wastewater treatment facilities require large disposal areas, SAS can be installed beneath recre-ational and paved land areas. Large-scale SAS typically have pumps and pipes to pressure dose the infiltration areas. Maintenance is more difficult because the infiltration area is below the surface of the ground and solids cannot be easily removed. MassDEP generally allows hydraulic loading rates of 2.5 gallons per day per square foot of bed area. Typically, disinfec-tion is not required unless the SAS is in a Zone II.
SPRAY IRRIGATION
Spray irrigation systems discharge treated effluent to large areas such as fields, woods, and golf courses. Spray irrigation allows for a secondary use of land, provides inexpensive irrigation, promotes evapo-transpiration, and, in the case of golf courses, can reduce the need for fertilizers. The potential for freezing temperatures may require a secondary method of effluent disposal during winter months. MassDEP has stringent require-ments for the use of reclaimed water, including a requirement for disinfection.
DRIP IRRIGATION
MassDEP has approved drip irrigation as an acceptable effluent-disposal method for flows that are less than 10,000 gallons per day and that meet required treatment levels for reclaimed water. Drip irrigation functions much like SAS except it utilizes pressurized flexible tubing installed at shallow depth where effluent can be absorbed by plant roots. Ben-efits include ease and low cost of installation and minimal water table impacts. Drip irrigation systems may not operate in colder climates. This

REGIONAL WASTEWATER MANAGEMENT PLAN | TECHNOLOGY ASSESSMENT - CONVENTIONAL 25
technology also requires that effluent be treated to a high level to prevent clogging of the emitters. A reserve standard SAS may be required due to the experimental nature of drip irrigation systems in Massachusetts.
WICK
A wick well consists of a well of crushed stone 3–8 feet in diameter that extends to the depth of the water table. Treated wastewater flows via gravity over the stone and into the groundwater. Wick well systems have a very small footprint and easily allow for redundancy so that individual wells can be used sequentially. Effluent must be treated to a high level so clogging of the stone does not occur. This technology has been used in only a few places in Massachusetts.
DEEP WELL INJECTION
Deep well injection involves pumping treated effluent into the groundwa-ter below the land surface. A pilot test conducted at the Hyannis Water Pollution Control Facility indicated injection wells can become plugged if the effluent is not chlorinated. MassDEP has not supported this technol-ogy as chlorination can create secondary impacts to the groundwater.
OCEAN OUTFALL
The Massachusetts Ocean Sanctuaries Act prohibits the discharge of any municipal wastewater into an ocean sanctuary. A variance is available only to communities that have an existing municipal wastewater discharge to an ocean sanctuary. Designing and estimating the cost for an ocean outfall is a rather straightforward task. However, satisfying the legal requirements for attaining a waiver for ocean outfall will require a significant technical feasi-bility study. Issues to be addressed include tides, depth, sediments, benthic surveys, fish and fowling habitats, modeling of mixing zones, documenta-tion of background water quality, projection of impacts, establishment of a scientific task force, and development of a monitoring and contingency plan. These studies would take several years to implement and interpret and would need to be duplicated if more than one town desired to carry forward Nantucket Sound and Cape Cod Bay options.

TECHNOLOGY ASSESSMENT - CONVENTIONAL | REGIONAL WASTEWATER MANAGEMENT PLAN26
DISPOSAL SITES AND TOTAL ORGANIC CARBON
Due to the revision of MassDEP regulations in 2009, disposing of treated water in Zone II areas could be prohibitively expensive. Effluent discharge into Zone II areas are required to meet MassDEP’s “Interim Guidelines on Reclaimed Water” (January 2000). The 2009 proposed revision to the guidelines made the limit on total organic carbon more stringent and prompted the Cape Cod Water Protection Collaborative to submit a comment indicating that the literal application of the total organic carbon requirement would seriously impede wastewater planning on Cape Cod. In response, MassDEP modified its regulations (314 CMR 5.10) to include some accommodation for extenuating circumstances.
SLUDGE BIOSOLIDS AND SEPTAGE MANAGEMENTThis section is adapted from the 2004 report Enhancing Wastewater Management on Cape Cod: Planning, Administrative, and Legal Tools.
Every wastewater treatment system generates residual solids that need to be regularly removed and disposed of prior to treatment. Another often-overlooked residual is the grease removed from restaurant grease traps or from the headworks of conventional wastewater treatment systems. The residual solids from conventional treatment systems are called sludge (when disposed of without beneficial reuse) or biosolids (when benefi-cially reused). Septage is the term used to describe the solids pumped from septic tanks.
If residual solids are not regularly removed from treatment systems, the system will not continue to function properly and may require replace-ment sooner than expected. This is particularly true of Title 5 systems, where solids carry over from the septic tank to the leaching system and can cause system failure.
The quantity of residual solids generated on Cape Cod is expected to increase for several reasons:
�� The increasing population will create more wastewater, which results in more residuals.

REGIONAL WASTEWATER MANAGEMENT PLAN | TECHNOLOGY ASSESSMENT - CONVENTIONAL 27
�� As individual septic systems are replaced by cluster, satellite, or centralized facilities, the higher level of wastewater treatment will result in more residuals per gallon treated.
�� Fats, oils, and grease from restaurants and other food prepara-tion facilities need to be handled properly, which will increase the frequency of pumping and the resulting volumes.
Several problems deserve attention:
�� The lack of public understanding of the need for regular removal of solids from wastewater systems;
�� A possible shortfall of acceptable disposal locations as quanti-ties increase; and
�� Increasing costs for pumping, transport, and disposal if local options become unavailable.
To address these issues:
�� Efforts should be taken to quantify the amount of septage and sludge handling that may be required and to evaluate the capacity of existing and potential facilities on the Cape and off-Cape alternatives. Present CWMPs have included septage disposal as a component of their planned facilities.
�� Towns should require owners of cluster and satellite plants to conduct regular pumping of residuals and to provide docu-mentation of the date pumped, the quantity pumped, and the receiving location for treatment.
�� Towns can adopt regulations and bylaws requiring owners of Title 5 systems to pump their septic systems at least every three years and also require all licensed septage pumpers and haulers to inspect systems and report failures and problems to the local health department.
Over time, the region will develop an integrated waste management plan to pursue the beneficial use of biosolids, municipal solid waste, and com-mercial food waste. Newly developing technologies hold promise for turn-ing these waste streams into local and regional assets.

TECHNOLOGY ASSESSMENT - CONVENTIONAL | REGIONAL WASTEWATER MANAGEMENT PLAN28
NON-DISCHARGING TECHNOLOGY
COMPOSTING
Composting toilets are self-contained systems that catch all toilet waste in a basement receptacle. The receptacle is vented and typically does not smell. All waste is managed by turning over material so that a rich humic material results. The material can be used for outside gardening and other agricultural uses, subject to approvals. Numerous composting systems are in use on Cape Cod now, either in residential applications or in public and non-profit venues. All human discharges are contained, which is why this set of technologies are referred to as non-discharging technology.
Since revisions to Title 5 in 1994, composting toilets have been permitted for remedial use and for new construction where a conventional Title 5 system could be installed. Among other modifications to the regulations, the required size of the leaching field has been reduced.
Title 5 requires composting toilets to be designed to store compost for at least two years. The compost can be buried on-site if covered with a minimum of six inches of clean compacted soil, or can be collected by a licensed septage hauler or be disposed of according to local board of health regulations. Liquid by-products that are not recycled through the toilet must be discharged through a graywater system that includes a septic tank and soil absorption system on the property, or be removed by a licensed septage hauler.
Composting toilets are not currently eligible for nitrogen-reduction cred-its because under current disposal options they do not reduce the amount of nutrients in waste matter that could enter groundwater. If compost is buried on site and liquid waste diverted to a graywater septic system, there is no loss of nutrients. Likewise, if compost and or liquid waste is taken to a local treatment plant, there is no net loss of nutrients.
URINE DIVERSION TOILETS
Urine diversion toilets capture urine in a separate waste stream from the solid toilet material (Figure TAC-10). The urine is captured in a tank that occasionally needs to be emptied and hauled away or used for agricultural purpose. The urine is high in phosphorous and ammonium nitrogen; the

REGIONAL WASTEWATER MANAGEMENT PLAN | TECHNOLOGY ASSESSMENT - CONVENTIONAL 29
majority of nitrogen in human waste is excreted in the urine. Thus the urine diversion technology minimizes the use of fresh water to carry the waste stream and recovers the nitrogen and phosphorous for recycling.
If either a composting or urine diversion compost toilet is installed, a graywater septic system is necessary to capture water from sinks, showers, bathtubs, and dishwashers.
TIGHT TANKS
Tight tanks are for temporary storage of waste materials; they do not have an outlet to any kind of soil absorption system. Tight tanks are not per-mitted by Title 5 for new construction, but may be used if there is no other viable alternative for remediation. They require regular pumping and treatment at a septage facility.
INCINERATING TOILETS
Incinerating toilets use electricity or gas to burn solid and liquid waste materials at high temperature to sterile ash. A few of these systems have
FIGURE TAC-10: Urine Diversion System

TECHNOLOGY ASSESSMENT - CONVENTIONAL | REGIONAL WASTEWATER MANAGEMENT PLAN30
been installed on Cape Cod, typically on piers and at dune and beach shacks. Although not referenced in Title 5 regulations, incinerating toilets have been permitted in remedial situations for limited use where a gray water disposal system is available.
PACKAGING TOILETS
Packaging toilets are portable units in which the toilet seat, receptacle, and storage area are a single self-contained unit. Recent models use no electricity or water, and the storage area makes use of biodegradable lin-ers that capture and package waste materials for disposal. Packaging toi-lets are normally not designed for heavy use and are best suited for small households or vacation homes. Packaging toilets are also appropriate for use following a natural disaster in an area that lacks sanitation facilities.


CAPE COD REGIONAL WASTEWATER MANAGEMENT PLAN | TECHNOLOGY ASSESSMENT - CONVENTIONALMARCH 2013