Embed Size (px)
Citation preview

CO2 Capture Membrane Process for Power Plant Flue Gas
Final Technical Report
Period of Performance: October 1, 2008 to September 30, 2011
by
Lora Toy Atish Kataria
Raghubir P. Gupta
DOE Cooperative Agreement No. DE-NT0005313
Submitted by Prime Recipient:
RTI International1 3040 Cornwallis Road
P.O. 12194 Research Triangle Park, NC 27709-2194
April 2012
1 RTI International is a trade name of Research Triangle Institute.

i
Disclaimer
This report was prepared as an account of work sponsored by an agency of the United States Government. Neither the United States Government nor any agency thereof, nor any of their employees, makes any warranty, express or implied, or assumes any legal liability or responsibility for the accuracy, completeness, or usefulness of any information, apparatus, product, or process disclosed, or represents that its use would not infringe privately owned rights. Reference herein to any specific commercial product, process, or service by trade name, trademark, manufacturer, or otherwise does not necessarily constitute or imply its endorsement, recommendation, or favoring by the United States Government or any agency thereof. The views and opinions of the authors expressed therein do not necessarily state or reflect those of the United States Government or any agency thereof.

ii
Acknowledgements
This project was sponsored by the National Energy Technology Laboratory (NETL) of the U.S. Department of Energy (DOE), under Cooperative Agreement No. DE-NT0005313. RTI gratefully acknowledges the assistance of DOE/NETL representatives for their project guidance and support. In addition, cost-sharing for this project was provided by project partners Arkema Inc. (King of Prussia, PA) and Generon IGS, Inc. (Pittsburg, CA). Recognition of contributing individuals from these organizations is provided below.
DOE/NETL: Andrew O’Palko, José Figueroa, Lynn Brickett, and Jared Ciferno.
Arkema Inc.: John Schmidhauser, Ramin Amin-Sanayei, Cedric Airaud, and Caiping Lin.
Generon IGS, Inc.: John Jensvold, Fred Coan, Raymond Chan, and Marc Straub.
RTI International: Process Engineering: Aqil Jamal and Gunnar Henningsen. Experimental and Technical Support: Paige Presler-Jur, Ranjeeth Kalluri, and Nandita Akunuri. Analytical and Engineering Support: Gary Howe, John Albritton, Martin Lee, Li Han, and David Coker (RTI consultant). Financial Support: Teri Williams, Evan Picard, and Crystal Wilding. Administrative Support: Yvonne Harrison and Deanna Penick.

iii
Abstract
Because the fleet of coal-fired power plants is of such importance to the nation’s energy production while also being the single largest emitter of CO2, the development of retrofit, post-combustion CO2 capture technologies for existing and new, upcoming coal power plants will allow coal to remain a major component of the U.S. energy mix while mitigating global warming. Post-combustion carbon capture technologies are an attractive option for coal-fired power plants as they do not require modification of major power-plant infrastructures, such as fuel processing, boiler, and steam-turbine subsystems.
In this project, the overall objective was to develop an advanced, hollow-fiber, polymeric membrane process that could be cost-effectively retrofitted into current pulverized coal-fired power plants to capture at least 90% of the CO2 from plant flue gas with 95% captured CO2 purity. The approach for this project tackled the technology development on three different fronts in parallel: membrane materials R&D, hollow-fiber membrane module development, and process development and engineering. The project team consisted of RTI (prime) and two industrial partners, Arkema, Inc. and Generon IGS, Inc.
Two CO2-selective membrane polymer platforms were targeted for development in this project. For the near term, a next-generation, high-flux polycarbonate membrane platform was spun into hollow-fiber membranes that were fabricated into both lab-scale and larger prototype (~2,200 ft2) membrane modules. For the long term, a new fluoropolymer membrane platform based on poly(vinylidene fluoride) [PVDF] chemistry was developed using a copolymer approach as improved capture membrane materials with superior chemical resistance to flue-gas contaminants (moisture, SO2, NOx, etc.). Specific objectives were
Development of new, highly chemically resistant, fluorinated polymers as membrane materials with minimum selectivity of 30 for CO2 over N2 and CO2 permeance greater than 300 gas permeation units (GPU) targeted
Development of next-generation polycarbonate hollow-fiber membranes and membrane modules with higher CO2 permeance than current commercial polycarbonate membranes
Development and fabrication of membrane hollow fibers and modules from candidate polymers Development of a CO2 capture membrane process design and integration strategy suitable for
end-of-pipe, retrofit installation Techno-economic evaluation of the “best” integrated CO2 capture membrane process design
package
In this report, the results of the project research and development efforts are discussed and include the post-combustion capture properties of the two membrane material platforms and the hollow-fiber membrane modules developed from them and the multi-stage process design and analysis developed for 90% CO2 capture with 95% captured CO2 purity.

iv
Table of Contents
Section Page
Disclaimer ................................................................................................................................................. i
Acknowledgements .................................................................................................................................. ii
Abstract ................................................................................................................................................... iii
List of Tables .......................................................................................................................................... vi
List of Figures ....................................................................................................................................... viii
Executive Summary ........................................................................................................................... ES-1
1. Introduction ................................................................................................................................... 1-1 1.1 Approach and Project Objectives ........................................................................................ 1-3 1.2 Project Objectives ............................................................................................................... 1-4
2. Experimental Methods .................................................................................................................. 2-1 2.1 Novel Fluoropolymer Synthesis and Characterization ........................................................ 2-1 2.2 Membrane Preparation ........................................................................................................ 2-2
2.2.1 Membrane Films .................................................................................................... 2-2 2.2.2 Hollow-Fiber Membranes and Modules ................................................................ 2-2
2.3 Permeation Testing ............................................................................................................. 2-4 2.4 Process Modeling and Design ............................................................................................. 2-6
3. Results and Discussion ................................................................................................................. 3-1 3.1 Novel Fluoropolymer Membranes ...................................................................................... 3-1
3.1.1 Homogeneous VDF-Based Copolymers Synthesized ............................................ 3-1 3.1.2 VDF-Based Materials Made by Other Synthetic Methods .................................... 3-5 3.1.3 Gas Permeation Properties of New VDF-Based Polymers .................................... 3-6 3.1.4 Effect of Temperature on Permeation Properties of VDF-Based Polymers ........ 3-10 3.1.5 Effect of Contaminants on Permeation Properties of VDF-Based Polymers ....... 3-12
3.2 Next-Generation Polycarbonate Membranes .................................................................... 3-14 3.3 Hollow-Fiber Membrane Development ............................................................................ 3-15
3.3.1 Next-Generation Polycarbonate Membrane Hollow Fibers ................................. 3-16 3.3.1.1 Gas Permeation Properties of Next-Generation Polycarbonate
Membrane Hollow Fibers .................................................................... 3-17 3.3.1.2 Effect of Temperature on Next-Generation Polycarbonate
Membrane Hollow Fibers .................................................................... 3-19 3.3.1.3 Effect of Operating Stage-Cut and Feed CO2 Content on
Next-Generation Polycarbonate Membrane Hollow Fibers................. 3-19 3.3.1.4 Effect of Contaminants on Next-Generation Polycarbonate
Membrane Hollow Fibers .................................................................... 3-20 3.3.1.5 Prototype Modules of Next-Generation Polycarbonate
Membrane Hollow Fibers .................................................................... 3-24

v
3.3.2 VDF-Based Copolymer Membrane Hollow Fibers ............................................. 3-24 3.4 Process Engineering and Design ....................................................................................... 3-30
3.4.1 Single-Stage Membrane Process .......................................................................... 3-30 3.4.2 Process Sensitivity Analyses ................................................................................ 3-31 3.4.3 Multistage Membrane Process Development ....................................................... 3-35 3.4.4 Effect of Flue-Gas Contaminants ......................................................................... 3-39 3.4.5 Simplified CO2 Capture Cost Estimation Methodology for Process
Optimization ......................................................................................................... 3-41 3.4.6 Process Optimization ........................................................................................... 3-42
3.5 Techno-economic Analysis ............................................................................................... 3-43 3.5.1 Power Consumption ............................................................................................. 3-44 3.5.2 Equipment Costs .................................................................................................. 3-45 3.5.3 Levelized Cost of Electricity (LCOE) .................................................................. 3-46
4. Conclusions and Recommendations ............................................................................................. 4-1
5. References ..................................................................................................................................... 5-1

vi
List of Tables
Number Page Table 1-1. CO2 and N2 Permeation Properties of Commercial Membrane Polymers .......................... 1-2
Table 3-1. Material Properties of Novel VDF-Based Copolymers Synthesized .................................. 3-3
Table 3-2. Intrinsic Gas Permeation Properties of VDF-co-A Copolymer Series ............................... 3-6
Table 3-3. Intrinsic Gas Permeation Properties of VDF-co-B Copolymer Series ............................... 3-8
Table 3-4. Intrinsic Gas Permeation Properties of VDF-co-C Copolymer .......................................... 3-9
Table 3-5. Intrinsic Gas Permeation Properties of VDF-A-B-1 Terpolymer Membrane Film .......... 3-10
Table 3-6. Intrinsic Gas Permeation Properties of Generon Standard (Commercial) and Next-Generation, High-Flux Polycarbonates ............................................................. 3-15
Table 3-7. Characteristics of Common Gas-Separation Membrane Module Types .......................... 3-15
Table 3-8. Average Dimensions of High-Flux Polycarbonate Fibers Spun ...................................... 3-17
Table 3-9. Permeation Properties of Standard and High-Flux Polycarbonate (PC) Membranes as Films and Hollow Fibers .................................................................... 3-18
Table 3-10. Pure-Gas Permeation Properties of Beaker Units Made with Developmental VDF-A.2 Hollow Fibers ............................................................................................. 3-30
Table 3-11. Process Conditions Used To Study Effect of Pressure Difference on Membrane Separation Performance .............................................................................................. 3-32
Table 3-12. Process Conditions Used To Study Effect of Pressure Ratio on Membrane Separation Performance .............................................................................................. 3-33
Table 3-13. Process Simulation Results With and Without O2 for 90% CO2 Capture ...................... 3-39
Table 3-14. Effect of H2O Vapor in Flue-Gas Feed on Simulation Results for 90% CO2 Removal ...................................................................................................................... 3-40
Table 3-15. Effect of Multiple Flue-Gas Contaminants on Three-Stage Capture Membrane Process Performance for 90% CO2 Removal ............................................................. 3-41
Table 3-16. Basis Used for Major Equipment Cost Estimation for Capture Membrane Process ...... 3-41
Table 3-17. Effect of Stage-Cut on Estimated CO2 Capture Cost for 90% CO2 Removal with Three-Stage Membrane Process ................................................................................. 3-43
Table 3-18. Membrane Properties Used for Techno-economic Analysis .......................................... 3-44
Table 3-19. Power Requirement and Cost of Major Equipment in Three-Stage membrane Capture Process .......................................................................................................... 3-46
Table 3-20. Capital Charge and Levelization Factors Used in Process Economic Analysis ............. 3-47
Table 3-21. Parameter Values and Contributions in LCOE Estimation for 550-MWe Subcritical Power Plant Without Carbon Capture ...................................................... 3-47

vii
Table 3-22. Parameter Values and Contributions in LCOE Estimation for Net 550-MWe Subcritical Power Plant With RTI Three-Stage Membrane Carbon Capture Process ........................................................................................................................ 3-48
Table 3-23. Parameter LCOE Contributions for Net 805-MWe Power Plant ................................... 3-49

viii
List of Figures
Number Page Figure 1-1. Project technical approach used. ....................................................................................... 1-3
Figure 2-1. Research fiber spinline equipment for hollow-fiber membrane development. ................. 2-3
Figure 2-2. Typical design of Generon hollow-fiber membrane module. ........................................... 2-4
Figure 2-3. Schematic of RTI gas permeation test system with online GC analysis. .......................... 2-5
Figure 3-1. Chemical structure of base PVDF homopolymer. ............................................................. 3-1
Figure 3-2. Dependence of (a) polymer melting temperature Tm and (b) polymer crystallinity on comonomer concentration for new VDF-co-A series of copolymers ...................... 3-3
Figure 3-3. Effect of comonomer concentration on (a) polymer melting temperature Tm and (b) polymer crystallinity for new VDF-co-B series of copolymers .............................. 3-4
Figure 3-4. Effect of comonomer concentration on (a) gas permeance and (b) selectivity at 35 °C in VDF-co-A copolymer membrane films. ........................................................ 3-7
Figure 3-5. Effect of comonomer content on (a) gas permeance and (b) selectivity in VDF-co-B copolymer membrane films ........................................................................ 3-9
Figure 3-6. Effect of temperature on gas permeances in VDF-A.2. ................................................. 3-11
Figure 3-7. Temperature dependences of (a) N2 and (b) CO2 permeances in VDF-A.2, VDF-B.4, and VDF-B.8 ....................................................................................................... 3-12
Figure 3-8. Effect of temperature on CO2/N2 selectivity in VDF-A.2, VDF-B.4, and VDF-B.8 ..................................................................................................................... 3-12
Figure 3-9. Effect of (a) NO and (b) NOx contaminants on CO2 permeance and CO2/N2 selectivity as a function of time in VDF-A.2 .............................................................. 3-13
Figure 3-10. Effect of SO2 on CO2 permeance and CO2/N2 selectivity in VDF-A.2 over time.. ........................................................................................................................... 3-14
Figure 3-11. (a) Effect of water vapor on CO2 permeance and CO2/N2 selectivity and (b) H2O vapor permeance and H2O/N2 selectivity as a function of time in VDF-A.2. ............................................................................................................................. 3-14
Figure 3-12. (a) Lab-scale hollow-fiber membrane module types used in CO2 separation performance testing and (b) individual Generon membrane hollow fibers. ............... 3-18
Figure 3-13. Temperature dependence of (a) CO2 permeance and (b) CO2/N2 and O2/N2 selectivities in the next-generation polycarbonate hollow-fiber membranes. ............ 3-19
Figure 3-14. Dependence of (a) N2 and CO2 permeances and (b) CO2/N2 selectivity in the next-generation, high-flux polycarbonate on operating stage-cut and feed CO2 concentration. ............................................................................................................. 3-20
Figure 3-15. (a) Effect of NO on CO2 permeance and CO2/N2 selectivity and (b) NO permeance and NO/N2 selectivity as a function of time in the next-generation, high-flux polycarbonate. ............................................................................................. 3-21

ix
Figure 3-16. (a) Effect of NO2 on CO2 permeance and CO2/N2 selectivity and (b) NO2 permeance and NO2/N2 selectivity as a function of time in the next-generation, high-flux polycarbonate. ............................................................................................. 3-22
Figure 3-17. Mixed-gas (a) SO2, CO2, and N2 permeances and (b) SO2/N2 and CO2/N2 selectivities in loop-cell polycarbonate membrane module as a function of feed pressure. ...................................................................................................................... 3-23
Figure 3-18. Stability checks of (a) N2 and CO2 permeances and (b) CO2/N2 selectivity in loop-cell polycarbonate membrane module as a function of time after periodic (recurring) multiple tests with binary mixture (15% CO2 in N2) and ternary mixture (290 ppm SO2, 15% CO2, and balance N2). .................................................. 3-23
Figure 3-19. Large prototype membrane module (6 in. × 36 in.; 2.200 ft2) produced from the next-generation, high-flux polycarbonate membrane hollow fibers. .......................... 3-24
Figure 3-20. Representative samples of VDF-A.2 dope solutions made with different NMP/TEG ratios (left to right): infinity, 2.5, 2.0, 1.7, 1.3, and 0.7 (no dissolution). ................................................................................................................ 3-25
Figure 3-21. SEM images of a bundle of VDF-A.2 hollow fibers spun in the first campaign: (a) side view and (b) cross-section of several fibers. .................................................. 3-26
Figure 3-22. SEM images of a single VDF-A.2 hollow fiber from the first spin-run campaign: (a) cross-sectional view and (b) magnified cross-section of fiber wall. ............................................................................................................................ 3-27
Figure 3-23. Sample VDF-A.2 dope solutions in 50/50 mixture of NMP and TEG with decreasing amounts of water as second nonsolvent (left to right): 20%, 10%, 4%, and 0.8% water. ................................................................................................... 3-28
Figure 3-24. Samples of the dry VDF-A.2 hollow fibers spun with 0.5 wt% water in the dope solution in the second campaign. Fiber dimensiona: 200 µm ID × 350 µm. .............. 3-28
Figure 3-25. SEM image of magnified fiber-wall cross-section of a single VDF-A.2 hollow fiber spun with 0.5 wt% water in the dope solution in the second campaign. ............ 3-29
Figure 3-26. Small lab-scale beaker modules of VDF-A.2 hollow fibers made for gas permeation testing. ...................................................................................................... 3-29
Figure 3-27. Single-stage membrane process modeled (1 = feed; 2 = residue; 3 = permeate). ......... 3-31
Figure 3-28. Required membrane area and achieved CO2 purity as a function of CO2 removal in a single-stage membrane operation. ......................................................... 3-31
Figure 3-29. Effect of transmembrane pressure difference on CO2 removal, permeate CO2 purity, and required membrane area. .......................................................................... 3-32
Figure 3-30. Effect of pressure ratio on CO2 removal, permeate CO2 purity, and required membrane area. ........................................................................................................... 3-33
Figure 3-31. Effect of CO2 permeance on CO2 removal, permeate CO2 purity, and required membrane area ............................................................................................................ 3-34
Figure 3-32. Effect of CO2/N2 selectivity on CO2 removal, permeate CO2 purity, and required membrane area.. ........................................................................................... 3-35
Figure 3-33. Effect of feed CO2 concentration on CO2 removal, permeate CO2 purity, and required membrane area.. ........................................................................................... 3-35

x
Figure 3-34. Flow scheme of basic two-stage membrane process modeled. ..................................... 3-37
Figure 3-35. Flow scheme of RTI three-stage capture membrane process modeled. ........................ 3-38
Figure 3-36. Normalized power-consumption distribution for the three-stage membrane CO2 capture process. .......................................................................................................... 3-45

ES-1
Executive Summary
Overall project objective was to develop an advanced, hollow-fiber, polymeric membrane process that could be cost-effectively retrofitted into current pulverized coal-fired power plants to capture at least 90% of the CO2 from plant flue gas with 95% captured CO2 purity. The approach for this project tackled the technology development on three different fronts in parallel: membrane materials R&D, hollow-fiber membrane module development, and process development and engineering. The project team consisted of RTI (prime) and two industrial partners, Arkema, Inc. and Generon IGS, Inc.
Two CO2-selective membrane polymer platforms were targeted for development in this project. For the near term, a next-generation, high-flux polycarbonate membrane platform was spun into hollow-fiber membranes that were fabricated into both lab-scale and larger prototype (~2,200 ft2) membrane modules. For the long term, a new fluoropolymer membrane platform based on poly(vinylidene fluoride) [PVDF] chemistry was developed using a copolymer approach as improved capture membrane materials with superior chemical resistance to flue-gas contaminants (moisture, SO2, NOx, etc.). Specific objectives were
Development of new, highly chemically resistant, fluorinated polymers as membrane materials with minimum selectivity of 30 for CO2 over N2 and CO2 permeance greater than 300 gas permeation units (GPU) targeted
Development of next-generation polycarbonate hollow-fiber membranes and membrane modules with higher CO2 permeance than current commercial polycarbonate membranes
Development and fabrication of membrane hollow fibers and modules from candidate polymers Development of a CO2 capture membrane process design and integration strategy suitable for
end-of-pipe, retrofit installation Techno-economic evaluation of the “best” integrated CO2 capture membrane process design
package
In this report, the results of the project research and development efforts are discussed and include the post-combustion capture properties of the two membrane material platforms and the hollow-fiber membrane modules developed from them and the multi-stage process design and analysis developed for 90% CO2 capture with 95% captured CO2 purity.
Two new vinylidene fluoride (VDF)-based copolymer families with excellent chemical resistance were developed with improved CO2 separation properties relative to the semi-crystalline, low-permeability base PVDF homopolymer. The VDF-co-A copolymer series incorporated a bulky, low-dipole Comonomer A into the main-chain backbone. This comonomer successfully disrupted chain packing density and crystallinity to increase gas diffusion in the polymer matrix but had minimal impact on CO2 solubility in the polymer. As a result, the VDF-co-A series was able to achieve up to 17-18 times higher CO2 permeability than the PVDF homopolymer without adversely impacting the base CO2/N2 selectivity of 24. For example, in terms of permeance for a 0.05-µm selective membrane layer, CO2 permeance of the VDF-A.2 composition was 110 GPU at 35 °C (compared to 10 GPU for PVDF) and rose to 470 GPU at 60 °C.
The VDF-co-B series copolymerized a bulky, high-dipole Comonomer B into the polymer backbone. Its bulkiness similarly helped to increase gas permeability in the polymer matrix. However, the greater polarity of this comonomer also enhanced CO2 affinity (solubility) of the matrix. As a result, the VDF-co-B family of materials was able to achieve 2.5-3 times higher CO2/N2 selectivity and 6 times

ES-2
higher CO2 permeability than the PVDF homopolymer. The VDF-co-B family generally possessed CO2/N2 selectivity in the range of 40-50. As an example, in terms of permeance for a 0.05-µm selective membrane layer, CO2 permeance of the VDF-B.8 composition was 62 GPU at 35 °C and increased to 380 GPU at 65 °C.
Project efforts to develop the first membrane hollow fibers from the new VDF-based material platform demonstrated that micron-sized hollow-fiber cores can be spun on commercial fiber-spinning equipment. The resulting fibers had good flux in the range of 200 GPU for CO2 but exhibited no gas selectivity. Electron micrographs showed a finely microporous VDF-based fiber morphology, indicating that much additional spin process optimization work would be needed to form the thin-skinned asymmetric membrane structure desirable for gas selectivity. To develop this desired membrane structure, any future work will need to address solvent extraction kinetics in the spin process.
The next-generation, high-flux polycarbonate material platform was successfully developed into membrane hollow fibers with up to 4 times higher CO2 permeance (410 GPU) than that of current-generation commercial polycarbonate membrane fibers. Though similar to that of the commercial membrane, the CO2/N2 selectivity of the high-flux fibers was only 60-70% of this material’s intrinsic selectivity of 35-37, indicating that further optimization of the fiber structure during the fiber-spinning process could still be done. The high-flux polycarbonate membrane displayed some sensitivity to flue-gas contaminants NOx and SO2, which led to a permeance decline but had minimal to no effect on CO2/N2 selectivity. Prototype membrane modules (6 in. × 36 in.; 2,200 ft2) of the high-flux fibers were also successfully produced on Generon’s commercial module manufacturing equipment.
A promising three-stage CO2 capture membrane process design was also developed to achieve 90% CO2 capture and 95% CO2 purity. The cost of CO2 capture was estimated to be ~$42/ton-CO2 with this RTI process. From a techno-economic analysis, the energy penalty of carbon capture remains the biggest contributor to the cost of electricity (COE) of a subcritical power plant with the RTI membrane capture process. The increase in COE with capture was estimated to be 73-82% over that of a plant with no capture and depended very strongly on the assumed compressor costs.
For an increasingly more cost-effective membrane-based CO2 capture process, future R&D technology efforts must continue to develop more robust, higher-performance membranes with permeance and selectivity properties best suited for the envisioned process design in conjunction with advanced module designs (to better handle the high flue-gas flows and minimize parasitic pressure-drop effects) and more out-of-the-box process design and integration strategies (to minimize the energy penalty of the capture process).

1-1
1. Introduction
As anthropogenic CO2 emissions continue to be scrutinized and climate-change regulations to reduce CO2 emissions seem imminent, the capture and storage of CO2 from the nation’s fleet of coal-fired power plants will play a vital role in the nation’s energy security and in meeting future CO2 emission targets. Although the contribution of renewable, low-CO2-emitting power generators such as natural gas, wind, solar, and biomass to the nation’s electrical power generation capacity is expected to increase in the future, coal (specifically, the existing fleet of coal-fired power plants) is expected to remain the largest contributor, projected to still account for approximately 39% of the nation’s total electrical power generation in 2035 [DOE/EIA, 2012]. Because the fleet of coal-fired power plants is of such importance to the nation’s energy production while also being the single largest emitter of CO2 (over 34% of nation’s total CO2 emissions in 2009 [DOE/EIA, 2011]), the development of retrofit, post-combustion CO2 capture technologies for existing and new, upcoming PC power plants will thus allow coal to remain a major component of the U.S. energy mix while mitigating global warming. Research and development of such retrofit CO2 capture technologies is sponsored and funded by the U.S. Department of Energy’s National Energy Technology Laboratory (DOE/NETL) under its Innovations for Existing Plants (IEP) Program.
Post-combustion carbon capture technologies are an attractive option for coal-fired power plants as they do not require modification of major power-plant infrastructures, such as fuel processing, boiler, and steam-turbine subsystems. They could thus be integrated downstream of existing flue-gas cleanup systems (e.g., the flue-gas desulfurization unit), simplifying the retrofit process compared to oxy-combustion and chemical looping combustion technologies, which require a more complete plant revamp.
However, post-combustion capture of CO2 is a very challenging application. In a typical 550-MWe pulverized coal (PC) power plant, the flue-gas volume to be processed is about 2 MM std. m3/hr (75 MM scfh) [DOE/EIA, 2009]. Processing this large flue-gas quantity to capture at least 90% of the CO2 is a challenge because the flue gas is at low pressure (~15 psia), low temperature (e.g., 50-60 °C), and low CO2 concentration (10-15 vol%), consequently providing very limited potential for CO2 separation. These flue-gas conditions require extremely large-scale systems to capture the CO2 into a sequestration-ready product at a delivery pressure of ~2,200 psig. Furthermore, with current state-of-the-art technologies, the parasitic load (energy penalty) associated with CO2 capture and compression is high, substantially increasing the cost of electricity (COE) for a PC plant with carbon capture relative to the base PC plant without capture. Presently, absorption-based amine scrubbing processes are the only technologies available at anything approaching the scale required for CO2 capture from power plants. From process cost calculations, however, the COE for a 550-MWe PC plant using the commercial Econamine absorption process for 90% CO2 capture would be 85.6% higher ($118.8/MWh) than that of the base plant [DOE/NETL, 2007].
Current post-combustion capture technologies being pursued are absorption using advanced, regenerable liquid solvents, adsorption on regenerable solid sorbents, and physical separation by nonporous membranes. For gas separation, membrane-based processes possess several key advantages. Membranes are simple to operate and maintain (i.e., no moving parts), compact for small footprint, and modular for easy installation into plant infrastructures. The modularity of the membrane separation devices also allow for easy scalability because the process can be adapted for different application sizes and different levels of CO2 removal desired by simply adding or subtracting the number of membrane modules used. Membrane processes are also inherently energy-efficient because the membrane enables passive separation of gases. Compared to regenerable, solid sorbent- and liquid solvent-based capture

1-2
methods, membrane processes are more attractive in that no parasitic adsorption or absorption energy losses due to heat required to regenerate and release CO2 from the spent sorbent or solvent are associated with their operation. Current industrial gas separation processes using membranes include air separation, hydrogen recovery from ammonia purge gas, air dehydration, and CO2 removal from natural gas.
Dense (nonporous) polymer membranes are used to separate gases on the basis of preferential permeation of gas molecules that are more soluble in the polymer, have a higher diffusion coefficient in the polymer, or both. Gas transport occurs as a result of a partial pressure driving force across the membrane. For the post-combustion capture application, this means that, regardless of the membrane employed, membrane processes are particularly limited by the feed CO2 composition and the transmembrane pressure ratio. That is, the available driving force for CO2 transport through the membrane is low because of both low flue-gas pressure and dilute CO2 concentration. However, to compress the large flue-gas flow entering the membrane to the high pressure for optimal separation would be impractical because the feed compressor power required would be a significant fraction of the plant’s power generation output. Multi-stage membrane processes would therefore be necessary to achieve the desired CO2 recovery and purity in a more energy-efficient way. The membrane process could consist of two or three membrane stages or membrane steps as well as recycle loops to obtain the desired CO2 removal from the feed and/or to enrich the captured CO2 stream to the desired purity. Optimization of a membrane-based CO2 capture process would thus involve balancing total membrane area and auxiliary equipment (blowers, compressors, etc.) needs to minimize power requirements and capital and operating costs.
Commercially available membranes for gas separation are based on polymeric materials and are typically operated at near-ambient temperatures. The majority of commercial membrane polymers (Table 1-1) possess CO2/N2 selectivity in the range of 20–30 and fairly low pressure-normalized CO2 flux usually in the range of 60-100 GPU [GPU = gas permeation unit; 1 GPU = 1 × 10⁻⁶ cm3(STP)/(cm2·s·cmHg)]. Although high flux is seen with the silicone rubber membrane, its CO2/N2 selectivity is unfortunately too low for a viable post-combustion capture process. While further improvement in selectivity is desirable for higher product CO2 purity, it would be difficult to fully realize the benefits of very high membrane selectivity without adequate CO2 partial pressure driving force across the membrane. It would hence be beneficial to improve CO2 permeability (flux) more than selectivity in next-generation capture membranes. Higher fluxes would reduce the membrane area required to process the large flue-gas volume, decreasing the membrane system cost. Simultaneously increasing both membrane flux and selectivity would offer the best of both worlds. This tends to be difficult, though, because membranes that are more permeable typically tend to be less selective, a well-known tradeoff phenomenon for gas-separation membranes [Robeson, 1994].
This project was initiated to develop an advanced, hollow-fiber, polymeric membrane process that could be cost-effectively retrofitted into current PC-fired power plants to capture at least 90% of the CO2 from plant flue gas. It focused on development of new, high-performance polymer membrane materials, improved membrane hollow fibers and module design, and process development. In this report, the results
Table 1-1. CO2 and N2 Permeation Properties of Commercial Membrane Polymers [Nunes, 2001]
Polymer CO2 fluxa (GPU) CO2/N2 selectivity
Polyimide Polysulfone Cellulose acetate Silicone rubber Brominated polycarbonate Generon polycarbonateb
110 56 63
27,000 42 70
34 22 29 11 23 35
1 GPU = 1 × 10⁻⁶ cm3(STP)/(cm2·s·cmHg) a Permeances based on permeability values given in indicated reference and on 0.1-µm membrane
selective layer thickness. b Provided by membrane manufacturer Generon.

1-3
of the project research and development efforts are discussed and include the post-combustion capture properties of two membrane material platforms and the hollow-fiber membrane modules developed from them and the multi-stage process design and analysis developed for 90% CO2 capture with 95% captured CO2 purity.
1.1 Approach and Project Objectives The approach for this project tackled the technology development on three different fronts that are
interrelated to each other and, as such, provided guidance to the others: membrane materials R&D, hollow-fiber membrane module development, and process engineering (Figure 1-1). This approach allowed RTI and the project’s two industrial partners, Arkema, Inc. and Generon IGS, Inc., to focus their respective strengths and capabilities on the flue-gas CO2 capture problem while working in parallel on these fronts.
Figure 1-1. Project technical approach used.
On the first front, two membrane polymer platforms for post-combustion carbon capture were developed and tested for their intrinsic CO2/N2 separation properties. As a near-term membrane platform solution, a next-generation material based on project partner Generon’s commercial standard polycarbonate membrane for air separation was evaluated for its capture properties and flue-gas contaminant resistance. From previous internal work, Generon had identified this next-generation polycarbonate as a good capture material candidate because it had an intrinsic CO2 permeability about 4-7 times higher than that of existing commercial gas-separation membranes, while having CO2/N2 selectivity modestly higher than or at least comparable to that of current industrial membranes. For a long-term membrane platform solution, new fluoropolymers based on poly(vinylidene fluoride) [PVDF] chemistry were developed as improved capture membrane materials with superior chemical resistance to flue-gas contaminants (moisture, SO2, NOx, etc.). To improve the CO2 permeability and selectivity of the base PVDF, the vinylidene fluoride [VDF]-based polymer development leveraged Arkema’s polymer synthesis, design, and engineering expertise in the areas of fluoropolymers and block copolymers.
On the second front, the two membrane material platforms in the project were developed into membrane hollow fibers and fabricated into compact, high surface area-to-volume separation module devices that were evaluated for their CO2 capture performance. Part of this effort also involved improving hollow-fiber membrane module design and components (e.g., epoxy tubesheet, seals, module housing) for post-combustion CO2 capture. For this effort, Generon’s knowledge and experience in the design,

1-4
engineering, and manufacture of polymeric hollow-fiber membrane modules for air separation was leveraged.
The process design and development effort leveraged RTI’s process engineering, simulation, and integration expertise to develop a CO2 capture membrane process configuration suitable for end-of-pipe installation in PC power plants. It included process optimization and techno-economic evaluation of the optimized process. The process development was performed using AspenPlus® software that was customized and enhanced by RTI with an integrated simulation module for membrane separation processes and guided by the gas separation performance test results obtained on the new VDF-based membrane polymers and the next-generation polycarbonate hollow-fiber membranes and modules. The most promising membrane process design strategy identified was, in turn, used to guide the membrane material development efforts.
1.2 Project Objectives Overall project objective was to develop an advanced, hollow-fiber, polymeric membrane process
that could be cost-effectively retrofitted into current PC-fired power plants to capture at least 90% of the CO2 from plant flue gas with 95% captured CO2 purity with an increase in cost of electricity (COE) of 35% or less. Specific objectives were
Development of new, highly chemically resistant, fluorinated polymers as membrane materials with minimum selectivity of 30 for CO2 over N2 and CO2 permeance greater than 300 gas permeation units (GPU) targeted
Development of next-generation polycarbonate hollow-fiber membranes and membrane modules with higher CO2 permeance than current commercial polycarbonate membranes
Development and fabrication of membrane hollow fibers and modules from candidate polymers Development of a CO2 capture membrane process design and integration strategy suitable for
end-of-pipe, retrofit installation Techno-economic evaluation of the “best” integrated CO2 capture membrane process design
package

2-1
2. Experimental Methods
2.1 Novel Fluoropolymer Synthesis and Characterization To synthesize the new PVDF-based copolymers and terpolymers as well as the base homopolymer, a
laboratory-scale reactor system was constructed. The system consisted of a high-pressure, 2-liter stainless steel reactor rated for operation up to 1,000 psi. It was equipped with multiple feeding systems so that four ingredients could be delivered independently to allow the preparation of new polymer compositions from different comonomers. The reactor’s monomer delivery system could accurately feed monomers from 0.1 to 10 ml/min during a synthesis run. The reactor system allowed high-pressure emulsion polymerization reactions to be carried out in semicontinuous mode, modeling commercial manufacture processes. The yield from each polymerization run on this reactor system was several hundred grams of polymer resin for testing and evaluation.
The reactor’s capability to produce polymer resins with controlled viscosities was validated by synthesizing a series of PVDF homopolymers of different molecular weights. The resulting homopolymer samples were characterized with respect to primary particle size, viscosity, and process stability. During this system validation step, the Standard Operation Procedure (SOP) for a safe synthesis process was also developed because the probability of having runaway reactions is substantially high with fluorinated monomer reactants.
New VDF-based copolymers and terpolymers were prepared by copolymerizing the VDF monomer with selected fluorinated comonomers having different bulky side groups and different dipole moments. Such bulky fluorinated comonomers were incorporated into the PVDF polymer backbone to significantly disrupt the chain packing density and crystallinity and increase gas permeability of the new co- and terpolymers relative to that in the base homopolymer. Using comonomers of different dipole moments allowed tuning of the CO2 affinity (solubility) in these new polymers to further increase their CO2/N2 selectivity over that of the homopolymer. The overall comonomer content investigated varied from 0 to 50 wt%. The morphology, crystalline/amorphous content, and, ultimately, the gas transport properties of the resulting new VDF-based polymers were determined by the comonomer content and its sequence distribution in the polymer chain. Example comonomers compatible with VDF include tetrafluoroethylene (CF2=CF2), hexafluoropropylene [CF2=CF(CF3)], chlorotrifluoropropylene (CF2=CFCl), trifluoropropylene [CH2=CH(CF3)], and tetrafluoropropylene [CH2=CF(CF3)]. Non-fluorinated comonomers such as acrylic acid and its esters, amines, and polyether glycol can also be copolymerized with VDF.
The new fluorinated polymers were characterized using different analytical methods to establish relationships between polymerization reaction conditions and their structural and thermal properties. The comonomer content in the copolymers was determined by 19F NMR. Polymer molecular weights (weight-average Mw and number-average Mn) and molecular weight distribution (MWD) were determined using high-temperature size exclusion chromatography (SEC) in dimethyl sulfoxide (DMSO). The MWD was characterized by the polydispersity index, which is defined as Mw/Mn. Melt viscosity measurements were made on the polymers according to ASTM D3835 by using capillary rheometry at 232 °C and shear rate of 100 s-1. Because SEC proved to be very time-consuming and Arkema found that a very good correlation between molecular weight and viscosity existed, the melt viscosity was also used as a molecular-weight indicator for some samples. Particle size distribution of the corresponding polymer latexes was determined with dynamic light scattering to investigate the effect of polymerization conditions on particle number formation in the latex, which, in turn, could be related to latex stability or

2-2
processability. Melting-point temperature (Tm) and specific heat of fusion (ΔH) of the fluorinated polymers were measured using differential scanning calorimetry (DSC) in accordance with ASTM D3418. The weight fraction of crystallinity ( ) of the new polymers was then estimated as
∆H/∆H°
where ∆H° is the heat of fusion for pure PVDF crystals. One reported value for 100% crystalline PVDF is 105 J/g [Peng, 2009].
2.2 Membrane Preparation 2.2.1 Membrane Films
To determine their intrinsic CO2/N2 separation properties, free-standing, isotropic membrane films of the polymers developed in this project were prepared by solution-casting. For the VDF-based polymers, solutions with polymer concentrations ranging from 7 to 19 wt% were made in five different solvents (acetone, tetrahydrofuran, methyl ethyl ketone, N,N-dimethylacetamide, and 1-methyl-2-pyrrolidone [NMP]). These polymer solutions were knife-cast onto glass plates with and without an aluminum-foil-covered surface by using different knife-gap clearances. The cast films were then dried for 10 min in an oven at 185 °C. After cooling to room temperature, the formed films were submerged in deionized water to remove them from the casting surfaces and left to dry overnight at ambient conditions. The best, free-standing VDF-based membrane films were obtained from the castings made on the aluminum surface. The films were clear, flexible, and uniform in film thickness, varying from 9 to 15 µm depending on the solution concentration and casting-knife gap used.
Similarly, films of the next-generation polycarbonate were knife-cast from a 10 wt% solution in methylene chloride and dried at 90 °C under vacuum for 72 hours to remove residual solvent. The resulting dry films were easily lifted from the glass surface and had a film thickness of 12-14 µm.
2.2.2 Hollow-Fiber Membranes and Modules Project partner Generon develops and manufactures hollow-fiber membranes by the spinneret
extrusion route. This approach requires the membrane polymer to be solvent-soluble and the development of polymer/solvent systems suitable as spin-dope solutions for spinning into hollow fibers. Optimal dope solutions are close to phase separation, a state that is achieved by a mixture of polymer, solvents, and nonsolvents. The “solvent” system thus comprises two components, one which is a solvent for the polymer and the other a non-solvent. Such a “solvent” mixture allows the polymer to be dissolved in a single phase during the extrusion step but, upon a thermal or compositional change, be quickly precipitated out of solution to generate the desired integrally skinned asymmetric membrane structure. Made from a single membrane material, this membrane structure consists of a dense (nonporous) surface skin layer formed on top of a much thicker, microporous support substructure. The skin layer is ultrathin (<<1.0 µm) and performs the selective separation of gas species. The highly permeable porous substructure acts only to provide mechanical strength to the membrane.
Solubility Studies. Before any fiber-spinning runs were begun, laboratory solubility studies were first conducted on the next-generation polycarbonate and VDF-based polymers to determine the polymer/solvent systems suitable as spin-dope solutions for spinning into hollow fibers. The next-generation polycarbonate was found to be soluble in methylene chloride, tetrahydrofuran, and NMP up to high polymer concentrations and insoluble in water, alcohols, glycols, and straight-chain hydrocarbons. Viscosities of the resulting dope solutions were measured on a Brookfield viscometer and found to be similar to those used in Generon’s commercial hollow-fiber membrane spin line. The molecular-weight stability of the new polycarbonate in various spin dopes was also verified at this point to avoid potential problems in the fiber spinning process. Additionally, mechanical properties of the new polycarbonate

2-3
were evaluated and found to be acceptable, though the new material was not as ductile as Generon’s baseline (standard) polycarbonate material.
For the fluorinated VDF-based polymers, their greater chemical resistance limits the available industrial solvents in which these materials dissolve. In the laboratory solubility studies, the VDF-based polymers dissolved in strong aprotic solvents such as dimethyacetamide, dimethylformamide, and NMP. Because Generon can use NMP in their fiber extrusion process train and have the required permits to safely handle this solvent at their manufacturing facility, dipolar NMP was selected as the solvent at this development stage. The VDF-based spin-dope solutions in NMP displayed no viscosity changes over time, indicating stability of these solutions and, hence, of polymer molecular weight in the spin dopes. Viscosities of these spin dopes were also satisfactory for fiber spinning relative to that of solutions used typically to make Generon’s commercial hollow-fiber membranes. Many nonsolvent choices existed, including water and glycols. Commonly, a member of the glycol family is used as nonsolvent because solubility characteristics are easily tailored through suitable selection of glycol molecular weight. For the VDF-based spin dopes, triethylene glycol (TEG) was found to be a good nonsolvent choice.
Fiber Spinning. Membrane hollow fiber development work was done on Generon’s bench-scale research fiber-spinline equipment (Figure 2-1). Spin-dope solutions were prepared in this equipment by continuous compounding of all components in the front-end twin screw extruder, which is designed for compounding up to 40 lbs/h of polymer blends. This extrusion step was then followed by various draw zone equipment, extraction baths, and drying operations that help to develop the membrane properties (i.e., structure and separation) of the hollow fibers and fix the resultant fibers into bundles for module device fabrication. Fiber membrane properties were tailored by adjusting the operating temperature, pressure, and residence time in each of these spin process steps.
Figure 2-1. Research fiber spinline equipment for hollow-fiber membrane development.
Based on the results of the polymer solubility studies, preliminary spinline runs were first performed to confirm whether target polymer dope solution compositions could be obtained from the the spinline’s extruder and to determine if hollow fibers could be formed from these dopes. First, extruder conditions were identified for continuously forwarding and compounding the polymer and the selected solvent and nonsolvent liquids into an acceptable spin dope over a range of polymer and liquid concentrations. Extruder conditions included pump flow rates, extruder temperature, and extrusion-die pressure. Next, the working spin-dope formulation range for making stable, separable hollow fibers were identified by test-spinning dopes of different polymer concentrations and solvent/nonsolvent ratios. In addition to adjusting spin-dope compositions, other spin process conditions such as draw speed, quench bath type and temperature, and extraction bath type and temperature were also determined. These preliminary spin

2-4
runs showed that acceptable hollow-fiber cores could be spun from a polymer concentration range of 25-50 wt% for the next-generation polycarbonate and 47-60 wt% for the VDF-based polymers.
Fiber Tubesheeting/Bundling. The membrane hollow fibers produced were then packaged as a bundle into a useful separation module device, which typically has a shell-and-tube design such as that shown in Figure 2-2. Possible flow schemes for this module type are bore-side feed and shell-side permeate (as depicted in Figure 2-2) or vice versa. Bundles up to 10 inches in diameter could be processed in Generon’s fabrication processes.
Figure 2-2. Typical design of Generon hollow-fiber membrane module.
The membrane fibers were potted as a bundle into the module housing (i.e., pressure vessel) by forming epoxy tubesheets on Generon’s production equipment. Generon’s standard potting process was first evaluated for its compatibility with the next-generation polycarbonate and VDF-based membrane fibers and its ability to form a gas-tight seal with them. If necessary, the tubesheet resin was modified with respect to material type and potting cure times and temperatures to improve compatibility with the new fibers. The tubesheets are a critical module component as they form a gas-tight seal around the membrane fibers to separate the permeate product from the feed and residue (non-permeate) streams. Good adhesion must therefore exist between the tubesheet material and membrane fiber surfaces.
Laboratory-scale hollow-fiber modules for separation performance evaluations were then assembled from the potted bundles of next-generation polycarbonate and VDF-based membrane fibers. Most were beaker and “loop-cell” modules with membrane area less than 100 ft2 (9.3 m2). For the polycarbonate platform, a couple of standard-area (100-ft2) modules and several prototype modules with membrane area of 2,000-2,200 ft2 were also made successfully.
2.3 Permeation Testing The flue-gas CO2 separation properties of membrane films and modules in this project were measured
using a continuous-flow, constant-pressure/variable-volume method that was modified to also allow use of a downstream sweep gas. The gas permeation apparatus used is shown in Figure 2-3. It was contained in a thermoregulated enclosure (e.g., oven) for temperature control. Mass flow controllers regulated the flow of feed and sweep gases to the membrane cell or module. A metering valve controlled the upstream (feed) pressure to the desired value. The downstream (permeate) pressure was maintained at atmospheric (0 psig) in all tests. Permeate flow rates were measured indirectly using a low-pressure, inert sweep gas of helium (30-50 cm3/min) for free-standing membrane films and directly with bubble flowmeters for membrane modules. Online analysis of feed, residue, and permeate stream compositions was done by using an Agilent 3000A Micro Gas Chromatograph (GC) equipped with four independent micro GC columns and four thermal conductivity detectors that can be used to simultaneously analyze composition
End Plate
Epoxy Tube Sheet
Support Core
Feed Air O-Rings
Hollow Fibers
Oxygen-Enriched Air
Epoxy TubeSheet
EnrichedNitrogenProduct
Gas
End Plate
Epoxy Tube Sheet
Support Core
Feed Air O-Rings
Hollow Fibers
Oxygen-Enriched Air
Epoxy TubeSheet
EnrichedNitrogenProduct
Gas

2-5
of an injected gas sample. Calibration of GC detector responses was performed and rechecked daily by analyzing certified standards containing the gas components of interest.
Pressureregulator
GC
Membranecell
Feed
Permeate
To vent
Residue
Sweep
Meteringvalve
MFC
MFC
Pressure gauge
Temperature control
Figure 2-3. Schematic of RTI gas permeation test system with online GC analysis.
Before each permeation run was started, the upstream and downstream sides of the membrane cell or module are purged for several minutes with feed gas. Every time the feed gas was changed, the membrane cell or module as well as the test system was repurged with the new feed. This purging step ensured that any residual gas remaining from previous experiments were removed from system lines and did not interfere with the permeation of new test gases.
After purging, the membrane film or module was exposed to a pressurized feed gas flow. In the case of mixed-gas experiments, the membrane split the feed stream into a permeate stream enriched in the preferentially permeated species (e.g., CO2) and a residue stream depleted of this species. In single-gas tests, no residue flow is generated. For membrane films, volumetric permeate flow rates were measured indirectly using a low-pressure, inert sweep gas of helium (30-50 cm3/min) and sending the steady-state permeate stream of sweep and permeate gases exiting the membrane test cell to the online GC for compositional analysis. The gas permeability (or flux) of the film was then calculated from the known permeate component mole fractions and sweep gas flow rate. For the larger-area membrane modules, steady-state permeate flow rates were measured directly by soap-film bubble flowmeter and converted to gas permeability (or flux). The gas permeability is an intrinsic material property with units of barrers, where 1 barrer = 10-10 cm3(STP)·cm/(cm2·s·cmHg). Gas flux or permeance is a membrane performance property dependent on membrane thickness and given in terms of Gas Permeation Units [GPU], where 1 GPU = 10-6 cm3(STP)/(cm2·s·cmHg). Membrane selectivity was calculated as the ratio of gas permeabilities (fluxes).
Membranes were first tested at 23 °C and 50 psig feed pressure with pure N2, O2, and CO2. If their properties at these baseline conditions indicated that they were defect-free, the membranes were evaluated as a function of feed pressure (up to 200 psig for some samples) and temperature (typically up to 60 °C) as appropriate with pure N2, O2, and CO2 and a simulated binary combustion flue-gas mixture of 15% CO2 in N2. For the next-generation polycarbonate membrane, the effect of CO2 concentration on its mixed-gas separation properties was also examined by testing it with additional binary mixtures of 30 and 70% CO2 in N2. The permeation properties of the next-generation polycarbonate were also determined by Generon at lower temperatures (0 and 10 °C). Furthermore, the effect of the key flue-gas contaminants on separation properties was investigated by testing the membranes with a 15% CO2 in N2 mixture blended with one contaminant that was 290 ppm SO2, 255 ppm NO, 30 ppm NO2, or 0.9% water vapor. These contaminant tests were also conducted over an extended time period of ~6 days to determine membrane performance stability in the presence of flue-gas contaminants. Throughout all mixed-gas studies,

2-6
intermediate pure-gas permeation checks were performed to monitor module integrity and stability. All gases used were supplied by National Specialty Gases (Durham, NC).
2.4 Process Modeling and Design Process modeling, design, and development were performed using AspenPlus® software that was
enhanced by RTI with an integrated simulation module for membrane separation processes. The RTI membrane simulator tool had been developed previously as an effort under the DOE/NETL project “Novel Technologies for Gaseous Contaminants Control” (Cooperative Agreement No. DE-AC26-99FT40675). The tool models multicomponent gas separation processes using one or more hollow-fiber membrane modules either connected in parallel or series. The user could select different configurations for feed location (bore or shell) and flow contacting (countercurrent or cocurrent) and add an optional permeate sweep and/or recycle stream to the membrane operation. The effects of membrane module design parameters [fiber diameter, fiber count, fiber bundle diameter (packing density), and module and tubesheet lengths] on separation performance could also be determined with this tool. For a given set of user-defined membrane properties (flux, selectivity), the RTI tool thus permits rapid analysis of operating conditions on membrane gas-separation performance. Through seamless integration with AspenPlus and its database libraries, it also facilitates the modeling and optimization of complex process schemes using membrane unit operations. This RTI tool integration was very useful in the development of the detailed RTI carbon capture membrane process design because membrane simulations could be done simultaneously with other essential unit operations (compressors, heat exchangers, turboexpanders, etc.) in AspenPlus.
Additionally, process development was guided by the gas separation performance test results obtained on the new VDF-based membrane polymers and the next-generation polycarbonate hollow-fiber membranes and modules. The most promising membrane process design strategy identified was, in turn, used to guide the membrane material development efforts.
Process techno-economic analysis was completed using heat and mass balances (HMBs) generated with AspenPlus simulations, equipment sizing based on these HMBs, and equipment costs estimated with the in-plant cost estimator tool Aspen Icarus.

3-1
3. Results and Discussion
3.1 Novel Fluoropolymer Membranes The pure PVDF homopolymer in Figure 3-1 has achieved a high level of usage in the recent years due
to its excellent resistance to chemical attacks, weathering elements, and oxidants, as well as its special properties such as ease of processability and flexibility. PVDF is a linear, partially fluorinated polymer containing 59.4 wt% fluorine and 3 wt% hydrogen. PVDF is commercially produced via free-radical polymerization either with emulsion or suspension processes. Emulsion process is more versatile and allows tailoring of the homopolymer chemistry through incorporation of comonomers over a wide range of loading levels.
Figure 3-1. Chemical structure of base PVDF homopolymer.
PVDF displays a unique polarity and strong polymer–polymer interactions because the spatial arrangement of the alternating CH2 and CF2 groups along its polymer backbone creates a high dipole moment. PVDF exhibits an unusual compatibility with other polymers having strong polar groups or carbonyl groups such as acrylics. As a result of the high dipole (i.e., polarity) of the VDF repeat unit, PVDF is CO2-philic and, for that reason, it can be readily polymerized in super- and sub-critical CO2 as polymerization media [DeSimone et al., 2001; Lee et al., 2006]. Gas transport studies in PVDF films have found that CO2 solubility in PVDF is an order of magnitude higher than N2. This high solubility was attributed to the specific interaction between CO2 and the VDF monomer units [El Hibri and Paul, 1986].
The PVDF homopolymer also has a high level of intrinsic crystallinity, typically near 60%, that provides this material with stiffness and toughness. This crystalline phase has very low permeability to CO2 and other gases. First, the CO2 molecules must diffuse in a tortuous path around the crystallites, which are impermeable obstacles to gas permeation. Second, the crystallites act as physical cross-linking nodes that severely restrict swelling of the polymer by CO2. However, by incorporating selected fluorinated comonomers during PVDF polymerization, the packing of PVDF polymer chains could be disrupted, thereby reducing polymer crystallinity and significantly enhancing its flexibility and permeability to gases [Humphrey and Amin-Sanayei, 2002].
3.1.1 Homogeneous VDF-Based Copolymers Synthesized Three new series of VDF-based copolymers were synthesized successfully in the high-pressure
emulsion polymerization reactor system described in Section 2.1. These copolymer series were identified as “VDF-co-A”,”VDF-co-B”, and “VDF-co-C” according to the type of comonomer (A, B, or C) incorporated into the PVDF main-chain backbone. A unique feed scheme was used in the reactor system
CC
H H
F F
CC
H H
F F
CC
H H
F F
CC
H H
F F
CC
H H
F F

3-2
to compensate for the reactivity ratio of the VDF and the various comonomers. Special care was used to produce copolymers having the most homogeneous chemical composition. That is, compositionally uniform statistical copolymers of VDF and the comonomer were synthesized such that the comonomer mole fraction was almost the same for all polymer chains. In theory, a statistical copolymer has thermodynamically the lowest crystallite thickness and, hence, the lowest melting temperature, making such copolymers desirable for forming membrane materials with improved gas permeability for the intended membrane application.
Furthermore, because totally amorphous (noncrystalline) polymers are typically elastomeric polymers with poor mechanical properties, the microstructure chain plus sequence distribution of monomers between the chains was carefully controlled in making the VDF copolymers. In other words, not only was the overall copolymer composition important in determining gas permeability, but the chemical composition distribution (CCD) of comonomers was also very critical in providing the balance between CO2 permeability enhancement and the physical/mechanical properties necessary for a practical (useful) polymer membrane material. Thus, VDF copolymers were synthesized with different CCDs but the same overall chemical composition to yield materials with not only the desired low crystallinity but also sufficient molecular weight for good mechanical properties.
VDF-co-A Series. The VDF-co-A series was prepared with Comonomer A, a low-dipole, perfluorinated comonomer possessing a very bulky pendant –CF3 group to hinder ordering of the PVDF crystalline phase. The copolymer compositions made in this series encompassed a broad Comonomer A concentration range of 6.3-34 wt%. Table 3-1 shows the six VDF-co-A copolymers made and their material properties, including viscosity, molecular weight, and crystallinity. Their weight-average molecular weight (Mw) values ranged from 259,000 to 418,000 g/mol. Polydispersity index values (Mw/Mn) fell within a narrow range of 2.7-3.0.
As shown in Table 3-1, the melting-point temperature Tm and crystallinity of the VDF-co-A copolymers decrease with increasing Comonomer A concentration. The graph in Figure 3-2(a) indicates that copolymer Tm decreased linearly with increasing comonomer content, falling from 151 °C for 6.3% Comonomer A to 83 °C for 34% Comonomer A. To the best of our knowledge, these Tm values are the lowest reported for VDF-co-A copolymers at the given compositions, indicating the thorough statistical nature of these materials. Figure 3-2(b) illustrates that crystallinity in the VDF-co-A statistical copolymer family approaches zero (i.e., becomes wholly amorphous) at ~35% Comonomer A content. To date, the lowest crystallinity of the VDF-co-A copolymers synthesized was 2.4%. This is a 96% reduction in the crystallinity of the base PVDF homopolymer, validating the original hypothesis that addition of more Comonomer A leads to a more amorphous (less crystalline) polymer.

3-3
Table 3-1. Material Properties of Novel VDF-Based Copolymers Synthesized
Polymer Comonomer
content (wt%) Melt viscosity
(Pa·s) Mw
(g/mol) Mw/Mn
Peak Tm (°C)
Crystallinity (wt%)
PVDF homopolymer 0 2,515-3,632 474,000 3.1 166.1 54.4
Comonomer A series
VDF-A.5 6.3 2,254 361,000 2.9 150.6 37.5 VDF-A.1 11.5 1,546 — — 143.1 34.5 VDF-A.6 14.7 2,509 418,000 3.0 129.0 30.0 VDF-A.4 22.3 2,225 356,000 2.8 104.5 16.1 VDF-A.2 24.4 1,710 — — 97.3 17.3 VDF-A.3 34.3 1,522 259,000 2.7 83.4 2.4
Comonomer B series
VDF-B.5 5.5 2,728 544,000 3.0 147.5 38.6 VDF-B.2 8.7 2,098 393,000 4.0 144.1 35.6 VDF-B.6 11.6 2,689 524,000 3.0 128.6 32.6 VDF-B.7 14.9 2,336 476,000 3.0 155.5 27.1 VDF-B.3 18.3 1,400 353,000 5.2 128.1 26.0 VDF-B.8 21.4 2,367 510,000 2.8 147.0 22.0 VDF-B.9 25.7 2,015 456,000 3.3 142.8 14.3 VDF-B.1 27.0 375 — — 113.8 12.2 VDF-B.4 29.1 1,369 472,000 6.4 104.8 8.2
Comonomer C series
VDF-C.1 18 — — — 110 —
Mw/Mn = Polydispersity index
Figure 3-2. Dependence of (a) polymer melting temperature Tm and (b) polymer crystallinity on
comonomer concentration for new VDF-co-A series of copolymers.
20
60
100
140
180
220
0 10 20 30 40
Mel
tin
g t
emp
erat
ure
Tm
(°C
)
Comonomer A content (wt%)
VDF-co-A series copolymers
PVDF homopolymer
(a)
0
10
20
30
40
50
60
70
0 10 20 30 40
Cry
stal
linit
y (
wt%
)
Comonomer A content (wt%)
VDF-co-A series copolymers
PVDF homopolymer
(b)

3-4
VDF-co-B Series. Table 3-1 also shows the nine VDF-co-B copolymer compositions that were synthesized with Comonomer B. Like Comonomer A, Comonomer B has the same bulky –CF3 side group. However, because it is only partially fluorinated, Comonomer B possesses a much higher dipole moment. This higher-dipole (more polar) comonomer should help to further increase CO2 solubility in the polymer matrix and, thereby, raise the intrinsic CO2/N2 selectivity.
As presented in Table 3-1, the copolymer compositions in the VDF-co-B series varied over a Comonomer B concentration range of 5.5-29 wt%. Their Mw molecular weight values ranged from 353,000 to 544,000 g/mol, and their polydispersity index values (Mw/Mn) displayed greater variation from about 3.0 up to 6.4. The first copolymer VDF-B.1 prepared in this copolymer family had 27 wt% comonomer, melt viscosity of 375 Pa·s, and ~12% crystallinity. In particular, the melt viscosity of the VDF-B.1 resin was ~75-85% lower than that obtained for the VDF-co-A materials, indicating that polymer chains in VDF-B.1 were shorter (or lower-molecular-weight). Though it was possible to form free-standing, dense membrane films from the lower-viscosity VDF-B.1 resin, these films may not be as durable as VDF-co-A membrane films because shorter polymer chains typically suggest less chain entanglement and, in turn, weaker mechanical properties. To improve the resin properties and achieve a more robust copolymerization, the VDF-co-B synthesis procedure was refined by our partner Arkema. This optimization yielded resins VDF-B.2 through VDF-B.9, which possessed much higher melt viscosities and, hence, higher molecular weights (i.e., longer polymer chains). The quality of the VDF-B.5 through VDF-B.9 resins were particularly good, as evidenced by their much narrower molecular-weight distributions (Mw/Mn).
The Tm of the VDF-co-B family exhibited a linear dependence on comonomer concentration [Figure 3-3(a)], similar to that for VDF-co-A materials, but more scatter in the data was seen. The Tm decreased from 147.5 °C for VDF-B.5 with 5.5% Comonomer B to 104.8 °C for VDF-B.4 with 29% comonomer. Relative to the VDF-co-A family at similar molar compositions, the VDF-co-B series showed much higher Tm values, indicating that VDF-co-B has greater ease of handling and higher use temperatures. Figure 3-3(b) shows that the VDF-co-B crystallinity decreased with increasing comonomer content. However, the degree of crystallinity reduction achieved with Comonomer B appeared to be somewhat less than that obtained with Comonomer A. This behavior was attributed most likely to the more polar nature of Comonomer B, which, in turn, tended to favor alignment of polymer chains into ordered regions (crystalline phases).
Figure 3-3. Effect of comonomer concentration on (a) polymer melting temperature Tm and (b)
polymer crystallinity for new VDF-co-B series of copolymers.
20
60
100
140
180
220
0 10 20 30 40
Mel
tin
g t
emp
erat
ure
Tm
(°C
)
Comonomer B content (wt%)
VDF-co-B series copolymers
PVDF homopolymer
(a)
0
10
20
30
40
50
60
70
0 10 20 30 40
Cry
stal
linit
y (
wt%
)
Comonomer B content (wt%)
VDF-co-B series copolymers
PVDF homopolymer
(b)

3-5
VDF-co-C Series. To better understand how Comonomers A and B were influencing copolymer permeation properties and, more specifically, how comonomer polarity were affecting copolymer microstructure and gas separation properties, a VDF-C.1 copolymer with comonomer content similar to that of VDF-A.2 was made with Comonomer C. The C comonomer is perfluorinated and has a dipole moment similar to that of Comonomer A but much lower than Comonomer B’s dipole. Additionally, the C comonomer is much less bulky than Comonomers A and B because Comonomer C has no side group. The Tm of the VDF-C.1 resin was measured to be ~110 °C (Table 3-1).
3.1.2 VDF-Based Materials Made by Other Synthetic Methods In addition to homogeneous comonomer incorporation into the base PVDF homopolymer, other
synthetic routes were investigated for improving selectivity, permeance (permeability), and/or ease of handling of VDF-based polymers.
Heterogeneous comonomer incorporation was used to prepare a single VDF-B.11 copolymer having only 5.9 wt% Comonomer B. The resulting copolymer resin had VDF-rich and B-rich phases heterogeneously distributed in it. The hypothesis behind this heterogeneous approach was that the base matrix’s gas permeability and selectivity could be improved by adding small amounts of B-rich phases into the base PVDF homopolymer matrix. In particular, by spiking the base matrix with islands rich in CO2-philic Comonomer B, the effect of higher temperature on selectivity loss would be minimized while simultaneously benefiting from the increased gas permeance at elevated temperature.
The preparation of VDF-based materials combining both A and B comonomers into the base VDF matrix was another synthetic strategy explored for simultaneously enhancing both permeability and selectivity because, as discussed later in Section 3.1.3, VDF-based polymers made with Comonomer A displayed higher permeability and those made with Comonomer B had better selectivity. One way to achieve this combination was physical blending, for example, of VDF-A.2 and VDF-B copolymers to form composite blend materials. Four composite blends of VDF-A.2 and VDF-B copolymers with a 50/50 weight ratio were prepared by physical blending. With the overall A content kept the same at 12 wt% A, the overall B content differed in these four blend compositions (VDF-AB.1, VDF-AB.2, VDF-AB.3 and VDF-AB.4), varying over the range of 6-20 wt% B. Additionally, a physical composite blend membrane film (VDF-B.10) of 20 wt% PVDF homopolymer and 80 wt% of a VDF-co-B resin with 29 wt% comonomer content was prepared. The objective of the VDF-B.10 blending was to reinforce the handling characteristics of very soft, high-comonomer-content VDF-based resins with the more rigid, stronger base homopolymer.
A second way to incorporate both A and B comonomers into a single polymer was terpolymer synthesis (polymerization) to make VDF-co-A-co-B. Though it is a more complex and involved than physical blending, the terpolymer approach would have better chances for discerning (achieving) possible chemical synergies between A and B units in the terpolymer that could lead to unexpected concomitant increases in permeability and selectivity. In the project, two terpolymer compositions were successfully synthesized. VDF-A-B-1 was composed of 12 wt% Comonomer A, 11 wt% Comonomer B, and 77 wt% VDF monomer. VDF-A-B-2 had 20, 20, and 60 wt% of Comonomer A, Comonomer B, and VDF monomer, respectively. Thin membrane films were cast from these terpolymers for permeation studies. Films of VDF-A-B-1 were easily removed from the casting surface. Those for VDF-A-B-2 were too soft to remove or handle as free-standing films. Hence, only the VDF-A-B-1 membrane was permeation-tested.

3-6
3.1.3 Gas Permeation Properties of New VDF-Based Polymers As described in Section 2.2.1, free-standing, dense membrane films were knife-cast from solutions of
the new VDF-based polymers synthesized. Permeation test coupons (area ~ 13.8 cm2) were cut from the host membrane films, and their intrinsic material gas-permeation properties were evaluated with pure gases N2, O2, and CO2 and mixtures of 15% CO2 in N2 with and without flue-gas contaminants (NOx, SO2, moisture). For ease of comparison later on with the gas fluxes obtained on membrane hollow fibers, the experimentally measured gas permeabilities for the gas fluxes in membrane films are reported in terms of gas permeances with units of GPU for an assumed typical membrane selective layer thickness of 0.05 µm.
VDF-co-A Membrane Films. The intrinsic gas permeation properties of the VDF-co-A membrane films at 35 °C are summarized and compared to the base PVDF homopolymer in Table 3-2. The dependence of these properties on comonomer content is graphed in Figure 3-4.
From the results, the gas permeance of the VDF-co-A copolymers was much higher than that of the PVDF homopolymer and increased exponentially with increasing Comonomer A content. For example, relative to that of the PVDF homopolymer, an 18-fold increase in CO2 permeance was achieved with the nearly amorphous VDF-A.3 membrane film having 34 wt% Comonomer A and 2.4% crystallinity. The observed permeance enhancement in the VDF-co-A series was directly correlated to lower crystallinity in the polymer matrix and, in turn, a less tortuous path for gas diffusion. It is also worthwhile to note that the mixed-gas N2 and CO2 permeation properties measured for the films were very similar to their pure-gas values, indicating that the presence of co-permeating species such as CO2 and SO2 (290 ppm) had no strong plasticization or other detrimental interaction effects on gas transport in these VDF-based copolymers. The permeance of SO2 could not be determined because its permeation rate was below the resolution of the online gas chromatograph and other analytical instruments used to analyze stream compositions.
Table 3-2. Intrinsic Gas Permeation Properties of VDF-co-A Copolymer Series
VDF-based polymer Comonomer A
content (wt%)
Crystallinity Gas permeancea (GPU) Gas selectivity
N2 O2 CO2 O2/N2 CO2/N2
PVDF homopolymerb 0 >50-60% 0.42 1.6 10 3.8 24
VDF-A.5 6.3 38% 0.66 2.2 22 3.3 33
VDF-A.1 11.5 34% 1.4 5.0 40 3.6 29
VDF-A.6 14.7 30% 1.8 6.6 58 3.7 32
VDF-A.4 22.3 16% 3.6 8.2 76 2.3 21
VDF-A.2 24.4 17% 4.5 20 110 4.4 24
VDF-A.3 34.3 2.4% 7.6 24 180 3.2 24 a Computed from experimentally measured gas permeability assuming typical membrane selective layer thickness of
0.05 µm; T = 35 °C; 1 GPU = 1 × 10⁻⁶ cm3(STP)/(cm2·s·cmHg). b From reference [El Hibri and Paul, 1986].

3-7
Figure 3-4. Effect of comonomer concentration on (a) gas permeance and (b) selectivity at 35 °C
in VDF-co-A copolymer membrane films.
The effect of copolymer composition on gas selectivity in the VDF-co-A membranes was less clear and appeared to be dependent on the gas pair considered. Across the copolymer composition range studied, the O2/N2 selectivity of the VDF-co-A copolymers remained fairly constant at a mean value of 3.5, similar to that of the PVDF homopolymer. However, the CO2/N2 selectivity was scattered between 21 and 33, showing a less definitive trend with copolymer composition. For practical purposes, the CO2/N2 selectivity of the VDF-co-A materials tended to diminish from 33 to 24 as Comonomer A content increased from 6% to 34%. Comparison of these selectivity values with the CO2/N2 selectivity (24) for the base PVDF homopolymer thus indicated no adverse impact on CO2/N2 selectivity by addition of Comonomer A.
The experimental permeation results illustrate the success of copolymerizing bulky Comonomer A into the VDF backbone to reduce crystallinity in the base PVDF and, hence, increase its gas permeability (permeance). Because no diminishment of the CO2/N2 selectivity was seen, it can also be concluded that Comonomer A had minimal impact on gas solubility in the polymer matrix. In particular, the interaction between CO2 and PVDF was not altered much by incorporation of Comonomer A into the VDF backbone due probably to the low-dipole nature of this comonomer. Rather the main impact of Comonomer A was the increase of gas diffusion through reduction in matrix crystallinity.
VDF-co-B Membrane Films. The intrinsic gas permeation properties of the VDF-co-B membrane films at 23 and 35 °C are summarized and compared to the base PVDF homopolymer in Table 3-3. As already seen for this VDF-based material platform from the VDF-co-A membrane-film test results, the mixed-gas CO2 and N2 permeances measured in the VDF-co-B films were similar to the values obtained in the corresponding pure-gas tests.
In general, the VDF-co-B membrane films made from resins with low viscosity, low molecular weight, and/or broad molecular-weight distribution displayed the least improvement in CO2 separation properties. For example, even though the first copolymer composition made, VDF-B.1, had gas permeances roughly two times higher than that of the base PVDF homopolymer, its permeances were substantially lower than that of the VDF-co-A membrane compositions studied. Furthermore, the CO2/N2 selectivity of the VDF-B.1 film did not improve upon that of the base PVDF homopolymer as expected. This lack of permeation-property improvement was attributed to the poor quality of some of the VDF-co-B resins, as indicated by low viscosity, low molecular weight, and/or broad molecular-weight distribution characteristics.
0
50
100
150
200
Gas
per
me
ance
(G
PU
)
Increasing Comonomer A content
CO2
O2
N2
VDF-co-A series
1
10
100
Ga
s s
elec
tivi
ty
Increasing Comonomer A content
CO2/N
2
O2/N
2
VDF-co-A series
(a) (b)

3-8
Table 3-3. Intrinsic Gas Permeation Properties of VDF-co-B Copolymer Series
VDF-based polymer Comonomer B
content (wt%)
Crystallinity Gas permeancea (GPU) Gas selectivity
N2 O2 CO2 O2/N2 CO2/N2
PVDF homopolymerb 0 >50-60% 0.42 1.6 10 3.8 24
T = 23 °C
VDF-B.2 8.7 35.6 0.86 5.6 54 6.5 63
VDF-B.3 18.3 26.0 1.2 4.8 38 4.0 32
VDF-B.1 27.0 12.2 0.84 5.6 20 6.7 24
VDF-B.4 29.1 8.2 0.84 5.0 62 6.0 74
T = 35 °C
VDF-B.5 5.5 38.6 0.40 2.5 23 6.2 58
VDF-B.6 11.6 32.6 0.58 3.4 28 5.9 48
VDF-B.7 14.9 27.1 0.91 4.6 43 5.1 47
VDF-B.8 21.4 22.0 1.9 6.3 62 3.3 33
VDF-B.9 25.7 14.3 1.7 9.8 72 5.8 42 a Computed from experimentally measured gas permeability assuming typical membrane selective layer thickness of
0.05 µm; 1 GPU = 1 × 10⁻⁶ cm3(STP)/(cm2·s·cmHg). b T = 35 °; From reference [El Hibri and Paul, 1986].
The most impressive selectivity enhancement was obtained for higher-molecular-weight, higher-viscosity VDF-co-B resins. As shown in Table 3-3, CO2/N2 selectivity values from 32 up to 70 were measured in the VDF-co-B films of different compositions. These values are 1.3 to nearly 3 times higher than CO2/N2 selectivity in the homopolymer and the VDF-co-A family. They were also accompanied by reasonably good CO2 permeance values. Though comparable to those obtained on VDF-co-A resins of similar comonomer content, these CO2 permeances were still somewhat lower. This is most likely attributed to greater attraction between polymer chains for a tighter polymer matrix due to the greater polarity of Comonomer B relative to that of the A comonomer. The tighter matrix would slow diffusion of gas species.
The dependence of gas permeation properties on comonomer concentration for the VDF-co B family is graphed in Figure 3-5. Its CO2 permeance increased with increasing comonomer content, similar to the trend noted in the VDF-co-A series. To highlight a specific example, VDF-B.9 was made with ~14 wt% more comonomer homogeneously incorporated into the polymer structure than VDF-B.6. Both copolymer compositions exhibited similar CO2/N2 selectivity of 42-48, about 1.5-2 times higher than the selectivity of the VDF-co-A series. By adding 14 wt% more comonomer, gas permeation rates in VDF-B.9 improved by a factor of 2.6 relative to VDF-B.6 without adversely impacting selectivity. As shown in Figure 3-5(b), although the compositional trend for the selectivity has quite a bit of data scatter most probably due to varying quality of the resins polymerized, it can be seen that the VDF-co-B family generally possessed CO2/N2 selectivity in the range of 40-50, about 1.5-2 times higher than that of the base PVDF and VDF-co-A series. Thus, the VDF-co-B permeation results show that the incorporation of a more polar, bulky comonomer such as Comonomer B into the base VDF backbone does enhance the CO2-philicity of the resulting copolymers while also improving gas permeability relative to the homopolymer.

3-9
Figure 3-5. Effect of comonomer content on (a) gas permeance and (b) selectivity in VDF-co-B
copolymer membrane films.
VDF-co-C Membrane Film. As indicated in Section 3.1.1, the VDF-C.1 copolymer was synthesized to obtain better insight into how the comonomers A and B affected copolymer permeation properties. Unlike Comonomer B, the C comonomer has a low-dipole moment similar to that of Comonomer A. In contrast to both A and B that have bulky chemical side groups, Comonomer C has no such pendant groups and is thus fairly compact. As indicated in Table 3-4, gas permeation characterization at 35 °C demonstrated that VDF-C.1 had CO2/N2 selectivity comparable to that of VDF-A.2 and the PVDF homopolymer but less than that in the VDF-co-B series. VDF-C.1 also showed higher CO2 permeance than the homopolymer but lower than VDF-A.2 and VDF-co-B at similar comonomer content. Thus, it could be concluded from these two results that (i) the presence of a bulky side group in the comonomer helps to increase gas permeability by generating larger polymer free volume and (ii) a higher-dipole-moment comonomer helps to improve selectivity for CO2.
Table 3-4. Intrinsic Gas Permeation Properties of VDF-co-C Copolymer
VDF-based polymer Comonomer C
content (wt%)
Crystallinity Gas permeancea (GPU) Gas selectivity
N2 O2 CO2 O2/N2 CO2/N2
PVDF homopolymerb 0 >50-60% 0.42 1.6 10 3.8 24
VDF-C.1 18 — 1.8 6.2 46 3.4 26 a Computed from experimentally measured gas permeability assuming typical membrane selective layer thickness of
0.05 µm; T = 35 °C; 1 GPU = 1 × 10⁻⁶ cm3(STP)/(cm2·s·cmHg). b From reference [El Hibri and Paul, 1986].
Other VDF-Based Membrane Films. The VDF-B.11 copolymer membrane film was solution-cast from resin in which Comonomer B was heterogeneously incorporated into the VDF matrix. Unlike homogeneous comonomer incorporation that gives compositionally uniform copolymers, heterogeneous incorporation produces a two-phase microstructure of distributed VDF-rich and B-rich phases. VDF-B.11 had the same B comonomer content as the homogeneously incorporated VDF-B.5. Comparison of their permeation properties showed no noticeable effect of the comonomer incorporation method as the CO2 separation properties of VDF-B.11 were essentially the same as those of VDF-B.5.
The composite membrane film VDF-B.10 made by physically blending 20 wt% PVDF homopolymer and 80 wt% of a VDF-co-B resin with 29 wt% Comonomer B proved to be extremely difficult to handle. The high concentration of this comonomer made the membrane very soft and rubbery so that its thin
0
10
20
30
40
50
60
70
80
Gas
per
me
ance
(G
PU
)
Comonomer B content (wt%)
VDF-co-B series copolymersT = 23-35 °C
CO2 for PVDF homopolymer
N2
O2
CO2
(a)
10
20
30
40
50
60
70
80
CO
2/N2 s
elec
tivi
ty
Comonomer B content (wt%)
VDF-co-B series copolymersT = 23-35 °C
PVDF homopolymer
(b)

3-10
(<10 µm) films could not be handled with integrity. As a result, no meaningful or reproducible data were obtained on the VDF-B.10 membrane film.
To determine if physical blending of the more permeable VDF-co-A and more selective VDF-co-B copolymers yielded any separation property synergies, the four composite blend membrane films made with 50 wt% VDF-A.2 and 50 wt% of a VDF-B copolymer — VDF-AB.1, VDF-AB.2, VDF-AB.3 and VDF-AB.4 — were evaluated in gas permeation studies. The blend films with B comonomer content higher than 7.5 wt% (VDF-AB.2, VDF-AB.3, and VDF-AB.4) were too thin and soft to handle well so these samples did not remain defect-free during permeation testing for meaningful data to be obtained. For the VDF-AB.1 film, the measured permeation properties appeared to be close (within experimental error) to the weighted average of the permeation properties of the individual VDF-A.2 and VDF-B.6 resins comprising it. Based on this result, it would seem that no significant synergies were produced by simple physical blending of the VDF-co-A and VDF-co-B materials.
For the terpolymer membrane film VDF-A-B-1, its permeation characterization results at 35 °C are summarized in Table 3-5. For the indicated amount of B comonomer in it, the terpolymer CO2/N2 selectivity was only 16% better than that of the PVDF homopolymer and similar to that of VDF-A.1 (Table 3-2), which had a comparable A content. At the same B concentration in the simpler VDF-co-B copolymer version, the selectivity measured was much higher at 48. From a comparison of gas permeances for N2, O2, and CO2 in Table 3-2, Table 3-3, and Table 3-5, the terpolymer was more gas-permeable than VDF-A.1, VDF-B.6, VDF-B.8, and VDF-B.9. However, when it was compared to VDF-A.2 with comparable total comonomer content, the terpolymer was 20-40% less permeable depending on gas species. Thus, from testing of this preliminary terpolymer composition, no unexpected synergy was observed from the intimate chemical intermingling of the A and B comonomers. Rather the terpolymer permeation properties appeared to be a balance of the combined influence of the two comonomers and their dilution effects on each other.
Table 3-5. Intrinsic Gas Permeation Properties of VDF-A-B-1 Terpolymer Membrane Film
VDF-based polymer Comonomer
content Crystallinity
Gas permeancea (GPU) Gas selectivity
N2 O2 CO2 O2/N2 CO2/N2
PVDF homopolymerb 0 >50-60% 0.42 1.6 10 3.8 24
VDF-A-B-1 terpolymer 23 wt%
(= 12 wt% A + 11 wt% B)
— 3.1 12 86
3.9 28
a Computed from experimentally measured gas permeability assuming typical membrane selective layer thickness of 0.05 µm; T = 35 °C; 1 GPU = 1 × 10⁻⁶ cm3(STP)/(cm2·s·cmHg).
b From reference [El Hibri and Paul, 1986]. 3.1.4 Effect of Temperature on Permeation Properties of VDF-Based
Polymers The effect of temperature on gas permeation properties was investigated from room temperature up to
60 or 65 °C for several promising VDF-based copolymer compositions. Figure 3-6 shows the temperature dependence of N2, O2, and CO2 permeances in VDF-A.2. By raising the temperature by only 37 °C, the CO2 permeance substantially increased by a factor of 11 and, in terms of permeance for a 0.05-µm selective membrane layer, translated to 470 GPU for CO2 at 60 °C. The relative magnitude of the increase in permeance (permeability) observed for the VDF-A.2 membrane due to increasing temperature can be considered representative of that for the overall VDF-co-A family of copolymers. From an Arrhenius analysis of the data, the ranking of activation energies of permeation (Ep) in the VDF-co-A was N2 > O2 > CO2. That is, the permeance for CO2 was less temperature-sensitive than that for N2 and O2 because

3-11
permeation of the more condensable CO2 was controlled more by chemical solubility in the polymer than diffusivity. Hence, accompanying the order-of-magnitude CO2 permeability increase with temperature was a smaller decrease in CO2/N2 selectivity to 17-20 in the 50-60 °C interval due to the greater temperature dependence of N2 permeation over that of CO2 permeation.
Figure 3-6. Effect of temperature on gas permeances in VDF-A.2. Permeances were computed
from experimentally measured gas permeabilities assuming typical membrane selective layer thickness of 0.05 µm.
In the VDF-co-B copolymer series, membrane films VDF-B.5 through VDF-B.9 were examined over a similar temperature range. Like VDF-co-A, the VDF-co-B membrane films had the same ranking of activation energies of permeation (i.e., N2 > O2 > CO2). In the VDF-co-B materials, when temperature was increased from 23 to 65 °C, the CO2 permeance increased substantially by 4.5-6 times. For example, the CO2 permeance in VDF-B.8 increased to 380 GPU at 65 °C. Comparison with VDF-A.2 in Figure 3-7 shows that the extent of permeance increase with temperature for VDF-co-B was less than that obtained for the VDF-co-A series. This smaller effect of temperature on VDF-co-B permeance increase was attributed to greater attraction between polymer chains for a tighter polymer matrix due to the stronger polarity of Comonomer B. This observation is consistent with the higher melting temperatures (Section 3.1.1) measured for VDF-co-B than for VDF-co-A, indicating that VDF-co-B has higher use temperature (or temperature resistance) than VDF-co-A. As a result, even though selectivity decreased with temperature, the VDF-co-B was also able to maintain a higher CO2/N2 selectivity at a warmer temperature as shown in Figure 3-8. Nevertheless, when the temperature rose to 50-60 °C, the CO2/N2 selectivity quickly approached that of the base PVDF homopolymer regardless of the copolymer composition.
The comparison in Figure 3-7 also illustrates again that, while they were much more permeable than the base homopolymer, the VDF-co-B materials were generally less permeable than the VDF-co-A family. The main benefit of Comonomer B over Comonomer A was in the generally higher CO2/N2 selectivity of the VDF-co-B copolymers (Figure 3-8).
In summary, the key conclusion from the temperature dependence results is that, for VDF-based copolymers, temperature could be used as a key process variable for markedly increasing and optimizing CO2 permeance in the post-combustion CO2 capture process. In contrast to other polymers (including the next-generation polycarbonate discussed in subsequent Section 3.3.1.2) in which permeance increases by a smaller factor (usually <2 times) over a comparable temperature range, the substantial increase in permeance in VDF-based membranes indicates that they could take advantage of higher operating temperature to increase their gas processing throughput while still having decent CO2 removal ability.
0
100
200
300
400
500
20 30 40 50 60 70
Gas
per
me
ance
(G
PU
)
Temperature (°C)
CO2
O2
N2
VDF-A.2

3-12
Figure 3-7. Temperature dependences of (a) N2 and (b) CO2 permeances in VDF-A.2, VDF-B.4, and
VDF-B.8. Permeances were computed from experimentally measured permeabilities assuming typical membrane selective layer thickness of 0.05 µm.
Figure 3-8. Effect of temperature on CO2/N2 selectivity in VDF-A.2, VDF-B.4, and VDF-B.8.
3.1.5 Effect of Contaminants on Permeation Properties of VDF-Based Polymers
More rigorous separation performance stability testing of the VDF-based material platform was conducted with various flue-gas contaminants present in a CO2/N2 mixture. The VDF-A.2 copolymer membrane film was chosen as a representative sample and continuously tested for 6.5 days 24/7 at 55 °C (flue-gas temperature). The VDF-A.2 was evaluated with four contaminant-containing mixtures: (i) 31 ppm NO2, 15% CO2 in N2; (ii) 255 ppm NO, 15% CO2 in N2; (iii) 290 ppm SO2, 15% CO2 in N2; and (iv) ~0.99% water vapor, 15% CO2 in N2. Permeate and residue flow rates were monitored at regular intervals during the continuous testing. Stream compositions were determined using an online GC equipped with thermal conductivity detectors for N2, CO2, and water vapor detection. The detection of NOx and SO2 in the permeate was attempted with both GC and an online Fourier transform infrared spectrometer (FTIR), but the permeate NOx and SO2 concentrations could not be measured with accuracy because they were so low that they fell below the resolution of the two analytical instruments.
0
5
10
15
20
25
30
20 30 40 50 60 70
N2 p
erm
ean
ce (
GP
U)
Temperature (°C)
VDF-A.2
VDF-B.8
VDF-B.4
(a)
0
100
200
300
400
500
20 30 40 50 60 70
CO
2 pe
rmea
nce
(G
PU
)
Temperature (°C)
VDF-A.2
VDF-B.8
VDF-B.4
(b)
0
20
40
60
80
100
20 30 40 50 60 70
CO
2/N2 s
elec
tivi
ty
Temperature (°C)
VDF-A.2
VDF-B.8
VDF-B.4

3-13
In the contaminant stability testing, the VDF-A.2 membrane film exhibited excellent stability of CO2 permeance and selectivity properties in the presence of the NOx, SO2, and moisture contaminants. The normalized CO2 permeance and CO2/N2 selectivity results in the presence of NOx and SO2 are plotted as a function of time in Figure 3-9 and Figure 3-10, respectively, and show no decline (or change) in permeation properties. The effect of moisture on these VDF-A.2 properties is presented in Figure 3-11(a). The slight decrease seen in the CO2 properties in the presence of H2O vapor was correlated to the H2O vapor permeation behavior shown in Figure 3-11(b). In this study, it was difficult to maintain a constant level of feed-gas humidification continuously over the testing period. Hence, the feed humidity declined very gradually over the course of the test. Because the CO2 permeation behavior tracked well with the water vapor permeation trend, a possibly synergistic interaction effect appeared to exist between the co-permeating CO2 and H2O species. The H2O vapor permeance measured in VDF-A.2 was roughly 20,000 GPU in terms of permeance for a 0.05-µm selective membrane layer, and its H2O/N2 selectivity was 900-1,000. Hence, water vapor is even more permeable than CO2 in the VDF-based polymers.
To verify that the contaminants had no degradative effects on the separation properties of the VDF-based polymer, post-permeation checks of the VDF-A.2 membrane film with pure N2 and CO2 were done after each contaminant study. These post-check properties were essentially the same as those measured on the sample before contaminant exposure. Furthermore, comparison of results from the contaminant-containing studies with reference data obtained with a contaminant-free, binary CO2/N2 mixture also showed no adverse contaminant effect. Thus, the VDF-based membrane materials are stable in the presence of flue-gas contaminants.
Figure 3-9. Effect of (a) NO and (b) NOx contaminants on CO2 permeance and CO2/N2 selectivity as
a function of time in VDF-A.2. Permeance and selectivity have been normalized to their pure-gas values measured before contaminant exposure.
0.0
0.2
0.4
0.6
0.8
1.0
1.2
0 50 100 150 200
No
rmal
ized
mix
ed-g
as p
rop
erty
Time (h)
VDF-co-A.2 copolymer
Feed: 255 ppm NO, 15% CO2, Balance N
2
T = 55 °C
CO2/N
2 selectivity
CO2 permeance
(a)
0.0
0.2
0.4
0.6
0.8
1.0
1.2
1.4
0 50 100 150 200
No
rmal
ized
mix
ed-g
as p
rop
erty
Time (h)
VDF-co-A.2 copolymer
Feed: 31 ppm NO2, 15% CO
2, Balance N
2
T = 55 °C
CO2/N
2 selectivity
CO2 permeance
(b)

3-14
Figure 3-10. Effect of SO2 on CO2 permeance and CO2/N2 selectivity in VDF-A.2 over time. Permeance and selectivity have been normalized to their pure-gas values measured before contaminant exposure.
Figure 3-11. (a) Effect of water vapor on CO2 permeance and CO2/N2 selectivity and (b) H2O vapor
permeance and H2O/N2 selectivity as a function of time in VDF-A.2. CO2 properties have been normalized to their pure-gas values measured before moisture exposure. Because feed humidity was difficult to keep constant, water vapor properties have been normalized to the average of the values measured during the continuous study.
3.2 Next-Generation Polycarbonate Membranes To have a comparison baseline for its permeation properties in hollow-fiber membrane form, the
intrinsic gas-separation properties of the Generon next-generation, high-flux polycarbonate platform were determined on isotropic, dense membrane films of this material. The films were tested with pure gases N2, O2, and CO2, a binary 15% CO2 in N2 mixture, and a ternary 288 ppm SO2 and 15% CO2 in N2 mixture at room temperature. The intrinsic permeation properties of the Generon commercial standard polycarbonate were similarly characterized in the form of free-standing films.
0.0
0.2
0.4
0.6
0.8
1.0
1.2
1.4
0 50 100 150 200
No
rmal
ized
mix
ed-g
as p
rop
erty
Time (h)
VDF-co-A.2 copolymer
Feed: 290 ppm SO2, 15% CO
2, Balance N
2
T = 55 °C
CO2/N
2 selectivity
CO2 permeance
0.0
0.2
0.4
0.6
0.8
1.0
1.2
0 50 100 150 200
No
rmal
ized
mix
ed-g
as p
rop
erty
Time (h)
VDF-co-A.2 copolymer
Feed: 0.99% H2O vapor, 15% CO
2, Balance N
2
T = 55 °C
CO2/N
2 selectivity
CO2 permeance
(a)
0.0
0.2
0.4
0.6
0.8
1.0
1.2
0 50 100 150 200
No
rmal
ized
mix
ed-g
as p
rop
erty
Time (h)
VDF-co-A.2 copolymer
Feed: 0.99% H2O vapor, 15% CO
2, Balance N
2
T = 55 °C
H2O/N
2 selectivity
H2O vapor permeance
(b)

3-15
Table 3-6 compares the intrinsic permeation properties of the new high-flux polycarbonate to those of the standard polycarbonate. The new high-flux polycarbonate was 3-5 times more gas-permeable than the standard (current-generation) polycarbonate, with CO2 permeating faster by a factor of 4.4-4.9. Furthermore, even though its O2/N2 selectivity was the same as that of the standard polycarbonate, the CO2/N2 selectivity of the next-generation, high-flux polycarbonate was higher by 28-54%. Limited pure- and mixed-gas tests at different feed pressures also indicate that the effect of feed pressure on intrinsic permeation properties of the Generon PC films was minimal in the 25-300 psig range explored. At the CO2 and SO2 concentrations studied, it is also worthwhile to note that the mixed-gas N2 and CO2 permeation properties measured agreed well with their pure-gas values, indicating that there were no unexpected co-permeation effects of one species on another.
Table 3-6. Intrinsic Gas Permeation Properties of Generon Standard (Commercial) and Next-Generation, High-Flux Polycarbonates
Gas
Gas permeability (barrer) Gas permeance* (GPU) Gas/N2 selectivity
Standard polycarbonate
High-flux polycarbonate
Standard
polycarbonate High-flux
polycarbonate
Standard polycarbonate
High-flux polycarbonate
N2 O2 CO2 SO2
0.17-0.19 1.2
4.5-5.0 NM
0.60 4.1 22 20
3.4-3.8 24
90-100 NM
12 82 440 400
1.0 6-7
24-29 —
1.0 6.8 37 33
T = 23 °C; 1 barrer = 1 × 10⁻¹⁰ cm3(STP)·cm/(cm2·s·cmHg); 1 GPU = 1 × 10⁻⁶ cm3(STP)/(cm2·s·cmHg) NM = Not measurable because permeate concentration was below GC resolution.
* Computed from experimentally measured gas permeabilities assuming typical membrane selective layer thickness of 0.05 µm
3.3 Hollow-Fiber Membrane Development
In the commercial gas-separation membrane industry, the most widely used types of membrane module designs are the hollow-fiber and spiral-wound configurations. For the very high-volume application of post-combustion carbon capture, the hollow-fiber design was selected as the preferred module type for this project. Hollow-fiber membrane modules are more suitable and cost-effective for high-volume applications and are typically the standard for air separation applications. As shown in Table 3-7, the hollow-fiber module cost is significantly lower per unit membrane area than the spiral-wound design. Additionally, substantially higher membrane packing densities can be achieved with the hollow-fiber module configuration than with spiral-wound. Millions of micron-sized-diameter membrane hollow fibers can be packed into an average hollow-fiber module, allowing a large membrane area to be made into a smaller-volume (compact) module. This, in turn, not only allows for treatment of larger feed-gas flows by a single module but also results in higher membrane gas production rates.
Table 3-7. Characteristics of Common Gas-Separation Membrane Module Types [Baker, 2004]
Characteristic Spiral-wound Hollow-fiber
Membrane form Flat sheet Hollow fiber Packing density (ft2/ft3) 300-1,000 3,000-5,000 Cost ($/ft2) 1-5 0.2-1 Area of standard module (ft2) 200-640 3,000-7,000

3-16
3.3.1 Next-Generation Polycarbonate Membrane Hollow Fibers Much of the hollow-fiber membrane development efforts on the next-generation, high-flux
polycarbonate quickly focused on refining and optimizing the fiber-spinning process conditions to obtain fibers with good mechanical durability, CO2 pemeance as high as possible, and CO2/N2 selectivity as close as possible to intrinsic value. This early focus on optimizing fiber fabrication was possible because the chemistry of this next-generation polycarbonate was very similar to that of Generon’s current-generation commercial polycarbonate. Hence, by utilizing their accumulated experience and knowledge base on their commercial material, Generon was able to form stable hollow-fiber cores from the next-generation polycarbonate without much problem.
Mechanical Durability. Fibers of the next-generation polycarbonate made in initial spin runs were brittle and had less than 10% elongation to break. This brittleness caused some concern for membrane module fabrication because brittleness is generally increased at the fiber/tubesheet interface and can result in fiber breakage during handling. Therefore, to improve fiber flexibility, several fiber spin runs were made at different spin temperatures. By adjusting spin temperature, membrane hollow fibers with improved flexibility (20-25%% elongation-to-break) were successfully prepared but at some sacrifice to increased fiber-size variations (over 15%). Though still fairly brittle relative to the current-generation (standard) polycarbonate fibers (which have ~45% elongation-to-break), the new-generation polycarbonate fibers now had better mechanical properties acceptable for the fiber bundle-making step. After undergoing post-treatment steps, the resulting membrane hollow fibers were characterized in O2 and N2 permeation tests. These initial next-generation polycarbonate membrane fibers had O2 permeance greater than 100 GPU and O2/N2 selectivity about 85% of its intrinsic (ideal) value of 6-7. Their CO2 permeance was ~350 GPU, and CO2/N2 selectivity was ~20, which was only ~54% of the intrinsic value of 37. For initial fiber spins, however, these fiber permeation properties were fairly good and were a good point from which to proceed with further fiber refinements.
An additional six subsequent spin runs were conducted with the high-flux polycarbonate to further examine (i) the permeation and mechanical properties of the resulting membrane fibers at current optimum spin conditions and (ii) the effect of spin temperature on fiber mechanical durability while maintaining acceptable membrane permeation properties. These extra runs allowed the degree of fiber brittleness to be correlated with spin line parameters and fiber bundle-making success rate. It was determined that the new high-flux polycarbonate fibers must possess at least 12% elongation-to-break to survive the fiber bundle-making process during module fabrication and to be mechanically strong enough for pressurized operation (135 psig minimum pressure). Furthermore, pressure cycling tests done at 150 psig in 35-second intervals at Generon confirmed that the fibers were mechanically durable up to least 10,000 pressure cycles.
One important finding from the spin runs was that storage of the next-generation polycarbonate fibers in water over several hours was found to further embrittle them (less than 10% elongation to break) due to loss in polymer molecular weight. (Water is a nonsolvent used for precipitating and washing solvent out of the freshly spun fibers and for storage of the fibers prior to module-making.) The fiber embrittlement was due to the presence of residual levels of spinning solvents in the storage water. The molecular-weight loss and, in turn, the embrittlement were stopped by quickly drying the fibers after the spinning step. Another important finding was that the dried, high-flux polycarbonate fibers could be rewet without significant molecular-weight loss as long as the water used contained no traces of spinning solvents. Thus, by adding a fiber drying step to prevent fiber embrittlement and spinning under conditions that would yield fibers with elongation-to-break greater than 12%, the brittleness of the new-generation polycarbonate fibers was found to be readily manageable.

3-17
Fiber Dimensions. Different fiber sizes were examined to handle possible parasitic pressure drop issues associated with the fast permeating CO2 species in the high-flow post-combustion CO2 capture application. Three hollow-fiber sizes were successfully formed from the next-generation, high-flux polycarbonate after seven fiber spin runs at spinline rates of 80-260 ft/min. The three fiber sizes are given in Table 3-8 and were packaged into lab-scale modules for performance evaluation (Section 3.3.1.1). Fiber size #1 was considered the typical (standard) fiber size. As an option for mitigating parasitic pressure drops, hollow fibers with larger dimensions were spun. Fiber size #3 was optimized as the larger fiber and had 25% larger ID and OD than fiber size #1. Pressure drops should be 50% lower in fiber size #3 than in the smaller, standard fibers. Tests on the larger fibers indicated improved mechanical durability and permeances similar to the smaller fibers. Though modules fabricated from the larger fibers are expected to have surface area and volumetric gas productivity that are ~20% lower than those made from the standard fibers, the larger-fiber option is available for managing pressure drop issues in the high-flux polycarbonate hollow-fiber modules.
Tubesheets. As mentioned previously in Section 2.2.2, tubesheets are a critical module component as they form the gas-tight seal around the membrane fibers to separate the permeate product from the feed and residue (non-permeate) streams. Generon’s standard four-component epoxy resin was found to make acceptable tubesheets for the new high-flux polycarbonate fibers up to a bundle diameter of 6 inches. This was verified by the defect-free test tubesheets formed around these fibers on Generon’s production equipment. The one main modification made was that the tubesheet resin cure (reaction) time was shortened as much as practical to avoid damaging of the high-flux polycarbonate fibers by some of the epoxy components in their unreacted state. An epoxy with a 5-min. cure time was used to make the tubesheets in small (2-in.-dia.) modules. For large modules, though, a slower-curing epoxy would be needed because the quick-setting epoxy would be too exothermic and, as a result, cause stress cracking of the large tubesheets.
3.3.1.1 Gas Permeation Properties of Next-Generation Polycarbonate Membrane Hollow Fibers
Several types of lab-scale modules (beaker, loop-cell, and standard 210 type) were made for CO2 separation performance evaluation in pure- and mixed-gas permeation tests. A photo of the typical hollow-fiber membrane modules used in the experiments and a photo of typical Generon polycarbonate-based membrane hollow fibers are shown in Figure 3-12. Beaker units were the smallest and simplest and intended only for pure-gas testing to quickly obtain gas flow rate (without normalization to membrane area) and selectivity. The largest lab modules were the standard 210-type devices with a standard area of 100 ft2. The loop-cell modules covered the intermediate range between beaker units and the Type 210s.
The majority of lab modules fabricated from the next-generation, high-flux polycarbonate membrane fibers spun were loop-cells containing 90-180 fibers with 95-98 µm ID and 130-140 µm OD and active fiber length of 15 or 20 in. The membrane areas of these loop-cells were in the range of 0.18-0.37 ft2 (167-344 cm2). The CO2 separation properties of a couple of standard, current-generation polycarbonate loop-cell modules were also measured to provide a comparison baseline for the permeation properties of the high-flux polycarbonate hollow-fiber membranes.
Table 3-8. Average Dimensions of High-Flux Polycarbonate Fibers Spun
Fiber parameter Value (µm)
Size #1 Size #2 Size #3
Inner diameter (ID) Outer diameter (OD)
95 130
115 190
120 160

3-18
Figure 3-12. (a) Lab-scale hollow-fiber membrane module types used in CO2 separation
performance testing and (b) individual Generon membrane hollow fibers.
All polycarbonate-based hollow-fiber membrane modules were evaluated with pure gases (N2, O2, and CO2) at 50 psig feed pressure and room temperature. Several of the modules were tested with the binary 15% CO2 in N2 mixture at 75 psig feed pressure. One module was also tested with the ternary 290 ppm SO2 and 15% CO2 in N2 mixture. The high-flux and standard polycarbonate fibers exhibited mixed-gas permeation properties very similar to their pure-gas values at these conditions. Table 3-9 compares the permeation properties of the next-generation polycarbonate to those of the standard polycarbonate.
Based on the Table 3-9 results, the high-flux polycarbonate modules were categorized into two groups, Batch #1 and Batch #2, according to the magnitude of the CO2 permeance measured. Batch #2 had CO2 permeance of ~410 GPU, which was about two times higher than the CO2 permeance of Batch #1. The CO2/N2 and O2/N2 selectivities were essentially the same for both module batches and were 22-26 and 5.0-5.6, respectively. The different permeances of Batches #1 and #2 correlated well with the different thermal processing steps used during the fabrication of the high-flux polycarbonate fibers in the respective modules. More importantly, as shown in this table, the high-flux polycarbonate membrane fibers made under the optimum spin conditions determined by partner Generon were 2- to 4-fold higher in gas permeance than the standard polycarbonate fibers, consistent with the permeability trend obtained on their dense-film counterparts (Table 3-6). Achieving this higher permeance, especially for CO2, is promising because it helps to reduce the required membrane area and, in turn, the membrane capital cost for the carbon capture application.
Table 3-9. Permeation Properties of Standard and High-Flux Polycarbonate (PC) Membranes as Films and Hollow Fibers
Membrane form
Membrane material
Gas permeance (GPU) Gas selectivity
N2 O2 CO2 SO2 O2/N2 CO2/N2 SO2/N2
Dense filma Standard PC 3.4-3.8 24 90-100 —b 6-7 24-29 —
High-flux PC 12 82 440 400 6.8 37 33
Hollow fiber
Standard PC 4.0 26 100 100-160 6.5 25 25-40
High-flux PC Batch #1 Batch #2
9.0 19
50 100
230 410
ND 575
5.6 5.0
26 22
— 30
1 GPU = 1 × 10⁻⁶ cm3(STP)/(cm2·s·cmHg); T = 23 °C a Permeances were computed from experimentally measured gas permeabilities assuming typical
membrane selective layer thickness of 0.05 µm. b Not measurable because peak area was below the GC resolution. c ND = Not determined.
Loop-Cell Module(0.75 ft2 area)
210-Type Module (100 ft2 area)
Beaker Unit
Loop-Cell Module(0.75 ft2 area)
210-Type Module (100 ft2 area)
Beaker Unit
(a) (b)

3-19
On the other hand, the high-flux polycarbonate hollow fibers displayed at least the same CO2/N2 selectivity as the standard polycarbonate fibers. This selectivity was only 60-70% of the intrinsic CO2/N2 selectivity (35-37) measured on the corresponding dense high-flux polycarbonate films. This indicated that the high-flux polycarbonate fiber properties could continue to be further improved to bring their CO2/N2 selectivity closer to the intrinsic value.
3.3.1.2 Effect of Temperature on Next-Generation Polycarbonate Membrane Hollow Fibers
The temperature dependence of the gas permeation properties of the high-flux polycarbonate hollow-fibers were evaluated between room temperature and 65 °C by RTI and down to 0 °C by partner Generon. The results are plotted in Figure 3-13. Over a temperature rise of 47 °C, the CO2 permeance of the high-flux polycarbonate fibers increased by only 15%. This temperature dependence is quite weak relative to the tenfold increase observed for the VDF-based copolymers in Section 3.1.4. An Arrhenius analysis of the data indicated that the ranking of activation energies of permeation (Ep) in the next-generation polycarbonate was N2 > O2 > CO2. The Ep was 1-2 kJ/mol and 14-18 kJ/mol for CO2 and N2, respectively. The lower Ep for CO2 means that CO2 permeation was less sensitive to temperature than N2 permeation so that CO2/N2 selectivity would decrease at higher temperatures. Or, conversely, selectivity would increase with decreasing temperature. For example, the CO2/N2 selectivity of the high-flux polycarbonate rose to 40 at 0 °C [Figure 3-13(b)]. Thus, for the high-flux polycarbonate hollow-fiber membrane, it would be best to operate it at room temperature or lower. A subambient temperature operation would boost removal without requiring much more membrane area. Module pressure drops would also be somewhat lower due to slightly lower permeation rates.
Figure 3-13. Temperature dependence of (a) CO2 permeance and (b) CO2/N2 and O2/N2 selectivities
in the next-generation polycarbonate hollow-fiber membranes.
3.3.1.3 Effect of Operating Stage-Cut and Feed CO2 Content on Next-
Generation Polycarbonate Membrane Hollow Fibers The performance of a membrane separation process depends on a number of operating parameters,
including stage-cut and feed composition. Stage-cut is the ratio of permeate to feed flow rates and is related to the degree of removal or recovery at which the membrane process is operated. Feed composition is related to the partial pressure driving force available for permeation of each species. In the RTI three-stage CO2 capture membrane process design developed (discussed later in Sections 3.4.3 and
200
300
400
500
10 20 30 40 50 60 70
CO
2 p
erm
ean
ce
Temperature (°C)
(a)
0
10
20
30
40
50
0 20 40 60 80
Gas
sel
ect
ivit
y
Temperature (°C)
O2/N
2
CO2/N
2
(b)

3-20
3.4.6), each membrane stage is operated at a different stage-cut within the 10-60% range and has a different feed CO2 concentration (10-70%) entering it. The first phase of the process development effort had assumed that the high-flux polycarbonate hollow-fiber membrane maintained the same CO2 permeance and selectivity regardless of stage-cut or inlet CO2 content.
The validity of the assumptions were checked by examining the separation performance properties of the high-flux polycarbonate membrane fibers as a function of a stage-cut with different feed CO2 concentrations to mimic the simulated conditions of each membrane stage in the RTI capture process. As shown in Figure 3-14, feed CO2 concentrations up to 30% and operation in the 12-40% stage-cut range had a minimal effect on the N2 and CO2 permeances and CO2/N2 selectivity of the high-flux polycarbonate membrane fibers. The selectivity diminished only a little (10%) at the higher stage-cut due to a corresponding slight decrease in CO2 permeance, with the N2 permeance staying constant. This trend was due less to the membrane permeation properties and more to the parasitic axial pressure drop playing a larger role in the separation performance.
At high feed CO2 content of ~70% and even higher stage-cuts, the high-flux polycarbonate hollow-fibers exhibited higher CO2 permeance than typical and a somewhat depressed N2 permeance. These permeance trends improved the CO2/N2 selectivity of the membrane fiber to 35-40. These conditions of higher inlet CO2 concentration and high stage-cut operation were representative of those modeled for the second membrane stage in the RTI capture process. Hence, based on Figure 3-14 results, the high-flux polycarbonate membrane would actually be more efficient under the second-stage process conditions. However, to be conservative, the process analysis in subsequent Section 3.5 used the same membrane properties in the second membrane stage as those used in the first and third stages.
Figure 3-14. Dependence of (a) N2 and CO2 permeances and (b) CO2/N2 selectivity in the next-
generation, high-flux polycarbonate on operating stage-cut and feed CO2 concentration.
3.3.1.4 Effect of Contaminants on Next-Generation Polycarbonate Membrane
Hollow Fibers Performance testing of the high-flux polycarbonate membrane fibers in the presence of flue-gas
contaminants was conducted in various short- and longer-term studies.
NOx Contaminants. Two high-flux polycarbonate hollow-fiber membrane modules were continuously tested for 6.5 days 24/7 at 23 °C with 15% CO2 in N2 mixtures containing either 255 ppm of
Circles - 16% CO2/N
2 feed
Squares - 30% CO2/N
2 feed
Triangles - 70% CO2/N
2 feed
10
100
1,000
0 20 40 60 80 100
Mix
ed-g
as
per
mea
nc
e (G
PU
)
Stage-cut (%)
CO2
N2
T= 23 °C
(a)
Circles - 16% CO2/N
2 Feed
Squares - 30% CO2/N
2 Feed
Triangles - 70% CO2/N
2 Feed
0
10
20
30
40
50
0 20 40 60 80 100
Mix
ed-g
as
CO
2/N
2 s
elec
tivi
ty
Stage-cut (%)
T= 23 °C (b)

3-21
NO or 31 ppm of NO2. One module was exposed to the NO-laden mixture, while the other to the NO2-containing feed. Permeate and residue flow rates were monitored at regular intervals during the continuous testing. Stream compositions were determined using an online GC equipped with thermal conductivity detectors for N2 and CO2 detection. Permeate and residue NOx concentrations were measured using an online FTIR.
The effects of NOx on the CO2 separation properties of the high-flux polycarbonate are plotted in Figure 3-15 and Figure 3-16. In contrast to the stable permeation behavior demonstrated by the VDF-based polymer platform (Section 3.1.5), the permeance (productivity) of the high-flux polycarbonate appeared to have some sensitivity to NOx as it gradually declined over the six and a half days of continuous testing. In fact, the membrane fibers seemed more sensitive to NO2 than to NO. The CO2 permeance decreased by ~35% in NO2 compared to the smaller 20% decrease in NO. The NOx effect on the CO2/N2 selectivity was much less. This selectivity was fairly stable and only showed a small drop of 8% and 12% near the end of the NO and NO2 exposure periods, respectively. The data also showed that NOx/N2 selectivities were essentially stable. The NO/N2 selectivity had leveled off at 6.5-7.0. The NO2/N2 selectivity initially increased before plateauing at 18-20. From the data collected, the property losses did not appear to have reached a plateau so it is recommended that longer NOx tests should be conducted to obtain a better understanding.
Figure 3-15. (a) Effect of NO on CO2 permeance and CO2/N2 selectivity and (b) NO permeance and
NO/N2 selectivity as a function of time in the next-generation, high-flux polycarbonate. CO2 properties have been normalized to their pure-gas values measured before NO exposure. NO properties have been normalized to their values measured at time t = 0 of the continuous study.
0.0
0.2
0.4
0.6
0.8
1.0
1.2
0 50 100 150 200
Time (h)
Next-generation, high-flux polycarbonate
Feed: 255 ppm NO, 15% CO2, Balance N
2
T = 23 °C
CO2/N
2 selectivity
CO2 permeance
No
rmal
ized
mix
ed-g
as p
rop
erty
(a)
0.0
0.2
0.4
0.6
0.8
1.0
1.2
0 50 100 150 200
Time (h)
Next-generation, high-flux polycarbonate
Feed: 255 ppm NO, 15% CO2, Balance N
2
T = 23 °C
NO/N2 selectivity
NO permeance
No
rmal
ized
mix
ed-g
as p
rop
erty
(b)

3-22
Figure 3-16. (a) Effect of NO2 on CO2 permeance and CO2/N2 selectivity and (b) NO2 permeance
and NO2/N2 selectivity as a function of time in the next-generation, high-flux polycarbonate. CO2 properties have been normalized to their pure-gas values measured before NO2 exposure. NO2 properties have been normalized to their values measured at time t = 0 of the continuous study.
In performing subsequent post-study permeation checks with pure N2 and CO2 on the NOx-exposed high-flux polycarbonate modules, it was found that their CO2/N2 selectivity was actually unaffected and stable. When the NOx species were no longer in the feed, the module CO2/N2 selectivity was the same as the value obtained before NOx exposure. The post-study permeation checks, though, also confirmed the lower permeance of the NOx-exposed modules.
The two NOx-exposed high-flux polycarbonate loop-cell modules were removed from the test system and left at ambient conditions. Interestingly, after a few months, re-evaluation with pure N2 and CO2 showed that the loop-cells had recovered much of their initial permeation properties. The CO2 permeance had returned to 76% of initial value for the module exposed to NO2 and to 94% of initial value for the module exposed to NO. This permeance recovery was unexpected and indicated that the high-flux polycarbonate fibers had not been chemically degraded by NOx, rather some other as yet unknown phenomenon was occurring. Furthermore, the CO2/N2 selectivity of the modules was the same as the initially measured values. This behavior indicated that only the productivity (flux or permeance), not purification ability (selectivity), of the high-flux polycarbonate membrane had some sensitivity to NOx. If so, then the effect of NOx can be managed in practice by oversizing the membrane unit with respect to membrane area, which mainly affects membrane capital cost, not energy cost.
SO2 Contaminant. To determine SO2 effect and permeation behavior in the polycarbonate-based membrane fibers at higher pressures, one module of the standard polycarbonate was also evaluated up to 200 psig feed pressure at room temperature with a CO2/N2 mixture containing 290 ppm SO2. As shown in Figure 3-17, the presence of this dilute SO2 concentration did not seem to adversely affect membrane properties in this brief study. Except for the low 50-psig feed pressure point, permeance was higher for the more condensable SO2 than for CO2. The N2 permeance remained fairly stable in the ternary mixture tests. Although an apparent competitive effect between SO2 and CO2 transport was observed, their permeation behavior stabilized at higher pressures as indicated by the leveling off of the permeance and selectivity values for these species. The membrane fibers experienced very mild plasticization by 290 ppm SO2 at the higher feed pressures. This feed pressure behavior in the presence of SO2 could also be generally extended to the high-flux polycarbonate fibers, which exhibited SO2 permeance of 575 GPU and SO2/N2 selectivity of ~30 (Table 3-9).
0.0
0.2
0.4
0.6
0.8
1.0
1.2
0 50 100 150 200
Time (h)
Next-generation, high-flux polycarbonate
Feed: 31 ppm NO2, 15% CO
2, Balance N
2
T = 23 °C
CO2/N
2 selectivity
CO2 permeance
No
rmal
ized
mix
ed-g
as p
rop
erty
(a)
0.0
0.5
1.0
1.5
2.0
0 50 100 150 200
Time (h)
Next-generation, high-flux polycarbonate
Feed: 31 ppm NO2, 15% CO
2, Balance N
2
T = 23 °C
NO2/N
2 selectivity
NO2 permeance
No
rmal
ized
mix
ed-g
as p
rop
erty
(b)

3-23
Figure 3-17. Mixed-gas (a) SO2, CO2, and N2 permeances and (b) SO2/N2 and CO2/N2 selectivities in
loop-cell polycarbonate membrane module as a function of feed pressure. Ternary feed mixture: 290 ppm SO2, 15% CO2, and balance N2. The CO2/N2 selectivity values obtained with pure gases and the binary 15% CO2 in N2 mixture are included in (b) for comparison.
This loop-cell module was also subjected to periodic recurring exposure to 290 ppm SO2 in the 15% CO2 in N2 mixture to determine stability of the membrane fibers before and after testing with CO2/N2 mixtures with and without SO2 over time at 50 and 150 psig feed pressures. Intermediate pure-gas permeation checks were performed before and after these mixed-gas tests to monitor module integrity and stability, and the check results are summarized in Figure 3-18. Under such testing conditions, the N2 and CO2 permeances and CO2/N2 selectivity were found to be stable over the 25-day monitoring period.
Figure 3-18. Stability checks of (a) N2 and CO2 permeances and (b) CO2/N2 selectivity in loop-cell
polycarbonate membrane module as a function of time after periodic (recurring) multiple tests with binary mixture (15% CO2 in N2) and ternary mixture (290 ppm SO2, 15% CO2, and balance N2).
Because of similar material chemistry, the next-generation polycarbonate fibers would also be expected to exhibit SO2 behavior similar to the current-generation polycarbonate. Because of its greater condensability relative to CO2, SO2 would plasticize (swell) the high-flux polycarbonate matrix to some degree, making the membrane slightly less discriminating of the different permeating species and
1
10
100
1,000
0 100 200 300
Mix
ed-g
as p
erm
eanc
e (G
PU
)
Feed pressure (psig)
Generon-3 loop-cellTernary mixture w/ 290 ppm SO
2
SO2
N2
CO2
(a)
10
100
0 100 200 300
(b)Generon-3 loop-cellSolid pts. -- Ternary mixtureOpen squares -- Binary mixtureOpen circles -- Pure gas
Feed pressure (psig)
Sel
ectiv
ity
SO2/N
2 (mixed-gas)
Mixed-gasCO
2/N
2
Pure-gas
1
10
100
1,000
Pur
e-ga
s p
erm
eanc
e (G
PU
)
Time 0 day 25 days
Post-Binary
Post-Ternary (Purge)
Post-1st Ternary
Pre-2nd Ternary
Pre-Day 2 2nd Ternary
Post-3rdTernary
(w/ Purge)
CO2
N2
(a)Generon-3 loop-cell
Black open pts. -- 50 psigRed solid pts. -- 150 psig
0
10
20
30
40
150 psig
0 day 25 days
Post-Binary
Post-Ternary (Purge)
Post-1st Ternary
Pre-2nd Ternary
Pre-Day 2 2nd Ternary
Post-3rdTernary
(w/ Purge)
CO
2/N
2 sel
ecti
vity
Time
(b)
50 psig
Generon-3 loop-cell

3-24
somewhat diminishing its selectivity. Short-term testing of the high-flux polycarbonate with the SO2-containing CO2/N2 mixture also showed no immediate degradative effect of SO2 on the membrane fibers. In a separate continuous exposure study by Generon, however, it was found that the high-flux polycarbonate displayed a sensitivity to SO2 that resembled its NOx sensitivity behavior. Continuous exposure over a 4-month period to 200 ppm SO2 resulted in membrane permeance (productivity) leveling off at a 20% loss with surprisingly no effect on selectivity. As in the case with NOx, the fibers did not appear to have been chemically degraded by SO2, especially if selectivity remained intact.
The permeance loss observed in the membrane hollow fibers, though, were not seen in the corresponding dense membrane films. It is thus speculated that contaminants such as SO2 and NOx interact differently with the engineered fiber membrane structure (an ultrathin selective layer supported by a porous sublayer of the same polymer) than with the bulk membrane film. The contaminants could be inducing relaxation and gradual compaction of the underlying porous substructure. This behavior could explain the loss in membrane permeance without loss in membrane selectivity. Clearly, more work beyond the project scope is needed to shed more light on contaminant effects on the membrane structure. If permeance loss is the main effect and selectivity is unaffected, then this issue can be handled in practice by oversizing membrane area, which only increases membrane capital cost, not energy cost.
3.3.1.5 Prototype Modules of Next-Generation Polycarbonate Membrane Hollow Fibers
In parallel with process development efforts and bench-scale separation performance evaluations, project partner Generon examined the process of manufacturing and packaging the high-flux polycarbonate hollow-fiber membrane into larger membrane module prototypes. The target prototype module size was 6 in. × 36 in. and was selected because this size would be suitable for future field durability testing. Four additional fiber-spin runs were made to supply high-flux polycarbonate membrane fibers for prototype module manufacture. The membrane fibers were bundled, potted into epoxy tubesheets, and fabricated into twelve (12) 6150UHF prototype modules having an effective mean membrane area of 2,050-2,200 ft2 (190-204 m2). A photo of one prototype module made is shown in Figure 3-19. From integrity (quality) permeation checks at Generon’s manufacturing facility, the prototype modules have an average CO2 permeance of 350-400 GPU, consistent with that of the lab-scale membrane fibers used in the lab-scale loop-cell modules. This demonstrated that the next-generation polycarbonate membrane hollow fibers can be successfully produced into larger prototype modules on manufacturing equipment under manufacturing conditions.
Figure 3-19. Large prototype membrane module (6 in. × 36 in.; 2.200 ft2) produced from the next-generation, high-flux polycarbonate membrane hollow fibers.
3.3.2 VDF-Based Copolymer Membrane Hollow Fibers
The development of hollow-fiber membranes from the VDF-based polymer platform was the main focus in the last five months of the project. For this effort, the VDF-A.2 composition incorporated with 24 wt% Comonomer A was downselected because it had among the best balance of CO2 permeability and selectivity measured for post-combustion CO2 capture in this family of new fluorinated copolymers and

3-25
was chemically resistant to flue-gas contaminants. To have an adequate material supply for the membrane fiber development work, synthesis and preparation of the VDF-A.2 copolymer was scaled-up with no problems on Arkema’s pilot polymerization reactor system to produce a 200-lb pilot batch of VDF-A.2 resin.
As discussed in Section 2.2.2, laboratory solubility studies indicated that a good starting solvent/nonsolvent system for preparing spin dopes from VDF-based polymers such as VDF-A.2 consisted of NMP as the solvent and TEG as the nonsolvent. The resulting single-phase dope solutions appeared hazy, regardless of composition. Even a VDF-A.2 solution in NMP solvent alone had some haziness, as seen in the sample solution on the far left in Figure 3-20. Much of the preliminary solubility evaluation work was done with 10-20 wt% polymer content.
Figure 3-20. Representative samples of VDF-A.2 dope solutions made with different NMP/TEG ratios (left to right): infinity, 2.5, 2.0, 1.7, 1.3, and 0.7 (no dissolution).
Some of the dope-solution compositions were found to be quite sticky, adhering to stirring rods and container surfaces. This tackiness would be problematic for fiber spinning in which the spin dope must pass freely through an extrusion die and other downstream processing steps. It also raised concerns about fiber-to-fiber adhesion because the Generon research spinline equipment uses dies that spin multiple fibers and these fibers can touch during the various processing steps. The least tacky dope solutions were those with the lowest solvent/nonsolvent ratios and proved to be best for fiber spin trials.
Feasibility Spin Runs. A couple of trial fiber spin runs with the preliminary VDF-A.2 spin-dopes were run on the Generon research fiber spinline equipment to check spinnability of the dopes. Flexible, mechanically strong hollow fibers were produced. However, as suspected, difficulties were encountered in running the formed fibers through the subsequent extraction (precipitation) baths critical for both solvent extraction and membrane property development. The fibers had some tendency to stick together as they were drawn to their final fiber dimensions. The tackiness of the wet fibers could be mitigated by further modifying the dope solution formulation. The dried VDF-A.2 fibers were not tacky. These preliminary spin runs demonstrated the feasibility of fabricating hollow-fiber cores from the VDF-based polymers and identified fiber tackiness, fiber shape stability, and solvent extraction as issues to address in going forward.
First Spin-Run Campaign. Additional laboratory solubility studies on VDF-A.2 were performed to refine the concentration range over which acceptable spin-dope solutions for fiber extrusion could be prepared. To mitigate fiber tackiness and shape stability, dope solutions having higher polymer concentrations and lower solvent/nonsolvent ratios were examined. It was found that spinnable dopes
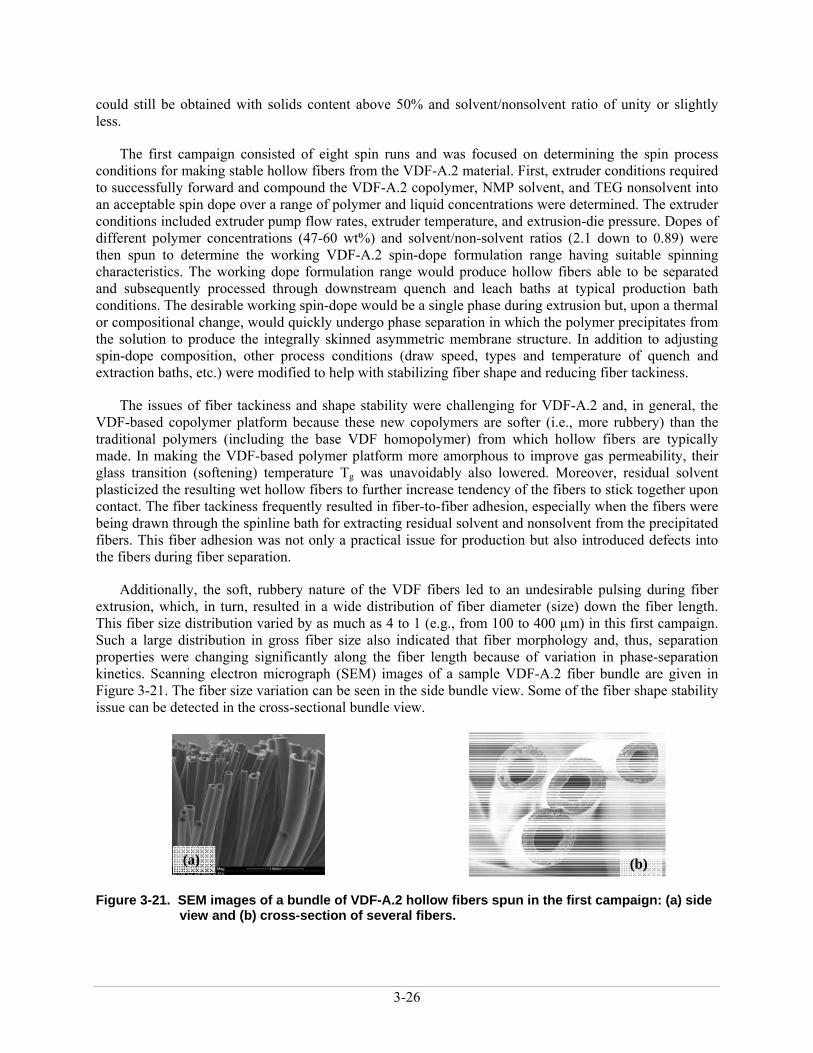
3-26
could still be obtained with solids content above 50% and solvent/nonsolvent ratio of unity or slightly less.
The first campaign consisted of eight spin runs and was focused on determining the spin process conditions for making stable hollow fibers from the VDF-A.2 material. First, extruder conditions required to successfully forward and compound the VDF-A.2 copolymer, NMP solvent, and TEG nonsolvent into an acceptable spin dope over a range of polymer and liquid concentrations were determined. The extruder conditions included extruder pump flow rates, extruder temperature, and extrusion-die pressure. Dopes of different polymer concentrations (47-60 wt%) and solvent/non-solvent ratios (2.1 down to 0.89) were then spun to determine the working VDF-A.2 spin-dope formulation range having suitable spinning characteristics. The working dope formulation range would produce hollow fibers able to be separated and subsequently processed through downstream quench and leach baths at typical production bath conditions. The desirable working spin-dope would be a single phase during extrusion but, upon a thermal or compositional change, would quickly undergo phase separation in which the polymer precipitates from the solution to produce the integrally skinned asymmetric membrane structure. In addition to adjusting spin-dope composition, other process conditions (draw speed, types and temperature of quench and extraction baths, etc.) were modified to help with stabilizing fiber shape and reducing fiber tackiness.
The issues of fiber tackiness and shape stability were challenging for VDF-A.2 and, in general, the VDF-based copolymer platform because these new copolymers are softer (i.e., more rubbery) than the traditional polymers (including the base VDF homopolymer) from which hollow fibers are typically made. In making the VDF-based polymer platform more amorphous to improve gas permeability, their glass transition (softening) temperature Tg was unavoidably also lowered. Moreover, residual solvent plasticized the resulting wet hollow fibers to further increase tendency of the fibers to stick together upon contact. The fiber tackiness frequently resulted in fiber-to-fiber adhesion, especially when the fibers were being drawn through the spinline bath for extracting residual solvent and nonsolvent from the precipitated fibers. This fiber adhesion was not only a practical issue for production but also introduced defects into the fibers during fiber separation.
Additionally, the soft, rubbery nature of the VDF fibers led to an undesirable pulsing during fiber extrusion, which, in turn, resulted in a wide distribution of fiber diameter (size) down the fiber length. This fiber size distribution varied by as much as 4 to 1 (e.g., from 100 to 400 µm) in this first campaign. Such a large distribution in gross fiber size also indicated that fiber morphology and, thus, separation properties were changing significantly along the fiber length because of variation in phase-separation kinetics. Scanning electron micrograph (SEM) images of a sample VDF-A.2 fiber bundle are given in Figure 3-21. The fiber size variation can be seen in the side bundle view. Some of the fiber shape stability issue can be detected in the cross-sectional bundle view.
Figure 3-21. SEM images of a bundle of VDF-A.2 hollow fibers spun in the first campaign: (a) side view and (b) cross-section of several fibers.
(a) (b)

3-27
The morphology of the VDF-A.2 hollow fibers produced in the first campaign was also examined by SEM. The cross-sectional images in Figure 3-22 show that structural microporosity did develop in the fibers. The microporosity appeared to be continuous through the fiber wall, indicating that skinning of the asymmetric porous morphology was not obtained. An ultrathin skin is desired because it is this dense layer that provides the gas separation properties. The results obtained from evaluating small lab beaker devices made from these fibers supported the SEM observations. In pure-gas permeation integrity tests with N2 and O2, the lab devices showed good gas flux (several hundred GPU) but no selectivity (O2/N2 selectivity ~ 1), indicating presence of defects and/or the lack of the selective skin layer. The intrinsic O2/N2 selectivity of the VDF-A.2 copolymer was measured previously on dense films to be 3-4. Based on the integrity test results and the SEM images, transformation of the spin dope from the one-phase regime to the two-phase regime appeared to be too slow under current spinning conditions for making the skinned asymmetric structure.
Figure 3-22. SEM images of a single VDF-A.2 hollow fiber from the first spin-run campaign: (a)
cross-sectional view and (b) magnified cross-section of fiber wall.
Second (and Final) Spin-Run Campaign. The second and final spin-run campaign focused on addressing the various main issues encountered in the first campaign and consisted of six spin runs. To form the desired skinned asymmetric structure, solvent and nonsolvent needed to be extracted more quickly from the extruded fibers. Fiber tackiness and fiber stability (axial fiber size distribution) also needed to be better controlled and minimized. To accelerate solvent and nonsolvent extraction rates, the most straightforward strategies were to push the spin-dope formulation closer to the phase-separation limit by increasing polymer concentration (up to 66 wt%) and decreasing the solution power through a lower solvent/nonsolvent ratio (0.9-1). These same parameters also helped to decrease fiber tackiness and improve fiber stability by allowing quicker solvent removal and shorter duration of the sticky, gel-like (soft) phase due to quicker precipitation of the polymer phase.
Additionally, to further mitigate fiber tackiness in spin processing, the extraction bath was modified to allow lowering of its temperature from 40-60 °C to room temperature. Improved control over fiber stability (fiber diameter distribution) was also obtained by lowering extrusion-die temperature to minimize pulsing of fibers as they were drawn through the spinline equipment. Lowering operational temperatures of the extraction bath and the extrusion die was effective because the VDF-A.2 polymer was less soft (i.e., stiffer) at the cooler temperatures during these spin processing operations.
Refinement of the spin-dope composition and lowering the temperatures of the extraction bath and extrusion die did significantly improve the reliability of running the VDF-A.2 hollow fibers through the entire spinning process. Fiber tackiness was reduced so that the fibers remained split in the draw zone and the quench bath and their reattachment to each other in the extraction bath was substantially less and much more manageable. Fiber shape stability was also much improved as evidenced by a reduction in
(a) (b)

3-28
axial fiber size distribution. The fiber size distribution achieved in the second campaign was 2 to 1 (e.g., from 100 to 200 µm), a twofold improvement over the first spin-run campaign.
Another possible strategy to decrease fiber tackiness was to further manipulate solution power by adding a second non-solvent to the dope. To test this approach, water (H2O) was selected as the second nonsolvent. As pictured in Figure 3-23, dope compositions with over 1 wt% water in a 50/50 mixture of NMP and TEG gave solutions in which the VDF-A.2 resin did not readily dissolve, even at elevated temperatures. At 0.8 wt% water, a small amount of phase separation was still evident such that a small amount of liquid was sitting on top of a hazy gel. Qualitatively, this gel appeared to be less sticky. In the end, though, a spin run was done with 0.5 wt% water in a dope formulation of 61 wt% VDF-A.2 in a 50/50 mixture of NMP and TEG.
Figure 3-23. Sample VDF-A.2 dope solutions in 50/50 mixture of NMP and TEG with decreasing amounts of water as second nonsolvent (left to right): 20%, 10%, 4%, and 0.8% water.
The spin run with 0.5 wt% water in the spin-dope ran well and a number of fiber samples were generated for gas permeation testing (Figure 3-24 as an example). Unfortunately, spiking the dope with 0.5% water did not much improve fiber size distribution or reduce fiber tackiness. A SEM image magnifying the fiber wall cross-section of a VDF-A.2 fiber spun with 0.5% water is presented in Figure 3-25.
Figure 3-24. Samples of the dry VDF-A.2 hollow fibers spun with 0.5 wt% water in the dope solution in the second campaign. Fiber dimensiona: 200 µm ID × 350 µm.

3-29
Figure 3-25. SEM image of magnified fiber-wall cross-section of a single VDF-A.2 hollow fiber spun with 0.5 wt% water in the dope solution in the second campaign.
A final strategy investigated in the second campaign for improving the VDF-A.2 fibers was to increase core gas flow and pressure through the hollow-fiber core. The basis of this approach was that running a higher core gas flow, as evidenced by a positive core gas pressure, would better support the fiber inner diameter to improve control over fiber size distribution. No significant improvement was seen in fiber size distribution in the resulting fibers; in fact, the size distribution appeared to be the same as in previous best spin runs.
The best VDF-A.2 hollow fibers spun at different process conditions in the second spin-run campaign were made into four small lab beaker modules for permeation testing (Figure 3-26) to determine whether the fibers had any membrane properties. Three beakers had 60 fibers, and the fourth had 90 fibers. The initial gas flows in these devices were very high, indicating that either the fibers had minor (small) defects and/or sealing at the fiber/epoxy resin interface was poor. After patching or coating the fibers to fix defects, gas fluxes of the beakers decreased to a more practical permeance range of 30-230 GPU.
Figure 3-26. Small lab-scale beaker modules of VDF-A.2 hollow fibers made for gas permeation testing. Beaker fiber count: 60-90. Permeation area: 165-297 cm2.
The beakers were tested with pure N2, O2, and CO2 at 20-60 psig feed pressure at room temperature. The measured gas permeances summarized in Table 3-10 show that these developmental VDF-A.2 fibers from the second spin campaign still had no membrane properties. This was evidenced by the lack of gas selectivity (O2/N2 ~ 0.86-1.2 and CO2/N2 ~ 0.94-1.1) even after patching the fibers and beaker units. If the fibers were selective, the selectivity values for these gas pairs should be close to the VDF-A.2 intrinsic selectivity of 3-4 for O2/N2 and 24-27 for CO2/N2. Interestingly, Beaker No. 4, which was prepared from fibers spun with 0.5% water as the second nonsolvent in the dope solution, had the highest permeances and was the only one with selectivities above unity. The addition of the water seemed to have marginally quickened the phase-separation (i.e., precipitation) kinetics during spinning. However, it was apparently still not fast enough to develop the desired skinned asymmetric fiber morphology needed for gas

3-30
selectivity. These properties are consistent with the SEM image in Figure 3-25 in which a much finer microporous fiber structure was formed but no clear selective skin layer could be seen.
Table 3-10. Pure-Gas Permeation Properties of Beaker Units Made with Developmental VDF-A.2 Hollow Fibers
Beaker device no.
Gas permeance (GPU) Selectivity
N2 O2 CO2 O2/N2 CO2/N2
1 2 3 4
36 140 115 200
32 120 99
230
34 130 114 214
0.89 0.86 0.86 1.2
0.94 0.93 0.99 1.1
Much development work therefore remains to transform the VDF-based copolymer platform into a hollow-fiber membrane with useful gas separation properties. Other membrane fabrication strategies will need to be investigated. There was nothing from the spin runs completed in this project to indicate that fibers with the desired membrane selectivity cannot be achieved with further development efforts.
3.4 Process Engineering and Design Efforts on designing a feasible post-combustion carbon capture membrane process first focused on
developing and identifying candidate process configuration options and their process flow schemes. After the “best” process configuration was determined, critical process parameters were then optimized to minimize the increase in levelized cost of electricity (COE). A detailed techno-economic analysis was then conducted on the optimized process design package integrated into a PC power plant.
3.4.1 Single-Stage Membrane Process To obtain a base case, a single-stage membrane process was modeled using the simulation tools
described in Section 2.4. As shown in Figure 3-27, the single-stage membrane process simulation was run for treating an 800,000-scfm flue-gas containing. 13% CO2 at 3-bar feed pressure and 1-bar permeate pressure. This flue-gas flow is representative of that for a 500-MWe PC subcritical power plant. The membrane properties used were CO2 permeance of 100 GPU and CO2/N2 selectivity of 35, which are typical for existing commercial gas-separation membranes. The CO2 removal was varied from 0 to 100% to determine the effect on required membrane area and CO2 product purity.
The single-stage membrane process simulation results are plotted in Figure 3-28. With increasing CO2 removal, the required membrane area increased, while permeate CO2 purity decreased. For 90% CO2 removal, the required membrane area for a single-stage process was very large (23 × 106 m2), and the CO2 purity of the CO2-rich permeate stream to be conditioned for sequestration was quite dilute at only 28.5%. These values are unacceptable for a feasible capture process. Thus, to improve separation process performance, membrane performance (properties) and process design and conditions must be modified.

3-31
Figure 3-27. Single-stage membrane process modeled (1 = feed; 2 = residue; 3 = permeate).
Figure 3-28. Required membrane area and achieved CO2 purity as a function of CO2 removal in a single-stage membrane operation.
3.4.2 Process Sensitivity Analyses The CO2 capture performance of the membrane process can be improved by modifying the process
conditions and/or membrane properties (both physical and chemical). It is thus important to understand the effects of process parameters and membrane properties on CO2 removal performance, required membrane area, and permeate CO2 purity. Process sensitivity analyses on key parameters, particularly pressure ratio, transmembrane pressure difference, membrane CO2 flux (permeance), membrane CO2/N2 selectivity, and feed CO2 concentration, were thus performed using single-stage membrane process simulations. For each parameter, the entire CO2 removal range (0-100%) was spanned.
For the sensitivity studies, the base-case assumptions came from the process conditions for the 550-MWe PC subcritical plant described in Case 9 of the DOE/NETL-2007/1281 report (Cost and Performance Baseline for Fossil Energy Plants – Volume 1: Bituminous Coal and Natural Gas to Electricity) [DOE/NETL, 2007]. The flue gas for the Case 9 plant had a flow rate of 5.1x10⁶ lb/hr at 1 atm and 135 °F. It contained 13.2% CO2.with N2 from the combustion air making up 66.4%. It was also saturated with water and had 40 ppmv SO2 following the wet flue-gas desulfurization step. Because excess air was used in the boilers to ensure complete coal combustion, about 2.34% O2 was also present in the flue gas. However, for simplicity in the sensitivity studies, a binary mixture of 13% CO2 and 87% N2 was used as the base-case flue-gas composition. The dimensions of the membrane hollow fibers used in the simulations were 350 µm OD, 200 µm ID, and 0.4 m length. The base-case membrane permeation properties used were CO2 permeance of 500 GPU and CO2/N2 selectivity of 35.
1
2
3
Flue gas FR = 800,000 scfm CO2 mole fraction = 0.13 Feed pressure = 3 bars Permeate pressure = 1 bar CO2 Perm = 100 GPU N2 Perm = 2.86 GPU Fiber OD = 150 µm Fiber ID = 100 µm Active fiber length = 0.4 m
0
5
10
15
20
25
30
35
40
0 10 20 30 40 50 60 70 80 90 100CO2 removal, %
Mem
bra
ne
area
x 1
0^6
m2
20
25
30
35
40
CO
2 p
uri
ty, %

3-32
Pressure Difference and Pressure Ratio. The pressure difference is defined as the difference in absolute pressure between the feed and permeate sides of the membrane. The pressure ratio is defined as the ratio of absolute pressure on the feed side to the absolute pressure on the permeate side. The effect of increasing pressure difference on CO2 removal, CO2 purity, and membrane area is given in Figure 3-29. The feed and permeate pressure values used in these simulations are given in Table 3-11. These conditions were chosen such that, for all cases, the pressure ratio was maintained constant at 3. It is evident from the plot that increasing pressure difference increases CO2 separation driving force and affects a proportional decrease in membrane area required for the same extent of CO2 removal. For example, for 90% CO2 removal, the membrane area needed was 6.6 ×10⁶, 3.3 ×10⁶, and 2.2 ×10⁶ m2 for a pressure difference of 2, 4, and 6 atm, respectively. However, changing pressure difference across the membrane does not seem to affect the permeate CO2 purity.
Figure 3-29. Effect of transmembrane pressure difference on CO2 removal, permeate CO2 purity, and required membrane area. (Solid lines – Membrane area; Dotted lines – CO2 purity).
Table 3-11. Process Conditions Used To Study Effect of Pressure Difference on Membrane Separation Performance
Pressure difference
(atm)
Feed pressure
(atm)
Permeate pressure
(atm)
Membrane area for 90% CO2
capture (MMm2)
Permeate CO2 purity (%)
2 3 1 6.6 28.6
4 6 2 3.3 28.6
6 9 3 2.2 28.5
Pressure ratio was another important process parameter studied. Table 3-12 shows the process
values used to obtain the plot in Figure 3-30. The pressure ratio was increased from 3 to 10, while keeping the pressure difference across the membrane constant at 2 atm in all cases. Hollow-fiber membrane characteristics were the same as that used in the earlier case.
20%
22%
24%
26%
28%
30%
32%
34%
36%
38%
40%
0
1
2
3
4
5
6
7
8
9
10
0% 10% 20% 30% 40% 50% 60% 70% 80% 90% 100%
CO2 purity, %
Membrane area, M
Mm2
CO2 capture, %
Effect of pressure difference across membrane
2 atm
4 atm
6 atm

3-33
It is evident from Figure 3-30 that increasing pressure ratio significantly improves permeate CO2 purity and lowers the required membrane area. For 90% CO2 removal, as pressure ratio increased from 3 to 10, the required membrane area decreased from 6.6 to 3.1 MMm2, while the permeate CO2 purity increased from 28.6% to 47.8%. This was due to the increased CO2 partial-pressure driving force for the removal of CO2. When the pressure ratio was increased for a constant pressure difference, the CO2 partial pressure changed drastically, thereby increasing CO2 removal and CO2 purity.
Additionally, pressure ratio was increased by lowering the feed pressure and applying vacuum on the permeate side. Because flue gas is the largest stream, any reduction in pressure will lead to significant power savings, whereas applying a permeate vacuum to a much smaller stream would seem manageable. If the adiabatic efficiency of both compression and vacuum is assumed to be 80%, the resulting power consumption numbers are given in Table 3-12 as the “high efficiency” case. It is observed that, for a modest power consumption increase, significant improvements in permeate CO2 purity and membrane area requirement were possible. However, vacuum processes are not as efficient as compression processes. Industrial vacuum pumps have been reported to have a maximum isentropic efficiency of only 45%. Using this “low efficiency” number, the power consumption for vacuum cases increased rapidly for the high pressure-ratio cases and posed an optimization problem where the benefits of increased purity and decreased membrane area requirement must be optimized against the increased power consumption.
Table 3-12. Process Conditions Used To Study Effect of Pressure Ratio on Membrane Separation Performance
Pressure ratio (atm)
Feed pressure
(atm)
Permeate pressure
(atm)
Membrane area for 90% CO2 capture
(MMm2)
Permeate CO2 purity (%)
Power consumption (MWe)
High efficiency
Low efficiency
3 3.0 1.0 6.6 28.6 94.0 94.0
5 2.5 0.5 4.73 37.2 93.9 109.5
10 2.2 0.22 3.15 47.8 99.3 129.5
Figure 3-30. Effect of pressure ratio on CO2 removal, permeate CO2 purity, and required membrane area. (Solid lines – Membrane area; Dotted lines – CO2 purity).
20%
25%
30%
35%
40%
45%
50%
55%
60%
65%
70%
0
1
2
3
4
5
6
7
8
9
10
0% 10% 20% 30% 40% 50% 60% 70% 80% 90% 100%
CO2 purity, %
Membrane area, M
Mm2
CO2 capture, %
Effect of pressure ratio across membrane
3
5
10

3-34
Membrane Properties. In addition to process conditions, membrane properties are crucial in developing an attractive CO2 removal process. The two key membrane properties to consider are gas flux (permeance) and gas selectivity. Gas permeance facilitates the removal of a gas from the feed and is a measure of membrane productivity. Selectivity dictates the favorability (efficiency) of the membrane for removing one component over another. The effect of gas permeance was examined by using CO2 permeance values of 300 GPU, 500 GPU and 1,000 GPU while keeping the CO2/N2 selectivity constant at 35. The results are plotted in Figure 3-31. Similar to the pressure-difference sensitivity analysis, membrane area requirement changes proportionally with the change in CO2 permeance, while permeate CO2 purity remains essentially unchanged. Thus, increased CO2 permeance helps to mainly lower membrane capital cost by decreasing the membrane area requirement.
The effect of CO2/N2 selectivity was studied by changing N2 permeance and maintaining a constant 500-GPU CO2 permeance. Three CO2/N2 selectivity values of 25, 35 and 50 were modeled. From Figure 3-32, increasing the CO2/N2 selectivity increases the permeate CO2 purity. Similar to the pressure-ratio case, improved CO2/N2 selectivity also lowers the membrane area demand. However, over the range studied in this plot, the variations seem modest. Changing pressure ratio changes the separation driving force and can lead to a direct improvement in membrane process separation performance. However, changing selectivity, a kinetic term, ensures increased utilization of the driving force chosen for the process. This means that the improvement achievable by increasing membrane selectivity is always going to be limited by the operating pressure ratio.
Figure 3-31. Effect of CO2 permeance on CO2 removal, permeate CO2 purity, and required membrane area. (Solid lines – Membrane area; Dotted lines – CO2 purity).
20%
22%
24%
26%
28%
30%
32%
34%
36%
38%
0
2
4
6
8
10
12
14
16
18
0% 10% 20% 30% 40% 50% 60% 70% 80% 90% 100%
CO2 purity, %
Membrane area, M
Mm2
CO2 capture, %
Effect of CO2 permeance(Selectivity constant)
300 GPU
500 GPU
1000 GPU

3-35
Figure 3-32. Effect of CO2/N2 selectivity on CO2 removal, permeate CO2 purity, and required membrane area. (Solid lines – Membrane area; Dotted lines – CO2 purity).
Feed CO2 Concentration. Another important process parameter is the feed concentration of CO2. For the same feed pressure, increasing the feed CO2 concentration increases the feed partial pressure of CO2. Three feed CO2 concentrations (11, 13, and 15%) were studied. As shown in Figure 3-33, although increasing feed CO2 concentration over this range does not significantly change the membrane area requirement, it does substantially increase the permeate CO2 concentration. The feed CO2 concentration will be decided by the operation of the boiler and is usually around 13%. Thus, based on this sensitivity analysis, process configurations enabling an increase in flue-gas CO2 concentration will be a critical part of the membrane process development strategy.
Figure 3-33. Effect of feed CO2 concentration on CO2 removal, permeate CO2 purity, and required membrane area. (Solid lines – Membrane area; Dotted lines – CO2 purity).
3.4.3 Multistage Membrane Process Development The parameters investigated in the sensitivity analyses were varied from modest to highly optimistic
values. For 90% CO2 removal with a single-stage process, maximum permeate CO2 purity achieved was
18%
21%
24%
27%
30%
33%
36%
39%
0
2
4
6
8
10
12
14
0% 10% 20% 30% 40% 50% 60% 70% 80% 90% 100%
CO2 purity, %
Membrane area, M
Mm2
CO2 capture, %
Effect of CO2/N2 selectivity(CO2 permeance = 500 GPU)
25
35
50
18%
21%
24%
27%
30%
33%
36%
39%
42%
45%
48%
0
1
2
3
4
5
6
7
8
9
10
0% 10% 20% 30% 40% 50% 60% 70% 80% 90% 100%
CO2 purity, %
Membrane area, M
Mm2
CO2 capture, %
Effect of CO2 conc. In feed
11vol%
13vol%
15vol%

3-36
only 30-50%, and the lowest required membrane area was about 2.5 × 10⁶ m2. To improve membrane process performance for flue-gas CO2 capture, multistage membrane process configurations were investigated to obtain the targeted 90% CO2 removal with a concentrated, high-purity CO2 stream ready for sequestration, and the sensitivity analysis results from Section 3.3.2 were used to guide the multistage process designs.
In general, a membrane-based process to capture flue-gas CO2 is expected to consume power at various process operations. For example, some probable power transfer processes anticipated are
Compression of flue-gas feed from near-atmospheric pressure to the design feed pressure for first membrane system in a multistage process scheme
Compression of feed to additional downstream membrane systems in a multistage process scheme
Compression of captured (permeate) CO2 stream to sequestration pressure (~2,200 psia)
Vacuum applied to permeate side of membrane system(s), if appropriate
Power recovery from expansion of high-pressure streams
Process development was conducted using a binary CO2/N2 mixture with 13% CO2. Membrane properties were assumed to be CO2 permeance of 500 GPU and CO2/N2 selectivity of 35. To evenly compare the different process configurations with each other, the flue-gas was compressed to 65 psia in all cases.
Single-Stage Design. As a baseline, a single-stage membrane process (e.g., Figure 3-27) was modeled to capture 90% of CO2 from flue gas equivalent to a 550-MWe power plant. The flow rate used was 179,211 lbmol/h. The flue-gas compressor was assumed to have an isentropic efficiency of 85% and a mechanical efficiency of 90%. Compressing the flue gas from atmospheric pressure to 65 psia consumed 125 MW of electricity. Around 66.8% of the flue gas exited the membrane stage as retentate and was expanded in a turboexpander. Assuming an isentropic efficiency of 75% and a mechanical efficiency of 90%, the turboexpander enabled the recovery of 31.5 MW of electricity. Thus, the single-stage membrane process design required a net 93.5 MW of electricity. The single-stage membrane area required was 3.0 MMm2 for 90% CO2 capture and resulting permeate CO2 purity of 35%.
Two-Stage Design. As illustrated in Figure 3-34, the two-stage membrane process design evaluated used a second membrane stage M2 to further concentrate the CO2 captured in the permeate stream from the first membrane stage M1. To achieve 90% CO2 capture in this two-stage design, each stage was operated at ~95% CO2 stage-cut. This higher stage-cut in the first M1 stage resulted in a permeate stream with CO2 purity of 32%, three percentage points lower than the single-stage case. The M1 permeate, which was at atmospheric pressure, was then compressed to 65 psia and fed to the M2 stage operated at a 95% CO2 stage-cut. The resulting captured CO2 stream from M2 had a purity of 64%, significantly higher than what was possible with the single-stage scheme. The total membrane area needed by the two-stage scheme was 4.6 MMm2, of which 3.6 MMm2 was for the M1 stage and 0.95 MMm2 was for the M2 stage. The power consumed by the flue-gas compressor for M1 was the same as the single-stage case (125 MWe). The compressor for M2 treated a gas stream that was 40% of the flue-gas flow and consumed 47.7 MWe. The M1 and M2 retentate streams in the two-stage design were combined and sent to the expander. The energy recovered in the expander was 39.2 MWe. As a result, the net electricity consumption for the two-stage approach was 133.5 MWe. At the expense of an additional 1.6 MMm2 of membrane area and 40 MWe of power consumption, the captured CO2 stream purity was increased from 35 to 64%.

3-37
Figure 3-34. Flow scheme of basic two-stage membrane process modeled.
The enrichment of CO2 in the permeate streams was limited due to the high stage-cut operation of the M1 and M2 stages. The purity of the captured stream could be improved by increasing the pressure ratio used in M1 and M2; however, power consumption would be significantly increased. Additionally, due to the low CO2 purity of the M1 permeate fed to the M2 stage, the volume of M2 feed flow was quite high, translating into significantly higher compression cost to achieve a higher pressure ratio in M2.
One alternative two-stage configuration is to recycle the M2 retentate back to M1. This would allow operation of the M2 stage at a lower stage-cut. This recycle stream would raise the feed CO2 concentration to M1and enhance CO2 pressure driving force in this first stage. In turn, this extra CO2 fed to the first stage would also allow operation of M1 at a lower effective stage-cut.
Simulation of the two-stage process with recycle did yield a higher captured CO2 purity of 76.2%. The M1 and M2 stages were operated at a CO2 stage cut of 92.7% and 73.3%, respectively. The membrane area requirement increased modestly from 4.6 to 4.9 MMm2. Although the M2 retentate was still at high pressure and did not need to be compressed, the additional CO2 permeating the M1 stage did need compression and, hence, increased the power consumption of the M2 feed compressor by 11 MWe to 58.6 MWe. Because the captured stream now had less N2, the difference was sent to the expander and resulted in a modest increase in power recovery from 39.2 to 40.5 MWe. Thus, the net power consumption of this process was 143.1 MWe. The recycle configuration increased the purity of the captured CO2 stream from 64% to 76.2% at the expense of an extra 0.3 MMm2 membrane area and 10 MWe of power consumption. The initial percentage-point increments in CO2 purity could be obtained with a modest increase in power consumption. However, past a certain point, the power consumption requirement increased rapidly. Thus, the two-stage process with recycle is not optimum, and the capture membrane process scheme must be modified further.
Three-Stage Design. Recycle of the M2 retentate stream helped to significantly improve purity of the captured CO2 stream by enabling operation of the second M2 membrane stage at a lower CO2 stage-cut. Although this adjustment also allowed a lower CO2 stage-cut to be used in the first M1 stage, the stage-cut reductions were not enough to make a significant difference in the permeate CO2 purity. Thus, the addition of a third membrane stage M3 to the two-stage with recycle configuration was examined.
For example, the M3 membrane stage could treat the still pressurized (65 psia) M1 retentate further. However, the CO2 purity of the M1 retentate stream was only 2% and concentrating it up to 13% with the third membrane stage would only be possible at low CO2 stage-cut. Thus, no significant improvements were observed using a third membrane stage as is.
RTI
M12
3
4
RTI
M2
C2
C1
1
5
6
7

3-38
One strategy for increasing the CO2 permeation driving force in the M3 membrane stage was to utilize a permeate-side sweep gas flow. A good choice as sweep gas for this post-combustion capture application would be the secondary air used in the boiler. This CO2-free air sweep would lower (dilute) the CO2 concentration on the permeate side of M3, acting like vacuum, and thus increase the CO2 separation driving force in M3. This CO2–enriched air sweep would be sent to the boiler as secondary air for coal combustion. The permeate-sweep approach helps to enhance the process performance in two ways. First, by improving the permeation driving force, the sweep significantly lowers the M3 membrane area requirement. Second, by recycling the CO2–enriched air sweep exiting M3 to the boiler, the CO2 concentration of the resulting flue gas produced is also higher, which is highly desirable based on the earlier process parameter sensitivity studies.
By using the above process modifications, the three-stage membrane process shown in Figure 3-35 was simulated. In this process scheme, the M1 and M2 membrane stages were run at a CO2 stage-cut of 63.4% and 57.6%, respectively, which are significantly lower than the operating stage-cuts in the two-stage process. With the three-stage configuration shown, a captured stream with a much higher CO2 purity of 95.6% was produced. Because the CO2–enriched permeate air sweep leaving the third membrane stage M3 was recycled back to the M1 stage at atmospheric pressure, the amount of gas that had to be compressed by the flue-gas compressor increased by 19%. As a result, the power consumed by the flue-gas compressor increased to 150.3 MWe. However, because the M1 permeate stream fed to M2 was now more concentrated in CO2, the M2 feed compressor consumed only 39.9 MWe. The amount of electricity recovered in the expander was 41.8 MWe. Thus, the net electricity consumed by the three-stage capture process in Figure 3-35 was 148.4 MWe for 90% CO2 removal and 95.6% CO2 product purity. Furthermore, this performance was achieved with a significantly lower membrane area requirement of 3.4 MMm2.
Figure 3-35. Flow scheme of RTI three-stage capture membrane process modeled.
6
13
7
3
4
10
14
5
12
11
17
18
8
9
2A
19
1
2444
2B
MX2C1
C2
C3
HX1
HX2
HX3
EX1
RTI
M1
RTI
M2
RTI
M3
DECOMP
COMBUST
SEP
HX4
HX6
MX3
SEP2 16
15
Pulverized Coal Combustion Power Plant
CO2 compression and dehydration

3-39
Four-Stage Design. In the three-stage membrane scheme, the high-pressure M2 retentate was recycled back as feed to the M1 stage. Compression of this recycle stream was not necessary as the retentate stream was already pressurized and could hence be mixed with the compressed M1 feed stream. As mentioned earlier, this recycle strategy had two main advantages. First, it allowed operation of M2 at a lower stage-cut, thereby increasing the CO2 purity of the M2 permeate stream. Second, it helped to raise the CO2 concentration in the M1 feed stream and enhance the CO2 permeation driving force. To explore the possibility of further increasing the feed CO2 concentration to M1, a fourth membrane stage M4 was added to further concentrate the CO2 present in the recycled M2 retentate. However, after going through M4, the more CO2-enriched recycle stream was only available at atmospheric pressure and had to compressed through the flue-gas compressor, leading to additional power usage without much compensating benefit. Because of the increase in both membrane area and power consumption, it was concluded that the four-stage process scheme did not offer any advantages warranting its further study.
Therefore, the three-stage capture membrane process design configuration illustrated in Figure 3-35 was identified to be the most feasible for further process development and optimization.
3.4.4 Effect of Flue-Gas Contaminants Process simulations thus far used a flue-gas feed consisting of the two primary components, CO2 and
N2. Actual power-plant flue gas, however, also has other species such as O2, SO2, and H2O vapor. To understand the effect of these flue-gas contaminants on the CO2 capture membrane process performance, process simulations were run by adding these species individually and in combination to the flue-gas feed for the three-stage membrane process configuration operated at the conditions indicated earlier.
Presence of Oxygen (O2). The presence of O2 was simulated by assuming a flue-gas feed with 13% CO2, 3% O2, and balance N2. A membrane O2/N2 selectivity of 6 was used. This selectivity is consistent with the data obtained for this gas pair on the Generon polycarbonate-based membranes. Correspondingly, an O2 permeance used in the modeling was 85 GPU. Simulations were performed using the three-stage membrane process scheme and the process conditions described earlier. Key simulation results obtained for 90% CO2 removal for flue gas with and without O2 are compared in Table 3-13. While the membrane area requirement was similar for both cases, the power requirement increased by 8 MW for the O2-containing flue gas. Because the additional co-permeation of O2 through each membrane stage increased the volume of the resulting permeate stream, the power required to compress this stream to the next desired pressure also increased, thereby leading to the overall rise in power consumption. Moreover, the O2 co-permeation also resulted in a captured stream containing ~4.2% O2 and, hence, a lower CO2 purity of ~92.3% rather than 95.6%.
Table 3-13. Process Simulation Results With and Without O2 for 90% CO2 Capture
Flue-gas O2 conc. (%)
CO2 conc. in captured stream
(%)
O2 conc. in captured stream
(%)
Membrane area (MMm2)
Power consumption
(MW)
0 95.6 0 3.4 148
3 92.3 4.2 3.4 156
Presence of Water (H2O) Vapor. The presence of H2O vapor was simulated by assuming a flue-gas
feed with 13% CO2, 10% H2O, and balance N2. The water concentration used is representative of flue-gas exiting a dry flue-gas desulfurization (FGD) step. Relative to other molecules, water typically has the highest permeance (permeability) and, hence, highest selectivity in almost all polymer membranes because of its small size (which gives it high diffusivity) and high condensability (which gives it high solubility in the membrane matrix) [Sijbesma, 2008]. For the simulations, the H2O permeance used was

3-40
10,000 GPU. All other simulation conditions used were the same as those used for the oxygen-containing flue-gas case above.
The second row in Table 3-14 represents the same process as the binary flue-gas mixture except that 10% water was added. No changes to the process were made to target specific CO2 removal or purity. Nearly all the feed water vapor was co-transported across the membrane into the permeate. The presence of water diluted the permeate CO2 concentration, thereby lowering CO2 partial pressure and increasing the CO2 permeation driving force. The CO2 removal observed in such a situation was 93.5% relative to 90% in the dry binary mixture case. Due to the high water-vapor permeance, the capture stream consisted of 5.8% water, which decreased the captured CO2 purity from 95.6% to 90.3%. However, almost all of this water would be removed in the downstream CO2 compression and drying step before sequestration. Thus, the CO2 concentration of the dry capture stream would be 95.8%. This process used 149 MW of electricity. Because CO2 capture and purity targets were exceeded in this case, the presence of flue-gas water vapor is beneficial to process performance and presents a route for lowering membrane area and/or power consumption of the CO2 separation process.
Table 3-14. Effect of H2O Vapor in Flue-Gas Feed on Simulation Results for 90% CO2 Removal
Flue-gas H2O content
(%)
CO2 capture
(%)
CO2 conc. in captured stream
(%)
H2O conc. in captured stream
(%)
Membrane area
(MMm2)
Power consumption
(MW)
0 90.0 95.6 0 3.4 148
10 93.5 90.3 5.8 3.4 149
10 90.3 90.0 5.9 3.0 142
A wet flue-gas simulation that specifically targeted 90% CO2 removal with dry capture stream purity of 95% CO2 was conducted, and the results are shown in the third row in Table 3-14. It is worth noting that membrane area requirement was lowered by 0.4 MMm2 and power consumption was lower by 7 MWe.
Presence of O2, H2O, and SO2 (Simulated Flue Gas). To examine the concomitant effect of multiple flue-gas contaminants on CO2 capture performance of the three-stage membrane process, simulations were conducted with a multicomponent flue-gas composition of 13% CO2, 10% H2O, 3% O2, 40 ppmv SO2 and balance N2. Based on the SO2/N2 selectivity of ~40 measured experimentally for Generon’s polycarbonate-based membrane fibers, the SO2 permeance used in these simulations was 570 GPU. The permeance values used for the other gases were the same as those used in the previous simulations. The gaseous species O2, SO2, and moisture, which have higher permeance than N2, also preferentially permeate into the CO2 capture stream because the process is designed to concentrate gases with higher permeance than N2.
Table 3-15 compares the simulation results for the multicontaminant flue-gas feed (second row) to that for the idealized binary flue-gas feed of only CO2 and N2 (first row) without making any changes to the process. Clearly, the captured stream became enriched in oxygen as well as SO2 (270 ppm), which further lowered the amount of SO2 emitted by the power plant. Because the permeate streams had oxygen, sulfur dioxide and water in them, an increase in power consumption was observed. The CO2 purity of the dry capture stream was 92.1% in this first simulation pass. By adjusting the operating CO2 stage-cuts in the three membrane stages M1, M2, and M3, the CO2 purity of the dry capture stream was increased to 95%. For the target 90% CO2 removal with 95% permeate CO2 purity, the required membrane area increased to 3.2 MMm2 and power consumption to 160 MWe.

3-41
Table 3-15. Effect of Multiple Flue-Gas Contaminants on Three-Stage Capture Membrane Process Performance for 90% CO2 Removal
Feed
Species concentration in captured stream Membrane area
(MMm2)
Power consumption
(MW) CO2 conc.
(%) O2 conc.
(%) H2O conc.
(%) SO2 conc.
(ppm)
Binary CO2/N2 95.6 0 0 0 3.0 148
Multicomponent flue gas*
86.4 4.1 6.2 270 3.0 150
Multicomponent flue gas*
88.6 3.0 6.5 276 3.2 160
* Multicomponent flue gas composition of 13% CO2, 3% O2, 10% H2O, 40 ppm SO2, and balance N2.
3.4.5 Simplified CO2 Capture Cost Estimation Methodology for Process Optimization
Plant Sizing/Costing Philosophy. The CO2 capture membrane process was assumed to be an add-on to the base PC subcritical power plant detailed in Case 9 of the DOE/NETL-2007/1281 report (Cost and Performance Baseline for Fossil Energy Plants – Volume 1: Bituminous Coal and Natural Gas to Electricity) [DOE/NETL, 2007]. Power required to operate the capture process was considered to be part of the auxiliary load and was received from the plant. Thus, the net power output of the plant was reduced by the power required to operate the capture process. The flue-gas emission flow rate for the base power plant without carbon capture in Case 9 was 179,211 lbmol/h (11.7 × 10⁵ scfm). The capital cost of the capture membrane process was added to the Case 9 power plant cost to get the total plant cost for a coal power plant with membrane-based carbon capture. The basis for estimation of equipment costs in our calculations is given in Table 3-16.
Table 3-16. Basis Used for Major Equipment Cost Estimation for Capture Membrane Process
Equipment Cost
Compressors $320/kW Turboexpanders $150/kW Membrane module $21.5/m2 CO2 compressor and drying $30MM Plant installation factor 2.0x
Estimation of $/Ton-CO2 (captured and avoided). The performance of CO2 capture processes is usually quantified in terms of the levelized cost of electricity (LCOE) and the increase in LCOE as compared to a power plant case without CO2 capture. However, the estimation of LCOE values involves many factors, including increase in power plant capacity, labor costs, maintenance, etc. For the purpose of optimizing the capture membrane process, which entails a relative comparison between processes, such an elaborate LCOE estimation exercise is not necessary at this point.
In the process optimization effort, a simplified method of estimating the CO2 capture (separation) cost, represented as $/ton-CO2, was used. The two main parameters involved in estimating $/ton-CO2 are energy consumption and installed capital cost of the capture plant. As described earlier, the power consumed by compressors was calculated using a three-stage compressor with an isentropic efficiency of 84% and a mechanical efficiency of 90%. Similarly, power generated in a turboexpander was estimated

3-42
using an isentropic efficiency of 75% and a mechanical efficiency of 90%. The power consumed by the CO2 compressor was estimated based on Case 10 in the DOE/NETL-2007/1281 report [DOE/NETL, 2007]. (Case 10 was for a net 550-MWe coal power plant with CO2 removal using the commercial Econamine process.) Table 3-16 summarizes the assumptions used to estimate the installed capital cost of the membrane-based CO2 capture plant.
The $/ton-CO2 cost was computed using
$ton‐CO2
P T E 0.178 C
FCO2 T
where P is the power [MWe] consumed by the carbon capture process, T is the total plant capacity factor (i.e., annual operating hours) [h/yr], E is the cost of electricity [$/MWh], C is the installed capital cost [$] of the capture plant, and FCO2 is the mass flow rate [ton/h] of the captured CO2. The factor of 0.178 in the above equation represents the capital charge factor for a 20-year levelized period for a process with minimal or no industrial experience [DOE/NETL, 2007]. For the capture cost estimation, a plant capacity factor of 85% (equivalent to 7,446 h/yr) was used. The cost of electricity used was $60/MWh, which was obtained from the IEA energy outlook on electricity prices for industrial applications.
The above cost estimation philosophy was applied to the muticontaminant flue-gas case discussed in Section 3.4.4 for 90% CO2 capture with 95% CO2 purity in the moisture-free capture stream by using the three-stage process scheme. The total installed capital cost for the capture plant was $342 million. Thus, the annual contribution of the capital cost, using the capital charge factor, was $60.9 million. The 160-MWe power consumption given in the earlier analysis did not include the power consumed by the CO2 compressor for pressurizing and drying the captured CO2 stream to sequestration conditions. When this CO2 compressor was taken into account, the total power requirement increased to 206.9 MWe so that the annual cost of power consumption was $92.4 million. Thus, the estimated cost of CO2 capture with the three-stage process configuration was estimated to be $42.1/ton-CO2.
3.4.6 Process Optimization To model the effect of an actual flue-gas composition on the effectiveness of the CO2 capture
membrane process, the AspenPlus flowsheet used for process optimization incorporated coal combustion into the three-stage membrane process scheme shown in Figure 3-35. Coal properties used for the simulations were similar to that of Illinois No. 6 (Herrin) mined from Old Ben Mine, the properties of which were mentioned in the DOE/NETL-2007/1281 report [DOE/NETL, 2007]. Wet FGD was used to remove 98% of the sulfur from the combustor flue-gas. The flue gas exiting the wet FGD process during coal combustion without CO2 capture in our model was 13.2% CO2, 2.3% O2, 17.1% H2O, 67.4% N2, and 38.2 ppm SO2. The performance of the three-stage membrane process scheme was evaluated using this post-wet FGD flue-gas composition, and the resulting steady-state flue-gas composition leaving the wet FGD for coal combustion with CO2 capture incorporated was 19.6% CO2, 0.7% O2, 15.5% H2O, 64.2% N2, and 53 ppm SO2.
Membrane Stage-Cut Optimization. The plots presented in Sections 3.4.1 and 3.4.2 show that the permeate CO2 purity decreases with increasing CO2 removal. This extent of removal is related to the operating stage-cut for the membrane process. (Stage-cut is defined as the ratio of the permeate flow rate to feed flow rate.) Hence, to achieve high permeate CO2 purity, the membrane process must be operated at low CO2 stage cuts. However, operating at low stage-cuts increases the volume of the retentate recycle streams and, hence, the need to recompress a portion of these streams. Low-stage-cut operation also makes it difficult to obtain the targeted overall high 90% removal of CO2 from the flue-gas feed.

3-43
Therefore, it is important to understand the subtle effects of changing CO2 stage-cut in the different membrane stages of the three-stage membrane scheme on CO2 capture process cost.
Process simulations were performed to find the optimum balance of stage-cuts at which to operate the M1, M2, and M3 membrane stages in the three-stage process design. In these modeling cases, the CO2 removal and the CO2 purity of the captured stream were maintained at 90% and 95%, respectively. As discussed in Section 3.4.5, the total power consumed by this three-stage CO2 separation (capture) process and the downstream captured CO2 compression process was already in excess of 200 MWe. Simulations were hence conducted at a feed pressure of 65 psia to each membrane stage. Pressures higher than this would raise the power requirement too much, while pressures lower than this would not provide an efficient CO2 permeation driving force that would benefit from the membrane CO2/N2 selectivity of 35. In the simulations, to meet the 90% removal and 95% purity performance targets, the CO2 stage-cut in the second membrane stage M2 was increased as CO2 stage-cut in the first membrane stage M1 was decreased. These M1 and M2 stage-cut changes only led to small adjustments required for the M3 stage-cut. The simulation results are summarized in Table 3-17. Optimization of the membrane stage-cuts changes resulted in a reduction to membrane cost (i.e., required membrane area) and power usage. By decreasing the CO2 stage-cut in M1 from 69% to 44%, the total membrane cost decreased by 35%. The power consumption also decreased by 7 MWe, which decreased the estimated capture cost by ~7% from $41/ton-CO2 to $38/ton-CO2.
Table 3-17. Effect of Stage-Cut on Estimated CO2 Capture Cost for 90% CO2 Removal with Three-Stage Membrane Process
CO2 stage-cut (%) CO2 puritya of captured
stream (%)
Membrane costb
($MM)
Power consumption
(MW)
Capture cost ($/ton-CO2)
M1 stage
M2 stage
M3 stage
69 61 59 52 44
54 68 72 80 89
88 89 90 92 93
95.8 94.8 94.8 94.8 94.9
26.6 24.7 23.2 21.2 17.3
193 187 186 185 186
41.0 38.9 38.6 38.2 38.2
a CO2 purity of dry capture stream (after complete removal of water). b Assumed $1/ft2 membrane cost.
3.5 Techno-economic Analysis The high capital and operating costs of CO2 capture will affect the deployment of capture
technologies in coal plants. Therefore, a detailed techno-economic analysis of the three-stage membrane-based CO2 capture process was conducted to understand the economic implications of incorporating this capture process into a subcritical PC power plant. The most important metric in this study was the LCOE and the percentage increase in LCOE. The techno-economic evaluation took a more detailed approach for estimating power consumption, sizing and costing equipment, and estimating total plant cost. An overview of this analysis approach is described below.
Key assumptions that formed the basis of the analysis were
Net power plant capacity maintained at 550 MWe for the CO2 capture case (i.e., no plant de-rating)
Equipment cost estimates based on Aspen Icarus database

3-44
Membrane module fabrication and installation cost estimates based on partner Generon’s manufacturing costs for similar commercial membranes and modules
Replacement of membrane modules every 10 years
Capture-plant installed cost estimated using DOE/NETL-2007/1281 report [DOE/NETL, 2007] and industry standards
Power-plant installed cost estimated using Cases 9 and 10 (i.e., power plants without and with carbon capture, respectively) in DOE/NETL-2007/1281 report [DOE/NETL, 2007]
The membrane properties used in the techno-economic analysis are given in Table 3-18. In particular, the CO2 permeance and CO2/N2 selectivity used were 400 GPU and 35. These are the properties of the next-generation polycarbonate hollow fibers, which still possessed the better combination of CO2/N2 separation properties, manufacturability, and reproducibility at the end of this project relative to the new developmental VDF-based hollow-fibers. Though attractive with respect to their chemical and oxidative resistance and better intrinsic gas separation properties than that of the base homopolymer, the new VDF-based fibers will need additional development time to transform them into high-performing gas-separation membranes.
Table 3-18. Membrane Properties Used for Techno-economic Analysis
Gas Permeance (GPU)
CO2 400 N2 11.4 O2 69
SO2 450 H2O 10,000 Ar 11.4
The capture performance targets used in the techno-economic evaluation of the three-stage process scheme (Figure 3-35) were 90% removal of the CO2 present in the power-plant flue gas and 95% CO2 purity in the resulting capture stream for sequestration. The secondary air used in the boiler had 26% CO2, leading to an exiting flue-gas CO2 concentration of 20.2%. This flue gas exiting the wet FGD was then compressed to 70 psia while maintaining its exit temperature at 100 °F (38 °C) via cooling in a heat exchanger. The compressed flue-gas stream was mixed with the retentate stream from the second membrane stage M2. Because this M2 retentate stream contained 45.6% CO2, the resultant stream to the first membrane stage M1 had a CO2 concentration of 24.4%.
The M1 stage was operated at an overall stage-cut of 25.4% and a CO2 stage-cut of 68%. The M1 retentate stream was routed to the third membrane stage M3, which used the secondary air fed to the boiler as sweep gas on its permeate side. About 87% of the feed CO2 was removed in the M3 stage. The M1 permeate stream, with a CO2 concentration of 65%, was further compressed from atmospheric pressure to 70 psia in the second stage compressor to M2, and this compressed gas temperature was maintained at 100 °F (38 °C). This stream entered the M2 stage operating at an overall stage-cut of 40% and a CO2 stage-cut of 58%. The CO2 concentration of the capture stream (i.e., the M2 permeate) was 94.8% which was further compressed and dried to meet capture-stream pressure and dew point specifications for sequestration.
3.5.1 Power Consumption To provide a common basis for comparison between PC power plants with and without CO2 capture,
process evaluations were done for a constant net plant output of 550 MWe per the guidelines of the DOE/NETL-2007/1281 report [DOE/NETL, 2007]. That is, in the analysis of a plant with carbon capture,

3-45
the plant’s gross output was increased to bear the energy demand of the capture process. Compared to Case 9 in the DOE/NETL-2007/1281 report, the power plant with the three-stage membrane CO2 capture process consumed 46% more coal, which was equivalent to a power plant with 805-MWe capacity, because the capture process required electricity equivalent to 255 MWe. The pie chart in Figure 3-36 presents the normalized power-consumption distribution for the membrane CO2 capture process.
Figure 3-36. Normalized power-consumption distribution for the three-stage membrane CO2 capture process.
The CO2 capture process consisted of CO2 separation followed by a CO2 compression and drying step to make the captured CO2 stream sequestration-ready. The CO2 separation consumed 80% of the electricity requirement (net 204 MWe) of the overall capture operation. The CO2 compression and drying process used the remaining 20% of the required total capture power (51 MWe), as estimated using Case 10 in the DOE/NETL-2007/1281 report [DOE/NETL, 2007] as the basis.
For the CO2 separation process, the actual electricity consumption was 259 MWe, accompanied by the production and recovery of 55 MWe from the pressurized M3 retentate stream in a turboexpander. The M3 retentate was expanded to 0.1 psig in a turboexpander with assumed isentropic efficiency of 75% and mechanical efficiency of 90%. To boost the feed CO2 partial pressure to the M1 and M2 membrane stages in the separation step, two compressors were used. Power consumed by these compressors was calculated using an isentropic efficiency of 84%, an assumption similar to that made for the CO2 compressor in the DOE/NETL-2007/1281 report [DOE/NETL, 2007]. Although the report did not mention the compressor mechanical efficiency assumed, we used a compressor mechanical efficiency of 90% in our process analysis. Based on these assumptions, the power demand was 197 MWe for the M1 flue-gas compressor and 57 MWe for the M2 compressor. About 5 MWe in the CO2 separation step was also consumed by other operations, including the M3 sweep-air blower, cooling-tower fan, and cooling-tower pump. The power requirement of these equipment are summarized in Table 3-19 below.
3.5.2 Equipment Costs The heat and mass balances generated using AspenPlus for the three-stage membrane CO2 capture
process were used to size the individual equipment and cost them in Aspen Icarus. The cost estimates for the major individual equipment are given in Table 3-19.
The majority of the equipment costs for the membrane capture process came from the cost of compressors. The M1 flue-gas compressor required to boost the pressure (and driving force) for CO2 separation was the most expensive equipment and costed $145.9 million, which represented 51% of the total major equipment costs. The cost of the M2 feed compressor was about 26% of the flue-gas compressor cost because it was smaller, processing a gas stream that was less than a third of the flue-gas stream. For these two compressors, the normalized equipment cost used was in the range of $670-740/kW. The cost of the CO2 compressor in the compression/drying step was estimated using Case
61.0%17.6%
1.5%
20.0%Flue‐gascompressor
Stagecompressor
Other
CO2
compressor

3-46
10 from the DOE/NETL-2007/1281 report [DOE/NETL, 2007] as the basis. In Case 10, the equipment cost for a CO2 compressor consuming 51.6 MWe was $28.6 million, which gave a normalized equipment cost for the CO2 compressor of $560/kW.
Table 3-19. Power Requirement and Cost of Major Equipment in Three-Stage membrane Capture Process
Equipment Power consumption
(MWe) Equipment cost
($MM)
M1 flue-gas compressor 197 145.9 M2 feed compressor 57 38.1 Membrane modules — 45.2 Gas expander -55 18.6 M3 sweep-air blower 4 2.6 Cooling tower 1 6.5 CO2 compressor 51 28.6
The hollow-fiber membrane and membrane module manufacturing cost estimates were provided by Generon, the project’s industrial membrane partner. On the basis of their scale-up and manufacturing experience, Generon estimated that, for large-scale manufacture, the capture membranes would cost about $1/ft2 and the installed cost of membrane modules would be $2/ft2. Based on this estimate, the installed cost of membrane modules for the RTI three-stage membrane capture plant was thus $45 million, about 16% of the total major equipment costs. Cumulatively, the total equipment cost of the RTI three-stage membrane CO2 capture plant was estimated to be $285.5 million. If an installation factor of 2 was assumed, the total installed cost of the membrane capture plant was $571 million.
As mentioned earlier, the size of the power plant was increased by 46% to compensate for the capture plant energy demand. Comparison of the power-plant installed capital costs between Case 9 and Case 10 in the DOE/NETL-2007/1281 report [DOE/NETL, 2007] indicated a power-plant scale-up factor of 0.67. This resulted in an installed cost of $1,099 million for the larger 805-MWe power plant in our analysis. Thus, the total installed capital cost of a net 550-MWe power plant with the three-stage membrane CO2 capture process totaled $1,670 million.
3.5.3 Levelized Cost of Electricity (LCOE) The LCOE was calculated using the philosophy detailed in the DOE/NETL-2007/1281 report
[DOE/NETL, 2007]. The revenue requirement method of performing an economic analysis of a prospective power plant has been widely used in the electric utility industry to estimate LCOE. This method permits the incorporation of various dissimilar components for a potential new plant into a single value that can be compared to various alternatives. The revenue requirement figure-of-merit in this report is the cost of electricity (COE) levelized over a 20 year period and expressed in mills/kWh (numerically equivalent to $/MWh). The 20-year LCOE was calculated using a simplified model derived from the NETL Power Systems Financial Model. This model computes the LCOE according to the equation
MWhCF
OCLFOCLFCFOCLFOCLFTPCCCFLCOE VVVVFFFFP
P
........ 22112211
where LCOEP is the levelized cost of electricity over P years ($/MWh); P is the levelized period (e.g., 10, 20, 0r 30 years); CCF is the capital charge factor for the levelization period; TPC is the total plant cost ($); LFFn is the levelization factor for category n fixed operating cost; OCFn is the category n fixed operating cost for the initial year of operation (expressed in “first-year-of-construction” year dollars); CF

3-47
is the plant capacity factor; LFVn is the levelization factor for category n variable operating cost; OCVn is the category n variable operating cost at 100% capacity factor for the initial year of operation (expressed in “first-year-of-construction” year dollars); and MWh is the annual net megawatt–hours of power generated at 100% capacity factor.
All costs in the above equation are expressed in “first-year-of-construction” year dollars. Hence, the resulting LCOE is also expressed in “first-year-of-construction” year dollars. In our process economic analysis, the first year of plant construction was assumed to be 2007 so the resulting LCOE was expressed in year 2007 dollars. The capital cost in December 2006 dollars was treated as a 2007 year cost. In CO2 capture cases, the LCOE for CO2 transportation, storage, and monitoring (TS&M) costs was added to the LCOE calculated using the above equation to generate a total cost that included CO2 capture, sequestration and subsequent monitoring.
The capital charge factor and levelization factors that were used for the 20-year LCOE calculations are given in Table 3-20 and came from the DOE/NETL-2007/1281 report [DOE/NETL, 2007]. These economic parameters were divided into two categories representing high-risk and low-risk projects undertaken at investor-owned utilities. High-risk projects were those in which commercial-scale experience is limited. The PC power plant was considered low risk, while the membrane CO2 capture plant fell into the high-risk category.
Table 3-20. Capital Charge and Levelization Factors Used in Process Economic Analysis
Cost factor High risk Low risk Nominal escalation
(%)
Capital charge factor 0.175 0.164 N/A
Coal levelization factor 1.2022 1.2089 2.35
General O&M levelization factor 1.1568 1.1618 1.87
LCOE for Power Plant Without Carbon Capture. Correct implementation of the LCOE estimation method was verified by computing the LCOE of the 550-MWe PC subcritical plant without CO2 capture (Case 9) in the DOE/NETL-2007/1281 report. Supporting Case 9 numbers such as total plant cost, fixed operating cost, variable operating cost, capacity factor, etc. obtained from this report were used in the calculation.
Our LCOE calculated for the PC power plant without CO2 capture case was $63.7/MWh. This value agrees well with the $64/MWh LCOE given for Case 9 in the DOE/NETL-2007/1281 report. The contributions of the various parameters to the calculated LCOE are shown in Table 3-21. About 53.6% of the LCOE was to bear the capital cost of the plant. About 31.8% was attributed to the coal fuel cost. The fixed and variable operating expenses made up 5.1% and 9.5%, respectively, of the overall LCOE.
Table 3-21. Parameter Values and Contributions in LCOE Estimation for 550-MWe Subcritical Power Plant Without Carbon Capture
Parameter Value Capital charge or levelization factor
$MM/yr LCOE
($/MWh)
Total plant cost $852.6MM 0.164 139.8 34.1 Fixed operating cost $13.6MM/yr. 1.618 13.4 3.3 Variable operating cost $20.5MM/yr. 1.618 24.8 6.1 Fuel cost $68.6MM/yr. 1.2089 83.0 20.2

3-48
LCOE for Power Plant With Carbon Capture Using RTI Membrane Process. The LCOE estimation method was used to assess the economics of a net 550-MWe PC subcritical power plant retrofitted with the RTI three-stage membrane process for CO2 capture. The power consumption and capital cost calculated earlier in Sections 3.5.1 and 3.5.2, respectively, were used to estimate the LCOE for the CO2 capture case. The fixed and variable operating costs were estimated using Case 10 in the DOE/NETL-2007/1281 report. One additional parameter included in the variable operating cost was the replacement of membrane modules. It was assumed that all membrane modules would be replaced once every 10 years. Thus, $4.5 million, which was 10% of the initial membrane installation cost, was included in the variable operating costs. The key LCOE parameter values and contributions for this CO2 capture case is given in Table 3-22.
The overall LCOE estimated for the PC power plant with CO2 capture using the three-stage membrane process was $116.4/MWh, which translated to an increase in LCOE of ~82% over that of a plant without carbon capture. Although plant capacity was inflated by 46%, the additional 255 MWe of power generated was consumed by the CO2 capture process. Therefore, the power plant capital cost and fuel cost were sustained by revenue generated by only 68% of electricity production. This resulted in a 47% increase in the fuel-cost contribution from $20.2/MWh to $29.6/MWh to the LCOE. Because the total power-plant capital cost increased by only 29% for the 46% increase in plant capacity, the contribution of total capital cost to LCOE also increased by only 29% from $34.1/MWh to $44/MWh. The contribution of the additional capital cost of the CO2 capture plant to the LCOE was $24.4/MWh. The cost of CO2 transportation, storage and monitoring was included by adding $4.3/MWh to the LCOE estimation.
Table 3-22. Parameter Values and Contributions in LCOE Estimation for Net 550-MWe Subcritical Power Plant With RTI Three-Stage Membrane Carbon Capture Process
Parameter Value Capital charge or levelization factor
M$/yr LCOE
($/MWh)
Total power plant cost $1,098.9MM 0.164 180.2 44.0 CO2 capture plant cost $571.4MM 0.175 100.0 24.4 Fixed operating cost $17.7MM/yr. 1.618 17.5 4.3 Variable operating cost $34.2MM$/yr. 1.618 40.0 9.8 Fuel cost $100.1MM$/yr. 1.2089 121.0 29.6 CO2 TS&M — — — 4.3*
* From Case 10 in the DOE/NETL-2007/1281 report [DOE/NETL, 2007].
The penalty of electricity consumed by the CO2 capture power plant is not directly evident in the values shown in Table 3-22. One way of looking at the effect of lowered power-plant energy efficiency was to estimate the LCOE ($/MWh) contributions of the individual parameters for a plant producing 805 MWe of electricity. These modified numbers are shown in Table 3-23.
Due to economy of scale, the LCOE contribution of the total capital cost for the power plant decreased from $34.1/MWh in the 550-MWe power plant-only case to $30.1/MWh for the 805-MWe plant. Changes in the two operating costs were marginal. Because fuel cost increases proportionally to power-plant size, the fuel-cost contribution remained the same at $20.2/MWh, similar to the power plant-only case. The total parameter LCOE contributions summed to $80.8/MWh for the net 805-MWe plant. Comparing this value with the LCOE of $116.3/MWh for the net 550-MWe plant with capture case, the difference of $35.5/MWh represents the energy penalty associated with sustaining the carbon capture process. Thus, the energy penalty is the biggest contributor to the LCOE of a power plant with CO2 capture using the three-stage membrane process.

3-49
Table 3-23. Parameter LCOE Contributions for Net 805-MWe Power Plant
Parameter LCOE ($/MWh)
Total power plant cost 30.1 CO2 capture plant cost 16.7 Fixed operating cost 2.9 Variable operating cost 6.7 Fuel cost 20.2 CO2 TS&M 4.3
Energy penalty 35.5
Effect of Membrane Properties on LCOE. To determine the effect of membrane properties (i.e., CO2 permeance; CO2/N2 selectivity) on LCOE, additional calculations were done using two sets of CO2 permeance values – 300 and 500 GPU – for the CO2/N2 selectivity range of 20-50. For comparison, permeance and selectivity values of 1,000 GPU and 50, respectively, were also examined. It was observed that an increase in CO2/N2 selectivity decreased the LCOE at a specific rate. This rate of LCOE decrease increased with CO2 permeance. With increasing CO2/N2 selectivity, the CO2 purity of the captured stream and the feed to the second membrane stage M2 increased, thereby reducing their stream volumes. As a result, the power required to compress these streams decreased, leading to a decrease in CO2 capture cost. An increase in membrane CO2 permeance proportionally reduced the membrane area requirement, but no change in power consumption was observed. Assuming similar cost of higher-flux membranes, an increase in CO2 permeance decreased total membrane cost and, in turn, LCOE. However, with increasing CO2 permeance, the contribution of membrane capital cost to the total capture plant cost decreased so that LCOE became increasingly insensitive to membrane CO2 permeance. Hence, cost of CO2 capture did not significantly decrease further by increasing CO2 permeance from 500 to 1,000 GPU.
Effect of Compressor Cost on LCOE. Compressor equipment costs in the techno-economic analysis were estimated using the Aspen Icarus software database. The normalized cost of the M1 flue-gas and the M2 feed compressors in the CO2 separation operation was $740/kW and $670/kW, respectively. These numbers are significantly higher than the normalized cost of $550/kW calculated from DOE/NETL-2007/1281 report for the CO2 compressor in the compression/drying step. Additionally, the M1 and M2 feed compressors were sized as multiple individual compressors due to size limitations in the Aspen Icarus database. Thus, a total of nine compressors were used to represent the M1 flue-gas compressor, and two compressors to represent the M2 feed compressor. This could also be a contributing factor to the high disparity in normalized compressor costs.
To obtain a more reasonable estimate of compressor cost, project partner Generon’s engineering division also discussed the application with some of their compressor vendors to get quotes. Based on the quotes that Generon received, the normalized cost was $330/kW for the M1 flue-gas compressor and $867/kW for the M2 feed compressor. The much larger M1 compressor cost had lower normalized cost due to economy of scale. When these numbers were used in the techno-economic evaluation, the capital cost of three-stage membrane CO2 capture plant decreased by 25%. As a result, the overall LCOE for the power plant with CO2 capture also decreased from $116.3/MWh to $110.4/MWh which translated to an increase in LCOE of ~73% over that of a subcritical power plant without CO2 capture.

4-1
4. Conclusions and Recommendations
RTI, in collaboration with Arkema, Inc. and Generon IGS, Inc., developed an advanced, hollow-fiber, polymeric membrane process that could be retrofitted into current coal-fired power plants to capture at least 90% of the CO2 from plant flue gas with 95% captured CO2 purity. It focused on development of new, high-performance polymer membrane materials, improved membrane hollow fibers and module design, and process development.
Significant accomplishments and major conclusions from this project are the following:
Development and synthesis of novel VDF-based copolymers with improved CO2 permeance and improved CO2/N2 selectivity Copolymerization of a bulky, low-dipole Comonomer A into the VDF chain backbone
can increase gas permeability by disrupting chain packing density and crystallinity in the polymer matrix.
VDF-co-A copolymer family was developed with up to 17-18 times higher CO2 permeability than the base PVDF homopolymer, while maintaining the CO2/N2 selectivity of 24 of the base PVDF.
Copolymerization of a bulky, high-dipole Comonomer B into the VDF chain backbone can increase CO2/N2 selectivity by enhancing the CO2 affinity of the polymer while also improving gas permeability relative to the base PVDF homopolymer.
VDF-co-B copolymer family was developed with 2.5-3 times higher CO2/N2 selectivity and 6 times higher CO2 permeability than base PVDF homopolymer.
Strong temperature dependence of CO2 permeance in VDF-based polymers could be exploited as a key process variable for markedly increasing and optimizing CO2 permeance to increase gas processing throughput in the capture process while still having decent CO2 removal ability.
VDF-based polymer platform demonstrated excellent stability of its gas separation properties to contaminants SO2, NOx, and water vapor.
Fabrication of the first developmental hollow fibers from new VDF-based copolymer platform VDF-A.2 was downselected for fiber development because it had among the best balance
of CO2 permeability and selectivity of the new copolymers in this fluorinated platform.
Synthesis of VDF-A.2 was successfully scaled up to pilot scale to prepare 200 lbs. of this resin for fiber development.
Fiber tackiness, fiber shape stability, and solvent extraction kinetics were identified as key issues that must be addressed and managed for the VDF-based polymers.
Hollow-fiber cores of the VDF-based materials were successfully spun on commercial fiber-spinning equipment. Fibers had good gas flux but exhibited no gas selectivity. Development of a membrane structure with gas selectivity will require more work than anticipated.
Development and scale-up of Generon next-generation, high-flux polycarbonate membrane hollow fibers with up to 4 times higher CO2 flux (410 GPU) than that of Generon standard polycarbonate membrane fibers CO2/N2 selectivity of high-flux polycarbonate hollow-fiber membrane was comparable to
that of standard (current-generation) polycarbonate hollow-fiber membrane. However, it

4-2
was only 60-70% of its intrinsic CO2/N2 selectivity (35-37), meaning that the high-flux polycarbonate membrane properties could still be improved.
Fibers of high-flux polycarbonate with 25% larger dimensions were successfully spun as an option for managing parasitic axial pressure drops in the module.
High-flux polycarbonate membrane would be best operated at temperatures below room temperature to benefit from substantial increase in CO2/N2 selectivity without much decrease in CO2 permeance due to its weak temperature dependence.
High-flux polycarbonate membrane displayed some sensitivity to flue-gas contaminants NOx and SO2, which led to a permeance decline but had minimal to no effect on CO2/N2 selectivity. This observed sensitivity did not seem to degrade the membrane as it recovered much of its original properties when the contaminants were removed. In practice, therefore, feed pretreatment should be considered for this membrane.
Successful formation of high-flux polycarbonate membrane fibers into lab-scale modules and larger prototype (2,200 ft2) modules
Development of three-stage CO2 capture membrane process design for 90% CO2 capture and 95% CO2 purity Increase in LCOE estimated for subcritical coal power plant with RTI capture process
was estimated to be ~73-82% over that of a plant with no capture, with the LCOE increase depending strongly on compressor cost used.
Compressor costs made up the majority of equipment costs for the RTI capture process, with 64% of costs attributed to compressors needed for the CO2 separation process and 10% to the compressor for compression/drying of the captured CO2 product.
Cost of CO2 capture with RTI process was estimated to be ~$42/ton-CO2.
The energy penalty was the biggest contributor to the LCOE of a power plant with the RTI capture process.
The recommendations for future work are focused mostly on continued membrane and module design. Much work is still needed to develop the VDF-based copolymer platform into hollow fibers with gas-separation properties. There was nothing from the spin runs completed in this project to indicate that fibers with the desired membrane selectivity cannot be achieved with further development efforts. Alternative strategies to consider include
Change in solvent/nonsolvent system to accelerate the precipitation (phase-separation kinetics) during the fiber-spin process in order to develop the desired gas-selective skin layer in the currently microporous fiber structure
Coating the resulting dry VDF-based fibers with a sealing layer to fix minor defects if such defects are the reason behind the fiber non-selectivity
Use of a solution-coating method instead of the conventional spinning method to form membrane hollow fibers from the VDF-based platform Coating of a thin, dense VDF-based selective layer, for example, onto a microporous
hollow-fiber core substrate of a different polymer
From the high-flux polycarbonate membrane and module development efforts done on the project, recommended future work should focus on
Further spin-process optimization to bring CO2/N2 selectivity of the high-flux polycarbonate fiber closer to the intrinsic value of 35-37 and further improve the fiber CO2 permeance (550 GPU

4-3
would be a possible achievable long-term target based on Generon’s fiber development experience)
Improve performance of hollow-fiber modules for high-volume post-combustion CO2 capture Minimize parasitic pressure-drop effects on gas flow in both bore- and shell-side for the
module Develop 50% larger-diameter fibers
Develop shorter, 24-in.-long modules from larger fibers rather than the standard 36-in.-long modules
Lower fiber packing factor
Increase size of shell-side module ports
Implementation of module design changes such as those listed above will require additional optimization because some loss in volumetric surface area will occur in the process of minimizing pressure-drop limitations.
Maximize membrane permeation area in module by developing thinner epoxy tubesheets, especially for the shorter modules
From the process design side, recommended future work includes
Better understanding of pretreatment requirements for the membrane system to maximize membrane performance and lifetime
Investigating the overall process impact of membrane operation at lower temperature to take advantage of substantially higher CO2 selectivity over all other gases, especially when CO2 permeance in the membrane is only weakly dependent on temperature

5-1
5. References
Baker, R. W., Membrane Technology and Applications, 2nd ed., John Wiley & Sons: West Sussex, England, 2004; pp 89-160.
DeSimone, J. M.; Roberts, G. W.; Charpentier, P. A., Multimodal Fluoropolymers and Methods of Making the Same. U.S. Patent WO 01/90206, November 29, 2001.
DOE/EIA, Annual Energy Outlook 2009 with Projections to 2030, Washington, DC, 2009.
DOE/EIA, Emissions of Greenhouse Gases in the United States 2009, Washington, DC, 2011.
DOE/EIA, Annual Energy Outlook 2012 Early Release Overview, Washington, DC, 2012.
DOE/NETL, Cost and Performance Baseline for Fossil Energy Plants – Volume 1: Bituminous Coal and Natural Gas to Electricity, Report 2007/1281, August 2007.
El-Hibri, M. J.; Paul, D. R., J. Appl. Polym. Sci., 31, 2533-2560 (1986).
Humphrey, J. S.; Amin-Sanayei, R., Vinylidene Fluoride Polymers. In Encyclopedia of Polymer Science and Technology, John Wiley & Sons: New York, 2002.
Lee, S.; Lanterman, H. B.; Sardesai, A.; Wenzel, J.; Marshall, B.; Yen, J. H.-G.; Amin-Sanayei, R.; Moucharik, M., Polymerization of Vinyidene Fluoride (VF2) in a Supercritical Fluid Medium. U.S. Patent 7,092,288, August 15, 2006.
Nunes, S. P.; Peinemann, K.-V., Gas Separation with Membranes, In Membrane Technology in the Chemical Industry, Nunes, S. P.; Peinemann, K.-V., Eds. Wiley-VCH: Weinheim, Federal Republic of Germany, 2001; p 44.
Peng, Q.-Y.; Cong, P.-H.; Liu, X.-J.; Huang, S.; Li, T.-S., Wear, 266(7-8), 713-720 (2009).
Robeson, L. M.; Burgoyne, W. F.; Langsam, M.; Savoca, A. C.; Tien, C. F., Polymer, 35(23), 4970-4978 (1994).
Sijbesma, H., Nymeijer,K., van Marwijk, R., Heijboer, R., Potreck, J., and Wessling, M., J. Membr. Sci., 313, 263 (2008).