Embed Size (px)
Citation preview
r z CO
OH
ESD-TR-67-458
EBD RECORD COPY RETURN TO
SCIfiWWIC & TECHNIv-.-V LIFORIWTrcW OMSiOft (EST1), Bl'fWOWi 12H
w
FIRST QUARTERLY TECHNICAL REPORT
LASA EXPERIMENTAL SIGNAL PROCESSING SYSTEM
FEBRUARY 1967
DIRECTORATE OF PLANNING AND TECHNOLOGY
ELECTRONIC SYSTEMS DIVISION
AIR FORCE SYSTEMS COMMAND
UNITED STATES AIR FORCE
L. G . Hanscom Field, Bedford, Massachusetts 01730
This document has been approved for public release and sale; its distribution is unlimited.
ESD ACCESSION LIST BTI Call No. At 0 0472
Copy No. S of >^_ cys
Sponsored by: Advanced Research Projects Agency, Washington, D.C, ARPA Order No. 800
(Prepared by International Business Machines Corporation, 18100 Frederick Pike, Gaithersburg, Maryland 20760, under Contract AFI9(628)-C-67-0198).

LEGAL NOTICE
When U. S. Government drawings, specifications or other data are used for any purpose other than a definitely related government procurement operation, the government thereby incurs no responsibility nor any obligation whatsoever; and the fact that the government may have formulated, furnished, or in any way sup- plied the said drawings, specifications, or other data is not to be regarded by implication or otherwise as in any manner licensing the holder or any other person or conveying any rights or permission to manufacture, use, or sell any patented invention that may in any way be related thereto.
OTHER NOTICES
Do not return this copy. Retain or destroy.

ESD-TR-67-458
FIRST QUARTERLY TECHNICAL REPORT
LASA EXPERIMENTAL SIGNAL PROCESSING SYSTEM
FEBRUARY 1967
DIRECTORATE OF PLANNING AND TECHNOLOGY
ELECTRONIC SYSTEMS DIVISION
AIR FORCE SYSTEMS COMMAND
UNITED STATES AIR FORCE
L. G . Hanscom Field, Bedford, Massachusetts 01730
This document has been approved for public release and sale; its distribution is unlimited.
Sponsored by: Advanced Research Projects Agency, Washington, D.C. ARPA Order No. 800
(Prepared by International Business Machines Corporation, I8I00 Frederick Pike, Gaithersburg, Maryland 20760, under Contract AFI9(628)-C-67-0f98).

FOREWORD
The work reported herein was performed under the "LASA Experimental Signal Processing System," Contract Number AF 19(628)-C-67-0198. The Elec- tronic Systems Division Technical Project Officer is Major Cleve P. Malone (ESL-2).
This technical report has been reviewed and is approved.
Paul W. Ridenour, Lt Col, USAF
Chief, LASA Office Directorate Planning and Technology Electronics Systems Division
u
ABSTRACT
This document, the LASA Experimental Signal Processing System First Quarterly Technical Report, discusses the effort expended during the first quarter to provide the hardware and software necessary to support research and development directed toward the study of seismic signal processing and delineates tasks planned for execution during the next quarter.
In addition to work accomplished and future plans, this document presents detailed information related to System Data Flow and Hardware Configuration, Array Interface Monitor and Control, Programming, Microcoding, and Washing- ton laboratory in Appendices A through E, respectively.
in
CONTENTS
Section 1 INTRODUCTION
Section 2 RESULTS AND SUMMARY OF WORK ACCOMPLISHED
Section 3 PLANS 3.1 System Activities 3.2 Programming 3.3 Operations
Section 4 REFERENCES
Section 5 APPENDICES A. System Data Flow and Hardware Configuration B. Array Interface Monitor and Control C. Programming D. Microcoding E. Washington Laboratory
Page
1-1
2-1
3-1 3-1 3-2 3-2
4-1
A-l B-l C-l D-l E-l
IV
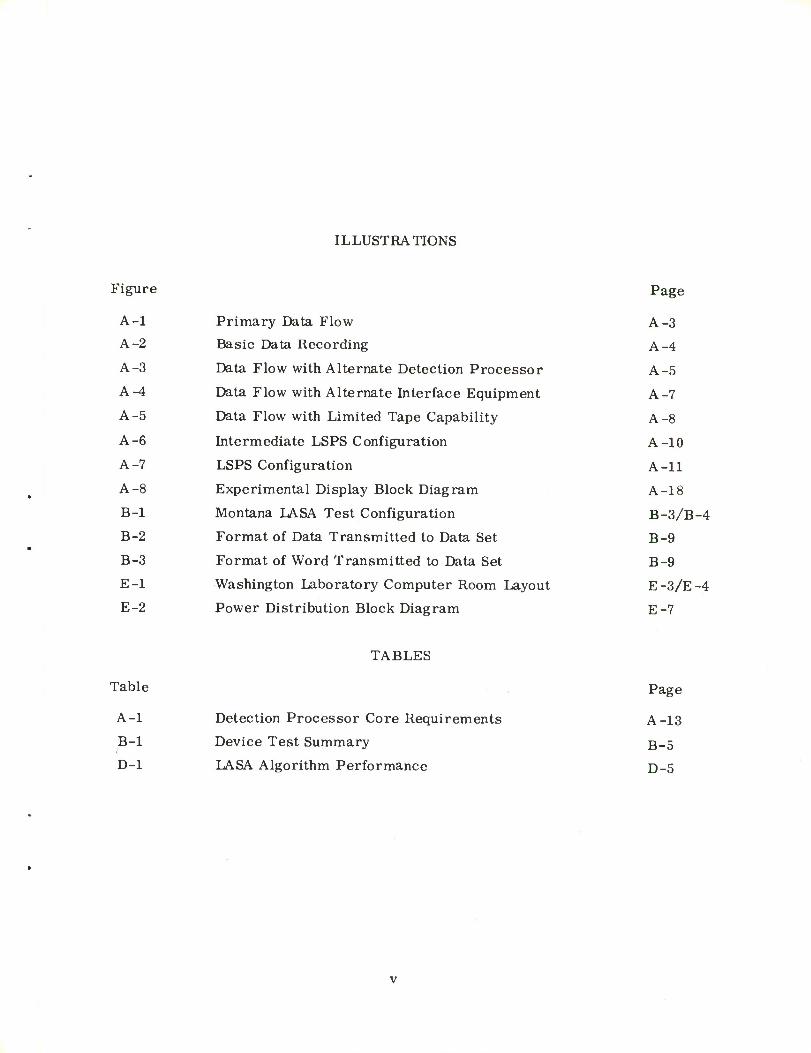
ILLUSTRATIONS
Figure
A-l
A-2
A-3
A-4
A-5
A-6
A-7
A-8
B-l
B-2
B-3
E-l
E-2
Primary Data Flow
Basic Data Recording
Data Flow with Alternate Detection Processor
Data Flow with Alternate Interface Equipment
Data Flow with Limited Tape Capability
Intermediate LSPS Configuration
LSPS Configuration
Experimental Display Block Diagram
Montana LASA Test Configuration
Format of Data Transmitted to Data Set
Format of Word Transmitted to Data Set
Washington Laboratory Computer Room Layout
Power Distribution Block Diagram
Page
A-3
A-4
A-5
A-7
A-8
A-10
A-ll
A-18
B-3/B-4
B-9
B-9
E -3/E -4
E-7
Table
A-l
B-l
D-l
TABLES
Detection Processor Core Requirements
Device Test Summary
LASA Algorithm Performance
Page
A-13
B-5
D-5

Section 1
INTRODUCTION
The work reported herein was performed under the "LASA Experimental
Signal Processing System," Contract Number AF 19(628)-67-C-0198, and is a con-
tinuation of the "Large Aperture Seismic Array Signal Processing Study," Con-
tract Number SD-296, and the "Large Aperture Seismic Array Signal Processing
Communications and Simulation Study," Contract Number AF19(628)-5948.
Prime effort under this contract is to design, develop, and implement a LASA
Experimental Signal Processing System (LSPS) including the hardware and soft-
ware necessary to provide an experimental capability to:
1. Evaluate performance of the system in accordance with the system
requirements.
2. Demonstrate the capability to meet basic LASA signal processing
objectives. •
3. Conduct research to develop means of improving and extending the
capability of the system.
4. Perform seismic and signal processing experiments of
interest.
In addition to the above, activities to support the future integration of the
system and LASA shall:
1. Specify the requirements to interface with, control, and monitor the
LASA array.
2. Perform preliminary designs of the interface equipment.
3. Specify the requirements for a facility to house the system in Montana.
The above work is to be supported by appropriate reports and documentation
to assure effective recording of the effort performed.
1-1

During this first reporting period, the effort was principally in the study
and design stage.
Section 2 of the report briefly summarizes the accomplishments to date.
Section 3 defines the plans for the next reporting period. Section 4 lists refer-
ences pertinent to the technical effort. Section 5 contains five appendices which
present the technical discussion of the work performed as follows:
1. Appendix A presents variations of data flow incorporated into the
system to provide a fail-soft capability under equipment failure.
It also discusses pertinent characteristics of the hardware equipment
defined for implementation of the system.
2. Appendix B details work done in defining the LASA array interface
with the system and reports on partial development of a test plan to
validate the LASA data acquisition system.
3. Appendix C discusses the pertinent parameters investigated in the
selection of an appropriate software system and the effects of
developing software requirements in modifying the hardware equip-
ment configuration.
4. Appendix D discusses the results of development efforts to implement
the microcodes defined in previous studies to optimize signal processing
performance of the selected hardware equipment.
5. Appendix E discusses some of the considerations pertinent to the
design and planning of the Washington laboratory being developed for
installation of the signal processing system.
1-2
Section 2
RESULTS AND SUMMARY OF WORK ACCOMPLISHED
During this Quarter, work was concentrated in the areas pertinent to the
machine system, programming, and the Washington laboratory.
The Detection, Event, and Auxiliary Processing concepts were re-evaluated
in light of both the performance measurements of the signal processing algorithms
and systems functions. It was determined that no modification of overall concept
was appropriate at this time. However, in developing the Detection and Event
Processing technology, it was deemed prudent to separate the processor functions
so that advantage could be taken of their general purpose computer capability
during the period prior to on-line operations. To this end accent has been given
to peripheral and display equipments.
In the programming area, accent was directed toward providing a supervisor/
monitor capability for the system. Consideration of capability limitations, avail-
ability, and planned operating system software utilization dictated the selection
of Disk Operating System (DOS). In addition, effort was expended in anticipation
of using the Detection Processor as a special purpose signal processor as soon
as possible. To support the general purpose utilization of the machines, pro-
gramming consideration of peripherals and displays led to initiating the design
of appropriate support programming.
Microcode testing was conducted employing simulation programs. Testing
accomplished to date indicates that the anticipated microcode execution speeds
will be obtained.
A combined planning, technical, and administrative effort was mounted in
which on-site surveys were conducted to select a site for the Washington laboratory.
Machine room and office layouts were generated and lease negotiations conducted
in preparation for occupancy during the next quarter.
2-1/2-2

Section 3
PLANS
The following tasks are planned for execution during the next quarter. Dis-
cussions are partitioned in accordance with the three functional disciplines of
systems, programming, and operations. Each task is presented with sufficient
perspective to identify its interrelation and contribution to the project.
3.1 SYSTEM ACTIVITIES
Detection Processor parameters will be reviewed, and a scaling selection
will be formalized which is suitable for program development, process evalua-
tion, and data analysis support. Statistical noise characteristics will be budgeted
in accordance with both the noise rejection characteristics observed during data
analysis and the classical theoretical relations derived during the previous study.
The effects of parameter quantization and range will be considered.
The feasibility of extending the experimental display capabilities to support
a strip chart recorder will be investigated. This capability is desirable to facili-
tate process documentation and provide an efficient method for gross data editing.
Phase delays will be analyzed to establish predictable anomalies and to illu-
minate techniques for developing and maintaining a calibration library. A prior
knowledge of these trends will permit appropriate steering compensation and thereby
enhance system performance. The related characterization of travel times for the
principal arrivals will contribute to basic event processor functions, such as group-
ing of detections derived from a specific event and the estimation of geographic
coordinates.
Data compression techniques will be investigated to derive and evaluate com-
munication concepts appropriate for large array data acquisition. Both the system
3-1
performance implications of the encoding techniques and the efficient utilization
of commercially available facilities will be considered to maintain system
effectiveness.
Feasibility studies will be conducted for processing concepts which possess
the potential of extending the system capabilities.
3.2 PROGRAMMING
The System/360 Models G and H will be delivered during the latter part of
the next quarter and programming effort will be centered around the preparation
for their installation. This will include activity in the modification of DOS for
the initial hardware configuration, the continued testing of the microprograms,
and the conversion (IBM 7090 to IBM System/360) of the data analysis programs
developed under the previous contract.
An initial version of the Detection Processor program should become opera-
tional during the next quarter and will be an expanded version of that developed
for the microcode testing.
The design effort for the Detection and Event Monitors will continue during
the next quarter. It is currently planned to provide a capability to determine the
overhead timing penalties incurred when running under the DOS. This informa-
tion will influence the design of the Detection Supervisor. The arrival of
the IBM System/360 Model 2040H will include some peripheral devices,
notably the 1627 plotter, the experimental and 2250 displays, and the 2740
remote terminal, for which software I/O support must be developed. In
addition, the application programs for each of these devices must also be
implemented.
3.3 OPERATIONS
During the next quarter, the LASA project staff plans to move from the IBM,
Federal Systems Center, Gaithersburg, Maryland to the Van Ness Centre, Suite
450, Washington, D. C, where the LASA Experimental Signal Processing System
will be installed. It is expected that single shift operation will be initiated on
the System/360 Model 2040G machine and preparations for receipt of the second
machine will be made. In addition, initial drafts of the scheduled documentation
will be prepared and data tapes will be ordered.
3-2

Section 4
REFERENCES
"Large Aperture Seismic Array Signal Processing Study," IBM Final Report, Contract No. SD-296, 15 July 1965.
"LASA Signal Processing, Simulation, and Communications Study," IBM First Quarterly Technical Report, Contract No. AF 19(628)-5948, ESD-TR-66-463, Vol I, May 1966.
"LASA Signal Processing, Simulation, and Communications Study," IBM Second Quarterly Technical Report, ESD-TR-66-515, September 1966.
"LASA Signal Processing, Simulation, and Communications Study," IBM Final Report, Contract No. AF 19(628)-5948. ESD-TR-66-635, March 1967.
4-1/4-2

Appendix A
SYSTEM DATA FLOW AND HARDWARE CONFIGURATION
A.l SYSTEM DATA FLOW
The LASA Signal Processing System (LSPS) has been partitioned into the
four principal functions of data acquisition, detection processing, event process-
ing, and classification. Supporting functions such as array monitoring, system
diagnostics, and phase-delay library maintenance are distributed throughout this
structure in accordance with the specific processing requirement. The initial 4
system is designed to be responsive to the detection and event data enhance-
ment requirements, and possesses the flexibility to smoothly interface with
the remaining functions. This initial system is comprised of a System/360
Model 2040 G Detection Processor, a System/360 Model 2040 H Event Proces-
sor, and a selection of input/output equipment which provides bulk data storage i
and implements the necessary external communication functions.
Due to the standardized channel definition adopted, extensive latitude exists
in structuring the interconnection network. Periodically scheduled maintenance
operations and occasional equipment failures must be anticipated, and the result-
ing real-time posture is a crucial design consideration where a future require-
ment for an on-line, real-time operation is expected. A fail-soft reflex capability
was adopted as the rudimentary architecture criterion, and progressively lower
priorities were assigned to the raw seismic data retention, real-time detection,
and event analysis functions. This sequence is consistent with the data progression,
and, therefore, permits a delayed system recovery from either of the two degraded
operating modes by utilizing throughput margins when complete system capabilities
are reestablished.
A-l
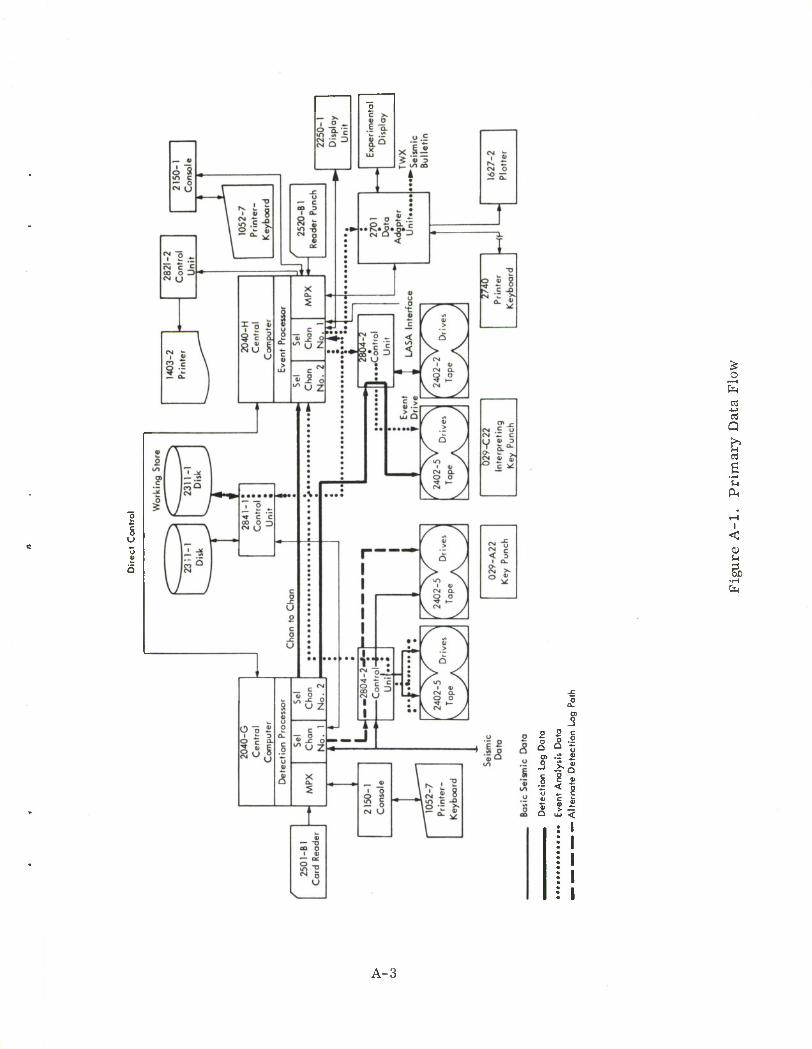
A system structure evolved which has promise of retaining the detection
capability for all single failures and can tolerate many multiple failure condi-
tions. Figure A-l illustrates the primary data flow of the basic seismic data,
the detection log, and the event analysis data streams. Three tape drives nor-
mally buffer seismometer information for the event process and create the files
for the basic data library. The interface equipment should directly perform this
recording so as to obtain the maximum probability of data retention. (Figure A-2
illustrates this direct path as incorporated in the interface equipment hypothesis.)
Corresponding data is directly introduced to the Detection Processor, and the
resulting detection history is transmitted to the arrival queue through a channel-
to-channel communication path. A log of this intermediate data is retained on one
of the available tape drives.
Based on time-velocity window estimates resident in the arrival queue, the
event processor can directly access the appropriate seismic histories to analyze
a specific arrival and develop both seismic bulletin parameters and the event
documentation tape. Disk units will be utilized as the principal bulk working
storage medium. It is evident that the composite primary data flow can be main-
tained with less than the full complement of equipment. However, the unavailability
of certain critical devices, for example, a particular control unit, would preclude
event processing. In this illustrative case, detection processing would continue
with the appropriate data flow subset. The alternate detection log path would be
utilized, and, since no requirement remains for a significant data history on
mounted tapes, seismic recording could be maintained with two available drives
at a penalty of increased operator attention.
Whenever the primary detection data flow cannot be maintained, system sym-
metry and software permit the transfer of the real-time detection process function
to the Event Processor. Figure A-3 illustrates the alternate data flow. Tape
drive assignments have been revised to maintain the direct recording of basic
seismic data. Inherent system symmetry of this architecture will minimize the
programming impact and facilitate the implementation of transient-free scheduled
transitions. Subsequent event processing must now be performed as a multi-
programmed or batched operation from the taped data base.
A-2
% —I
P c
I <
PL,
I
! i
A-3

11=1 X
\9.
8i3 I
ill
oz
i o z!
Ei CN O
-8 = <
S u o s 5
~ij =
rn
n V71
m 9 ^ r^
T TJ
o QJ 8 T C -D
a. 0)
?JS CN .c u CN «. C
V o
4> S* CN o
CN CN c < 3
1 a. O CN >v o «
w
bO
•rH
8
CO
3 Q o
•H CO
I < 93
•r-l
& & o> .- o *
I < 0)
Q
A-4

8 u
S <5 <3 is g j £ u «- E 4) C 0)
« > -5
O C/3
CD O
a .2 +-> o 0)
-4-> CD
B 0)
I—4
o •*-•
l < cu
•rH
A-5
If the interface subsystem equipment is the critical inoperative element in
the detection data flow stream, a more sophisticated fail-soft mode may be
available which retains a limited event processing capability. Figure A-4 illus-
trates the possibility of relaying seismic data through both the Event Processor
and the channel-to-channel communication facility to the Detection Processor.
The reflected tape drive assignments are retained, and, again, system symmetry
minimizes the programming impact of this option. The additional burden on
the Event Processor will undoubtedly preclude supporting processes such as
array diagnostics, and may reduce efficiency such that a queue backlog develops
during peak arrival periods.
A similar, but more severely limited, event processing posture is conceivable
when one tape control unit is inoperative. The data flow illustrated in Figure
A-5 does not require the left 2804 Tape Control Unit. Two tape drives document
seismic data, and should acquire information directly from the secondary inter-
face channel. An alternate path is through the Detection Processor, but the addi-
tional overhead would reduce the number of deployable detection beams. The
facility does not exist to attempt processing arrivals at the normal rate capability.
The fail-soft reflex modes presented in this section represent the conceptual
base for the initial system design. They therefore constitute a structure of design
objectives which will, by necessity, be modified as the detailed system program-
ming progresses, equipment familiarity increases, and operating experience is
acquired. Although detail may change, graceful and orderly system deterioration
must be maintained to achieve an honest real-time capacity.
A.2 HARDWARE CONFIGURATION
The nature of the Signal Processing Tasks addressed above require several
stages of machine configuration for system development. The initial configura-
tion utilizes the Detection and Event Processors as independent computers.
The second stage employs the duplex system capability in preparation for on-
line operations and the final configuration embodies the Auxiliary Processor
for both system support and extended system functions.
A-6

8 u ti s 5
8 & O B —• -i*
C CD
S 3 & w o
n s
CO
U o
I
Q •
-v i
< CD
a f>4
A-7

I T)
o a> 8 a_ ^
g u
-£ a
3 S
s <3
M 8 « « 2
-a
& H
cu *-> •H s
•iH
—i
a
A-8

A.2.1 Present Configuration
To reflect knowledge gained on the previous studies, a review was conducted
of the proposed system hardware. The primary considerations were computing
power and data throughput. Since certain system parameters are not as yet
fully verified by adequate data analysis, the System/360 configurations were
closely scrutinized to ensure their adequacy. Continuous monitoring will occur
to adapt the configuration as further knowledge of the system parameters is
developed.
Figure A-6 illustrates the intermediate configuration of the system. This
intermediate LASA configuration consists of two System/360 Model 40 computers,
each with two selector channels and one multiplexer channel. In an operational
environment, the 2040G central computer will be devoted solely to the detection
processing function, which takes place in response to real-time inputs, and the
2040H central computer will be devoted to event processing.
The Detector Processor core memory capacity is 131,000 bytes. Tape
capacity consists of two 2804 tape control units, each with a simultaneous read/
write feature, and each having a bank of four tape drives: two seven-track drives,
two nine-track drives with the 800/1600 bpi feature, and four-nine track drives
with 1600 bpi only. Disk memory capacity consists of one control unit with two
2311 disk units. Other equipment connected to the Detection Processor includes
one card reader and one 1052 printer/keyboard. Other equipment connected to
the Event Processor includes one 1052 printer/keyboard, one card reader/punch,
one 1627 plotter, and one 2740 remote printer/keyboard connected through a 2701
adapter unit, one experimental display console with a strip chart recording device,
one TWX, one 2250 display unit, and a 1403 printer connected through a 2821
control unit. The channel-to-channel adapter and direct control features are
connected between two central computer units.
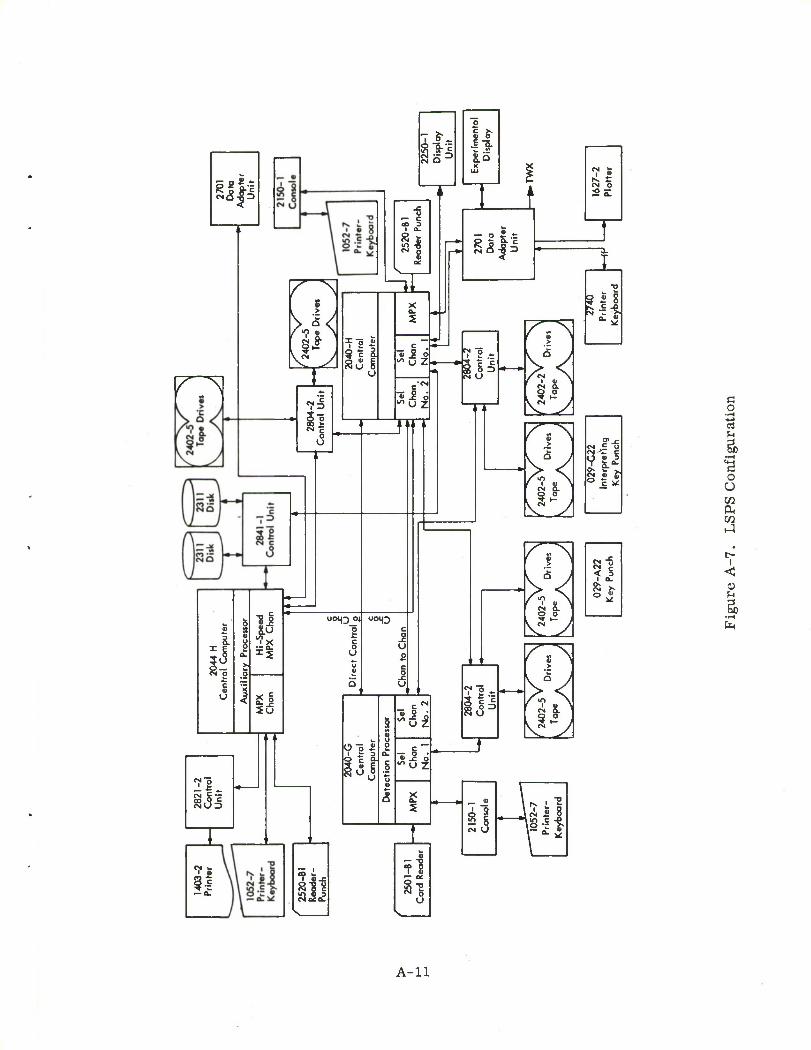
The final version of the system envisions a third processor, a System/360
Model 44 performing the functions of an Auxiliary Processor. This is shown in
Figure A-7, which tentatively depicts the interconnection of the System/360 to
the Detection and Event Processors.
A-9

I— >.
H ^ 3 CN Q
!fl -8
"> o z
1 e"
' u z!
4 4
0
E -S.
o sill
rv. £ CN 0 0
Q_
Si u
PT^
rn
i_t
lv V 7^
.u OJ 8
t O-
T -a
§ 1 8 |S c _o i» "- >s.
a. • ^
c ^
CM -C 0 Csj c < 3
1 a. O OJ >. 0 OJ
ii.'
a o
•--<
o O
03 HJ
CD
CD
CD
CD 1
< o •- &
A-10
Sjfi
in
85D
>4< 4^
8s S3 "9 * 8
ii o
a. u U
io
is
21 83;
I ft]
ii* O
UCHQ ou uo»Q
»•
X a. 5
an ^£1
TT
u
« 6
<S
1_1
.5 a.
- o s - 8JfS
51
u z
X
2
i t s — Ctt
u \
O „
ill 0
§ I
2 °
CM a
v5 V
S!
ex o
I? I 8
9 JZ c
(N -C u
< § 1 o. a >.
o 4) ^
c o
—I s
"B o o
s 03
I —i
A-ll

A.2.1.1 Detection Processor
In an operational LASA Signal Processing System (LSPS), the Detection
Processor operates on-line. It must complete the processing of one data
sample from the array within one sample period, or face an ever increasing
backlog of data. In this sense it must be a real-time system. This has been
a critical design factor in defining the experimental system, which must have
the potential of conversion to an operational system. It places additional
requirements on the Detection Processor in terms of core storage and machine
speed.
An evaluation of the Detection Processor memory requirements was per-
formed. With the aid of a FORTRAN program, the capacity of the processor
was evaluated for various processing configurations. Table A-l shows the
result of this study. The first three columns give the array and processing
configuration in terms of subarrays (SA), seismometers per subarray (SEIS),
and subarray beams formed per subarray (SAB). Column 4 shows the total
number of LASA beams that can fit into the available memory, assuming that
the processor is an IBM System/360 Model 2040G with 131,072 bytes of storage.
A total of 15,000 bytes of storage was allotted to the various resident processing
programs. Column 5 shows the number of bytes of storage necessary, including
program space, to perform Detection Processing with 500 LASA beams. Column 6
shows the number of bytes of storage used for data for each LASA beam formed. The
parameters used to evaluate the process are those given in the Final Report of
the LASA Signal Processing, Simulation, and Communication Study, ESD-TR-66-635.
Core storage requirements may be divided into three groups for discussion:
1. Detection supervisor and application program storage.
2. Constants and computed result storage.
3. Data storage.
Since the signal processing techniques utilized in the system have not changed
significantly from the original concepts, there has been no large change in the
storage requirements for the application program, constants, and computed results
of items 1 and 2 above. The detection supervisor can be thought of as split into two
A-12

co H
e D or w « w g « O 55 CO w O o « OH
z o I—I H U w H W Q
<
X!
s < w « < CO < J
w N(N(NlN<N(NNC<ICSlMeJ<N^Tj*-<tTt<Tj<-^TtirJ<Tt<-<tirJiTj<«300 0000000000000>0>OSOiOJO>050J0505050500t>
0* >< « Q §
«< W ft)
<: CO < •J
•*'*'*^>Tl<(Me<l'*«C00Tj<O^Tj<Tf00-l!j,OOT}<00<M'*«5Tj<Ttl o tONoo05o.-ii-iCJe-<NaoTj,t~aoojeo'»tlmt-t-c-o©otopo o noto^N^io^ONnw^cofli ooNiDntoflifflnnHO m t>t-ffloooot>^Mnoa)ooo<OHnfflTi'ou50!fliNt-mt> PC! O
CI^lONMTliNn^NNnHHNOOHOOHfflOOfflt-
fe
>< « Q s
o <; z o
< 00M00NO[-^C0N!0(0<Din«©0)(N^»O(»)(>500IMI>N n,*'i|NnnoNoooHNHK)3>oo(ot-M^HffloiOHa
W •^coiNi^Tttcom^co^DirjTtit-tOLfjt-o^oot-t-ooxit-OJtH m T-(
< CO <J J
CO 3 CO
^mfflitioto^'into^inwj'in^^into^into^insoMsi
-
W co
ioiAms)AA<cwtonniQmmo)0)o>cc(S(snnnmio NMC<liHi-li-lr-I^HiHi-|1H^Heq«^Pq^H'-li-lr-(i-|1HiHiHi-iev|N
< HHHHHHi-IHHrlHHC>^t-t-t-b-t>t»^t-t»t-nO) CO
A-13
parts: that which must be resident in core to control the real-time operations
and a second portion, the Disk Operating System (DOS), which is brought into
core as needed from its disk residence. \Vhile some speed advantages would
accrue from having the entire supervisory function in core, the present con-
cept and its core allotment appear adequate and are discussed in more detail
in Appendix C.
The data storage picture has changed since the initial design because of the
expansion of the E3 subarray to a 19-mile diameter. Expansion of all subarrays
to this diameter would more than double data storage requirements and raise a
serious question as to the necessity of expanding core memory. The single large
subarray, when handled individually, however, is a relatively trivial addition to
storage requirements. This individual treatment does place a small penalty on
machine throughput performance but the analysis indicates that the 131,000
byte core remains appropriate for the Detection Processor.
The Detection Processor speed requirements may be divided into three groups
for discussion:
1. Signal processing algorithms.
2. Input/output operations.
3. Software overhead operations.
The over-riding factor here is the signal processing algorithms and the ability
of the micro coding to produce the anticipated improvement in machine performance.
As indicated in Appendix D, this effort has been successful. A reevaluation of the
input/output functions confirms the original expectation that these functions will
require less than 5 percent of available computer time. Since the investigations
into software overhead requirements, discussed in Appendix C, have raised no
serious performance questions it is felt that the original definition of the Detection
Processor remains appropriate for the experimental LSPS. However, the advan-
tages of symmetrical processors may overcome the arbitrary memory restriction
imposed herein and lead to expansion of the G machine to an H memory.
A.2.1.2 Event Processor
Freedom of hardware selection was logically limited since in an operating sys-
tem the Event Processor must provide the backup function for the Detection Processor.
Paramount considerations were reprogramming and logistic support requirements of
A-14

a system measurably different from the Detection Processor. Since the Event
Processor must operate only on detected events, it can support auxiliary functions
which the Detection Processor cannot. As a result, the primary tools of experi-
mentation, for example, cathode-ray tube displays, and hard copy output,
were assigned to this system. The peripheral device loading of this processor
is very heavy; however, the utilization of these devices will never all occur con-
currently, thus presenting a reasonable system loading effect. Upon review, it
appears a suitable compromise between complexity and cost and the inherent
flexibility essential in an experimental system. System software overhead, as
would be expected in a configuration of this flexibility, will be high but the pro-
gramming effort defined in Appendix C has as yet indicated no reason for aban-
doning the original basic Event Processor configuration.
Such a configuration, while suitable for development of an experimental
LSPS, is not very efficiently applied to general scientific computation, and with
its anticipated system loading, lacks capacity for such tasks.
A.2.1.3 Auxiliary Processor
The Auxiliary Processor is assigned the tasks of coefficient calculations,
general scientific computation and the support of classification studies. Since
in their operating configuration the Detection and Event Processors are dedicated
computers, the Auxiliary Processor also provides a source of reserve computing
power to insulate them from software maintenance functions, for example, pro-
gram assemblies, disk pack updating, high volume printouts, etc. The processor
itself is oriented to scientific processing and there is no inherent reason why it
must be interconnected in the system as shown in Figure A-7. The current view
of its expected utilization indicates that the processor should be initially operated
as an independent computer supporting the Detection and Event Processors with
the question of on line tie-in resolving itself as the detailed utilization develops.
A.2.1.4 General Conclusions
Since the predictions of required computing power and system throughput
are based upon limited data analysis and preliminary estimates of system
A-15

parameters, it is reasonable to develop a moderate hardware configuration with
the ability for modification and expansion at a later date. The review generated
no major changes to the initial system but developed some significant conclusions
for guidance of further system development.
1. Computing power for the present statement of work is adequate.
2. If system functional requirements do not demand concurrent operation
of several areas of peripheral devices, the Event Processor poses
no great concern.
3. In the development of the on-line interface hardware specification,
care must be taken not to present a burden to the Detection Processor.
Indeed, if possible, this hardware should allow optimization of the
detection process.
A.2.2 Experimental Displays
In the previous study contracts, the need for a visual display as an aid in 4
data and technique analysis was studied. An off-line capability was provided
to read magnetic tape data onto a cathode-ray tube and view relative intensity
of a group of beams displayed in k-space coordinates. While this device was a
useful tool in early experimentation it was limited in utility. The tape input for
the display was generated by changes in input parameters and required a rerun
of the tape generation program for each change. This was acceptable for its
original purpose but to monitor the development of an automated signal processing
system, an on-line display, capable of operating integrally with the experimental
processing system is needed.
The breadboard equipment built to provide the off-line capability was used as
a base for the expanded on-line capability. The functions to be provided are:
1. Beam Display
2. Single Waveform display
3. Strip chart recorder
4. Operator communication
A-16

A block diagram of the experimental display is shown in Figure A-8. Input
to the display is normally from the Event Processor via the number one selector
channel and the type 2701 Parallel Data Adapter. The option of switching to
off-line data input from the type 2403 Tape Drive and Control Unit has been
retained. The Tape Adapter and CPU Adapter supply timing and control, and
interface the data flow to the display in their respective operational modes. For
beam display, the CRT operates in a raster scan mode with x and y deflection
being generated in the 5-Bit Counters, passed through the D/A Converters and
applied to the deflection plates of the scope through the summing amplifiers.
The two oscillators operate at different frequencies and effectively dither the
beam spot to enlarge its size. Beam intensity data from tape or the Event
Processor modulates the Z axis through a D/A converter.
The waveform display presents a series of dots whose deflection addresses
are supplied by the Event Processor. Waveform points are plotted at a fixed
intensity minus the x-y dither applied to the beam points.
The Display Controls allow operator input to alter the display mode and
characteristics. The Eight-Channel Strip Chart Recorder allows permanent
recording of up to eight selected time histories obtained from the Event Processor.
A.2.2.1 Beam Display
In the beam display mode, the display provides a visual presentation of beam
magnitude as a function of time. Each beam is represented by a rectangular
area. Beams are positioned according to their inverse horizontal phase velocity
relationship. A maximum of 1024 intensity modulated beams (32 x 32 matrix)
in a closely packed configuration can be displayed.
Operator controls are provided to control the display and enhance its value
as an experimental tool. Timing controls allow the operator to speed up, slow
down, stop, or reverse the display presentation. A pedestal control selects a
coarse or fine value to be subtracted from the beam intensities to enhance utili-
zation of the limited gray scale capabilities of cathode-ray tubes. A scaling
control capable of operating in a linear or logarithmic mode is supplied to aid
in coping with the broad dynamic range of the beam intensities.
A-17

^3° * -^
u CO
tfl */> i/>
o z > S> c <u
4) >
I I
I
N
u < U CO \ CO
o Q u
si
I
75 S c o U
o
t) "S °> c2.E
O u
§
00 3
m o U
o
o c >^
co
>-«-
0) O- o
I—
?
U •- «= = c
a)
-I
4) ri ""
Q. U . 'r 0)
1 .fc Q£ 00 CO
—1— y
0 Q
c o
U
<
1-5* ^T C c O <U g
0) o o
c >
C CN
CO
•5 2 o U Z
X
n O
<
O
c 3
e ed
ei
o o o
pq
>> rt a to
p
c a) S
-i—i
m a x
GO I
<lj
<U
3 & E
A-ll
The Beam display can operate in either the on-line or off-line mode; how-
ever, in the off-line mode the operator controls are disabled.
A.2.2.2 Waveform Display
In this mode, the display presents a single waveform as a function of time.
Positions for the 1024 y positions are displayed on a common x axis. The same
controls described for the beam display may be used to control the waveform dis-
play. If simultaneous beam and waveform displays are being presented, the controls
will act on both the beams and the waveform. Because of the high volume of data
required to present both the beam and waveform together, some flicker is expected.
A.2.2.3 Strip Chart Recorder
In this mode, up to eight waveforms may be transmitted to the Sanborn Chart
Recorder simultaneously. Control logic has been provided to allow data rates
which will optimize the utilization of the equipment. Data recording will occur
at a rate approximately seven times faster than real time. The operator may
control data scaling and data rate as well as paper rate to achieve the desired
presentation. Simultaneous operation of the strip chart recorder and the CRT
is not possible since these two functions share one set of D/A converters.
A-19/A-20

Appendix B
ARRAY INTERFACE MONITOR AND CONTROL
Two areas of effort are discussed in this section:
1. Field Test Planning
2. Interface Equipment Functional Specification
The Field Test Planning addressed the problem of the validity of incoming
LASA data. Test results were expected to provide a basis for determining the
range of system degradation that could occur within the normal operating toler-
ance of the total system. This range could then be compared to the require-
ments of the signal processing methods to determine impact on validity of detec-
tion and event processing results. Prior to completion of the test plan it became
apparent that it could not be executed on a timely basis because:
1. A series of modifications to the data acquisition system was being
executed that would tend to obsolete test results.
2. Though held to a minimum, necessary interference with array opera-
tions does not appear to be compatible, at this time, with scheduled
array operating commitments.
This summary of the initial field program planning is presented here to doc-
ument the effort to date and indicate the planning format, schedule, and overall
scope of a field test program for use in the future should activation of such a plan
become desirable.
The Interface Equipment Functional Specification was developed to reduce 4
the system requirements to a formal statement of interface functional require-
ments. This functional specification will in turn, be utilized as the basis for the
development of the more detailed Interface Equipment Specification. The func-
tional specification was written with the following assumptions:
B-l

1. The LSPS will be located in Billings, Montana.
2. The Interface Equipment will be located within the LSPS laboratory.
3. That the subarray electronics and data acquisition system will
remain essentially as described in Lincoln Laboratory Manual 64,
Volumes 1,2, and 3.
Prior to undertaking effort on these two tasks three preliminary
investigations were performed:
1. A review of available documentation on the existing LASA data
acquisition system was completed.
2. A visit was made to the LASA array to view equipments and operating
procedures at all levels within the array and to discuss operations,
maintenance problems, and future plans with the on-site personnel.
3. A brief survey of commercially available equipments was made
to verify that no significant portion of the interface functions could
be efficiently handled by off-the-shelf commercial equipment.
B.l FIELD TEST PLANNING
Early in this reporting period, planning was initiated for a field test pro-
gram. Objectives were to determine:
1. Point-to-point signal transfer fidelity from the seismometers to
the output from the phone line input system (PLINS)
2. Effectiveness of:
a. Calibration methods
b. Error detection and alarm circuits
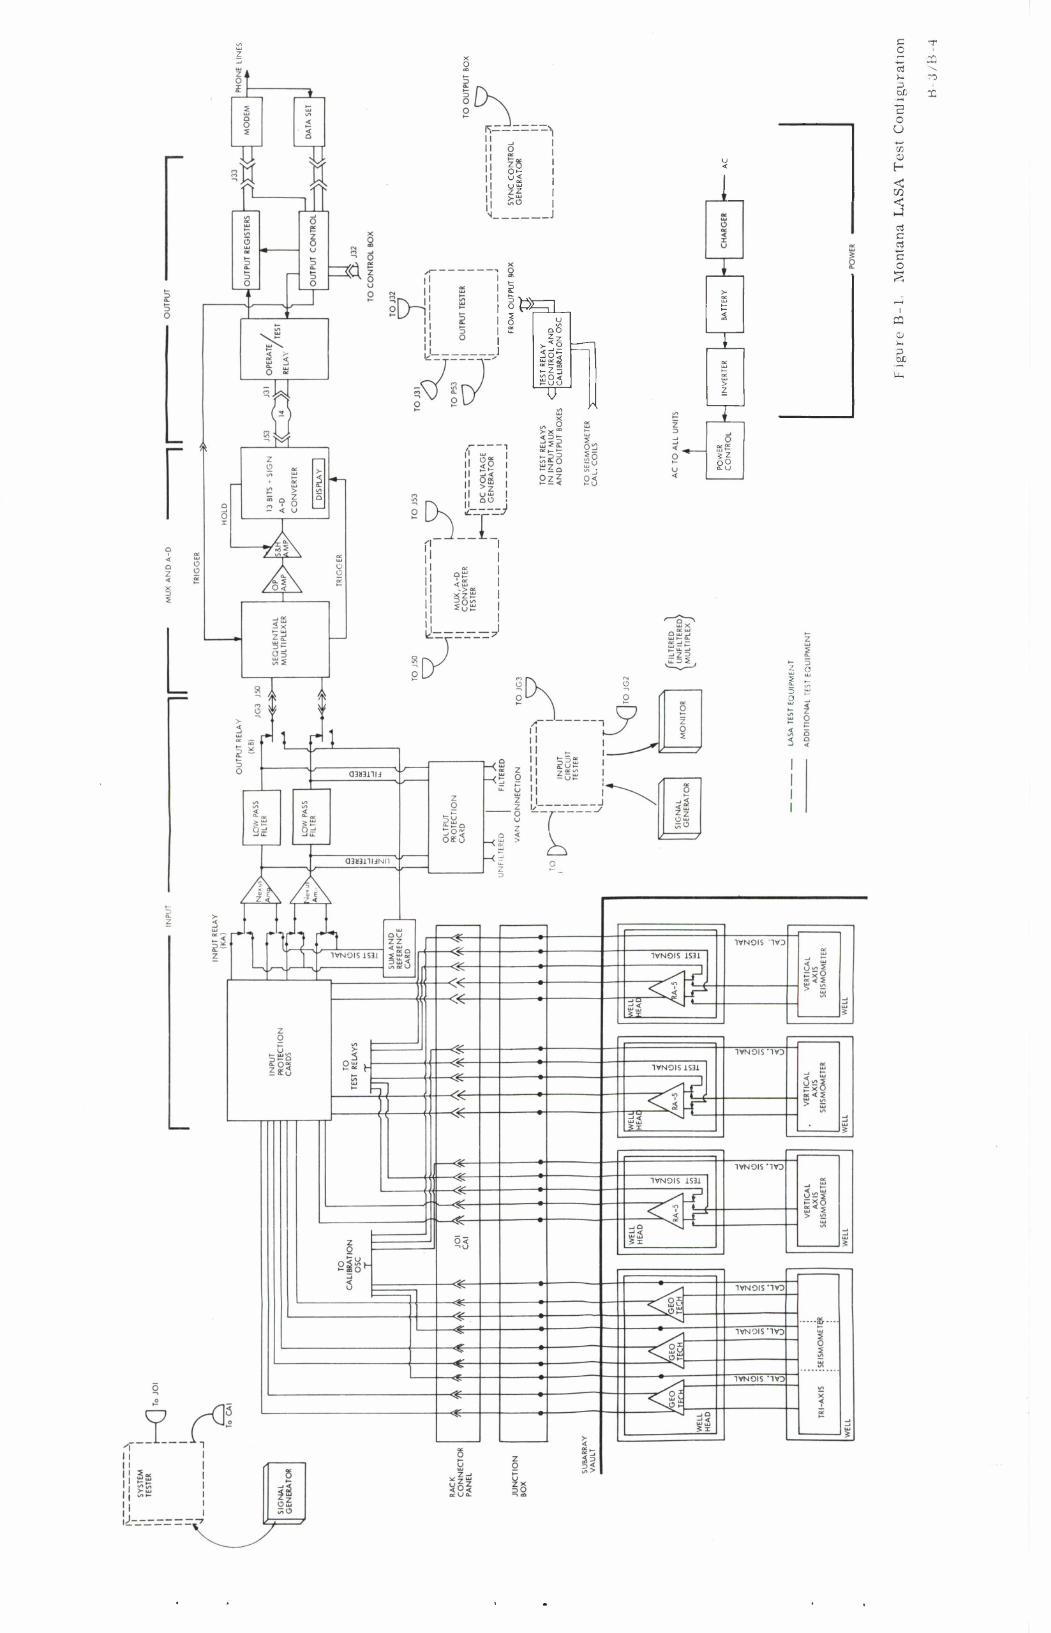
Figure B-l is a summary diagram showing each element of the LASA sys-
tem installed in the wells, wellheads, and vaults. Tests would be conducted at
each interface point under normal operational conditions and for both normal
and special calibration conditions.
Table B-l indicates some of the test parameters, locations, and tie points
involved in the testing of individual system components. This figure is indica-
tive of the type of information felt necessary for definition of tests to be
B-2
1 ^ ?
! gt>X=n , 2 1 O
QO
M s°2 "z = ao< "ou
u ^
^2
I »
c o
s o U
t-
< 09
a I o
I
—
r.

9
H
—
0
.Is 5'3
5 ft
E S
-g.23
li
33
I-
2-
§1
$ 1 - I II CO cfl
^ s: —
sr 5 S 5
S3
7F T 01 s 1 - I
5i T3 wi
en J i. < « v -J "o ^ - .2 jj
D 3 "g
3 £ be
dj B _; 3 03 C2
3 0) ti G M £ Fi -: 5 h 0 I ai
0 c
at — t; H o o H o o
II Ull
boJS
35
IS c £ «J fa
S f-t *»
•aTs
to W
H -
co -3 a a o
_ Sf
t- rt «_, c >>
.— a> c c rt
, X> « c
"I* g =
.T? 0) (0
3 S ?
53 ^ 3 Sao >, ft O E N J
aS' D C 0 3 0, O O O
0 3 I 8 ft 5 o S 3
S ~ T
U <3 CD
**g •o o 3
8.S DO t.
OS U
E I
3 5 o - it r, bfi
ty C "O O t- « _, C a *•• 3 . e c a a •
•= CD c c >, c •-. — e —
III ill 1 M *
£ I S - £ 3 £ a' t; « b ft C ft w c o 3 « E ft O U O ft M
it 5 32
a) m b
H " l» 3 _ ^ ft" g-5 b
5«ggG.2!
-aS 3 a •/. v.
•Si
&is If
1 L lr:glSi.l •i Is: ss^f-Eo
o OJQ;
S-T: oi.2 0) C "D O . t. BJ „ C ^'
c c a a. ^ fc XI ^ B] C
fc E I «- w CO 0 C -o
B-5

conducted on each component. The components reviewed during the initial test
planning included only those portions of the system installed in the wells and
wellheads, plus the input circuits located in the vaults.
Two conclusions resulted from this effort that may be useful in guiding
further test planning:
1. LASA system test equipment will be particularly beneficial in
minimizing the need for the design of special test equipment.
The significance of the LASA test equipment to the program is
indicated in Figure B-l. Testing of devices located in wells and
vaults can be accomplished using standard laboratory test equip-
ment, the LASA system test units and one special signal monitor.
2. Use of test subarray 22 at the Miles City maintenance depot provides
a means for ensuring valid results and minimizing disruption
of system operations. The test subarray and the seismometers and
amplifiers available at the maintenance depot will permit dry runs
of all tests scheduled to be conducted at field sites. This will be
particularly helpful to the field test team and to personnel at the
data recording center who would participate in certain of the tests.
Information gained from the test subarray will also provide comparison
data to validate field test results.
B-6

B.2 INTERFACE EQUIPMENT FUNCTIONAL SPECIFICATION
B.2.1 General Description
The interface system equipment provides the required interface between
the digital computer and twenty-two AT&T modems, type X303A-10. The opera-
tion is to be an on-line two-way communication and will adhere to the message
formats presently in use over the AT&T equipment. The functions of bit samp-
ling, serial/parallel conversion, synchronization, phase reversal modulation,
dotting, data buffering, error control, time of day insertion, and array timing
must be performed by the interface equipment to communicate with the AT&T
modems. The communication with the computer must conform to the require-
ment of the System/360 Selector Channel.
B.2.2 Interface with the AT&T Modems
This interface is to provide for simultaneous full duplex operation over
twenty-two communication lines making use of AT&T modems, type X303A-10,
operated with an external clock. Control and synchronizing information is trans-
mitted to the subarrays and binary data is received from them. Twenty-one
modems provide communication with the twenty-one subarrays and the twenty-
second modem provides communication with a remote dummy subarray used for
maintenance purposes. A single clock controls the timing of the interface and
subarray equipment. The specifications for the signal lines connecting the
X303A-10 modems, operating in synchronous mode with the external sync option,
are contained in the Bell System Communication Technical Reference Manual,
Wideband Data Stations X303A-10, X303A-20, X303A-30 Types, Interface Speci-
fication, October 1964 - Preliminary.
B.2.3 Interface with the Computer
The computer interface is to be a System/360 Selector Channel on the
Model 40 computer. By means of this interface operating in a half duplex
manner, the incoming data from the arrays is buffered and transmitted in blocks
B-7
of up to 5 samples to the computer. Control messages for the arrays are
communicated, in blocks, of up to 4096 bytes from the computer to the inter-
face equipment. Computer programming is required to control the selector
channel and affect these data transfers.
Specifications for the signal and data lines connecting to the System/360
Selector Channel are contained in the Original Equipment Manufacturers Infor-
mation Manual for the device (Form A22-6843-2).
B.3 OPERATIONAL CHARACTERISTICS
B.3.1 Transmission to the Subarrays
Transmission to each of the twenty-two SA's is serial by bit at a 19.2 kilo
bit per second rate by means of an AT&T modem, type X303A-10, which is
operated with an external clock. Twpntv messages per second of 60 bits each
(1200 bps) are transmitted to each SA (on the second and every one-twentieth
of a second thereafter). This 1200 bit per second data stream must be modu-
lated by phase reversal at an 8 to 1 rate to give a 9.6 KHz rate which is required
by the modems. (See Figure B-2.) The 60-bit messages must have the follow-
ing format. The first four bits of each message are l's followed by 6 bits of com-
mand data followed by 50 bits of 0's (see Figure B-3). This message, with the
six bits of command data set to 0's, is transmitted continuously to all SA's until one
of the SA's is selected (by computer) to receive control information. When an
SA is selected, three consecutive messages containing the same six bits of com-
mand data are transmitted to the selected SA and the other twenty-one SA's
receive the message with zeros in the command data field.
The serial stream of data transmitted to each SA must be delayed in time
by an interval equal to twice the difference between the transmission time to that
particular SA and the transmission time to the farthest SA from the data center.
The delay interval may be in increments, T, with T = Vn3 • Tne delays
for each SA must be adjustable to permit the returning data to be in bit synchro-
nism (+T). The maximum delay required is less than three milliseconds.
B-8

a P. Q o
•u
s
H
« 2
e '- o
I
S-
•H
o
o
2 6
N o
u g O
o —
a CO
m
oo
^
3 ci « Q o
-t->
-a CD c S to
H H
•2
I o
•4-» ed
o
CO I
CQ
I
N
— CM li N "w
•!•!
I
B-9

In addition to the control information transmitted to each SA, a 19.2 KHz
square wave clock pulse train must be furnished to each X303A-10 modem.
B.3.2 Receiving Data from the Subarrays
Incoming data from each of the twenty-two SA's is in serial by bit form at
a 19.2 kilo bit per second rate. The data is in di-bit form, i.e., a one is repre-
sented by two bits, a one followed by a zero, while zero is represented by a zero
followed by a one. The incoming data is framed in messages of 32 words of 15
bits each. The 15th bit of each word is a parity bit to force the word to have an
odd number of l's and is used in error checking. The first word of each mes-
sage is a synchronizing word containing a fixed pattern of l's and O's. The
remaining 31 words contain numerical data in 2's compliment binary form. This
incoming stream of serial data must be converted to 15 bit words and stored in
a buffer store for transmission to a computer. The amount of buffer store for
each of the 22 incoming data streams must be a minimum of 224 words of 15
bits each.
In addition to the incoming data stream a serial clock wave form is also
received from the modems. It is the same frequency clock pulse that was
transmitted and is used to time the sampling of the incoming data stream to
determine the presence of ones and zeros. The received clock wave form will
not generally be in phase with the transmitted clock wave form.
B.3.3 Transmission to the Computer
Transmission of data to the computer will be via the System/360 Selector
Channel Interface. Data and status information is transmitted in a half duplex
mode parallel by bit and serial by byte (8 bits plus parity). The interface
equipment must perform the functions of byte/word conversion, parity genera-
tion and checking, and generate the appropriate signals to enable proper opera-
tion on the Selector Channel without interfering with other control units on the
same channel. Data transfer will be in blocks up to 5 samples (3410-16 bit
words). Error conditions and phone line malfunctions are included in the status
information transmitted to the computer.
B-10
B.3.4 Receiving from the Computer
Data and command information will be received from the computer through
the same System/360 Selector Channel interface that is used for transmission
to the computer. The data and command information is transmitted parallel
by bit and serial by byte on a demand-response basis. The interface equipment
must perform the byte /word conversion, parity check, and generate the necessary
signals to ensure proper operation of the Selector Channel without interfering
with other control units in the same channel. Data will be received in blocks
of up to 4096 bytes.
B.3.5 Real-Time Clock
A time-of-year generator must be furnished to provide day-of-year, hour,
minute, second, tenth and hundredths seconds. This generator is to be synchro-
nized with WWV transmissions. The output of this generator is to be read out
and stored with each message from the subarrays. One pulse per second, on the
second, is to be supplied to the timing circuits to ensure that the synchronizing
signal is transmitted to the subarrays on the second and every one-twentieth of
a second thereafter.
B-ll/B-12

Appendix C
PROGRAMMING
During this first quarter, primary effort was necessarily oriented toward
systems programming (Supervisor/Monitor component) and the first of the
operational components (Detection Processor) to be implemented. Further,
the first efforts were analytical and planning functions, and the generation
of preliminary versions of the program components for testing purposes.
This section describes the progress made in analyzing, planning, and gen-
erating the Supervisor/Monitor and Detection Processor components.
C.l SUPERVISOR/MONITOR COMPONENT
The systems programming effort proceeds naturally in the order of analysis,
planning of development stages, functional segmentation, program segmentation
and logic design, coding, testing, and documentation. The first quarter was spent
mainly in programming analysis and planning to support operations with the two-
computer intermediate configuration.
System programming during the first quarter embraced the following
activities:
a. Determination of system hardware configuration.
b. Identification of intermediate functions and types of operations
to be supported.
c. Recommendation of desirable and feasible equipment changes.
d. Selection of applicable standard software support and other
programming materials.
e. Identification of areas for more intensive analysis.
f. Initiation of planning of program development stages.
Each of these, except for the last, are briefly reviewed in the following
subsections.
C-l

C.2 PROGRAM PLANNING
C.2.1 Determination of System Hardware Configuration
Although subject to modification and addition or deletion of peripherals,
the basic hardware configuration was defined by prior system effort. Figure
A-6 and subsection A-2 of Appendix A present the configuration as it existed
at the beginning of systems programming analysis.
C.2.2 Identification of Intermediate Functions
The Detection Subsystem goal is to respond to inputs in real time, as well
as to communicate with the Event Subsystem for control purposes. The Event
Subsystem is a more flexible system, capable of investigating detected arrivals
when triggered by the Detection Subsystem, yet capable of other automatic
processing as time permits. Obviously, the transition from standard software
packages and general purpose operations to a system capable of automatic opera-
tion must be a multistep process. Therefore, it was appropriate to identify
intermediate functions and steps in the development.
C.2.2.1 Detection Subsystem
The Detection Subsystem will at first operate from tape inputs and use a
standard software, general-purpose operating system as its monitor. This will
allow debugging of the program(s) which perform detection processing. A con-
sideration in the growth from this to a real-time system is that a standard oper-
ating system provides many services, not all of which are utilized, and some of
which are more comprehensive than needed by a well-defined, streamlined real-
time system. A real-time system has been defined as one "which must satisfy
various response times to inputs over whose rates it has little control, and the
design of which is dominated by this requirement." Hence, the emphasis is on
speed rather than general application, and expedients are employed that cannot
be incorporated into a general operating system.
C-2

The standard software systems available for use on the System/360 Model 40
carry out many supervisory functions using programs which are not core resi-
dent, but must first be retrieved from the system's residence (a disk memory
for this system). A natural objective in transforming such a system into a real-
time system is to reduce or eliminate those disk accesses which represent over-
head, detracting from the system's performance. The first thought is to place
these "transient" programs in core memory, but this is impractical as hundreds
of thousands of locations are required. Another thought is to replace them with
short versions, tailored to the application. But to do this for over 100 programs
is also impractical. The best approach, therefore, lies somewhere between
these two extreme approaches. The transients must be shifted and sorted ac-
cording to function; some eliminated, many replaced by new but less general
routines, and some made core resident without change. This rather drastic
restructuring of a system must take place independently from other types of
changes needed to build the real-time Detection Subsystem.
In the meantime, a general purpose system will provide the framework for
building other monitor functions, such as acquiring input data in simulated real
time rather than from tape, using the channel-to-channel link with the Event Sub-
system as a simulated real-time interface. Another detection monitor function
is the ability to adapt, in real time, to changes in conditions or operating mode,
e.g., array status change or a new set of filter coefficients.
One intermediate goal, then, is to simulate real-time inputs, and another is
to receive and respond to other data from an external source.
These are foreseeable intermediate functions, but they must be designed
with the thought that other types of support may be identified during intermediate
stages due to the experimental nature of the application; for example, tools to
evaluate Detection Subsystem performance.
C .2.2.2 Event Subsystem
An investigation was made into those Event Subsystem functions that could
be predicted at this stage, to determine the type(s) of monitor support needed
ultimately and for intermediate stages. The criteria needed to implement the
C-3

most effective automatic event subsystem are determined partly from experience
gained from experiments run with general purpose operating system and then,
evaluation of a semiautomatic operation.
Standard software packages do not support all of the devices to be connected
to the Event Processor. The first goal, therefore, was to modify the supervisor
of the general purpose system to support all devices in the system. It was sus-
pected that one particular device, the experimental display, might require a unique
system for its operation, and may not fit in with any "final" Event Subsystem opera-
tion. While all specifications are not yet firm for this device, it is known that its
operation will require continuous use of a selector channel.
It was clear that there would be other intermediate steps in the evolution
from a general purpose system to an automatic system. The definition of these
steps would first depend a great deal upon the types of operation as seen from
the applications point of view. A study was in progress on this subject as the
first quarter closed.
C.2.3 Equipment Recommendations
Early and continued analysis led to a series of recommendations in the area
of equipment configuration in the interest of efficient computing or other systems
programming considerations.
a. The storage protection feature was recommended for inclusion on the
System/360 2040H Processor to enable the generation of a multi-
programmed system. This would give added flexibility by lending
efficiency to early operations, and providing safety in later operations
where debugging runs could take place concurrently with a
production run without danger of interference.
b. Assignment of a line printer permanently to the System/360 2040H
Processor was recommended. This implied ordering an additional
printer, since the plans called for the intermediate configuration to
eventually lose the original line printer. This would allow on-line
printing for dumps, listings, logging, and system maintenance functions
for an indefinite period and would facilitate independent use of the two
System/360 Model 40's.
C-4

c. A change in selector channel assignment was recommended for the
2311 disk to allow a better balanced input/output load over the
channels.
It was suggested that a second disk memory be available by the time both
System/360 Model 2040's were available, and that the Detection Processor
might be used for general purpose functions temporarily.
A 1052 printerAeyboard was recommended for connection to the System/
360 2040G Processor, so that the addition of a disk would allow debugging runs
under the Disk Operating System, which is the support package that was chosen
by that time.
C .2.4 Identification of Standard Software
The identification began with an investigation of the standard software pack-
ages available, including the System/360 Operating System (OS), the Disk Oper-
ating System (DOS), and the Basic Programming System (BPS).
OS offered the greatest flexibility, but was discarded due to the core re-
quirements and the excess amount of "overhead" time required. OS, even though
modular, is constructed in such a way as to require a great amount of time to be
spent in orientation. This is not only true in the systems area, where knowledge
of content is critical, but also at the application program level. BPS has neither
of these drawbacks, but would require extensive modifications to support the
foreseen operational system.
It was decided that DOS would provide the best base upon which to build the
ultimate system. The power of DOS would allow ease of testing (debug) pro-
cedures while the modularity would make additions and deletions a much simpler
task. The use of OS in the Event Processor, while using DOS in the Detection
Processor, was considered. The basic problems were maintenance and
operation for two unique systems while the only tangible gain is the support
of the 2250 Display Unit. It was felt that the use of two operating systems could
not be justified for this gain alone.
C-5
C .2.5 Identification of Areas for Intensive Study
One of the most readily apparent problem areas was that of software sup-
port for non-standard devices. These consist of: 1627 Plotter, experimental
display, strip chart recorder, 2250 Console, and the 2740 Remote Terminal.
Some of these are standard IBM hardware, but are not supported under DOS, or
are supported in such a way as to seriously impair performance of the opera-
tional system if used without modification.
Another problem identified for further analysis is the interconnection of
the two processors. This connection can be implemented in two ways: first,
the direct communication which occurs via the channel-to-channel connection
and the read/write direct control feature (features not supported under standard
IBM packages); and secondly, the use of two processors with common control
units for tapes and for disks. This latter is envisioned as a three-step problem:
understanding the hardware of the control units, analyzing the status presented
by the control units under various conditions, and finally relating this to the
channel selector code provided by DOS. The last step in this problem is made
complicated because of the technique employed by DOS for I/O error
checking and recovery. This involves the use of transient programs which are
loaded from disk whenever an I/O error occurs. These transients are executed
one at a time and usually involve several overlays. This makes the core resi-
dent portion of the input/output control system relatively small in size, but very
complex.
The analysis of this channel selector code was dependent on a new release
of DOS incorporating multiprogramming which was being developed at the time.
A pre-release of this documentation was secured and the identification of the
routines that would require modifications was started.
C-6

C.3 DETECTION PROCESSOR COMPONENT
The Detection Processor component is made up of two sections: the Data
Acquisition section and the Detection Controller section.
C.3.1 Data Acquisition Section
The Data Acquisition section is a programmed procedure for acquiring
and introducing seismometer data into the Detection Processor.
The source of seismometer data (at present) is the LASA magnetic tape
recordings (high rate format). This seven-track tape contains two sample
periods per record and the data is in 18-bit words. The Detection Processor
system requires lG-bit data words and, therefore, a substantial amount of
reformatting is required.
It was felt that reformatting should be performed as a preprocessing func-
tion rather than be an integral part of detection processing proper. Thus, the
Data Acquisition section will edit and reformat the LASA magnetic tape recording
and create another tape for direct use by the Detection Controller section of the
Detection Processor component.
The Data Acquisition section will read the LASA tape and check the data
word for parity errors and illegal values and substitute the last valid data value
for any data word in question or for any sample period for which data was not
available.
The tape generated from the Data Acquisition section will be a 9-track tape
with System/360 16-bit data words.
C.3.2 Detection Controller Section
The Detection Controller section is the application software which performs
detection processing on raw data by the use of microcoded programming. A
preliminary version of the Detection Controller was written to test the inter-
action of the microcodes. This section read seismic data from tape, formed
two subarray beams, filtered the beams using the recursive filter, formed six
LASA beams, did arrival detection, and printed starting and ending times for
detected arrivals. The data used was a specially prepared set containing seg-
ments from six events.
C-7

Preliminary results from this basic controller indicated that input/output
compatibility exists between the microcodes when employed in the logical sequence
required for detection of events. The simultaneous use of input devices and micro-
codes was implemented smoothly. Similar results were found using the micro-
codes and simulation routines as discussed in Appendix D.
Secondary results of writing this Detection Controller section included indica-
tions on faster methods of setting up microcode inputs, and methods of assigning
storage areas for various sized data filter order.
C-8

Appendix D
MICROCODING
D.l INTRODUCTION
During this reporting period, microprogram simulation programs were
developed for use in initial microprogram development, for use as diagnostic
routines later in the effort, and as a standard in actual microprogram tests
when the microcoded machines became available.
In the latter part of the reporting period, product tests were conducted at
the IBM Poughkeepsie Product Test Laboratory. These tests incorporated
testing of both the microcode equipment performance and the microprogram
performance, and used the simulation program results as a standard.
Problems encountered with RIT (rectify, integrate, threshold) algorithms
prevented a few tests of the RIT algorithm from being performed during the
product tests. Later efforts resulted in modifications to the RIT and testing
of this area will be performed following the installation of the Detection
Processor.
The following subsections describe the microcoding activities in detail.
D.2 SIMULATION OF MICROCODED PROGRAMS
Software programs to simulate the microcode operation were developed
concurrently with the development of the microprograms. These software pro-
grams contained most of the exceptional condition checks made in the micro-
codes. A standard interface was developed, using micro instructions, which
allowed either the simulation programs or microprograms to communicate with
the programs using them. By using this approach, the simulation programs
could be substituted for the microprograms until a machine incorporating the
latter became available.
D-l

There were three reasons for developing these programs: (1) They allow
development of the Detection Processor program prior to delivery of the micro-
coded machines; (2) These programs are identical in function to the micro-
programs and can be used for testing purposes to assess the mathematical
operation of the microcodes, as well as testing handling of some special con-
ditions, (3) They can be used later as diagnostic routines to help detect on-line
equipment failures and validate microcode results.
D.3 MICROCODE TESTING
Equipment tests were conducted by the IBM Poughkeepsie Product Test
Laboratory and addressed equipment reliability. Program tests were designed,
conducted, and evaluated to determine their mathematical accuracy and opera-
tional applications. There were two types of microcode tests: equipment and
microprogram.
D.3.1 Equipment Testing
Equipment testing addressed two areas: (1) verification of the special
microcode modifications, referred to as the LASA RPQ and (2) equipment design
tests.
The RPQ verification included assuring fundamental system performance
with the RPQ installed. The tests included safety, basic equipment parameters,
and diagnostic RPQ installation checkout.
Equipment design tests consisted of operating 24 reliability and diagnostic
programs associated with the RPQ and registers used by the RPQ. In a multi-
program environment, LASA diagnostic, reliability, and other diagnostic pro-
grams were used over extended periods of time under both normal and marginal
operating conditions to check reliability and accuracy.
D.3.2 Microprogram Testing
The following programming tests were conducted on the microcoded System/
360 Model 40 Detection Processor:
D-2
a. Mathematical Verification—Each microcoded algorithm was run
independently. Accuracy was verified by a comparison of the
results with the results of simulation programs which used the
same input data.
b. Special Conditions —Manually-generated inputs were used to
exercise the abnormal and unique data paths associated with the
four microcoded algorithms. Conditions tested included overflow
handling (intermediate and final), illegal instruction parameters,
and various shifting and output options.
c. Interaction—Compatibility between microcoded algorithms was
verified by sequencing operation of the algorithms in a manner
simulating that of the intended operational environment. Due to
problems encountered with the RIT algorithm during the mathe-
matical verification and special condition tests, and the late solu-
tion of the problems, the RIT algorithm was not used during the
interaction tests. As in the mathematical verification tests,
Longshot data was used as input and the results were confirmed by
comparison with the verified results of simulation programs which
used the same input data. The interaction test using all four
algorithms has been deferred until installation of the Detection
Processor in the Washington laboratory.
D.3.3 Test Results
All problems detected were minor and were corrected and verified prior to
shipment of the equipment from the Poughkeepsie Product Test Laboratory.
Table D-l shows the algorithm performance, including the microcoding
performance, both actual and anticipated.
D.4 MICROCODE SPECIFICATIONS
The capability of the RIT instruction was expanded beyond its initial defini-
tion. This expansion was in the threshold computation area, and involved
replacing the initial 3-bit shift with a variable shift. The shift is applied to
D-3

d o> £ i o o
"8 u CU
m 2 to
o 5
a m
•° 3 fig
0) HH J-i o
0) •s to
3
cd > 43
S CO
TO 0)
0> N ? "O
CD >
•.-I CO
3 O CD K CO cd
Si! cd ••*
W fa
xi 2 CD g
-a a
cd •»->
O CO
CO n,
3* * s o> o > <*-!
fa 2
0)
II w
£>£ > ^ W o
. o 0> iH
8fg 0) M > O" ed a,
> •rH
IH ed
d
cs u-i
c ed CJ a
he
CO
ed
c h o o a t! » «3 a CO <
as a
si U JS CD co . I 0) g 5PS § SBJS
a
0) ed
GO
in CD
en 00
lO
CO CO
a> cd co P? So
ejs CO
o
CO
o 05
O
3 cd TJ tn CD
2 & &|
CO o O o
CM
I
a
-a
0) ho 2^ &D »
cd g
^3 o cd
lb 0 o co u CO CL <
CSJ o CO
CM
CO
h be o>
CO c •i-H
CO 0) 3 UH
u u 0 n o > h fa CO fa 3 3
cd O
A 0)
GJ
e o
o > a o U
b
u CD
D-l

4 the product of the threshold variable (Uj or Vj) and the long-time average value.
This expansion allows a greater range of scaling in the long time average compu-
tation section as well as affording a greater range of scaling in the long time
average computation section and a greater resolution in the signal-to-noise
ratio required for detection. The execution time penalty for this expansion
ranges from 3 to 18 microseconds per beam.
D-5/D-6
Appendix E
WASHINGTON LABORATORY
The design and planning of the computer laboratory was completed during
this quarter. While the detailed specifications for such a laboratory are docu-
mented in R&D Data Item 3, Montana Facility Requirements Specification, some
of the parameters involved in the design of the computer laboratory are briefly
discussed here.
E.l COMPUTER LABORATORY LAYOUT
A major consideration in laying out the computer laboratory was the
•phased build-up of equipments from one computer to an eventual configura-
tion of three processors, special I/O equipment, displays, and consoles. To
arrive at a layout that efficiently supports each of the successive intermedi-
ate configurations as well as the final one, necessitates some compromise
in flexibility.
The computer room has been designed to allow the greatest degree of unre-
stricted movement of the operator to and from the consoles and input/output
equipment. Direct access has been provided between the tape units and tape
library with intermediate tape storage and working areas close to the tape units.
The consoles were positioned so that a minimum number of operators would
be required to maintain control of the entire room. At the same time, considera-
tion was given to the maintenance requirements of field engineering by positioning
control units so that the maintenance panels were visible from their respective
consoles. The positioning of certain units was dictated in part by the restrictions
of maximum cable length per selector channel.
E-l

Several computer room layouts were made and evaluated before selecting
the one shown in Figure E-l. The operation and maintenance consoles with
their associated displays were placed at one end of the room with provision
for independent lighting control while the displays were being used.
E.2 FLOOR CONSTRUCTION
In selecting the raised floor for the laboratory, the criteria of flexibility was
felt to be paramount. A pedestal type floor was selected to allow line of sight
connections between all units, thus reducing the overall cable length required
to make a connection. This free access type floor also allows much greater
freedom of movement in rearranging equipment in the room. This was espe-
cially important to this laboratory because units such as the 1403 Printer and
2520 Card Reader/Punch are to be reassigned successively to each of the three
computers as they are installed.
The factors to be considered in determining the floor loading are specified
in Section 2.6 of the Montana Facility Requirements Specification, dated Decem-
ber 1, 1966. An illustration of the raised floor is shown in Figure 7 of this
same document.
E.3 AIR CONDITIONING
As the heat load in the computer room could be concentrated in relatively
small areas near specific equipment, it was decided that an underfloor air plenum
system, with easily relocatable floor registers for air flow adjustment, would
best meet the laboratory needs.
Temperature and humidity recording instruments will be used in the com-
puter room to determine where air flow adjustments are required. Air flow will
be continually monitored as computer equipment is incrementally installed and
floor registers repositioned to overcome hot spots or other problem areas that
may develop.
Air conditioning load to the computer laboratory considered the following
requirements:
E-2

|ox)uo3
fr08Z/E082
IN
|
3 8
, _* CM Q
, -* CN Q
Q,PP |OJ4UO^
1282
-¥ 0) 01 o s i/i u
CM b u 0 on U
s.
CM •O O p—
V o "o m S CN o
U
s O
CO
CO o 00 CN
V Q. O
1—
•«• O
o CO C r^ o CO
<J o V CO Q. CN O
1—
•
CN e 0
•-
a >
S o
1—
0) > CN *ir
CN »
O
V > 'N J; ?° CN £
0 1—
suispoyy
8-2
CN £ 2 0
S|05U0 2)
U014DJ3do
3|OSUO^ 93uou34uiDyy
T *- 5 53 £
CO
o u O >> - 5 - - i s j ~
3 C O o >, &3 5 s
Was
R
oo
r-i
w 33 - 3,
P-H

1. Commercial Equipment
S/360 Model BTU/hr.
40G 39,375
40H 55,950
44H 32,700
Auxiliary 1,000 129,025 BTU/hr.
2. Maintenance Lab Equipment 15,000 BTU/hr.
3. Air Conditioning Loss (wall leakage, people, etc.) 12,500 BTU/hr.
4. Allowance for future equipment
ISE's 35,000
Consoles 12,700 47.700
204,225 BTU/hr.
Consideration of possible future laboratory expansion and scheduled and
unscheduled air conditioner maintenance indicated the desirability of multiple
modular units. Evaluation of these factors resulted in the installation of the
following system:
Four units, each with the following characteristics:
Total tons 8.9 at 73° dry bulb, 60° wet bulb
return air, 100° ambient outside air.
Sensible tons 7.9 94,800 BTU/hr.
Output from the air conditioning system is sufficient to support defined
requirements during periods of maintenance or failure of any single unit.
E.4 POWER DISTRIBUTION AND CABLING
The electrical power load in the computer laboratory has been broken out
into two parts: air conditioning and computer power. Each load has its own
transformer, main power distribution panel, and emergency off system. These
emergency off systems consist of solenoid-operated breakers feeding the main
power distribution panels and operated by trip switches convenient to all oper-
ating areas and laboratory exits. Thus, in any emergency, air conditioning power,
or computer power, or both may be turned off instantly throughout the laboratory.
E-5

Figure E-2 shows in block form the power distribution equipment and its
physical location relative to the computer laboratory. The two transformers
feed through their respective Emergency-Off solenoid switches to the Main
Distribution Panel A (MDPA) and the Main Distribution Panel B (MDPB).
MDPA contains four circuits. One of these circuits feeds the two com-
puter distribution panels, PNL 360A and PNL 360B. Two others are utilized
to feed the Maintenance Laboratory Panel (PNL ML), and the Special Equip-
ment Panel (PNL SE). The fourth circuit is available as a spare.
MDPB contains six circuits. Four of these circuits are used to individually
feed the four air conditioning units. One circuit feeds the Roof Air Conditioning
Panel (PNL R) located on the roof of the building, which feeds* power to the
condenser pumps. The sixth circuit is a spare.
Use of the secondary distribution panels, (PNL 360A, PNL 360B, and PNL SE),
allows flexible metal conduit to be run beneath the raised floor of the computer
laboratory directly to the individual pieces of equipment. Necessary cable lengths
are minimized as well as installation and modification costs as the system evolves.
E-6

r I l
O) _D
I
c
O)
X
g 3 0) u- O
fcO_a>< iS *^»
in
a:
e in
o 0 s a o 3
IH CD
0 a.
N I
w <D (H 3 bC
E-7

UNCLASSIFIED Security Classification
DOCUMENT CONTROL DATA • R&D (Security cleeaittcation of title, body ot abstract end indexing annotation mull be entered wnen the overall report ta ctassitied)
1 ORIGINATIN G ACTIVITY (Corporate author)
International Business Machines Corporation 18100 Frederick Pike Gaithersburg, Maryland 20760
2« REPORT SECURITY CLASSIFICATION
UNCLASSIFIED 2b GROUP
N/A 3 REPORT TITLE
FIRST QUARTERLY TECHNICAL REPORT- LASA EXPERIMENTAL PROCESSING SYSTEM
4 DESCRIPTIVE NOTES (Type ol report and Inclusive datee)
5 AUTHORfS) (Laet name, llrmt name, initial)
6 REPORT DATE
FEBRUARY 1967 7« TOTAL NO OF PACES 7b NO OF REFS
8«. CONTRACT OR GRANT NO.
AF19(628)-67-C-0198 6. PROJECT NO
9a ORIGINATOR'S REPORT NUMBER^
ESD-TR-67-458
9b OTHEK REPORT HO(S) (A ny other number* that may be ae»lgn*d thim nport)
N one 10. AVAILABILITY/LIMITATION NOTICES
This document has been approved for public release and sale; its distribution is unlimited.
II SUPPLEMENTARY NOTES 12 SPONSORING MILITARY ACTIVITY
Electronic Systems Division L. G. Hanscom Field, Bedford, Mass. 01730
13 ABSTRACT
This document, the LASA Experimental Signal Processing System First Quarterly Tech- nical Report, discusses the effort expended during the first quarter to provide the hardware and software necessary to support research and development directed toward the study of seismic signal processing and delineates tasks planned for execution during the next quarter.
In addition to work accomplished and future plans, this document presents detailed information related to System Data Flow and Hardware Configuration, Array Interface Monitor and Control, Programming, Microcoding, and Washington Laboratory in Appendices A through E, respectively.
DD .KM-1473 UNCLASSIFIED Security Classification
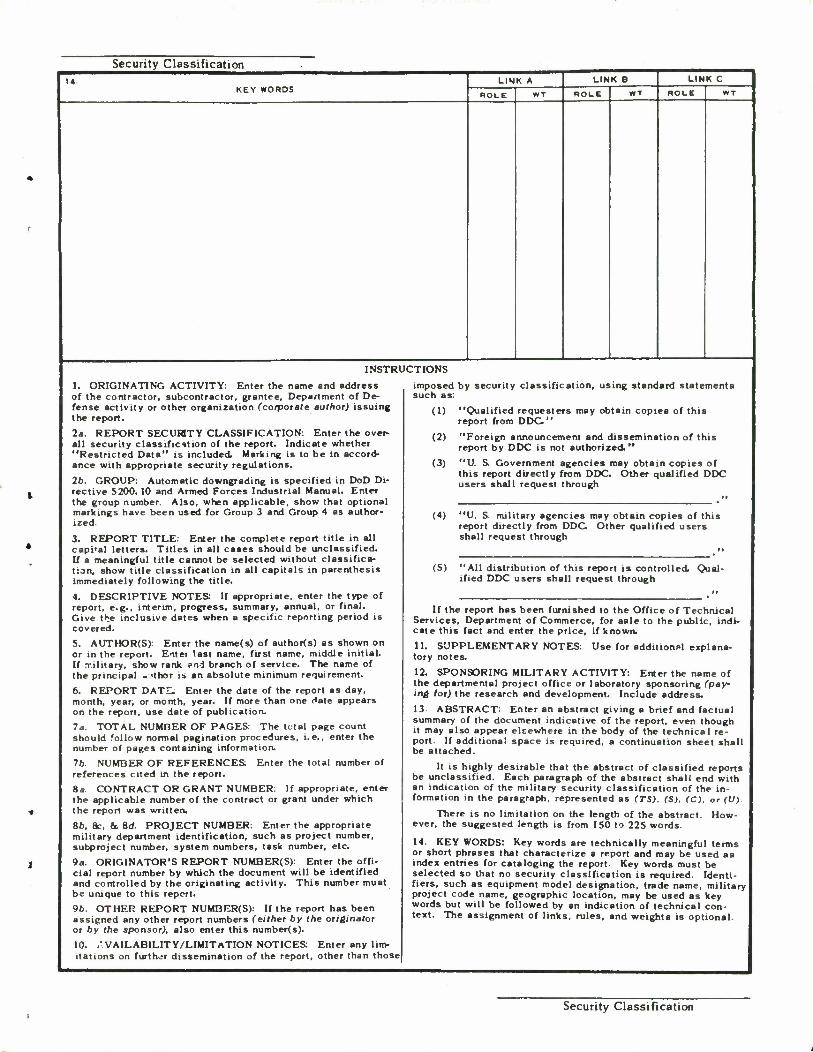
Security Classification
KEY WORDS LINK A LINK B LINK C
INSTRUCTIONS
1. ORIGINATING ACTIVITY. Enter the name and address of the contractor, subcontractor, grantee, Department of De- fense activity or other organization (corporate author) issuing the report.
2a. REPORT SECURITY CLASSIFICATION: Enter the over- all security classification of the report. Indicate whether "Restricted Data" is included. Marking is to be in accord- ance with appropriate security regulations.
2b. GROUP: Automatic downgrading is specified in DoD Di- rective 5200.10 and Armed Forces Industrial Manual. Enter the group number. Also, when applicable, show that optional markings have been used for Group 3 and Group 4 as author- ized.
3. REPORT TITLE: Enter the complete report title in all capital letters. Titles in all cases should be unclassified. If a meaningful title cannot be selected without classifica- tion, show title classification in all capitals in parenthesis immediately following the title.
4. DESCRIPTIVE NOTES: If appropriate, enter the type of report, e.g., interim, progress, summary, annual, or final. Give the inclusive dates when a specific reporting period is covered. 5. AUTHOR(S): Enter the name(s) of authors) as shown on or in the report. Entei last name, first name, middle initial. If xilitary, show rank and branch of service. The name of the principal • 'thor is an absolute minimum requirement. 6. REPORT DATI^ Enter the date of the report as day, month, year; or month, year. If more than one Hate appears on the report, use date of publication. 7a. TOTAL NUMBER OF PAGES: The total page count should follow normal pagination procedures, i.e., enter the number of pages containing information. 7b. NUMBER OF REFERENCES: Enter the total number of references cited in the report. 8a. CONTRACT OR GRANT NUMBER: If appropriate, enter the applicable number of the contract or grant under which the report was written. 8b, 8c, k 8d. PROJECT NUMBER: Enter the appropriate military department identification, such as project number, subproject number, system numbers, task number, etc. 9a. ORIGINATOR'S REPORT NUMBER(S): Enter the offi- cial report number by which the document will be identified and controlled by the originating activity. This number must be unique to this report. 9b. OTHER REPORT NUMBER(S): If the report has been assigned any other report numbers (either by the originator or by the sponsor), also enter this number(s). 10. .VAIL ABILITY/LIMITATION NOTICES: Enter any lim- itations on further dissemination of the report, other than those
imposed by security classification, using standard statements such as:
(1) "Qualified requesters may obtain copies of this report from DDC"
(2) "Foreign announcement and dissemination of this report by DDC is not authorized."
(3) "U. S. Government agencies may obtain copies of this report directly from DDC. Other qualified DDC users shall request through
(4) "U. S. military agencies may obtain copies of this report directly from DDC. Other qualified users shall request through
(5) "All distribution of this report is controlled. Qual- ified DDC users shall request through
If the report has been furnished to the Office of Technical Services, Department of Commerce, for sale to the public, indi- cate this fact and enter the price, if known.
It SUPPLEMENTARY NOTES: Use for additionpl explana- tory notes.
12. SPONSORING MILITARY ACTIVITY: Enter the name of the departmental project office or laboratory sponsoring (pay- ing for) the research and development. Include address. 13. ABSTRACT: Enter an abstract giving a brief and factual summary of the document indicative of the report, even though it may also appear elsewhere in the body of the technical re- port. If additional space is required, a continuation sheet shall be attached.
It is highly desirable that the abstract of classified reports be unclassified. Each paragraph of the abstract shall end with an indication of the military security classification of the in- formation in the paragraph, represented as (TS). (S). (C). or (U).
There is no limitation on the length of the abstract. How- ever, the suggested length is from 150 to 225 words.
14. KEY WORDS: Key words are technically meaningful terms or short phrases that characterize a report and may be used as index entries for cataloging the report. Key words must be selected so that no security classification is required. Identi- fiers, such as equipment model designation, trade name, military project code name, geographic location, may be used as key words but will be followed by an indication of technical con- text. The assignment of links, rules, and weights is optional.
Security Classification