Embed Size (px)
Citation preview

CO2 cost pass-through and windfall profits in the power sector 49
© 2006 Earthscan Climate Policy 6 (2006) 49–72
* Corresponding author. Tel.: +31-224-56-8255E-mail address: [email protected]
CO2 cost pass-through and windfall profits in the power sector
Jos Sijm1*, Karsten Neuhoff2, Yihsu Chen3
1 Energy Research Centre of The Netherlands (ECN), PO Box 37154, 1030 AD Amsterdam, The Netherlands2 Faculty of Economics, University of Cambridge, Sidgwick Avenue, Cambridge CB3 9DE, UK3 Department of Geography and Environmental Engineering, Johns Hopkins University, 3400 North Charles Street,Baltimore, MD 21218m, USA
RESEARCH ARTICLE www.climatepolicy.com
Abstract
In order to cover their CO2 emissions, power companies receive most of the required EU ETS allowances for free.
In line with economic theory, these companies pass on the costs of these allowances in the price of electricity. Thisarticle analyses the implications of the EU ETS for the power sector, notably the impact of free allocation of CO
2
emission allowances on the price of electricity and the profitability of power generation. As well as some theoreticalreflections, the article presents empirical and model estimates of CO
2 cost pass-through for Germany and The
Netherlands, indicating that pass-through rates vary between 60 and 100% of CO2 costs, depending on the carbon
intensity of the marginal production unit and various other market- or technology-specific factors. As a result,power companies realize substantial windfall profits, as indicated by the empirical and model estimates presentedin the article.
Keywords: Emissions trading; Allocation; CO2 cost pass-through; Windfall profits; Power sector
1. Introduction
A major characteristic of the present EU Emissions Trading Scheme (ETS) is that almost all theCO
2 allowances are allocated for free to the installations covered by the scheme. During the first
phase of the EU ETS (2005–2007), more than 2.2 billion allowances of 1 tonne each are beingallocated per year (EC, 2005). During the first phase of the EU ETS (2005–2007), more than2.2 billion allowances of 1 tonne each are being allocated per year (EC, 2005), about 60% ofwhich is allocated to the power sector.
Against this background, this article analyses the implications of the EU ETS for the powersector, notably the impact of free allocation of CO
2 emission allowances on the price of electricity
and the profitability of power generation. In Section 2 we discuss the effect of different generationtechnologies being used to generate electricity. How does the internalization of CO
2 allowance
prices by individual generators into their bids feed through to the power price and how does thisin turn affect profitability? Sections 3–5 present empirical and model findings on passing through
CP_61_47_Sijm.pmd 7/7/2006, 10:27 AM49
50 Jos Sijm, Karsten Neuhoff and Yihsu Chen
Climate Policy 6 (2006) 49–72 © 2006 Earthscan
the costs of CO2 emission allowances to power prices in the countries of north-western Europe
and implications for the profitability of power production in these countries at the national andcompany level. The article concludes with a brief summary of the major f indings and policyimplications.
2. Theory
The EU ETS is a cap-and-trade system based primarily on the free allocation of a fixed amount ofemission allowances to a set of covered installations. Companies can either use these allowancesto cover the emissions resulting from the production of these installations or sell them to othercompanies that need additional allowances (Reinaud, 2005). Hence, for a company using an emissionallowance, this represents an opportunity cost, regardless of whether the allowances are allocatedfor free or purchased at an auction or market. Therefore, in principle and in line with economictheory, a company is expected to add the costs of CO
2 emission allowances to its other marginal
(variable) costs when making (short-term) production or trading decisions, even if the allowancesare granted for free (Burtraw et al., 2002, 2005; Reinaud, 2003).
Different generation technologies produce different levels of CO2 emissions, and therefore the
opportunity costs of CO2 emissions per unit of power produced differ as well. For example, a
combined-cycle gas turbine produces about 0.48 t of CO2 per MWh of electricity, while a typical
coal power station emits about 0.85 tCO2/MWh. A CO
2 price of d20/tCO
2, therefore, increases the
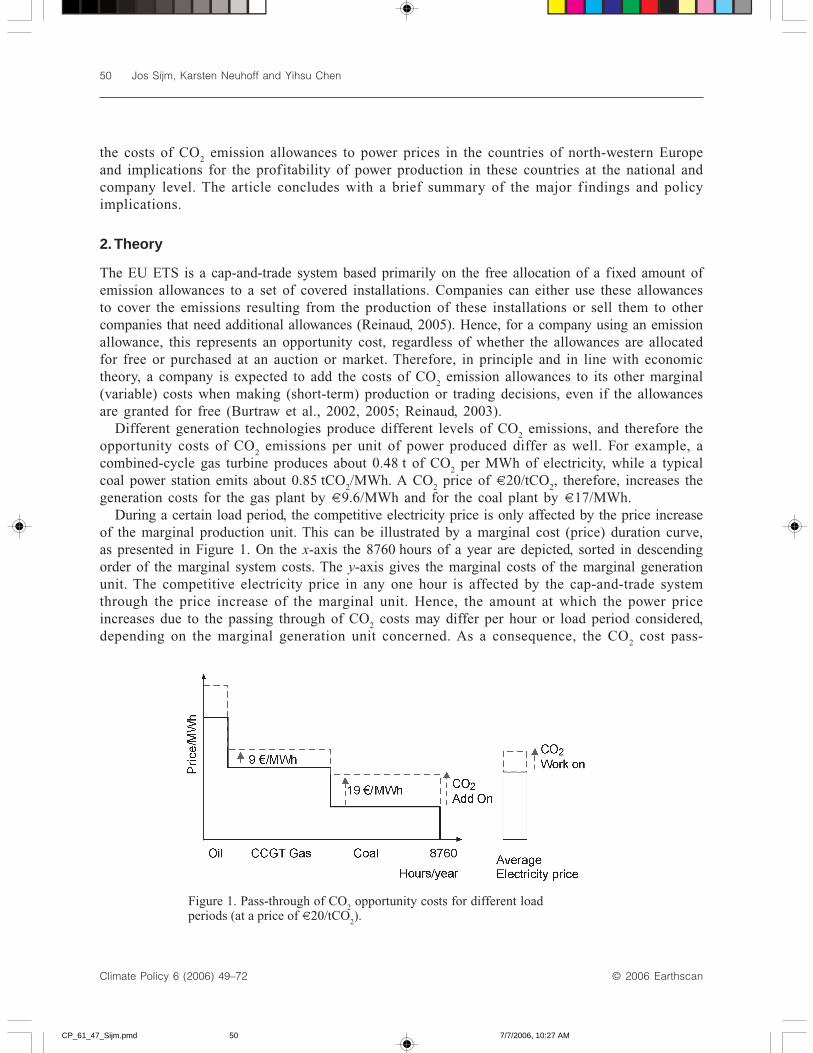
generation costs for the gas plant by d9.6/MWh and for the coal plant by d17/MWh.During a certain load period, the competitive electricity price is only affected by the price increase
of the marginal production unit. This can be illustrated by a marginal cost (price) duration curve,as presented in Figure 1. On the x-axis the 8760 hours of a year are depicted, sorted in descendingorder of the marginal system costs. The y-axis gives the marginal costs of the marginal generationunit. The competitive electricity price in any one hour is affected by the cap-and-trade systemthrough the price increase of the marginal unit. Hence, the amount at which the power priceincreases due to the passing through of CO
2 costs may differ per hour or load period considered,
depending on the marginal generation unit concerned. As a consequence, the CO2 cost pass-
Figure 1. Pass-through of CO2 opportunity costs for different load
periods (at a price of d20/tCO2).
CP_61_47_Sijm.pmd 7/7/2006, 10:27 AM50

CO2 cost pass-through and windfall profits in the power sector 51
© 2006 Earthscan Climate Policy 6 (2006) 49–72
through is defined as the average increase in power price over a certain period due to the increasein the CO
2 price of an emission allowance.
We represent the difference between the behaviour of individual generators and the impact onthe system price by defining the ‘add-on’ and the ‘work-on’ rate. In a competitive environment,generators ‘add-on’ the opportunity costs of CO
2 allowances to the power price. The increase of the
bid of the marginal unit will then determine how much of the CO2 allowance prices are ‘worked-on’
the electricity price. However, in a liberalized market, prices are ultimately determined by a complexset of market forces. As a result, the work-on rate may be lower than the add-on rate.
One reason why the work-on rate may be lower than the add-on rate is from a market demandresponse. If higher power prices reduce electricity demand, then an expensive power station mightnot need to operate and a cheaper generator will set the marginal price. The change in power priceis smaller than the change in marginal costs due to emissions trading. Hence, while the add-on ratewill remain at 100%, the work-on rate will be lower than 100%. Although price responsiveness istypically rather low for households and other small-scale consumers of electricity, the effect maybe more significant for major end-users such as the power-intensive industries. Power-intensiveindustry would substitute electricity purchases with the self-generation of electricity. This pathwayis less attractive, as the EU ETS also covers large-scale self-generation by industry and, therefore,faces similar cost increases, thus reducing the demand response of power-intensive industry.Nevertheless, through self-generation, power-intensive industry would benefit from the economicrent due to the transfer of valuable, freely allocated assets.
The extent to which carbon costs are passed through to power prices also depends on changesin the merit order of the supply curve due to emissions trading. This is illustrated in Figure 2,where the supply curve is characterized by a step function with two types of technologies – A andB. The vertical dash line indicates the fixed demand. In Figure 2a, when there is no change in themerit order, the change in the power price (∆p
2) will always be equal to the marginal CO
2 allowance
costs of the marginal generation technology B. The resulting pass-through rate will always beunity (in terms of both the add-on rate and the work-on rate). However, when there is a switch inthe merit order – as displayed in Figure 2b – the situation changes. In this case, the marginaltechnology is A with CO
2 allowances costs equal to ∆p
3 while the change in the power price is ∆p
4.
Therefore, while the add-on rate for the marginal production technology A is 100%, the work-on
Figure 2. Pass-through rates under changes in the merit order.
(a) (b)
CP_61_47_Sijm.pmd 7/7/2006, 10:27 AM51

52 Jos Sijm, Karsten Neuhoff and Yihsu Chen
Climate Policy 6 (2006) 49–72 © 2006 Earthscan
rate, ∆p4 / ∆p
3, will be less than 1 since ∆p
4 < ∆p
3.1 In markets with surplus capacity, competitive
pressures from excess generation capacity also impact on the merit order and, in turn, the work-onrate (Reinaud, 2003).
In addition, there may be several reasons why generators do not add on the full CO2 costs to
their power bid prices:2
• The expectation of power producers that their current emissions or output will be used as aninput factor for the determination of the allocation of allowances in future periods, mainly after2012 but possibly even 2008–2012. This creates an incentive to increase today’s output andthus encourages generators not to add on the full allowance price to their energy bids.
• Voluntary agreements or the regulatory threat of governments to intervene in the market ifgenerators make excessive windfall profits from the free allocation might induce generators tolimit the add-on.
• Other reasons, such as the incidence of non-optimal behaviour among power producers, marketimperfections, time lags or other constraints, including the incidence of risks, uncertainties,lack of information, and the immaturity or lack of transparency of the carbon market.
2.1. The impact on generators’ profits
An important question is how the pass-through of CO2 opportunity costs affects the profitability of
power stations. A main purpose of the free allocation of emissions allowances under the US cap-and-trade programmes for SO
2 and NO
x, as well as under the EU ETS for CO
2, is to obtain the
political support of large emitters. Thus, the free allocation aims to ensure that the introduction ofthe ETS does not reduce the profitability of the eligible companies.
The impact of emissions trading in general and free allocation of emission allowances in particularcan be illustrated by means of Figure 2, which illustrates the implications of emissions trading forgenerators’ profits where the supply curve consists of different types of technology. Where emissionstrading does not lead to a change in the merit order of the supply curve (and in total demand; seeFigure 2a), the change in the power price (∆p
2) is just about equal to the CO
2 costs per MWh of the
marginal production unit (B). For this unit, this implies that profits do not change where all theallowances have to be bought, while it results in windfall profits in the case of full grandfathering(equal to ∆p
2 times volume produced).
For the infra-marginal unit, however, the impact of emissions trading on operational profits doesnot only depend on the degree of grandfathering but also on whether it is more or less carbon-intensive than the marginal unit. If it is less carbon-intensive, it benefits from the fact that the ET-induced increase in power price is higher than the increase in its carbon costs per MWh. However, ifthe infra-marginal unit is more carbon-intensive than the marginal unit, it suffers from a loss, as theincrease in power price is lower than the increase in its carbon costs per MWh; notably if allowanceshave to be bought on the market. Therefore, in the latter case, some grandfathering to this infra-marginal unit may be justified to break even, depending on the relative carbon intensity of this unit.
On the other hand, if emissions trading leads to a change in the merit order (while totaldemand remains the same; see Figure 2b), the change in the power price (∆p
4) is lower than the
change in the CO2 costs per MWh of the marginal production unit (A). For this unit, emissions
trading results in a profit per MWh (equal to ∆p4) under free allocation, but in a loss (equal to
CP_61_47_Sijm.pmd 7/7/2006, 10:27 AM52

CO2 cost pass-through and windfall profits in the power sector 53
© 2006 Earthscan Climate Policy 6 (2006) 49–72
∆p3 – ∆p
4) if all the allowances have to be bought. Therefore, for this unit, some grandfathering
may be justified in order to break even.3 For the infra-marginal unit (B), the increase in power priceis higher than the increase in CO
2 costs, regardless of whether allowances have to be bought or
not. Therefore, even if this unit has to buy all its allowances, it will benefit from ET and, hence,there is no need for any grandfathering for this unit to break even.4
If the electricity demand response to ET-induced price increases is sufficiently large to stop theoperation of a set of power generators with higher variable costs, and thus the market clearingprice of electricity is reduced to the variable costs of a technology with lower variable costs, thiswill reduce the profits of all units operating during this period, as all of them will receive revenuescorresponding to the lower market clearing price.
3. Empirical estimates of passing through CO2 costs
This section presents some empirically estimated rates of passing through CO2 opportunity costs
of EU emissions trading to power prices in Germany and the Netherlands. We use two differentapproaches to estimate these rates. First, we look at the forward power market, particularly theyear-ahead market where, for instance, electricity delivered in 2006 is traded during every day ofthe year 2005. In this approach, we assess the extent to which changes in forward power prices canbe explained by changes in underlying forward prices for fuel and CO
2 allowances. Secondly, we
study the spot market, notably the German power exchange (EEX), by comparing hourly spotelectricity prices for the period from January 2005 to March 2006 with the corresponding hourlyelectricity prices in the year 2004. More specifically, we examine to what extent a change in thespot power price, for example at 9a.m. on the first Monday in January 2006 relative to the firstMonday in January 2004, can be explained by a change in the price of a CO
2 allowance on the
EUA market.First of all, however, some background information will be provided on trends in prices for fuel
and CO2 allowances and dark and spark spreads in the power sectors of Germany and The
Netherlands during the years 2004–2005.
3.1. Trends in forward prices and costs
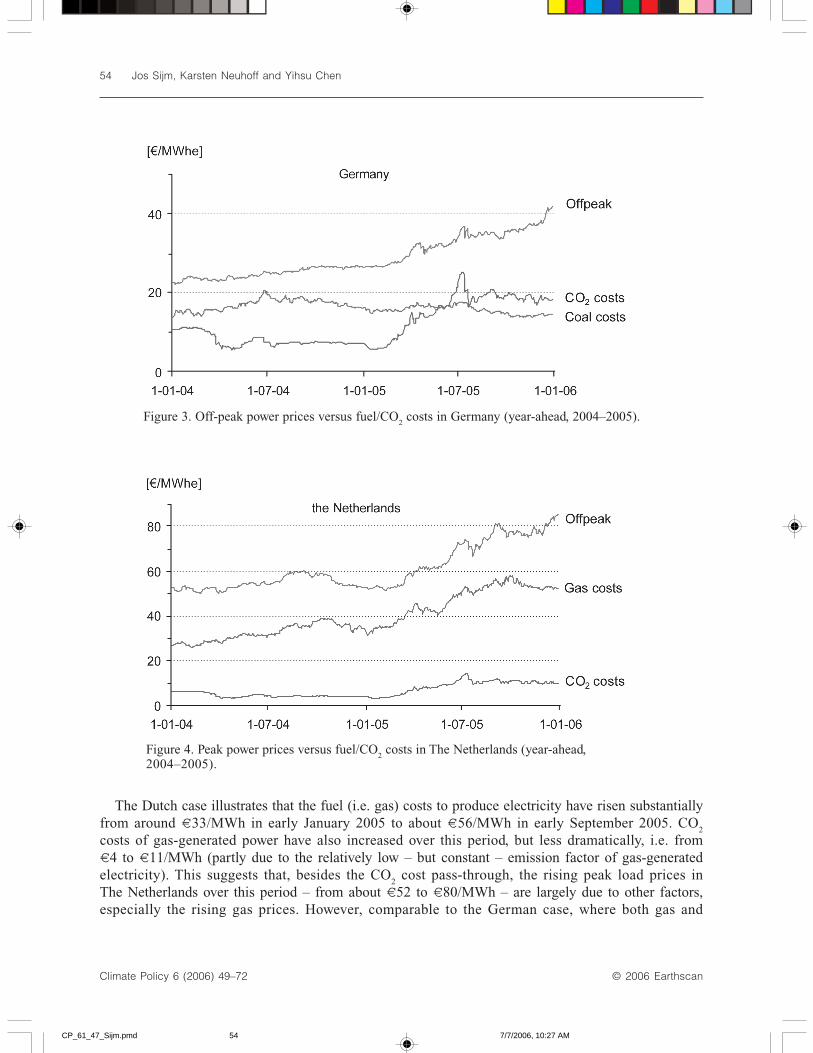
For the years 2004–2005, Figures 3 and 4 present power prices versus fuel and CO2 costs to generate
one MWh of power (assuming a fuel efficiency of 40% for coal and 42% for gas, a related emissionfactor of 0.85 and 0.48 tCO
2/MWh for coal and gas, respectively, and full ‘opportunity’ costs for
generating electricity by either coal or gas). While Figure 3 covers the case of coal-generated off-peak power in Germany, Figure 4 presents the case of gas-generated peak power in the Netherlands.5
The German case shows that the fuel (i.e. coal) costs to generate power have been more or lessstable at a level of about d16/MWh during the years 2004–2005. In addition, the CO
2 costs of
coal-generated power have been stable during the second part of 2004 but have approximatelytripled during the first part of 2005 from about d6/MWh in January to about d18/MWh in July.This suggests that the increasing off-peak prices in Germany over this period may have beencaused primarily by the rising CO
2 prices (and not by higher fuel prices). However, during the
second part of 2005 (August–December 2005), CO2 costs per coal-generated MWh have been
generally stable while off-peak prices have continued to rise. This indicates that factors other thanfuel and CO
2 costs influence power prices.
CP_61_47_Sijm.pmd 7/7/2006, 10:27 AM53
54 Jos Sijm, Karsten Neuhoff and Yihsu Chen
Climate Policy 6 (2006) 49–72 © 2006 Earthscan
The Dutch case illustrates that the fuel (i.e. gas) costs to produce electricity have risen substantiallyfrom around d33/MWh in early January 2005 to about d56/MWh in early September 2005. CO
2
costs of gas-generated power have also increased over this period, but less dramatically, i.e. fromd4 to d11/MWh (partly due to the relatively low – but constant – emission factor of gas-generatedelectricity). This suggests that, besides the CO
2 cost pass-through, the rising peak load prices in
The Netherlands over this period – from about d52 to d80/MWh – are largely due to other factors,especially the rising gas prices. However, comparable to the German case, where both gas and
Figure 3. Off-peak power prices versus fuel/CO2 costs in Germany (year-ahead, 2004–2005).
Figure 4. Peak power prices versus fuel/CO2 costs in The Netherlands (year-ahead,
2004–2005).
CP_61_47_Sijm.pmd 7/7/2006, 10:27 AM54

CO2 cost pass-through and windfall profits in the power sector 55
© 2006 Earthscan Climate Policy 6 (2006) 49–72
CO2 costs have been more or less stable during the last quarter of 2005 (or even declined slightly
as far as gas costs are concerned), peak power prices continued to increase to d84/MWh in lateDecember 2005.
3.2. Trends in dark and spark spreads on forward markets
Figures 5 and 6 present trends in dark/spark spreads and CO2 costs per MWh over the years 2004–2005
in Germany and The Netherlands, based on forward (i.e. year-ahead) prices for power, fuels andCO
2 emission allowances. For the present analysis, a dark spread is simply defined as the difference
between the power price and the cost of coal to generate 1 MWh of electricity, while a sparkspread refers to the difference between the power price and the cost of gas to produce 1 MWh ofelectricity. If the costs of CO
2 are included, these indicators are called ‘clean dark/spark spreads’
or ‘carbon compensated dark/spark spreads’.6
For Germany, Figure 5 depicts trends in dark spreads in both peak and off-peak hours, based onthe assumption that a coal generator is the price-setting unit during these periods.7 In addition, it
Figure 5. Trends in dark spreads and CO2 costs per coal-generated MWh in Germany during peak and
off-peak hours (year-ahead, 2004–2005).
Figure 6. Trends in spark/dark spreads and CO2 costs per gas/coal-generated MWh in The
Netherlands during peak and off-peak hours (year-ahead, 2004–2005).
CP_61_47_Sijm.pmd 7/7/2006, 10:27 AM55

56 Jos Sijm, Karsten Neuhoff and Yihsu Chen
Climate Policy 6 (2006) 49–72 © 2006 Earthscan
shows the costs of CO2 allowances required to cover the emissions per MWh generated by a coal-
fired power plant (with an emission factor of 0.85 tCO2/MWh). The figure suggests that up to July
2005, changes in the dark spread can be largely explained by changes in the CO2 costs per MWh.
Since August 2005, however, this relationship is less clear, as the CO2 costs have remained more or
less stable, while the dark spreads have continued to increase rapidly.For the Netherlands, Figure 6 depicts trends in the spark spread during the peak hours and the
dark spread during the off-peak hours, based on the assumption that a gas- versus coal-f iredinstallation is the price-setting unit during these periods, respectively. In addition, it presents thecosts of CO
2 allowances to cover the emissions per MWh produced by a gas- and coal-fired power
station, with an emission factor of 0.48 and 0.85 tCO2/MWh, respectively. Similar to the German
case, Figure 7 suggests that, during the period January–July 2005, changes in the dark/sparkspreads in The Netherlands can be largely attributed to changes in the CO
2 costs per MWh, but that
afterwards this relationship is less clear.
3.3. Statistical estimates of CO2 cost pass-through rates on forward markets
Below, we provide empirical estimates of pass-through rates of CO2 emissions trading costs to
forward power prices in Germany and The Netherlands for the period January–December 2005.The basic assumption when estimating CO
2 cost pass-through rates is that during the observation
period the dynamics of the power prices in Germany and The Netherlands can be fully explainedby the variations in the fuel and CO
2 costs over this period (see Figures 3 and 4). Hence, it is
assumed that during this period other costs, for instance operational or maintenance costs, areconstant and that the market structure did not alter over this period (i.e. changes in power pricescannot be attributed to changes in technology, market power or other supply–demand relationships).
Based on these assumptions, the relationship between power prices (P), fuel costs (F) and CO2
costs is expressed by Eqn (1), where superscripts c and g indicate coal and gas, respectively.Likewise, the term CO2
t is the CO
2 cost associated with coal and gas at time t. Thus, it is equal to
the product of the CO2 allowances price at time t and the time-invariant CO
2 emission rate of coal
or gas generators. In our analysis, fuel costs are assumed to be fully passed on to power prices.8
This is equivalent to fixing the coefficient β2 at unity.
P CO2 Ftc g
tc g
t1 1 2= + + +a b b e, , (1)
By defining Yt as the difference between power price and fuel cost, Eqn (2) becomes the central
regression equation of which the coefficient β1 has been estimated. In fact, Y
t represents the dark
spread for coal-generated power and the spark spread for gas-generated power.
Y P F CO2t t tc g
tc g
t= -( ) = + +, ,a b e1 (2)
Like most price series, power price data exhibit serial correlation. Hence, the error term et is
characterized by a so-called I(0) process (integrated of order zero).9
e ret t tu= +-1 , (3)
where ut is a purely random variable with an expected value of zero, i.e. E(u
t ) = 0, and a constant
variance over time, i.e. Var(ut) = σ2.
CP_61_47_Sijm.pmd 7/7/2006, 10:31 AM56

CO2 cost pass-through and windfall profits in the power sector 57
© 2006 Earthscan Climate Policy 6 (2006) 49–72
In 2005, electricity forward contracts were traded at the German power exchange EEX for only alimited number of days. For the remaining days, a settlement price was reported based on the chieftrader principle. This requires all chief traders to daily submit a spreadsheet with their evaluation ofprices for more than 40 different contract types. It is unlikely that all contract types would beupdated on a daily basis commensurate with CO
2 prices. Since the different protocols used by
various companies for reporting power prices are proprietary information, we do not possess suchinformation and are unable to consider it in the estimation procedure. Thus, to illustrate the effect,we assume in the Appendix that the reported prices are a weighted average over the prices duringthe previous days or weeks. Estimating Eqn (1) without considering this creates an error on the left-hand side of the equation that we are estimating. This error creates a bias in the estimation of β
1.
This bias exists if we estimate β1
using an ordinary least-square estimation, but can increasesignificantly if we estimate a non-cointegrated process based on Eqn (3), using other approachesthat iteratively determine both β
1 and p. The alternative approach we would usually apply in such
a situation is an estimation based on the first differences. But once again we show in the Appendixthat the error on the left-hand side of the equation can create a very strong bias in this estimation.
Hence, we conclude that the least affected alternative is a simple OLS estimator. We accept thatwe have an estimator that might slightly underestimate the CO
2 pass-through. We are somewhat
concerned about the fact that price series are typically autocorrelated. In fact, both power pricesand CO
2 costs series are I(1) processes. Thus, if CO
2 and electricity price series are not also
cointegrated, then the error terms follow an I(1) process and will fail to converge to zero. However,since both forward electricity prices and CO
2 prices are bounded, this turns out to be less of an
issue in our analyses. Finally, we know that the typical confidence intervals reported by ourestimation will no longer accurately represent the uncertainty in the estimation. Therefore, weapply bootstrapping to illustrate the accuracy of our estimation. In particular, we estimate β
1 using
the data from a restricted observation period; thus we can examine the robustness of the estimation.More specifically, we first construct a subset of data for bootstrapping (e.g. January–October). Werepeat this process by sliding the 2-month window (e.g. January–February merged with May–December), resulting in a total of six regressions with bootstrapped data.
Table 1 summarizes the estimated CO2 pass-through rates in Germany and The Netherlands and
also gives the maximum and minimum values of the OLS estimator associated with variousbootstrapping estimations. With a confidence of about 80%, we can say that these rates are withinthe interval of 60 and 117% in Germany, and between 64 and 81% in The Netherlands. In light ofthe aforementioned methodological difficulties, the results presented in Table 1 need to be interpretedwith caution. In particular, we offer some explanations of possible complexities and discuss thepotential direction of bias.
First, the very high pass-through rate for Germany might be partially explained by increasing gasprices during 2005. Given that gas generators (instead of coal generators) set the marginal price inGerman markets during some peak hours, this could contribute to power prices increasing in peakforward contracts. As coal generators benefit from this gas cost-induced increase in power prices,this leads to an overestimation of the pass-through rate of CO
2 costs for coal-generated power.
Finally, Sijm et al. (2005, 2006) present and discuss a wide variety of further estimations of CO2
pass-through rates. In general, the estimations based on the period January–July 2005 result inlower pass-through rates than estimations based on the period 2005 as a whole. For instance, thepass-through rate for The Netherlands peak hours is estimated at 38% for the period January–July2005, while it is estimated at 78% for 2005 as a whole. This difference in estimated pass-through
CP_61_47_Sijm.pmd 7/7/2006, 10:31 AM57

58 Jos Sijm, Karsten Neuhoff and Yihsu Chen
Climate Policy 6 (2006) 49–72 © 2006 Earthscan
Table 1. Empirical estimates of CO2 pass-through rates in Germany and The Netherlands for the
period January–December 2005, based on year-ahead prices for 2006 (%)Bootstrap (2 months)
Country Load period Fuel (efficiency) OLS Min Max
Germany Peak Coal (40%) 117 97 117
Off-peak Coal (40%) 60 60 71
Netherlands Peak Gas (42%) 78 64 81Off-peak Coal (40%) 80 69 80
rates between the period January–July and 2005 as a whole could possibly be caused by somedelays in the market internalizing the CO
2 price (i.e. market learning), rapidly rising gas prices
(notably during the first period of 2005), higher power prices due to increasing scarcity and/ormarket power (particularly during the latter part of 2005), or by various other factors affectingpower prices in liberalized wholesale markets.
3.4. Empirical estimate using the hourly spot markets in Germany
Another approach to assessing the impact of the CO2 allowance costs on the wholesale power
price is to compare the day-ahead electricity prices per hour on the German power exchange (EEXfor every day in 2005 with the corresponding prices in 2004). The implicit assumption is thatfactors other than CO
2 and fuel costs remained unchanged during these two years. According to
Eqn (4), the difference in the electricity price during a particular hour after the introduction of theETS and the corresponding hour in 2004 is explained by the difference in coal prices during thehours concerned, the impact of the CO
2 price on the EUA market, and by an error term:
p p p p pt t tcoal coal
tco
t2005 2004 2004 2004 5 20052
, , , , ,- = - + +b e (4)
We set 2,cotp to reflect the costs of CO
2 emissions at the daily allowance price for a coal-fired power
station with an emission rate of 0.9 tCO2/MWh. As coal is at the margin during most of the day,
this can then also be interpreted as the work-on rate for coal power stations.Figure 7 depicts β for different hours of the day. We have split the observation period into three
sections, mainly to examine whether the daily pattern is consistent over time. While this pattern didnot change during the day, the level of work-on rate increased for each subsequent period considered.
Figure 7 invites three observations. First, during off-peak periods the work-on rate seems to be lessthan 1. This could be partly explained by intertemporal constraints of power stations – they prefer tooperate during off-peak periods if this saves start-up costs. As CO
2 costs increase the start-up costs,
they also create additional incentives to lower prices during off-peak periods to keep the stationrunning (Muesgens and Neuhoff, 2006). Second, if coal generators set the price during peak periods,then these are usually vintage stations with higher heat rates and therefore higher emission costs.Finally, the increase in gas prices during the year 2005–2006 is likely to also explain some of theprice increase during peak periods. As open-cycle gas turbines might be called upon during somepeak periods, their increased costs with higher gas prices can further push up the power price.
Therefore we now focus on the hour 3–4 p.m., for which intertemporal effects and the gas-priceimpact from peaking units running at maximum a few hours a day is least prevalent, as indicated
CP_61_47_Sijm.pmd 7/7/2006, 10:32 AM58

CO2 cost pass-through and windfall profits in the power sector 59
© 2006 Earthscan Climate Policy 6 (2006) 49–72
by the lower value for this hour relative to other peak hours in Figure 7. Figure 8 depicts for eachday the price increase of electricity in the hour 3–4 p.m. relative to the pre-ETS year 2004. Thecurves are again corrected for coal prices and therefore de facto depict:
p p p pt t tcoal coal
2005 2004 2005 2004 5, , , ,- - -( ) (5)
As can be seen from Figure 8, during January the entire CO2 price was not passed through, but
subsequently a close link seems to exist between the increase in the CO2 cost and the increase in
the electricity price relative to 2004. In September the public debate in Germany revolved aboutwhether the inclusion of CO
2 opportunity costs into the electricity price is appropriate, and induced
generation companies to proceed with some caution. It seems that eventually the power firms’management took the position that any other behaviour than pass-through is inappropriate, andpublicly acknowledged such behaviour, thus allowing traders to return to the habit of fullyinternalizing the CO
2 opportunity costs.
By the end of the year 2005, the German electricity prices further increased. We did not analysethe reasons for this development. The price increase could be attributed to one of the followingthree factors: (i) scarcity of generation capacity, (ii) higher gas prices than in previous winters,thus higher prices when gas is at the margin, and (iii) the exercise of market power.
Looking at the overall picture suggests that market participants in Germany have fully passedthrough the opportunity costs of CO
2 allowances in the spot market.
Figure 7. Work-on rate of CO2 costs on the German spot power market for different time periods,
assuming coal generators are at the margin.
CP_61_47_Sijm.pmd 7/7/2006, 10:33 AM59

60 Jos Sijm, Karsten Neuhoff and Yihsu Chen
Climate Policy 6 (2006) 49–72 © 2006 Earthscan
4. Model estimates of CO2 cost pass-through
In addition to the empirical estimates, CO2 cost pass-through rates have been estimated for some
EU countries by means of the COMPETES model.10 COMPETES can simulate and analyse theimpact of the strategic behaviour of large producers on the wholesale market under differentmarket structure scenarios (varying from perfect competition to oligopolistic and monopolisticmarket conditions). The model has been used to analyse the implications of CO
2 emissions
trading for power prices, company profits and other issues related to the wholesale power marketin four countries of continental north-western Europe (Belgium, France, Germany and TheNetherlands).
The major findings of the COMPETES model with regard to CO2 cost pass-through are summarized
in Table 2. They are compared to model results from the Integrated Planning Model (IPM), which aredescribed in more detail by Neuhoff et al. (this issue). As results are very sensitive to the gas/coal shift,small differences in the assumptions about gas prices, available gas generation capacity and interconnectioncapacity can explain the differences between the results of both models for The Netherlands.
Figure 8. Coal-price-corrected price increase for electricity (3–4 p.m.) depicted as dots and their40-day moving average (dark line) and the evolution of the CO
2 price (grey line).
Table 2. Model estimates of electricity price increases (in d/MWh) due to CO2 costs at d20/t
Belgium France Germany Netherlands United Kingdom
COMPETES 2–14 1–5 13–19 9–11IPM 17 15 13–14
CP_61_47_Sijm.pmd 7/7/2006, 10:33 AM60

CO2 cost pass-through and windfall profits in the power sector 61
© 2006 Earthscan Climate Policy 6 (2006) 49–72
Under all scenarios considered, power prices turn out to increase signif icantly due to CO2
emissions trading. In case of a CO2 price of d20/tonne, these increases are generally highest in
Germany (d13–19/MWh) with an intermediate position for Belgium (d2–14/MWh) and TheNetherlands (d9–11/MWh). The model predicts very low price increases for France (d1–5/MWh),which reflects the predominant nuclear generation basis of this country.
Differences in absolute amounts of CO2 cost pass-through between the individual countries
considered can be mainly attributed to differences in fuel mix between these countries. For instance,during most of the load hours, power prices in Germany are set by a coal-fired generator (with ahigh CO
2 emission factor). On the other hand, in France they are often determined by a nuclear
plant (with zero CO2 emissions), while The Netherlands take an intermediate position – in terms of
average CO2 emissions and absolute cost pass-through – due to the fact that Dutch power prices
are set by a gas-fired installation during a major part of the load duration curve.In relative terms (i.e. as a percentage of the full opportunity costs of EU emissions trading),
COMPETES has generated a wide variety of pass-through rates for various scenarios and load periodsanalysed. While some of these rates are low (or even zero where the power price is set by a nuclearplant), most of them vary between 60 and 80%, depending on the country, market structure, demandelasticity, load period and CO
2 price considered.
In addition, Table 2 provides the results of simulation runs by the IPM, a detailed power sectormodel for the EU developed by ICF Consulting. At a price of d20/tCO
2, the average amount of
CO2 cost pass-through in the UK is estimated at d13–14/MWh, while for Germany and The
Netherlands this amount is estimated at d17 and d15/MWh, respectively.11
5. Estimates of windfall profits
As COMPETES includes detailed information at the operational level for all (major) power companiesin the countries covered by the model, it can also be used to estimate the impact of emissionstrading on firms’ profits at the aggregated level as well as at the level of major individual companies.Such quantitative results are helpful in order to understand the qualitative impact, but the numbersshould only be taken as an indication of the order of magnitude involved. We discuss this aspectin more detail at the end of the section.
Table 3 presents a summary of the changes in total companies’ profits due to emissions tradingunder two scenarios: perfect competition (PC) and oligopolistic competition, i.e. strategic behaviourby the major power producers (ST). These ET-induced profit changes can be divided into thefollowing two categories.
1. Changes in profits due to ET-induced changes in production costs and power prices. This categoryof profit changes is independent of the allocation method. In fact, the estimation of this categoryof profit changes is based on the assumption that all companies have to buy their allowancesand, hence, that CO
2 costs are ‘real’ costs.
2. Changes in profits due to the free allocation of emission allowances. This category of profitchanges is an addition or correction to the first category for the extent to which allowances aregrandfathered – rather than sold – to eligible companies.
We start with the analysis of the impact in a perfectly competitive environment. In the fourthcolumn of Table 3 it is assumed that all companies have to buy all their emissions allowances on
CP_61_47_Sijm.pmd 7/7/2006, 10:33 AM61
62 Jos Sijm, Karsten Neuhoff and Yihsu Chen
Climate Policy 6 (2006) 49–72 © 2006 Earthscan
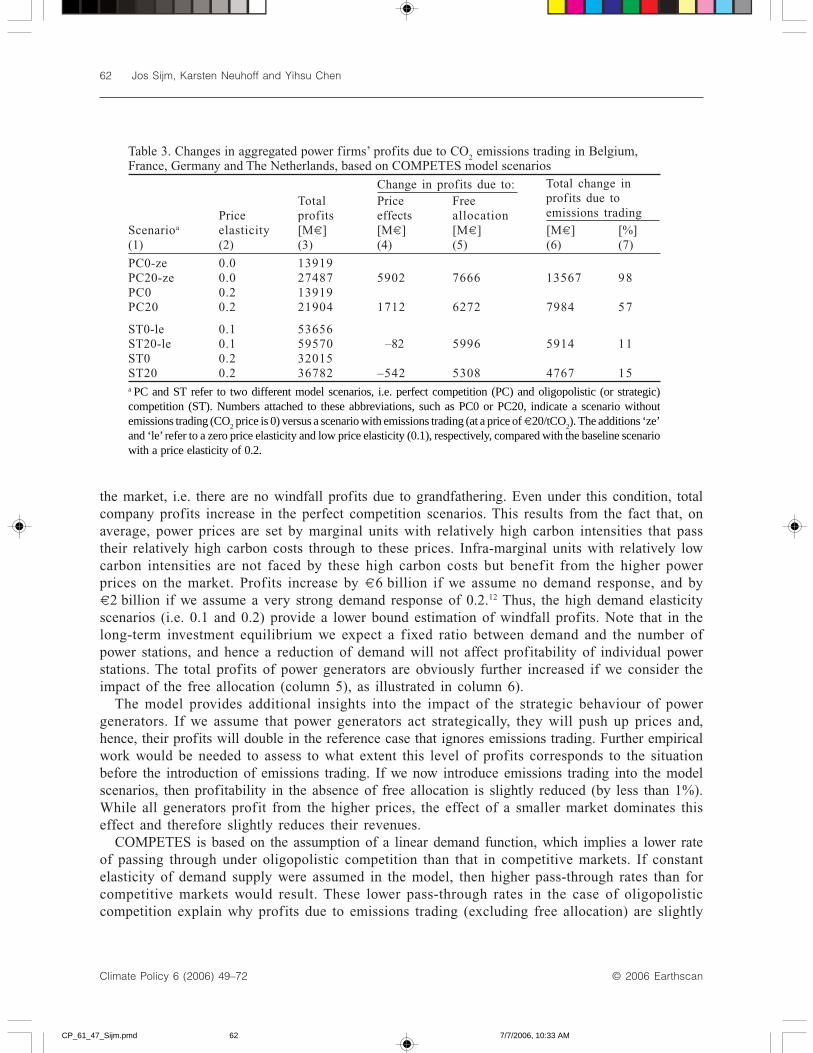
the market, i.e. there are no windfall profits due to grandfathering. Even under this condition, totalcompany profits increase in the perfect competition scenarios. This results from the fact that, onaverage, power prices are set by marginal units with relatively high carbon intensities that passtheir relatively high carbon costs through to these prices. Infra-marginal units with relatively lowcarbon intensities are not faced by these high carbon costs but benefit from the higher powerprices on the market. Profits increase by d6 billion if we assume no demand response, and byd2 billion if we assume a very strong demand response of 0.2.12 Thus, the high demand elasticityscenarios (i.e. 0.1 and 0.2) provide a lower bound estimation of windfall profits. Note that in thelong-term investment equilibrium we expect a fixed ratio between demand and the number ofpower stations, and hence a reduction of demand will not affect profitability of individual powerstations. The total profits of power generators are obviously further increased if we consider theimpact of the free allocation (column 5), as illustrated in column 6).
The model provides additional insights into the impact of the strategic behaviour of powergenerators. If we assume that power generators act strategically, they will push up prices and,hence, their profits will double in the reference case that ignores emissions trading. Further empiricalwork would be needed to assess to what extent this level of profits corresponds to the situationbefore the introduction of emissions trading. If we now introduce emissions trading into the modelscenarios, then profitability in the absence of free allocation is slightly reduced (by less than 1%).While all generators profit from the higher prices, the effect of a smaller market dominates thiseffect and therefore slightly reduces their revenues.
COMPETES is based on the assumption of a linear demand function, which implies a lower rateof passing through under oligopolistic competition than that in competitive markets. If constantelasticity of demand supply were assumed in the model, then higher pass-through rates than forcompetitive markets would result. These lower pass-through rates in the case of oligopolisticcompetition explain why profits due to emissions trading (excluding free allocation) are slightly
Table 3. Changes in aggregated power firms’ profits due to CO2 emissions trading in Belgium,
France, Germany and The Netherlands, based on COMPETES model scenariosChange in profits due to:
Total Price FreePrice profits effects allocation
Scenarioa elasticity [Md] [Md] [Md] [Md] [%](1) (2) (3) (4) (5) (6) (7)
PC0-ze 0.0 13919PC20-ze 0.0 27487 5902 7666 13567 98PC0 0.2 13919PC20 0.2 21904 1712 6272 7984 57
ST0-le 0.1 53656ST20-le 0.1 59570 –82 5996 5914 11ST0 0.2 32015ST20 0.2 36782 –542 5308 4767 15a PC and ST refer to two different model scenarios, i.e. perfect competition (PC) and oligopolistic (or strategic)competition (ST). Numbers attached to these abbreviations, such as PC0 or PC20, indicate a scenario withoutemissions trading (CO
2 price is 0) versus a scenario with emissions trading (at a price of d20/tCO
2). The additions ‘ze’
and ‘le’ refer to a zero price elasticity and low price elasticity (0.1), respectively, compared with the baseline scenariowith a price elasticity of 0.2.
Total change inprofits due toemissions trading
CP_61_47_Sijm.pmd 7/7/2006, 10:33 AM62

CO2 cost pass-through and windfall profits in the power sector 63
© 2006 Earthscan Climate Policy 6 (2006) 49–72
reduced in the ST scenarios. Note, however, that due to strategic behaviour, profits in the referenceST scenario are significantly higher than in the CP scenario. Free allocation (column 5) once againmakes all scenarios very profitable for power industry (column 6).
Under the present EU ETS, however, companies do not have to buy their emission allowanceson the market but receive them largely for free. This implies that they are able to realize windfallprofits due to grandfathering, as they still pass on the carbon costs of grandfathered emissionallowances. The fifth column of Table 3 shows estimates of these profits, based on estimates oftotal firms’ CO
2 emissions and the assumption that power companies receive, on average, 90% of
the allowances to cover their emissions for free. At a price of an emission allowance of d20/tCO2,
these windfall profits vary between d5.3 and 7.7 billion, depending on the scenario considered.As total production and total emissions are generally higher under the competitive scenarios (becausecompanies do not exercise their market power to withdraw output), total windfall profits due tograndfathering are also higher under these scenarios (compared to the oligopolistic scenariosbased on strategic behaviour).
There are major differences, however, in profit performance due to emissions trading at theindividual firm level, as can be seen from Table 4. This table presents changes in profits due toemissions trading under two scenarios – PC20-ze and ST20 – for the major power companiescovered by COMPETES, including the so-called ‘competitive fringe’ of these countries.13 Even ifthey have to buy their allowances, companies such as E.ON and EdF seem to benefit most fromemissions trading, especially from the increase in power prices due to the pass-through of carboncosts (i.e. type 1 windfall profits). This is not surprising, given the high share of nuclear productionin total generation by these companies.
On the other hand, some companies make a loss due to emissions trading when they have tobuy their emissions allowances. In both scenarios, these companies are, in particular, ESSENT,NUON, STEAG AG and Vattenfall Europe. The losses for ESSENT and NUON are mainly due tothe fact that these Dutch companies lose market shares in favour of foreign, less carbon-intensivecompanies, while they tend not to make profits from ET-induced price increases in the Dutchmarket, as marginal gas generators push up the price in line with cost increases of inframarginalunits. The losses for STEAG AG and Vattenfall Europe are predominantly due to their portfoliomix. For STEAG AG, this portfolio is purely based on coal, while a large component of Vattenfall’sportfolio is based on brown coal. Brown coal is more carbon-intensive than Germany’s electricity-price-setting coal. This unbalanced portfolio is reflected in profit losses in the absence of freeallowance allocation.
Once the additional profits due to grandfathering are accounted for, however, all companiesbenefit from emissions trading under both scenarios presented in Table 4. As coal- and othercarbon-intensive companies (such as RWE, STEAG AG and Vattenfall Europe) receive relativelylarge amounts of CO
2 emission allowances for free, they benefit relatively more from this effect of
emissions trading on firms’ profits.Although the above-mentioned quantitative estimates of changes in profits are helpful in order
to understand the qualitative impact of the EU ETS on the profitability of power generation at thefirm level, they have to be judged in light of the restrictions of the modelling approach:
First, it is a static model, which therefore does not capture the impact on investment decisionsor, alternatively, the restraint of the potential threat of entrants or regulatory intervention put onpower generators to keep prices down. In the long run, new investment is required, and thereforethe best estimate for long-term power prices is the cost of the entry of a new generator. This
CP_61_47_Sijm.pmd 7/7/2006, 10:33 AM63

64 Jos Sijm, Karsten Neuhoff and Yihsu Chen
Climate Policy 6 (2006) 49–72 © 2006 Earthscan
model therefore provides insights into profitability during the transition period when emissionstrading is implemented, but the structure of generation assets has not adjusted to reflect the newoptimal investment mix. Thus we see this analysis as a guide towards understanding the type of
Table 4. Changes in profits of individual power companies operating in Belgium, France, Germany and TheNetherlands, based on two COMPETES model scenarios (in Md)
Change in profits due to: Price Free Total change
Perfect competition (PC) effects allocation in profits
Comp Nationale du Rhone 127 154 28 0 28Comp Belgium 204 340 84 51 135Comp France 200 326 7 119 126Comp Germany 743 2119 147 1230 1376Comp Netherlands 128 172 –22 66 44A 2007 4575 1517 1051 2568B 1722 2883 625 536 1161C 4405 6807 2178 225 2402D 768 1890 748 373 1122E 319 535 –42 257 216F 204 261 –90 148 57G 1861 4565 802 1902 2704H 52 92 13 27 41I 217 438 –25 245 220J 962 2329 –69 1436 1367
Total 13919 27487 5902 7666 13567
Change in profits due to: Price Free Total change
Oligopolistic competition (ST) effects allocation in profits
Comp Nationale du Rhone 425 433 8 0 8Comp Belgium 250 269 –60 80 20Comp France 1576 1422 –472 317 –155Comp Germany 1972 2997 –319 1344 1025Comp Netherlands 392 469 –59 136 77A 3269 4226 757 199 956B 2775 3220 245 199 445C 12287 12709 323 98 422D 1646 2182 330 205 536E 775 923 –99 247 147F 650 620 –195 166 –29G 2896 3245 –119 468 349H 339 348 –51 60 9I 658 1001 –196 539 343J 2103 2718 –636 1251 615
Total 32015 36782 –542 5308 4767
PC and ST refer to two different model scenarios, i.e. perfect competition (PC) and oligopolistic (or strategic) competition(ST). Numbers attached to these abbreviations, such as PC0 or PC20, indicate a scenario without emissions trading (CO
2 price
is 0) versus a scenario with emissions trading (at a price of d20/tCO2). The additions ‘ze’ and ‘le’ refer to a zero price elasticity
and low price elasticity (0.1), respectively, compared with the baseline scenario with a price elasticity of 0.2.
Total profits PC0 PC20-ze
Total profits ST0 ST20
CP_61_47_Sijm.pmd 7/7/2006, 10:33 AM64

CO2 cost pass-through and windfall profits in the power sector 65
© 2006 Earthscan Climate Policy 6 (2006) 49–72
compensation that power generators can expect in the transition period before we shift towards anew equilibrium.
Second, modelling of strategic behaviour tends to capture qualitative effects, but thequantification typically requires stronger assumptions. For example, market design of transmissionor balancing markets can have a significant impact on opportunities to exercise market power bystrategic players.
Third, in the strategic model scenarios we assume a linear demand function. With linear demandfunctions, strategic f irms reduce the CO
2 cost pass-through relative to the competitive model
scenarios. Analytical research shows that this result is inverted if we instead assume a constantelasticity of demand function. In this case, strategic f irms increase the CO
2 pass-through rate
relative to a competitive scenario. However, we believe that the empirical demand curves would besomewhere between two extreme cases: constant elasticity and linear demand (i.e. zero elasticity).Furthermore, given the fact that all the economic rent from introducing EU ETS goes to producers(at the expense of consumers) under fixed demand scenarios, the profitability of f irms underconstant elasticity cases would be less than that under liner demand cases in general.
5.1. Estimates of windfall profits at national level
Recently, Frontier Economics (2006) has estimated windfall profits due to the EU ETS for the fourlargest power companies operating in The Netherlands (ESSENT, NUON, E.ON and Electrabel). Forthe year 2005, these profits are estimated at d19 million for the four companies as a whole. Thisestimate is rather low, as it is based on some stringent, specific assumptions and conditions for the year2005. On the one hand, it is assumed that 90% of the power produced during 2005 was already sold in2003 and 2004, when CO
2 prices and (assumed) pass-through rates were low, resulting in additional
revenues of power sales in 2005 of d69 million. On the other hand, it is assumed that the ‘allocationdeficit’ of the four companies (i.e. the difference between the allowances grandfathered and theallowances needed to cover their emissions) was met by market purchases in 2005 only, when CO
2
prices were high, resulting in a total cost of d50 million.14
Although the estimate by Frontier Economics of the windfall profits in The Netherlands (andthe underlying assumptions and conditions) can, to some extent, be justified for the year 2005, itdoes not provide an adequate, ‘representative’ estimate of the windfall profits due to the EU ETSin the years thereafter. A more representative estimate of these windfall profits can be based onone of the following three approaches.
Firstly, based on the COMPETES methodology outlined above, changes in profits due to CO2 emissions
trading have been estimated for the operations of the four largest power companies in the Netherlandsin an ‘average’ year. Table 5 shows that, at a price of d20/tCO
2, these changes vary between d250 and
600 million for the four companies as a whole, depending on the scenario considered. As explained,these changes are the result of two different effects of emissions trading, called the price andgrandfathering effects. As can be observed from Table 5, the price effect – based on the assumptionthat power companies have to buy all their emission allowances – leads to losses in three out of fourscenarios. This is due to the fact that (i) power demand is assumed to respond significantly to higherprices (i.e. we assume demand elasticities of 0.1 and 0.2 in the scenarios with losses due to the priceeffect), (ii) the share of non-carbon power generation in The Netherlands is relatively low (and,hence, the benefits of ET-induced price increases for non-carbon generators are low), and (iii) theshare of gas-fired power-generation – setting the power price – is relatively high in The Netherlands
CP_61_47_Sijm.pmd 7/7/2006, 10:33 AM65

66 Jos Sijm, Karsten Neuhoff and Yihsu Chen
Climate Policy 6 (2006) 49–72 © 2006 Earthscan
(and, hence, high-carbon generators such as coal-fired installations are faced by high carbon coststhat are not matched by equally higher power prices).
On the other hand, when assuming that the power companies in The Netherlands receive 90% oftheir needed emission allowances for free, the grandfathering effect far outweights the price effect,resulting in major total windfall profits due to emissions trading based largely on free allocation.
Secondly, following the methodology used by Frontier Economics for an average, ‘representative’year, it may – for instance – be assumed that (i) total CO
2 emissions of the four major power
companies in The Netherlands is about 37.5 MtCO2 per year, while the amount of allowances
grandfathered to these companies is 35 MtCO2 per annum (hence, the allocation deficit is 2.5 MtCO
2
per year; i.e. about 7% of total emissions), (ii) the price of a CO2 allowance bought is, on average,
equal to the price of a CO2 allowance passed through to power prices, and amounts to d20/tCO
2,
and (iii) the average pass-through rate is 50%. In that case, the total windfall profits of the fourmajor power companies in The Netherlands amounts to d325 million.
Finally, the third approach to estimating windfall profits is based on ET-induced price increasesof domestically produced power sales in The Netherlands. These sales amount to around 100 TWhper year. Assuming that (i) 75% of this volume is sold during peak hours and the remaining partduring the off-peak period, (ii) during peak hours, power prices are set by a gas-fired installationwith an emission factor of 0.4 tCO
2/MWh and during the off-peak period by a coal-fired plant
with an emission factor of 0.8 tCO2/MWh, (iii) the CO
2 price is, on average, d20/t, (iv) the average
pass-through rate is 40% during the peak and 50% during the off-peak, and (v) the allocationdeficit for the power sector as a whole is equivalent to 4 million tCO
2 per year. In that case, the
total windfall profits amount to d360 million per year.15
To conclude, at a price of d20/tCO2, estimates of windfall profits due to the EU ETS in the power
sector of The Netherlands for an average, ‘representative’ year vary between d300 and 600 million.This compares to about half the value of the emission allowances grandfathered to the power sector orsome d3–5/MWh produced in The Netherlands.16 It should be emphasized, however, that these estimatesignore the impact of ETS-induced profit changes on new investments in generation capacity and,hence, on production costs, power prices and company profits in the long run towards a new equilibrium.
Table 5. Changes in aggregated profits due to CO2 emissions trading for the four largest power firms
in The Netherlands (E.ON, Electrabel, ESSENT and NUON), based on COMPETES model scenariosChange in profits due to: Total change in
Total Price Free profits due toPrice profits effects allocation emissions trading
Scenarioa elasticity [Md] [Md] [Md] [Md] [%]
PC0 995PC20 0.2 1394 –78 477 399 40PC20-ze 0.0 1580 109 477 585 59
ST0 2151ST20 0.2 2408 –179 436 257 12ST20-le 0.1 3359ST20-le 0.1 3610 –185 436 251 7a PC and ST refer to two different model scenarios, i.e. perfect competition (PC) and oligopolistic (or strategic)competition (ST). Numbers attached to these abbreviations, such as PC0 or PC20, indicate a scenario withoutemissions trading (CO
2 price is 0) versus a scenario with emissions trading (at a price of d20/tCO
2). The additions
‘ze’ and ‘ le’ refer to a zero price elasticity and low price elasticity (0.1), respectively, compared to the baselinescenario with a price elasticity of 0.2.
CP_61_47_Sijm.pmd 7/7/2006, 10:33 AM66
CO2 cost pass-through and windfall profits in the power sector 67
© 2006 Earthscan Climate Policy 6 (2006) 49–72
UK power sector profits from the EU ETS were estimated at £800m/yr in a report to the DTI(IPA Energy Consulting, 2005). Such profits occur even though power sector emissions (157MtCO
2) exceeded free allocation (134 MtCO
2), making the UK power sector by far the largest
buyer on the EU ETS market. In the IPA model, the UK power sector in aggregate would breakeven if free allocation were cut back to 45 MtCO
2/yr. At this point the earnings from higher power
prices, after accounting for impact on demand, would fund the purchase of emission allowancesfrom auctions, other sectors or internationally. The profit impact is sensitive to the CO
2 price
(assumed to be d15/t) and can increase if with lower gas prices the electricity price is set by moreCO
2 intensive coal plants. Prof its are also highly unequally distributed between individual
companies, as the previous section illustrated for The Netherlands. In the first year of the ETS,utilities might not have realised all the modelled profits, as some production was covered bylonger-term contracts and because changes in wholesale prices take time to feed through to retailprice changes.
6. Summary of major findings and policy implications
In theory, power producers pass on the opportunity costs of freely allocated emission allowances to theprice of electricity. For a variety of reasons, however, the increase in power prices on the market may beless than the increase in CO
2 costs per MWh generated by the marginal production unit. This is confirmed
by empirical and model findings, showing estimates of CO2 cost pass-through rates varying between
60 and 100% for wholesale power markets in Germany and The Netherlands. Using numerical modelswe find that, at a CO
2 price of d20/t, ET-induced increases in power prices range between d3 and 18/
MWh, depending on the carbon intensity of the price-setting installation. As most of the emissionallowances needed are allocated for free, the profitability of power generation increases accordingly.Model and empirical estimates of additional profits due to the EU ETS show that these ‘windfallprofits’ may be very significant, depending on the price of CO
2 and the assumptions made. For instance,
at a CO2 price of d20/t, ETS-induced windfall profits in the power sector of The Netherlands are
estimated at d300–600 million per year, i.e. about d3–5 per MWh produced and sold in The Netherlands.
Acknowledgements
We thank Prof. Benjamin F. Hobbs of the Johns Hopkins University (Baltimore, USA) as well asthose ECN staff members who contributed to the ‘CO
2 Price Dynamics’ project, notably Stefan
Bakker, Michael ten Donkelaar, Henk Harmsen, Sebastiaan Hers, Wietze Lise and Martin Scheepers(for details, see Sijm et al., 2005, 2006). We also thank Alessio Sancetta for guidance on theeconometric analysis, Jim Cust for research assistance, and the UK research council project TSECand Climate Strategies for financial support.
Notes
1 Model analyses show that when CO2 costs exceeds d20/t, emissions trading would induce substantial changes in the
production merit order (Sijm et al., 2005).2 For a full discussion and illustration of these reasons, see Chapter 4 of Sijm et al. (2005).3 It should be observed, however, that the change in the merit order might occur only during a certain load period. This has to
be accounted for when analysing the impact of emissions trading on firms’ profits and the implications for assessing theextent of grandfathering to break even.
CP_61_47_Sijm.pmd 7/7/2006, 10:33 AM67
68 Jos Sijm, Karsten Neuhoff and Yihsu Chen
Climate Policy 6 (2006) 49–72 © 2006 Earthscan
4 Similar findings can be derived by means of Figure 1, showing different types of technology along the load duration curve.By comparing the revenues (price/MWh × hours loaded) and the corresponding real/opportunity costs with and withoutemissions trading, changes in profits can be derived for different types of technology, including a change in the merit orderof these technologies.
5 In this section, unless otherwise stated, coal refers to the internationally traded commodity classified as coal ARA CIF AP#2,while gas refers to the high caloric gas (with a conversion factor 35, 17 GJ/m3) from the Dutch Gas Union Trade & Supply(GUTS). Moreover, prices for power, fuels and CO
2 refer to forward markets (i.e. year-ahead prices).
6 These spreads are indicators for the coverage of other (non-fuel/CO2) costs of generating electricity, including profits. For the
present analysis, however, these other costs – for instance capital costs, maintenance or operating costs – are ignored as, foreach specific case, they are assumed to be constant for the (short-term) period considered – although they may vary per caseconsidered – and, hence, they do not affect the estimated pass-through rates.
7 It is acknowledged, however, that during certain periods of the peak hours – the ‘super peak’ – a gas generator is the marginal(price-setting) unit but, due to lack of data, it is not possible to analyse the super-peak period in Germany separately.
8 In Sijm et al. (2006), this assumption was dropped, but it turned out that the estimated pass-through rates for fuel and CO2
costs were unreliable due to the observation that fuel and CO2 costs are highly correlated.
9 An I(0) (integrated of order zero) is an autoregressive process with one period of lag, i.e. AR(1) and with a propensity factor|ρ|<1 (see Eqn (3)) (Stewart and Wallis, 1981). This indicates a process of correlation frequently experienced in everyday life.For instance, if the ambient temperature was high yesterday and there are no major changes in the weather conditions, thetemperature today should be more or less similar. In this case, the temperature today provides a prior belief from whichtomorrow’s temperature can be inferred. Statistically, when assuming that e
t is characterized by an I(0) process (i.e. |ρ|<1) in
Eqn (3), the series is at least weakly independent. Therefore, both PW and OLS will be adequate to estimate pass-through ratesgiven the correct specification. However, we are aware of the possibility of a non-cointegration process since three series –power prices, fuel costs and CO
2 costs – follow an I(1) process based on the Dickey–Fuller test. Thus, in this article, we intend
to provide a preliminary assessment of the empirical CO2 pass-through rates.
10 COMPETES stands for Comprehensive Market Power in Electricity Transmission and Energy Simulator. This model hasbeen developed by ECN in cooperation with Benjamin F. Hobbs, Professor in the Whiting School of Engineering of TheJohns Hopkins University (Department of Geography and Environmental Engineering, Baltimore, MD, USA). For moredetails on this model, see Sijm et al. (2005) and references cited therein, as well as the website http://www.electricitymarkets.info.
11 The high estimate for The Netherlands (compared to a similar estimate by the COMPETES model) might be caused by theolder nature of the IPM model, with coal having a stronger influence on power prices.
12 This implies an increase in the wholesale price level from d20 to d30/MWh, and hence of the retail price level (includingtransmission, distribution and marketing costs) from let’s say d70 to d90/MWh, would result in a reduction of demand by 10%.
13 The competitive fringe of a country – denoted as Comp Belgium, Comp France, etc. – refers to the collections of (smaller)producers in a country that lack the ability to influence power prices due to their small market share and, therefore, they weremodelled behaving competitively (i.e. as price takers).
14 However, in May 2006, when the verified emissions of the four companies were published, it turned out that these companiesdid not have an allocation deficit but rather a small surplus. This implies that the estimate of the windfall profits by FrontierEconomics was indeed quite conservative, as actually it is at least d50 million higher.
15 This figure includes not only the windfall profits of the four largest power companies in The Netherlands but also of all otherDutch power producers benefiting from ET-induced increases in the price of electricity.
16 Note that in The Netherlands the share of non-carbon fuels in total power production is low and that power prices areusually set by carbon-fuelled installations, notably gas-fired plants. In countries where the share of non-carbon fuels ismuch higher or where power prices are set by either high carbon-fuelled (i.e. coal) installations or by a non-carbon fuelledgenerator, the windfall profit per MWh or allowance grandfathered may be substantially different than in The Netherlands.
References
Burtraw, D., Palmer, K., Bharvirkar, R., Paul, A., 2002. The effect on asset values of the allocation of carbon dioxide emissionallowances. Electricity Journal 15(5), 51–62.
Burtraw, D., Palmer, K., Kahn, D., 2005. Allocation of CO2 Emissions Allowances in the Regional Greenhouse Gas Cap-and-
Trade Program. RFF Discussion Papers 05–25.EC, 2005. Further Guidance on Allocation Plans for the 2008 to 2012 Trading Period of the EU Emission Trading Scheme.
European Commission, Brussels.
CP_61_47_Sijm.pmd 7/7/2006, 10:33 AM68

CO2 cost pass-through and windfall profits in the power sector 69
© 2006 Earthscan Climate Policy 6 (2006) 49–72
Frontier Economics, 2006. CO2 Trading and its Influence on Electricity Markets. Final report to DTe, Frontier Economics Ltd, London.
IPA Energy Consulting, 2005, Implications of the EU Emissions Trading Scheme for the UK Power Generation Sector, reportto UK Department of Trade and Industry.
Muesgens F., Neuhoff, K., 2006. Modelling Dynamic Constraints in Electricity Markets and the Costs of Uncertain WindOutput. EPRG WP 05/14.
Neuhoff K., Keats Martinez, K., Sato, M., 2006. Allocation, incentives and distortions: the impact of EU ETS emissionsallowance allocations to the electricity sector. Climate Policy 6(1), 73–91.
Reinaud, J., 2003. Emissions Trading and its Possible Impacts on Investment Decisions in the Power Sector. IEA Information Paper, Paris.Reinaud, J., 2005. Industrial Competitiveness under the European Union Emissions Trading Scheme. IEA Information Paper, Paris.Sijm, J., Bakker, S., Chen, Y., Harmsen, H., Lise, W., 2005. CO
2 Price Dynamics: The Implications of EU Emissions Trading for
the Price of Electricity. ECN-C–05-081, Energy Research Centre of the Netherlands, Petten, The Netherlands.Sijm, J., Chen, Y., ten Donkelaar, M., Hers, S., Scheepers, M., 2006. CO
2 Price Dynamics: A Follow-up Analysis of the
Implications of EU Emissions Trading for the Price of Electricity, ECN-C–06-015, Energy Research Centre of the Netherlands,Petten, The Netherlands.
Stewart, M., Wallis, K., 1981. Introductory Econometrics, 2nd edition. Basil Blackwell, Oxford.
Appendix 1
Biased estimation of pass-through rate if frequency of estimation is higher than frequency ofobservation of forward electricity prices
While EEX offers daily clearing prices for the forward prices, these are typically not based on tradesbut on averages of the survey results among various traders. Given that chief traders are expected tosubmit daily an updated price prediction on 40 contract types, it is unlikely that they will update thisprediction daily, and hence the daily prices overstate the information content of the data.
This note attempts to understand why a delay in observing the forward electricity price pt results
in a bias in the estimation b of the pass-through rate r. Let us assume that electricity prices areformed according to:
p rc e et t t t= + with independent and identical distributed (A1)
but we can only observe qt with
qp p
tt t=+ -1
2(A2)
This reflects that trading volume is limited, with trades only on a few days. In the absence oftrades, the power exchange asks traders to report their best guess of trades and uses the averagereported prices. However, traders only infrequently update their reports; hence the reported priceis an average of the real price over various periods. How does this effect the estimation b of thepass though rate? We estimate that
q bct t t= +h (A3)
1. OLS estimation
First, assume we use OLS, and therefore chose b to minimize ∑t t2η
ˆ ( )bc q
cqt t
tt= Â
 2using def of
CP_61_47_Sijm.pmd 7/7/2006, 10:39 AM69

70 Jos Sijm, Karsten Neuhoff and Yihsu Chen
Climate Policy 6 (2006) 49–72 © 2006 Earthscan
=
+ -ÂÂ
cp p
cp
tt t
tt
1
22 (using def of )
=+( )
+-ÂÂ
rc c c
cct t t
t
1
2
2/error term (assume independence of aand )e
= --( )
=< <> >
ÏÌÓ
¸˝˛
+-ÂÂ
rr c c c
c
r if c c
r if c ct t t
t
T
T21
2
0
0
error
2. AR(1) estimation
Second, assume we estimate using an AR(1) process with ht = ph
t–1 + g
t with g
t independent and
identical distributed.We minimize
g h ht tp21
2= -( )-ÂÂ
= - - -( )( )- -Â q bc q bct t t tr 1 1
2
= [ ] - -( ) -( ) + -( )- - -ÂÂ.. ...without b b c c q q b c ct t t t t t2 1 12
1
2r r r
Using the first-order condition
b̂c c q q
c cqt t t t
t t
t=-( ) -( )
-( )( )- -
-
ÂÂ
r r
r1 1
1
2using def of
=-( ) - + -
-( )-
- - -
-
ÂÂ
c cp p p p
c cp
t tt t t t
t t
r r r
r
11 1 2
1
22 using def of tt( ).
(assume independence of c and e)
=-( ) - + -
-( )+
-- - -
-
ÂÂ
rc c
c c c c
c c
t tt t t t
t t
r r r
r
11 1 2
1
22 error term
= +-( ) -( )
-( )+- - -
-
ÂÂ
r r c c c c
c c
t t t t
t t2 2
1 1 2
1
2
r r
rerror
CP_61_47_Sijm.pmd 7/7/2006, 10:50 AM70

CO2 cost pass-through and windfall profits in the power sector 71
© 2006 Earthscan Climate Policy 6 (2006) 49–72
3. Quantification of bias
We use the CO2 prices from January–December 2005 as input for c
t and calculate the bias in the
estimated pass-through rate at the example of a time lag of 20 days. This reflects the delays inupdating under the chief trade principle applied to determine the contract settlement prices. TheOLS creates a bias of 2%. Figure A1 presents the bias that results if the AR(1) process is assumed,depicted for different values of ρ .
An AR(1) process is usually estimated in an iterative two-stage procedure. In this case thebiased estimator for b will result in a wrong estimation of the error term, thus influencing theestimation of ρ , which in turn feeds back to the next estimation of b. Hence the effect might befurther distorted. This analysis suggests that the OLS estimator will provide a less biased estimationof the pass-through rate b than AR estimation. This is caused because rather than p, the underlyingforward price, only a time averaged q is available for the estimation.
4. Cointegration
We note that both approaches fail to address an aspect that is typically present in commodity pricedata: they are autocorrelated. If forward prices and CO
2 prices are not cointegrated, then error
terms under both estimations might not converge. The typical response is to run an estimationusing the first differences. This is typically a successful approach in the case of non-cointegratedAR(1) processes (but does not have the quick convergence properties that otherwise characterizeestimations using levels).
However, once again the price formation process precludes such attempt for the daily forwardprices. Let us define dc
t = c
t - c
t-1 and likewise for dq
t and dp
t. As above, we would estimate:
Figure A1. Bias in estimated pass-through rate.
CP_61_47_Sijm.pmd 7/7/2006, 10:50 AM71

72 Jos Sijm, Karsten Neuhoff and Yihsu Chen
Climate Policy 6 (2006) 49–72 © 2006 Earthscan
b̂dc dq
dcqt t
t
t= ( )ÂÂ 2
using def of
=
+
( )-Â
Âdc
dp dp
dcp
tt t
t
t
1
22 using def of
=
+( )+-Â
Âr
dc dc dc
dct t t
t
1
2
2/error term
(assume independence of c and e)
= -( )-Â
Âr r dc dc
dc
rt t
t2 2 21
2~
This suggests that, given the price formation, a first difference estimation using daily price datawill bias the estimation of b significantly downward. One possible alternative approach would beto use monthly average prices, but then the number of observation points is reduced.
CP_61_47_Sijm.pmd 7/7/2006, 10:55 AM72