Embed Size (px)
Citation preview

The Official Publication of the Consortium of Multiple Sclerosis Centers
June 2021 Volume 23, Supplement 1Special Supplement
CMSC Consensus Statement on Neurofilament Biomarkers in Multiple Sclerosis
2 Consensus Statement on Neurofilament Proteins in MS
8 Assays to Measure Neurofilament Light Chain (NfL) in Cerebrospinal Fluid and Blood
11 Potential of NfL as a Biomarker in MS: Cerebrospinal Fluid Versus Serum
15 Considerations for Timing of NfL Measurement in MS
19 Confounders Affecting Interpretation of NfL Biomarkers in MS
24 Significance of Dynamic Change in NfL Levels in MS
28 Role of NfL in MS Clinical Trials and Clinical Practice
Jointly provided by the Consortium of Multiple Sclerosis Centers and Delaware Media GroupThis continuing education supplement is supported by educational grants from
Biogen and Sanofi Genzyme
ijmsc.org

International Journal of MS Careii
Release date: June 15, 2021Valid through: June 15, 2022Estimated Time to Complete Activity: 3 hours
Target AudienceThis activity has been designed to meet the educational needs of physicians, nursing professionals, PAs, and other members of the healthcare team involved in the management of patients with mul-tiple sclerosis (MS).
Learning ObjectivesUpon completing this activity, participants should be better able to:• Review techniques used to measure neurofilament biomarkers in
serum and cerebrospinal fluid of patients with MS• Define neurofilament light chain (NfL) values and timing of NfL
measurements and their clinical relevance in MS• Discuss the influence of comorbid medical conditions on NfL
outcomes• Outline available strategies for applying NfL as a biomarker to aid
in the clinical management of MS
Accreditation and Credit DesignationIn support of improving patient care, this activity has been planned and implemented by the Consortium of Multiple Sclerosis Centers (CMSC) and Delaware Media Group. CMSC is jointly accred-ited by the Accreditation Council for Continuing Medical Education (ACCME), the Accreditation Council for Pharmacy Education (ACPE), and the American Nurses Credentialing Center (ANCC) to provide continuing education for the healthcare team.PhysiciansThe Consortium of Multiple Sclerosis Centers designates this enduring material for a maximum of 3.0 AMA PRA Category 1 Credit(s)TM. Physicians should claim only the credit commensurate with the extent of their participation in the activity.NursesThe Consortium of Multiple Sclerosis Centers designates this endur-ing material for 3.0 contact hours of continuing education.Certificate of Attendance for Other Healthcare ProfessionalsA Certificate of Attendance will be given upon completion of course requirements, enabling participants to register their credit with the appropriate licensing boards or associations. Participants may apply for other accreditations, using procedures established by specific organizations.
Disclosure of Financial RelationshipsIn accordance with the Accreditation Council for Continuing Medical Education’s (ACCME) Standards for Integrity and Independence in Continuing Education, CMSC and Delaware Media Group require that individuals in a position to con-
trol the content of an educational activity disclose all financial rela-tionships with ineligible companies. CMSC and Delaware Media Group mitigate all conflicts of interest to ensure independence, objectivity, balance, and scientific rigor in all their educational pro-grams. Furthermore, CMSC and Delaware Media Group seek to ver-ify that all scientific research referred to, reported, or used in a CE activity conforms to the generally accepted standards of experimen-tal design, data collection, and analysis. CMSC and Delaware Media Group are committed to providing learners with high-quality CE activities that promote improvements in health care and not a com-mercial interest.
Consortium of Multiple Sclerosis Centers • 3 University Plaza Drive, Suite 116 • Hackensack, NJ 07601
Faculty
Program Chairs
Mark S.Freedman, MD, MSc, FRCPC University of OttawaOttawa, Ontario, Canada
Sharmilee Gnanapavan, MD, PhD Barts Health NHS TrustLondon, England, UK
Writing Committee
Ronald Booth, PhD, DCC, FCACB University Of OttawaOttawa, Ontario, Canada
Peter Calabresi, MD Johns Hopkins UniversityBaltimore, Maryland, USA
Michael Khalil, MD, PhD Medical University of GrazGraz, Austria
Jens Kuhle, MD, PhD University Hospital BaselBasel, Switzerland
David Leppert, MD University Hospital BaselBasel, Switzerland
Jan Lycke, MD, PhD University of GothenburgGothenburg, Sweden
Tomas Olsson, MD, PhD Karolinska InstituteSolna, Sweden
Katherine Wandersee Medical Writer, CMSCMontclair, NJ
Advisory Panel
Bibiana Bielekova, MD National Institutes of HealthBethesda, Maryland, USA
Tanuja Chitnis, MD Harvard Medical SchoolBoston, Massachusetts, USA
Manuel Comabella, MD, PhD Vall d’Hebron University HospitalBarcelona, Spain
Robert Fox, MD Cleveland ClinicCleveland, Ohio, USA
Roberto Furlan, MD, PhD San Raffaele Scientific InstituteMilan, Italy
Gavin Giovannoni, MD, PhD Barts and The London School of MedicineLondon, England, UK
Joep Killestein, MD, PhD Amsterdam University Medical CenterAmsterdam, The Netherlands
Sarah Morrow, MD, MS, FRCPC Western UniversityLondon, Ontario, Canada
Daniel Ontaneda, MD, PhD Cleveland ClinicCleveland, Ohio, USA
Michael Racke, MD The Ohio State UniversityColumbus, Ohio, USA
Kottil Rammohan, MD University of MiamiMiami, Florida, USA
Maria Pia Sormani, PhD University of GenoaGenoa, Italy
Simon Thebault, MD, MSc University of OttawaOttawa, Ontario, Canada
CMSC Consensus Statement on Neurofilament Biomarkers in MS
About the cover: Image shows rat brain cells grown in tissue culture and stained (green) with an antibody to neurofilament light (NfL) revealing a large neuron. Red stain indicates alpha-internexin in neuronal stem cells surrounding the large neuron. Image courtesy of EnCor Biotechnology Inc.

International Journal of MS Care1
Faculty DisclosuresThe program faculty reported the following relevant financial rela-tionships with ineligible companies:Bibiana Bielekova, MD has disclosed no relevant financial relationships.Ronald Booth, PhD, DCC, FCACB has disclosed no relevant financial relationships.Peter Calabresi, MD has disclosed the following relevant financial relationships: Research Grants: Annexon Biogen; Scientific Advisory Board: Biogen, Disarm Therapeutics.Tanuja Chitnis, MD has disclosed the following relevant financial relationships: Consultant: Biogen, Genentech, Novartis, Sanofi-Genzyme; Research Grants: Novartis Octave.Manuel Comabella, MD, PhD has disclosed the following rel-evant financial relationships: Consultant: Biogen, Merck Serono, Roche, Sanofi, Teva Pharmaceuticals.Robert Fox, MD has disclosed the following relevant financial relationships: Consultant: AB Science, Biogen, Celgene, EMD Serono, Genentech Genzyme, Immunic, Janssen, Novartis, Sanofi, TG TherapeuticsMark S. Freedman, MD, MSc, FRCPC has disclosed the fol-lowing relevant financial relationships: Consultant or Advisory Board: Actelion (Janssen, J&J), Alexion, Atara Biotherapeutics, Bayer Healthcare, Biogen, Celgene/BMS, Clene Nanomedicine, EMD Inc., GRI Bio, Magenta Therapeutics, Merck Serono, Novartis, Roche, Sanofi-Genzyme, Teva Canada Innovation; Speaker’s Bureau: EMD Serono, Sanofi-Genzyme; Research grants: EMD Inc. (Canada), Roche, Sanofi-Genzyme Canada.Roberto Furlan, MD, PhD has disclosed the following rel-evant financial relationships: Consultant: Biogen, Genzyme, Merck, Novartis, Roche.Gavin Giovannoni, MD, PhD has disclosed the following rel-evant financial relationships: Consultant: AbbVie, Janssen-Actelion, Atara Bio, Biogen, Celgene/BMS, EMD Serono, Genentech, GlaxoSmithKline, GW Pharma-Jazz Pharma, Japanese Tobacco, Merck, Novartis, Roche, Sanofi-Genzyme, Teva.Sharmilee Gnanapavan, MD, PhD has disclosed the follow-ing relevant financial relationships: Consultant: Genzyme, Merck, Roche; Speaker’s Bureau: TriMS, Neurodiem; Research grants: Genzyme, Merck, Takeda.Michael Khalil, MD, PhD has disclosed the following relevant financial relationships: Scientific Advisory Board: Biogen, BMS, Gilead, Merck, Novartis, Roche; Speaker’s Bureau: Biogen.Joep Killestein, MD, PhD has disclosed the following relevant financial relationships: Research funding: Biogen, Genzyme, Merck, Novartis, Roche.Jens Kuhle, MD, PhD has disclosed the following relevant finan-cial relationships: Scientific Advisory Board or Research Support: Bayer, Biogen, Celgene, Merck, Novartis, Octave Bioscience, Roche, SanofiDavid Leppert, MD has disclosed the following relevant financial relationships: Chief Medical Officer, GeNeuro.Jan Lycke, MD, PhD has disclosed the following relevant finan-cial relationships: Advisory Board: Alexion, Allergan, Almiral, Celgene, Merck, Novartis, Roche, Sanofi; Research grants: Biogen, Novartis, Teva.Sarah Morrow, MD, MS, FRCPC has disclosed no relevant finan-cial relationships.Tomas Olsson, MD, PhD has disclosed the following relevant financial relationships: Research Support: Biogen, Merck, Novartis, Roche, SanofiDaniel Ontaneda, MD, PhD has disclosed the following rel-evant financial relationships: Consultant: Biogen Idec, Genentech, Genzyme, Janssen, Novartis; Research grants: Genentech, Genzyme, Novartis.Michael Racke, MD has disclosed the following relevant financial relationships: Consultant: Teva Neuroscience.
Kottil Rammohan, MD has disclosed the following rel-evant financial relationships: Consultant: Biogen, EMD Serono, Genentech, Genzyme, Novartis; Research grants: Biogen, EMD Serono, Genentech, Genzyme, Novartis.Maria Pia Sormani, PhD has disclosed the following rel-evant financial relationships: Consultant: Biogen, GeNeuro, GlaxoSmithKline, Immunic Therapeutics, Merck, Novartis, Roche, Sanofi.Simon Thebault, MD, MSc has disclosed no relevant financial relationships.Katherine Wandersee has disclosed no relevant financial relationships.All of the relevant financial relationships listed for these individuals have been mitigated.
Staff DisclosuresPlanner and reviewer June Halper, MSN, APN-C has no relevant financial relationships with ineligible companies. Other planners, reviewers, editors, staff, and members at CMSC who are in a position to control content have no relevant financial relationships with ineligible companies.The planners, reviewers, editors, staff, or other members at Delaware Media Group who are in a position to control content have no relevant financial relationships with ineligible companies.
MediaPrint and Online
Method of Participation/How to Receive CreditThere is no fee to participate in this activity. To successfully com-plete this activity, the participant must 1) read the activity front matter, 2) complete the educational activity online, and 3) com-plete the post-test and activity evaluation. To participate online, go to http://www.cmscscholar.org. To receive credit, participants must receive a minimum score of 60% (at least 5 out of 8 correct) on the post-test.
Disclosure of Unlabeled UseCMSC and Delaware Media Group require faculty to disclose to the attendees when products or procedures being discussed are off-label, unlabeled, experimental, and/or investigational (not FDA-approved); and any limitations on the information that is pre-sented, such as data that are preliminary or that represent ongoing research, interim analyses, and/or unsupported opinion. Faculty in this activity may discuss information about pharmaceutical agents that is outside of US Food and Drug Administration-approved label-ing. This information is intended solely for continuing education and is not intended to promote off-label use of these medications. If you have questions, contact the medical affairs department of the manufacturer for the most recent prescribing information.
Commercial Support AcknowledgmentThis activity is supported by educational grants received from Biogen and Sanofi Genzyme.
DisclaimerCMSC and Delaware Media Group present this information for educational purposes only. The content is provided solely by faculty who have been selected because of recognized expertise in their field. Participants have the professional responsibility to ensure that products are prescribed and used appropriately on the basis of their own clinical judgment and accepted standards of care. CMSC, Delaware Media Group, and the commercial supporter(s) assume no liability for the information herein.
Privacy PolicyCopyright © 2021, Consortium of MS Centers and Delaware Media Group, Inc. All rights reserved. None of the contents of this supplement may be reproduced in any form without prior written permission. The opinions expressed in this program are those of the faculty and do not necessarily reflect the opinions or recommendations of their affiliated institutions, the publisher, or the supporters.
Contact InformationIf you have any questions about this activity, please contact Delaware Media Group at [email protected].
International Journal of MS Care2
Consensus Statement on Neurofilament Proteins in Multiple Sclerosis
CMSC Consensus Panel on Neurofilament Biomarkers in MSCo-chairs
Mark S. Freedman, MSc, MD, CSPQ, FANA, FRCPCNeuroscience Research Program and Multiple Sclerosis Research Unit, University of Ottawa
Sharmilee Gnanapavan, MD, PhDBarts Health NHS Trust
Department of Neuroscience and Trauma, Queen Mary University of London
Neurofilaments are intracellular cytoskeletal pro-teins that leak into cerebrospinal fluid (CSF) and blood as a result of neuronal damage.1
CSF and blood neurofilament levels are elevated, com-pared with age-matched controls, in a number of neu-rologic diseases such as multiple sclerosis (MS), amyo-trophic lateral sclerosis (ALS), and Parkinson’s disease, as well as traumatic brain injury (TBI).2,3 In MS, baseline levels are predictive of long-term prognosis.4 Change in serum or cerebrospinal fluid (CSF) neurofilament levels is emerging as an important biomarker to predict or detect disease progression and even response to disease-modifying therapy (DMT).5 Such blood and CSF bio-markers are significantly lacking and much needed in MS care and research.
Serum and CSF assays for neurofilament light chain (NfL) are now readily available, and their use will be expanded in many countries. The goal of this document is to provide universally applicable guidance on how to apply and interpret these biomarkers in MS research and clinical practice, based on current knowledge.
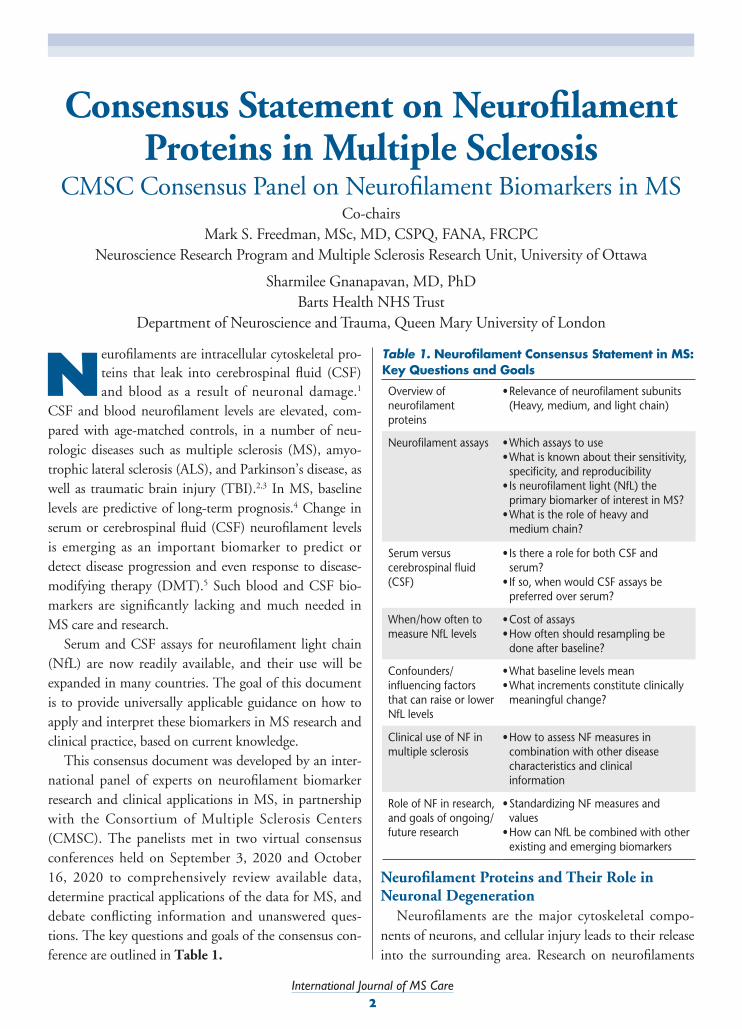
This consensus document was developed by an inter-national panel of experts on neurofilament biomarker research and clinical applications in MS, in partnership with the Consortium of Multiple Sclerosis Centers (CMSC). The panelists met in two virtual consensus conferences held on September 3, 2020 and October 16, 2020 to comprehensively review available data, determine practical applications of the data for MS, and debate conflicting information and unanswered ques-tions. The key questions and goals of the consensus con-ference are outlined in Table 1.
Neurofilament Proteins and Their Role in Neuronal Degeneration
Neurofilaments are the major cytoskeletal compo-nents of neurons, and cellular injury leads to their release into the surrounding area. Research on neurofilaments
Table 1. Neurofilament Consensus Statement in MS: Key Questions and Goals
Overview of neurofilament proteins
• Relevance of neurofilament subunits (Heavy, medium, and light chain)
Neurofilament assays • Which assays to use• What is known about their sensitivity,
specificity, and reproducibility• Is neurofilament light (NfL) the
primary biomarker of interest in MS?• What is the role of heavy and
medium chain?
Serum versus cerebrospinal fluid (CSF)
• Is there a role for both CSF and serum?
• If so, when would CSF assays be preferred over serum?
When/how often to measure NfL levels
• Cost of assays• How often should resampling be
done after baseline?
Confounders/influencing factors that can raise or lower NfL levels
• What baseline levels mean• What increments constitute clinically
meaningful change?
Clinical use of NF in multiple sclerosis
• How to assess NF measures in combination with other disease characteristics and clinical information
Role of NF in research, and goals of ongoing/future research
• Standardizing NF measures and values
• How can NfL be combined with other existing and emerging biomarkers

International Journal of MS Care3
Significance of Medium- and Heavy-Chain Neurofilaments in MSNeurofilament Medium Chain (NfM)
The role in MS of NfM is currently unclear. Few studies have focused on this neurofilament type in neurologic disease, and none have been done in MS. In patients with traumatic brain injury (TBI), NfM concentrations were shown to be increased in CSF and serum samples, especially in those with polytrauma.16 It is possible that with further research NfM measurements may prove to be informative in MS.
Neurofilament Heavy Chain (NfH)NfH is less studied than NfL, but as we learn more,
this marker may provide a wealth of information in MS and other neurologic diseases. In patients with ALS, phosphorylated NfH is increased in blood and CSF compared with healthy and neurological controls, and has been found to correlate with disease progression. Serum phosphorylated NfH appears to be elevated well before the time of diagnosis in patients with sporadic ALS.17 NfH levels have been measured in experimental autoimmune encephalomyelitis (EAE) mouse models of MS. Throughout the EAE disease course, higher lev-els of NH were released into the blood compared with pre-disease induction. At the chronic stage, NfH release dropped off, likely because the animal had lost a signifi-cant portion of its spinal cord.18
In humans, elevated NH in the CSF occurs in patients with clinically isolated syndrome (CIS) and optic neuritis, providing evidence of early and ongoing
neuroaxonal damage.19 In a study on the prognostic value of baseline NfH, a high serum phosphory-lated NfH titer was detectable in 9% of patients with relapsing-remitting MS (RRMS) and CIS versus 38.5% of those with sec-ondary progressive MS (SPMS). High phosphorylated NfH levels correlated with a higher Multiple Sclerosis Severity Score (MSSS) and T2 lesion volume.20 Serum NH levels may also offer prog-nostic value in MS. A trial of the sodium channel blocker lamotrig-ine as a neuroprotective agent also investigated the value of serum NfH as a predictor of prognosis
is not new, but in fact has been ongoing since pioneer neuroscientist Santiago Ramón y Cajal first described these proteins in the early 1900s.6 Neurofilaments are classified as light (NfL), medium (NfM), and heavy chain (NfH) based on their molecular weights. NfL is the predominant intermediate filament in the central nervous system (CNS), followed by α-internexin, NfM, and NfH. NfL is also the most common intermediate filament in the peripheral nervous system (PNS), fol-lowed by peripherin.7, 8
The neurofilament molecule is composed of the head or domain section, the rod, and the tail (Figure 1). As the axons in the CNS mature, they acquire more NfH subunits and thicken through phosphorylation. Both NfH and NfM undergo phosphorylation, which adds tail regions with radial enlargement of the neurofilament structure, leading to a highly stable cytoskeletal con-struct.9, 10 Hyperphosphorylation has been associated with neurodegenerative diseases such as ALS.11
Neurofilaments have a robust half-life. Although their elimination half-life is still unknown, they are thought to remain in the blood and CSF for many months follow-ing neurologic injury.12 We know that phosphorylation and other cell modifications of neurofilaments play an important role in axonal transport.13 Experiments with NfH knockout mice show that large myelinated axons have a significant decrease in conduction velocity, lead-ing to a disruption of the electrical current through the axon.14 In other studies, knocking out NfL and NfM in mice results in severely inhibited axonal radial growth.15
Figure 1. Neurofilament structureNeurofilament proteins add to the diameter of the axon and therefore influence its function. Structurally, all have a central, very highly conserved alpha helical rod domain in the middle, abutted by 2 variable regions: the head domain on the end terminus and the tail domain at the C terminus. Reprinted with permission from: Gaetani L, et al. J Neurol Neurosurg Psychiatry. 2019 Aug;90(8):870-881.

International Journal of MS Care4
Overall Significance of Neurofilaments as a Biomarker in MS• Neurofilament proteins are markers of neuronal degeneration
that can serve as important biomarkers of disease activity in MS.
• Elevated levels of NfL in blood or spinal fluid are most likely markers of both inflammation and neurodegeneration in MS.
• Because it can indicate neuronal degeneration from a wide range of causes, NfL offers limited diagnostic value in MS and is useful mainly for prognosis.
• Neurofilament heavy chain (NfH) warrants further investigation as a potential biomarker in MS. A ratio of NfL-to-NfH levels may be informative.
• Too little is known about neurofilament medium chain (NfM) in MS to make conclusive statements at this time.
Assays for Measuring NfL in CSF (CSF-NfL) and Serum (sNfL)• High-sensitivity enzyme-linked immunoassay (ELISA) assays are
appropriate for measuring NfL in CSF.• The single-molecule array (Simoa) is currently the predominant
method for measuring in blood (serum or plasma). Simoa assays must be processed on specialized laboratory equipment. Siemens also has a sensitive assay for sNfL that can be run on an automated immunoassay platform.
• The Uman Diagnostics monoclonal antibodies 47:3 and 2:1 are used in most sNfL assays. These highly non-competitive antibodies recognize NfL without cross-reactivity for NfM, NfH, or glial fibrillary acidic protein (GFAP).
• Coordinated efforts are underway to standardize assay platforms for sNfL and their interpretation in MS. As new assay systems are developed, they should be aligned for cross-comparison purposes.
Use of CSF Versus Serum• NfL is 10 times more highly concentrated in CSF than in serum,
making it a more robust biomarker. However, the invasiveness of lumbar puncture limits the practicality of using CSF-NfL for routine monitoring in MS.
• CSF-NfL should be a part of the analysis from an initial diagnostic lumbar puncture in patients with suspected MS. NfL levels should be analyzed at other time points if other indications for lumbar puncture arise. Atraumatic needles
should be used to reduce complications when lumbar puncture is indicated.
• After obtaining baseline NfL values using CSF, blood (serum or plasma) should be used for subsequent NfL monitoring in MS.
Timing of CSF and Serum NfL Analysis in MS• Baseline NfL levels (either serum or CSF) are a valuable
contribution to the initial workup in patients diagnosed with or suspected of having MS and can be interpreted in the context of other clinical information.
• During periods of perceived clinical quiescence, the panel’s recommendation for obtaining updated baseline sNfL levels are as follows: – Following relapse: at the 3- to 6-month follow-up visit– Magnetic resonance imaging (MRI) with gadolinium-
enhancing (Gd+) lesion: at the 3- to 6-month follow-up visit– MRI with new or enlarging T2 lesion: no new baseline sample
• To evaluate the impact of a DMT in the absence of clinical or MRI change, re-sampling of sNfL may be done at 3-month intervals.
• In people with or without neurologic disease, sNfL levels increase gradually with age, with a marked increase around age 60. To take into account the impact of aging on sNfL levels, re-sampling is recommended as follows:– CSF-NfL: at 5- to 10-year intervals– Serum/plasma NfL: after age 60
Quantification of NfL Levels in MS and Influence of Dynamic Change in NfL• For interpretation of sNfL and CSF-NfL in MS, there is a need
for robust, stratified reference ranges and cutoffs, potentially using Z-scores based on normative data from healthy subjects (soon to be available).
• There is still a need to identify disease-specific cutoffs to aid with prognostic and treatment decision-making; – What degree of change in sNfL would suggest worsening
MS? – What degree of change in sNfL warrants consideration for a
change in therapy?• When evaluating treatment efficacy, the greatest drop in NfL
values would be expected in treatment-naïve patients started on a new therapy. With subsequent monitoring, these changes may be more subtle.
Summary of Panel RecommendationsConsortium of Multiple Sclerosis Centers (CMSC) Consensus on
Neurofilament Proteins in Multiple Sclerosis
The goal of the consensus panel was to establish recommendations for integrating the measurement of neurofilament light chain (NfL) into multiple sclerosis (MS) research and clinical practice. NfL can be used to guide prognostic and treatment decisions and to evaluate the effects of disease-modifying therapy (DMT). Information derived from cerebrospinal fluid (CSF) or blood NfL is most informative when considered in the context of other clinical, radiographic, and biologic markers validated for MS. As information about NfL as an MS biomarker continues to expand, these recommendations will need to be updated accordingly.

International Journal of MS Care5
• Very high NfL levels might support a decision for treatment escalation, and very low or normal NfL levels would suggest staying with the current therapy.
• Intermediate ranges offer less decisive decision-making support. In these cases, other clinical and MRI parameters should be factored into the decision to escalate therapy or monitor more closely. These management decisions require prospective validation studies.
Value of NfL as an Adjunct to Imaging Biomarkers in MS• NfL is an objective, quantitative measure of recent neuronal
loss, offering real-time disease activity. • Using a combination of biomarkers provides additional
information. NfL adds an element of tissue specificity over MRI (which measures mostly water change), especially since the clinical implications of brain atrophy are difficult to assess in individual patients.
• NfL captures spinal cord pathology that may be absent on brain MRI.
• NfL can provide additive information with optical coherence tomography (OCT) in MS. OCT is a marker that correlates well with brain atrophy, whereas NfL correlates well with Gd+ acute lesions as well as T2 burden of disease, but is also highly predictive of brain atrophy.
Prognostic Value of NfL in MS• NfL has both short-term (within 2 years) and long-term
prognostic value in MS (within 2 years). In CSF, this has been shown at the group level and in individual patients, while prognostic values of blood NfL (serum or plasma) are seen mainly at the group level. – Higher sNfL level correlates with development of more Gd+
lesions and new T2 lesions in the subsequent year– sNfL levels correlate with longer-term outcomes (5 years),
including time to Expanded Disability Status Scale (EDSS) > 3.5 and time to clinically definite MS (CDMS)
– sNfL levels correlate with brain atrophy measures– Brain atrophy and sNfL together predict time to EDSS 6 over
8 years• Lowered NfL levels can be seen as a result of DMT. Short-term
change as a result of treatment is associated with longer-term MRI and clinical outcomes. On a group level, reduction of sNfL 6 months after starting treatment is associated with:– Fewer new T2 lesions at year 2– Less brain atrophy at year 2– Less EDSS change after year 4
• Persistently high sNfL levels despite treatment are associated with worse MRI outcomes at 4 years.
• Interpretation of NfL levels is most informative when combined with clinical, MRI, and inflammatory markers, and when corrected for confounding factors such as age, obesity, and diabetes.
• Due to individual variations and a potential for crossover with healthy controls, we need to identify cutoff points and to correct for confounders in order for sNfL to be more informative in daily clinical practice.
Potential Confounding Factors in NfL • Potential confounding factors should be recognized and
controlled for when interpreting NfL in healthy controls or persons with MS.
• Age is an important confounder affecting NfL interpretation. Mean NfL levels in a healthy person are approximately 10 pg/mL at age 20 and rise steadily over the years, then increase sharply after age 59. To counter the age phenomenon, NfL may be calculated based on a Z-score, which is more reliable and sensitive to change.
• People with higher body mass index (BMI) tend to have lower sNfL levels, possibly due to increased blood volume. Further research will help to determine how to adjust for this confounder.
• Based on available data, race does not appear to influence baseline NfL or NfL change. More data are needed from large databases and in people with MS.
• Diabetes may cause elevated NfL levels due to nerve damage. Elevated sNfL has been associated with diabetes, but it is not clear how much those influence NfL variations in people with MS and comorbid diabetes.
• Available data have not shown associations with other comorbidities such as hypertension, hyperlipidemia, or renal dysfunction.
• Any drug treatment that causes neurotoxicity could potentially lead to transient elevations in NfL, even if MS disease activity is suppressed by the therapy.
• In autologous hematopoietic bone marrow transplant, CNS toxicity immediately after the procedure may be mediated by the chemotherapy. This contributes to transient increases in MRI atrophy and in elevated NfL levels.
Ongoing Research Trials in MS and Future Research Goals• NfL is appropriate for use in all phases of MS clinical trials, and
in clinical practice where available. Outcomes based on CSF-NfL and blood NfL (serum or plasma) will be further refined with coordinated research efforts and ongoing advances in the field.
• Large-scale studies are underway to assimilate NfL information from databases of people with MS and healthy controls. The goal is to study the cross-sectional relationship of sNfL levels with demographics and comorbid conditions, MS clinical characteristics, disability status, and imaging measures
• These coordinated research efforts will help to answer questions such as:– factors associated with sNfL in healthy controls– whether characteristics such as age, gender, race, or body
weight are associated with sNfL > 97.5th percentile of control reference range
– Relationship of NfL levels to MS clinical measures such as PDDS, walking speed, manual dexterity, and processing speed
• In addition to prognostic studies, CSF-NfL and sNfL have been adopted as outcome measures in many phase 3 studies of MS DMTs.

International Journal of MS Care6
MRIPatient fulfills
McDonald criteriafor MS diagnosis
6- to 12-month monitoring period
Stable Elevated
T2 hyperintensities
Oligoclonal bands Neurofilament light (NfL)
Relapsing-remitting MS
MRI
CSF/blood
CSF or Serum NfL
Start DMT Start highlyactive DMT
Serum NfL
± clinical and/or MRI activity
Continuecurrenttherapy
Switch orescalateDMT
Re-baseline blood NfL Repeat CSF-NfL ifneeded for clarity
Determination of severity/prognosis
With or without symptoms consistent
with MS
NeuroExam
+ MRI andneuro exam
Baseline evaluation
Progressive formsof MS
± other poor prognosticsignsMild or typical for MS
MRI, EDSS
Normal Elevated
For PMS, useapprovedtherapies
Figure 2. Algorithm for Use of Serum and CSF-NfL in Clinical Decision-Making for Patients With Multiple SclerosisThe panel recommends that evaluation of NfL be used in conjunction with other measures of MS severity and prognosis, including MRI, other imaging biomarkers, and findings of neurologic examination. If a patient shows clinical worsening and/or MRI changes while on therapy, elevations in sNfL levels may signal the need to perform further study or consider a change in therapy. For a patient who appears to be clinically stable but has elevations in sNfL, this may warrant closer monitoring and/or escalation of therapy.

International Journal of MS Care7
6. Lafarga M, Casafont, I, Bengoechea, R, et al. Cajal’s contribution to the knowledge of the neuronal cell nucleus. Chromosoma. 2009;118(4):437-443. https://doi.org/10.1007/s00412-009-0212-x.
7. Lépinoux-Chambaud C, Eyer J. Review on intermediate filaments of the nervous system and their pathological alterations. Histochem Cell Biol. Jul 2013;140(1):13-22.
8. Petzold A. Neurofilament phosphoforms: surrogate markers for axonal injury, degeneration and loss. J Neurol Sci. Jun 15 2005;233(1-2):183-198.
9. Yuan A, Rao MV, Sasaki T, et al. Alpha-internexin is structurally and functionally associated with the neurofilament triplet proteins in the mature CNS. J Neurosci. Sep 27 2006;26(39):10006-10019.
10. Yuan A, Sasaki T, Kumar A, et al. Peripherin is a subunit of peripheral nerve neurofilaments: implications for differential vulnerability of CNS and peripheral nervous system axons. J Neurosci. Jun 20 2012;32(25):8501-8508.
11. Khalil M, Teunissen CE, Otto M, et al. Neurofilaments as biomarkers in neurological disorders. Nat Rev Neurol. Oct 2018;14(10):577-589.
12. Bridel C, van Wieringen WN, Zetterberg H, et al. Diagnostic value of cerebrospinal fluid neurofilament light protein in neurology: a systematic review and meta-analysis. JAMA Neurol. Jun 17 2019;76(9):1035-1048.
13. Sihag RK, Inagaki M, Yamaguchi T, Shea TB, Pant HC. Role of phosphorylation on the structural dynamics and function of types III and IV intermediate filaments. Exp Cell Res. Jun 10 2007;313(10): 2098-2109.
14. Jacomy H, Zhu Q, Couillard-Despres S, Beaulieu JM, Julien JP. Disruption of type IV intermediate filament network in mice lacking the neurofilament medium and heavy subunits. J Neurochem. Sep 1999;73(3):972-984.
15. Zhu Q, Couillard-Despres S, Julien JP. Delayed maturation of regenerating myelinated axons in mice lacking neurofilaments. Exp Neurol. Nov 1997;148(1):299-316.
16. Martinez-Morillo E, Childs C, Garcia BP, et al. Neurofilament medium polypeptide (NFM) protein concentration is increased in CSF and serum samples from patients with brain injury. Clin Chem Lab Med. Sep 1 2015;53(10):1575-1584.
17. De Schaepdryver M, Goossens J, De Meyer S, et al. Serum neurofilament heavy chains as early marker of motor neuron degeneration. Ann Clin Transl Neurol. Oct 2019;6(10):1971-1979.
18. Gnanapavan S, Grant D, Pryce G, Jackson S, Baker D, Giovannoni G. Neurofilament a biomarker of neurodegeneration in autoimmune encephalomyelitis. Autoimmunity. Jun 2012;45(4):298-303.
19. Lim ET, Grant D, Pashenkov M, et al. Cerebrospinal fluid levels of brain specific proteins in optic neuritis. Mult Scler. Jun 2004;10(3):261-265.
20. Gresle MM, Liu Y, Dagley LF, et al. Serum phosphorylated neurofilament-heavy chain levels in multiple sclerosis patients. J Neurol Neurosurg Psychiatry. Nov 2014;85(11):1209-1213.
21. Gnanapavan S, Grant D, Morant S, et al. Biomarker report from the phase II lamotrigine trial in secondary progressive MS - neurofilament as a surrogate of disease progression. PLoS One. 2013;8(8):e70019.
22. Williams T, Zetterberg H, Chataway J. Neurofilaments in progressive multiple sclerosis: a systematic review. J Neurol. May 23 2020.
23. Kriz J, Zhu Q, Julien JP, Padjen AL. Electrophysiological properties of axons in mice lacking neurofilament subunit genes: disparity between conduction velocity and axon diameter in absence of NF-H. Brain Res. Dec 1 2000;885(1):32-44.
and response to treatment in secondary progressive dis-ease.21 In this cohort of 120 patients with SPMS, serum NfH levels correlated with a number of disability mea-sures including 24-foot walk, 9-hole peg test, Paced Auditory Serial Addition Test (PASAT), EDSS, cere-bral atrophy on MRI, and magnetization transfer ratio (MTR).21 However, a systematic review of 76 studies on the value of neurofilament proteins in progressive MS found NfL to be a better predictor than NfH of current inflammatory activity, future brain atrophy, and treat-ment response.22
Does measuring NfH contribute anything beyond NfL in patients with MS? This remains unknown. Biologically, NfH has greater presence in heavily myelin-ated axons.23 This may prove useful in evaluating pro-gressive disease, whereas NfL may be a more valuable marker early in the disease.
Neurofilament research is certain to advance signifi-cantly in the coming years. Further research and clinical experience will continue to refine the role of these bio-markers in MS and other forms of neurodegeneration. It is important for the MS community to determine best practices for applying these tools, with regular updates as the light about NfL becomes clearer. o
The Consensus Panel’s Writing Committee acknowledges the role of a medical writer, Katherine Wandersee, who provided assistance in the development of the manuscripts for this supplement.
References 1. Leppert D, Kuhle J. Blood neurofilament light chain at the doorstep
of clinical application. Neurol Neuroimmunol Neuroinflamm. Sep 2019;6(5):e599.
2. Varhaug KN, Torkildsen O, Myhr KM, Vedeler CA. Neurofilament Light chain as a biomarker in multiple sclerosis. Front Neurol. 2019;10:338.
3. Olsson B, Portelius E, Cullen NC, et al. Association of cerebrospinal fluid neurofilament light protein levels with cognition in patients with dementia, motor neuron disease, and movement disorders. JAMA Neurol. Mar 1 2019;76(3):318-325.
4. Thebault S, Tessier DR, Lee H, et al. High serum neurofilament light chain normalizes after hematopoietic stem cell transplantation for MS. Neurol Neuroimmunol Neuroinflamm. Sep 2019;6(5):e598.
5. Kuhle J, Kropshofer H, Barro C, et al. Siponimod reduces neurofilament light chain blood levels in secondary progressive multiple sclerosis patients (S8.006). Neurology. 2018;90(suppl 15):S8.006.

International Journal of MS Care8
Measurement of Neurofilament Light Chain in Cerebrospinal Fluid and Blood
Ronald A. Booth, PhD, DCC, FCACBDepartment of Pathology and Laboratory Medicine, University of Ottawa The Ottawa Hospital & Eastern Ontario Regional Laboratory Association
Neurofilaments (Nf) are proteins expressed almost exclusively in neural tissue. When neurons are damaged or destroyed, Nf, pre-
dominantly the light chain (NfL), is released into the cerebrospinal fluid (CSF) in proportion to the extent of the damage.1 While NfL release is not specific for any single neurologic injury or disorder, it is spe-cific for neuronal damage. In this regard, NfL could be considered a “troponin for the brain,” as a marker of neuronal loss.2 In healthy controls, median concentra-tions of CSF-NfL range from 300 pg/L to > 700 pg/mL depending on the cohort and assay methodol-ogy. Blood concentrations are approximately 50 to 100 times lower than CSF, with median values ranging from 5 pg/mL to 11 pg/mL depending on assay and serum vs plasma. These require highly sensitive meth-ods for accurate measurement.2 Due to less invasive collection, blood has become the preferred biofluid for measurement of NfL over CSF.
Evaluation of a biomarker such as NfL for clinical use requires extensive clinical and analytical validation prior to routine use in patients. This section will briefly discuss the various assays currently available for measure-ment of NfL in serum or plasma and their potential for clinical utility.
Analytical MethodsDue to the very low concentrations of NfL in blood,
one must assess the ability of analytical methods to accurately measure these low values and establish at what concentrations the method is no longer able to be used. The clinical laboratory defines these lower limits as the lower limit of quantitation (LLOQ) or limit of detection (LOD). Lower limit of quantitation refers to the lowest value at which an accurate quantitative value (CV < 20%) can be reported, while the LOD is the value at which the assay is able to distinguish between the presence or absence of an analyte. In the case of blood NfL, the LLOQ is the most relevant and useful unit of measure.
ELISA for NfLThe initial assays developed for NfL were enzyme-
linked immunoassays (ELISA), which have a lower LOD of approximately 0.1 ng/L (100 pg/mL). This LOD is sufficient for measuring NfL in CSF; how-ever, it is not sensitive enough to quantify NfL in blood. Therefore, more sensitive bioassays have since been developed, which will be further discussed. These include:
• Electrochemiluminescent (ECL) assays• Enzymatic chemiluminescent assays (CLIA)• Single-molecule array (Simoa) assay• Aptamer-based assay
ECL and CLIAChemiluminescent immunoassays produce light
through either enzymatic (commonly alkaline phospha-tase or horseradish peroxidase among others) or elec-trochemical methods to provide an increased sensitivity over traditional ELISAs. The electrochemiluminescent (ECL) assays are based on oxidative reduction reactions with Ruthenium complexes, while chemiluminescent assays (CLIA) that do not use Ruthenium are often acridinium-based ester or enzyme, linked to secondary detector antibodies. The level of sensitivity for chemilu-minescent assays is higher than that of standard ELISA assays. Chemiluminescent methods are commonly used in routine clinical diagnostic laboratories, which can facilitate the routine use of NfL clinical practice.
SimoaThe single-molecule array, or Simoa, assay is a novel
fluorescence-based immunoassay method for detec-tion of very low concentration antigens in biofluids. The Simoa assay uses a novel combination of “digital” and analogue methods to quantitate a broad range of analyte concentrations. Briefly, antibody-coated fluo-rescent beads are mixed with patient specimens where target antigens (NfL in this case) are captured on the beads, as with many automated enzyme immunoassays. Following traditional wash and secondary antibody

International Journal of MS Care9
to have an LLOQ of approximately 1.62 pg/mL, sufficient for measuring NfL in blood or CSF. It uses the same Uman Diagnostics monoclonal antibodies as Simoa and has shown good correla-tion with the Simoa commercial assay. It is cur-rently in the pre-clinical development phase.
• The Simple Plex Ella assay is a fully automated and fully self-contained “next-generation” ELISA. It is a microfluidic immunoassay with assay-specif-ic cartridges allowing for detection of up to 4 dif-ferent analytes. It is a low-volume analyzer. More work is required to determine how this assay com-pares with other NfL assays.
Detection antibodiesIdeally, antibodies used in immunoassays should have
a high degree of affinity and specificity for the target molecule. The antibodies used in many NfL assays are the monoclonal antibodies 47:3 and 2:1 produced by Uman Diagnostics. These antibodies have a high speci-ficity for NfL and recognize the conserved rod domain of NfL without cross-reactivity for neurofilament medi-um chain (NfM), neurofilament heavy chain (NfH), or glial fibrillary acid protein (GFAP).4 Because they are reactive against NfL in human, bovine, rat, mouse, sheep, and macaque samples, assays using these antibod-ies can be used for animal studies as well as humans. Currently, the Simoa Ella and Siemens assays utilize these antibodies, which should allow for comparable NfL results across platforms.
Factors that May Influence Simoa Assay Findings for NfLHome-brew vs. Commercial Simoa Assays
Two different versions of the Simoa assay have been used in clinical trials. The original home-brew Simoa assay was developed in the research laboratory of Henrik Zetterberg in Sweden. This early NfL assay used Uman Diagnostics’ monoclonal antibodies (47:3 and 2:1) in
steps, beads settle into a specially designed micro-well array, where each micro-well can accommodate only a single bead. Detection is either digital for low concentra-tions (by counting the number of fluorescent beads) or analogue for higher concentrations (by capturing total fluorescence). Because of the high sensitivity of the assay, it is capable of detecting a single molecule per bead. The instrument is ready for routine clinical use and can accept specimens in clinical blood tubes of 96-well microtiter plates.
Compared with ELISA, the Simoa immunoassay has analytical sensitivity measurable down to the picogram per milliliter (pg/mL), with an LLOQ of about 0.1 pg/mL. The high dynamic range of the Simoa assay (about 1,800 pg/mL) offers accurate measurement of both the upper and lower concentrations from a relatively small volume. Simoa is currently the predominant method for measuring NfL in blood (serum or plasma), and is the current candidate instrument for medium- to high-volume routine use in clinical laboratories.Comparison of Simoa With Other Assays
An analysis by Kuhle and colleagues compared the LLOQ (precision of < 20% CV and accuracy of ±20%) for ELISA, ECL, and Simoa NfL assays in 33 paired CSF and serum samples (Table 1).3 LLOQ was 0.62 pg/mL for Simoa versus 15.6 pg/mL for ECL and 78.0 pg/mL for ELISA. Correlations between paired CSF and serum samples were strongest for Simoa (r = 0.88, P < 0.001) and ECL (r = 0.78, P < 0.001) and weaker for ELISA assays (r = 0.38, P = 0.030).3
Siemens CLIA and Simple Plex Ella assaysTwo additional newer assays with LLOQ low enough
to be used for measurement of NfL in blood are the Siemens CLIA assay and the Simple Plex Ella assay.
• The Siemens assay is run on the Siemens Centaur, a currently available high-volume clinical diagnos-tic immunoassay analyzer. This assay is reported
Table 1. Comparison of sensitivity for NfL between ELISA, ECL, and Simoa assays
ELISA ECL Simoa
LLOQ 78 pg/mL 15.6 pg/mL 0.62 pg/mL
Mean CSF 1074(426.0–3051.5)
965(345–2727)
1649(558.5–4997.5)
Mean serum 78(78.0–252.0)
51.6(15.6–62.5)
22.0(12.5–54.5)
# serum below LOQ 18 (54.5%) 20 (60.6%) 0
Kuhle J, et al. Clin Chem Lab Med. 2016;54(10):1655-1661.LLOQ, lower limit of quantitation; LOQ, limit of quantitation; CSF, cerebrospinal fluid; ECL, electrochemiluminescence; NfL, neurofilament light chain; ELISA, enzyme-linked immunoassays

International Journal of MS Care10
centigrade, for up to 24 hours. In both blood and CSF samples, NfL levels remain remarkably stable over mul-tiple freeze-thaw cycles—indeed, up to 5 freeze-thaw cycles of CSF did not significantly alter the quantita-tion.6 Even 5-day-old mailed-in samples did not show reduced stability.
Significance in Patients Taking High-Dose BiotinThe Simoa assay uses a streptavidin biotin-labeled
link. Because of this, it is important to consider whether taking high-dose biotin—or even lower doses of biotin as a routine supplement—may interfere with Simoa assay results for NfL. Manufacturer data show that bio-tin of up to 80 µM in samples can be tolerated without significant impact on the measurement of NfL when using the Simoa assay. Practically, among patients tak-ing biotin at 5,000 or 10,000 µg/day, 100% and 97.5%, respectively, are below the 80 µM biotin threshold 3 hours post dose. Furthermore, by 8 hours post dose, all patients had blood biotin below the 80 µM threshold.7
Influence of Hemolysis or Lipemia on Simoa Assay For NfL
Hemolysis and lipemia are the most frequently encountered endogenous causes of interference in clini-cal laboratories.8 The Simoa NfL assay does not seem to be grossly affected by the presence of hemolysis or lipe-mia, and measured values tend to be mildly decreased (10% to 23%). This warrants additional study to deter-mine the significance of these interferences. o
References1. Barro C, Benkert P, Disanto G, et al. Serum neurofilament as a predictor
of disease worsening and brain and spinal cord atrophy in multiple sclerosis. Brain. Aug 1 2018;141(8):2382-2391.
2. Thebault S, Booth RA, Freedman MS. Blood neurofilament light chain: the neurologist’s troponin? Biomedicines. Nov 21 2020;8(11):523.
3. Kuhle J, Barro C, Andreasson U, et al. Comparison of three analytical platforms for quantification of the neurofilament light chain in blood samples: ELISA, electrochemiluminescence immunoassay and Simoa. Clin Chem Lab Med. Oct 1 2016;54(10):1655-1661.
4. Disanto G, Barro C, Benkert P, et al. Serum neurofilament light: A biomarker of neuronal damage in multiple sclerosis. Ann Neurol. Jun 2017;81(6):857-870.
5. Hendricks R, Baker D, Brumm J, et al. Establishment of neurofilament light chain Simoa assay in cerebrospinal fluid and blood. Bioanalysis. Aug 2019;11(15):1405-1418.
6. Keshavan A, Heslegrave A, Zetterberg H, Schott JM. Stability of blood-based biomarkers of Alzheimer’s disease over multiple freeze-thaw cycles. Alzheimers Dement (Amst). 2018;10:448-451.
7. Grimsey P, Frey N, Bendig G, et al. Population pharmacokinetics of exogenous biotin and the relationship between biotin serum levels and in vitro immunoassay interference. Int J Pharmacokinetics. 2017;2(4).doi.org/10.4155/ipk-2017-0013.
8. Koseoglu M, Hur A, Atay A, Cuhadar S. Effects of hemolysis interferences on routine biochemistry parameters. Biochem Med (Zagreb). 2011;21(1):79-85.
combination with bovine NfL calibrators, whereas the commercial Simoa assay utilizes the same antibodies with recombinant human NfL as calibrators. The dif-ferent assay formulations produce slightly different NfL values, therefore caution must be used when reviewing and comparing clinical studies using the different assays. One comparative study showed a lower LOQ for the human versus the bovine calibrator and a significant bias between the assays.5 Using matched specimens, Hendricks et al showed the home-brew assay using bovine calibrators generated results approximately 5 times greater than those of human calibrator assay (slope of 4.75). Another difference that may have contributed to variability of trial results is that the early kits used lyophilized NfL calibrators that required reconstitution by the customer, possibility contributing to bias between studies.5 The current-generation Simoa NfL kits utilize pre-aliquoted calibrators with lot-specific concentra-tions and lot-specific quality control material to achieve greater consistency.Stability of Neurofilament in CSF and Serum Samples
Neurofilaments have been shown to be remark-ably stable in both serum and CSF. NfL is stable in serum, both at room temperature and at 4 degrees
PRACTICE POINTS• The enzyme linked immunoassay (ELISA)—with a
lower limit of detection of approximately 0.1 ng/L (100 pg/ mL)—is sufficient for measuring NfL in CSF, but is not sensitive enough to quantify NfL in blood.
• More sensitive bioassays for measuring from NfL in serum or plasma include electrochemiluminescent (ECL) and enzymatic chemiluminescent assays (CLIA). The single molecule array (Simoa) is currently the predominant method for measuring NfL in blood.
• Simoa is a novel fluorescence-based immunoassay which can detect very low antigen concentrations in biofluids. Compared with ELISA, Simoa has analytical sensitivity measurable to the picogram per milliliter (pg/mL), with an LLOQ of about 0.1 pg/ mL.
• Two additional newer assays with lower limit of quantitation (LLOQ) low enough to be used for measurement of NfL in blood are the Siemens CLIA assay and the Simple Plex Ella assay.
• Neurofilaments have been shown to be remarkably stable in both serum and CSF. In both blood and CSF samples, NfL levels remain remarkably stable over multiple freeze-thaw cycles. NfL is stable in serum, at room temperature and at 4 degrees centigrade, for up to 24 hours.

International Journal of MS Care11
Potential of NFL as a Biomarker in MS: Cerebrospinal Fluid Versus Serum
Tomas Olsson, MD, PhDKarolinska Institutet
Solna, Sweden
Cerebrospinal fluid (CSF) is rich in biomarkers of axonal damage and inflammation, including neurofilament light (NfL). Lumbar puncture to
obtain CSF is an invasive procedure with risks including post-puncture headache, which can be reduced some-what with less traumatic techniques using smaller nee-dles. If NfL is to go mainstream as a biomarker of mul-tiple sclerosis (MS) prognosis and treatment response, using serum or plasma instead of CSF has many advan-tages. This chapter will analyze the pros and cons of CSF versus serum for NfL analysis and review available data on the benefits of measuring CSF neurofilament levels in MS for prognosis and treatment efficacy.
NfL concentrations in CSF are approximately 50 to 100 times greater than NfL in serum.1, 2 Additionally, NfL concentrations are approximately 20% higher when measured in serum compared to plasma, indicating that serum and plasma levels are not directly interchangeable within the same study. Studies have consistently shown good correlation between concentrations in serum, plasma, and CSF, as well as good correlation for serum versus plasma, as shown in Figure 1.1, 3
Applications of Neurofilaments in MS
Potential applications for neurofilament mea-sures in MS may include:
• Short-term progno-sis (up to 2 years)
• Long-term progno-sis (5 to 10 years)
• Aid in dec id ing potency of initial therapy based on prognostic factors
• Response to therapy and indicator for switching therapy
• Aid to decision making when clinical and mag-netic resonance imaging (MRI) signs are unclear
• Expanding no evidence of disease activity (NEDA)-4 concept to NEDA-5
Short-Term and Long-Term Prognosis in MSInvestigators from Linkoping University in Sweden
studied a number of CSF biomarkers to evaluate change from baseline over a 2-year period in 41 patients with clinically isolated syndrome (CIS) or relapsing-remitting MS (RRMS) and 22 healthy controls.4 Among a wide range of biomarkers examined (CXCL8, CXCL10, CXCL13, CCL20, CCL22, NfL, NfH, glial fibrillary acidic protein, chitinase-3-like-1, matrix metalloprotein-ase-9, and osteopontin), NfL was shown to be the best marker for detecting new disease activity and NEDA, followed by CXCL13.
NfL has been shown to have long-term prognostic value at a group level, but studies thus far suggest that it is less useful for individual prognosis. In a 2010 study
Figure 1. Correlation of NfL levels in cerebrospinal fluid/serum (A) and serum/plasma (B)Paired samples of cerebrospinal fluid and serum were obtained during diagnostic procedures from patients with MS and non-inflammatory neurological disease controls and show a high degree of correlation between the 2 compartments. Plasma samples were available in a subset of patients, also demonstrating a high degree of correlation between plasma and serum. Reprinted with permission from Piehl F, et al. Mult Scler. Jul 2018;24(8):1046-1054.

International Journal of MS Care12
NfL levels and EDSS score increases of 1.4 to 1.7 and a sustained EDSS score of 3.0 (all P < 0.001). In contrast, the risks of reaching a sustained EDSS score of 6.0 and conversion to SPMS were not consistently significant (Figure 2).7 Unpublished data from this group show similar correlations with cognitive function measured via Symbol Digit Modalities Test (SDMT).
On a group level, CSF-NfL clearly indicates prog-nosis in MS over both short- and long-term intervals. At the group level, serum or plasma NfL also indicates prognosis, although with less sensitivity than CSF. It is still unclear how to make prognostic predictions for individuals based on change in NfL. CSF-NfL ELISA assays are widely accessible, while serum NfL requires more advanced equipment. At an initial diagnostic lum-bar puncture, baseline CSF-NfL should be included as part of the workup along with clinical and MRI mark-ers, preferably along with a CSF inflammation marker such as CXCL13.
that analyzed group data from 99 patients with MS, having higher CSF-NfL levels early in the disease corre-lated with faster conversion to secondary progressive MS (SPMS) over an 8- to 20-year time period.5
A prospective longitudinal cohort study by the aforementioned Linkoping group analyzed a variety of neurodegenerative and neuroinflammatory mark-ers (including NfL, CXCL markers, and MMP-9) in repeated CSF samples from 41 patients with CIS or RRMS and 22 healthy controls. Serum NfL was also analyzed using single-molecule array (Simoa).6 NEDA-3 status and brain volume were evaluated and recorded over 4 years of follow-up. NfL levels in both CSF and serum correlated significantly (P < 0.001), but CSF-NfL was more strongly associated with NEDA-3 status, new T2 lesions, and brain volume loss. Compared to serum, the differential between healthy controls and patients with MS was significantly clearer when CSF was used. This study was one of the first examples that showed an overlap of NfL values between controls and some patients with MS.6
Another group from the Karolinska Institute investigated the asso-ciation between plasma NfL levels and the risk of developing sustained disability worsening on Expanded Disabil ity Status Scale (EDSS) and progression to SPMS. Concentrations of plas-ma NfL analyzed via the Simoa method were compared among 4,385 persons with MS and 1,026 randomly selected, population-based, sex- and age-matched con-trols.7 This study also showed some overlap between controls and persons with MS in plas-ma NfL levels. However, there was a highly sig-n i f i cant a s soc ia t ion between elevated plasma
Figure 2. Risk of reaching major disability milestones, stratified by baseline plasma NfL (pNfL) levelsHighly significant associations are shown between elevated plasma NfL levels and EDSS worsening— ranging from 1.4 to 1.7—and the risks of reaching a sustained EDSS score of 3.0 (all P < 0.001). The risk of reaching a sustained EDSS score of 6.0 and for conversion to SPMS were not consistently significant. Reprinted with permission from: Manouchehrinia A, et al. Neurology. Jun 9 2020;94(23):e2457-e2467.

International Journal of MS Care13
CHI3L1, and CHIT1) and reduced axonal damage (NfL) were shown in patients after switching to the second-line therapies. These studies establish that CSF-NfL can be useful for assessing efficacy. In a comparison of CSF and serum NfL for monitoring disease activity, both are useful, but CSF has greater specificity and sensi-tivity than does serum (Figure 3).11
Researchers from Barts and The London School of Medicine and Queen Mary University of London assessed the interactions between elevated NfL, clinical activity, and MRI findings in a cohort of 203 patients with RMS (58%) or progresive MS (42%).12 Disease activity was most frequently indicated by elevated CSF-NfL (n = 85), followed by clinical (n = 81) and MRI activity (n = 65). CSF-NfL measurements were inde-pendently associated with clinical (P = 0.02) and MRI activity (P < 0.001). In some cases (mainly in patients with progressive MS, n = 22), elevated CSF-NfL was the sole indicator of disease activity (n = 22), 77% had progressive MS. The presence of elevated CSF-NfL was significantly more likely to prompt a treatment escala-tion than MRI, clinical indicators, and normal CSF-NfL (P < 0.001).12
In January 2019, the International Progressive MS Alliance convened an expert panel to consider the util-ity and validity of NfL as a biomarker for MS in general and progressive MS specifically.8 The panel concluded that serum NfL (sNfL) “may provide a plausible bio-marker of progressive MS, addressing some of the limita-tions of current imaging biomarkers.” The panel identi-fied contexts of use, which included: 1) to accelerate drug development; 2) as a pharmacodynamic/treatment response biomarker; 3) as an endpoint/outcome measure in clinical trials of progressive MS; 4) as a prognostic biomarker to predict disease progression; and 5) to be used for the selection of patients with progressive MS into clinical trials.8
The group also identified knowledge gaps relating to the use of NfL as a biomarker for progressive MS, including: 1) need for standardization of sample col-lection and assay methods; 2) need for a normative database of sNfL concentrations in healthy volunteers, including the effects of age and comorbidities; and 3) a deeper analysis of legacy clinical trial data to help clarify the predictive value of baseline concentrations of sNfL, define the response of sNfL to different therapies, and clarify the relationship between NfL and clinical and imaging outcomes. Furthermore, we need more infor-mation about how much inflammatory activity—includ-ing activated microglia and other disease processes—contributes to changes in NfL levels.8
Evaluating Response to Disease-Modifying TherapyA study at the Karolinska Institute looked at the
effect of natalizumab treatment on the release of CSF-NfL and another marker of neuronal damage, glial fibrillary acidic protein (GFAP).9 CSF samples from 92 patients with relapsing forms of MS were collected prospectively before starting treatment with natali-zumab and after 6 or 12 months of treatment. In nearly all cases, natalizumab was being used as a second-line agent due to breakthrough disease activity. Natalizumab treatment led to a 3-fold reduction of NfL levels, from a mean value of 1,300 ng/L (standard deviation [SD] 2,200) to 400 ng/L (SD 270) (P < 0.001). The value of 400 ng/L was not significantly different from NfL levels in healthy control subjects (350 ng/L).9
Another study evaluated change in CSF-NfL levels along with other CSF biomarkers in patients with MS taking a first-line DMT (usually an interferon) and after a switch to a second-line agent (natalizumab or fingo-limod).10 Reduced inflammatory activity (CXCL13,
Figure 3. Specificity and sensitivity of NfL in serum and CSF for monitoring MS disease activityROC curve with AUC for NfL in serum and CSF indicating specificity and sensitivity to discriminate patients with MS disease activity from patients without disease activity. AUC, area under the curve; CSF, cerebrospinal fluid; NfL, neurofilament light; ROC, receiver operating characteristic. Reprinted with permission from Novakova L, et al. Neurology. 2017;89(22):2230-2237.

International Journal of MS Care14
References 1. Bergman J, Dring A, Zetterberg H, et al. Neurofilament light in CSF
and serum is a sensitive marker for axonal white matter injury in MS. Neurol Neuroimmunol Neuroinflamm. Oct 2016;3(5):e271.
2. Khalil M, Teunissen CE, Otto M, et al. Neurofilaments as biomarkers in neurological disorders. Nat Rev Neurol. Oct 2018;14(10):577-589.
3. Piehl F, Kockum I, Khademi M, et al. Plasma neurofilament light chain levels in patients with MS switching from injectable therapies to fingolimod. Mult Scler. Jul 2018;24(8):1046-1054.
4. Håkansson I, Tisell A, Cassel P, et al. Neurofilament light chain in cerebrospinal fluid and prediction of disease activity in clinically isolated syndrome and relapsing-remitting multiple sclerosis. Eur J Neurol. May 2017;24(5):703-712.
5. Salzer J, Svenningsson A, Sundström P. Neurofilament light as a prognostic marker in multiple sclerosis. Mult Scler. Mar 2010;16(3):287-292.
6. Håkansson I, Tisell A, Cassel P, et al. Neurofilament levels, disease activity and brain volume during follow-up in multiple sclerosis. J Neuroinflammation. Jul 18 2018;15(1):209.
7. Manouchehrinia A, Stridh P, Khademi M, et al. Plasma neurofilament light levels are associated with risk of disability in multiple sclerosis. Neurology. Jun 9 2020;94(23):e2457-e2467.
8. Kapoor R, Smith KE, Allegretta M, et al. Serum neurofilament light as a biomarker in progressive multiple sclerosis. Neurology. Sep 8 2020;95(10):436-444.
9. Gunnarsson M, Malmeström C, Axelsson M, et al. Axonal damage in relapsing multiple sclerosis is markedly reduced by natalizumab. Ann Neurol. Jan 2011;69(1):83-89.
10. Novakova L, Axelsson M, Khademi M, et al. Cerebrospinal fluid biomarkers of inflammation and degeneration as measures of fingolimod efficacy in multiple sclerosis. Mult Scler. Jan 2017;23(1):62-71.
11. Novakova L, Zetterberg H, Sundström P, et al. Monitoring disease activity in multiple sclerosis using serum neurofilament light protein. Neurology. Nov 28 2017;89(22):2230-2237.
12. Reyes S, Smets I, Holden D, et al. CSF neurofilament light chain testing as an aid to determine treatment strategies in MS. Neurol Neuroimmunol Neuroinflamm. Nov 2020;7(6).
13. Lee J, Hyeon DY, Hwang D. Single-cell multiomics: technologies and data analysis methods. Exp Mol Med. Sep 2020;52(9):1428-1442.
14. Wang Q, Peng WX, Wang L, Ye L. Toward multiomics-based next-generation diagnostics for precision medicine. Per Med. Mar 2019;16(2):157-170.
ConclusionsIn the future, technological development with mul-
tiomics (biological analysis in which the data sets use multiple “omes” including the genome, proteome, tran-scriptome, epigenome, metabolome, and microbiome) will be important to build on the evidence such as blood and CSF-NfL.13, 14 We should expect a larger set of bio-markers that could reflect more aspects of MS pathol-ogy, such as types of inflammation, damage to myelin and oligodendrocytes, and other information. o
PRACTICE POINTS• NfL in both CSF and plasma represents an important
development in MS as a non-specific biomarker of axonal and neuronal damage. This development may be as important or even more important than MRI in monitoring disease activity.
• CSF neurofi laments have value in measuring therapeutic efficacy, probably also on the individual level, preferably in combination with an inflammatory marker. While repeated lumbar puncture may be problematic, less traumatic techniques with thin needles, can be used in selected cases.
• In comparison with CSF, serum and plasma NfL have a lower dynamic range and a large overlap with population-based controls or values. Serum and plasma NfL have prognostic value on the group level and in determining response to therapy at an individual level. Because of this, NfL levels are very useful in clinical trials.
• For progressive MS, the prognostic value of NfL is less clear. We understand too little about whether PMS is a problem with adaptive immunity, accessible for therapy with current drugs, or some form of slow, age-dependent neurodegeneration.

International Journal of MS Care15
Considerations for Timing of NfL Measurement in Multiple Sclerosis
Jan Lycke, MD, PhDSahlgrenska Academy, University of Gothenburg, Sweden
As neurofilament light (NfL) is adopted as a biomarker of neuronal loss for evaluating MS disease course and treatment response,
an important consideration is when and how often NfL should be measured. Beyond baseline measures of cerebrospinal fluid (CSF) or serum NfL, key ques-tions include:
• During periods of perceived clinical or magnetic resonance imaging (MRI) quiescence, how often should re-baselining be done? How often when there is clinical or MRI activity?
• How often should re-sampling be done to evalu-ate the impact of a disease-modifying therapy (DMT) in the absence of clinical or MRI change?
• How often should re-sampling be done to take into account the impact of aging on NfL levels?
• Are any treatments for MS known to have a para-doxical effect on NfL (e.g., toxic effects that may lead to NfL elevation)?
NfL as a Marker of Clinical Disease Activity in MS
NfL levels in healthy individuals and patients with MS are dynamic and vary under a number of condi-tions. NfL levels are increased during all clinical courses of MS, but are highest in patients with active relapsing-remitting disease (RRMS).1 In patients with RRMS, NfL levels are up to 10-fold higher during relapse versus remission (Figure 1).1
High NfL levels at disease onset correlate with disease progression, as measured with the Expanded Disability Status Scale (EDSS), in patients with an active relapse (r = 0.49; P < 0.01) and in clinically stable patients (r = 0.29; P < 0.05).2
Our 1998 study was the first performed on NfL in MS.3 CSF was obtained from RRMS patients in a trial, to determine if treatment with acyclovir had an impact on the disease course and relapse activity. In place of MRI, repeated lumbar punctures were done every fourth
month over 2 years. Increased NfL concentrations were seen in 78% of patients with MS. NfL levels were high-est close to the time of relapse and peaked at 2 to 3 weeks after relapse onset, and were reduced to low levels about 3 months into the remission period.3
NfL levels correlate well with CSF inflammatory biomarkers, including CHI3L1, CXCL13, and osteo-pontin.4, 5 To determine whether NfL and other CSF-derived proteins reflect different pathologic processes of MS, we performed serial lumbar puncture in 66 patients with MS and 50 healthy control subjects.1 Compared with controls, mean NfL levels were increased during all stages of MS (P < 0.001), peaking almost 10 times higher during acute relapses. In contrast, glial fibrillary acidic protein (GFAP) showed the highest levels during
Figure 1. Concentration of NfL in CSF during relapse1
Concentrations of NfL in cerebrospinal fluid (CSF) of patients with relapsing-remitting MS during relapse (RRMS rel) and in remission (RRMS rem); patients with secondary progressive MS (SPMS); and healthy controls. Boxes include median, 25th, and 75th percentiles; bars indicate 10th and 90th percentiles. Triangles indicate individual values. N=number of subjects.

International Journal of MS Care16
value, while also serving as a marker of disease severity. CSF-NfL levels are elevated in persons with mild cogni-tive impairment and further increased in Alzheimer’s disease. Diseases with higher axonal degenerative rates have higher values of NfL, particularly amyotrophic lateral sclerosis (ALS) and Parkinson’s-like diseases with dementia and Lewy body disease.8 Movement disorders with the highest NfL levels are progressive supranuclear palsy (PSP) and cortical basal degeneration, probably due to their high rate of neurodegeneration (Figure 2).9
Neuronal Damage Due to Athletic ActivityNfL is gaining attention as a biomarker of head
trauma in sports such as boxing, soccer, football, and others.10, 11 In these situations, timing of NfL elevations
secondary progressive MS (P < 0.001), with strong cor-relation to neurologic deficits on EDSS.1
Real-World Studies of NfL Levels During Relapse or MRI Activity
Our MS clinic at the University of Gothenburg has assessed CSF-NfL routinely in clinical practice since 2001. In a real-world study, we evaluated data from 769 patients with RMS treated in our clinic between 2001 and 2018 who had lumbar punctures at diagnosis and during relapse or other clinical events. We confirmed higher NfL levels during relapse, with the highest in patients with severe relapses, and we also confirmed higher NfL lesions were seen in patients with contrast-enhancing lesions (unpublished data). DiSanto and col-leagues showed similar findings using the Simoa assay for serum NfL (sNfL).6 In addition to showing strong association between CSF-NfL and sNfL (P < 0.001), this study showed that patients who had either brain or spinal gadolinium-enhancing (Gd+) lesions or both had higher sNfL than those without.
To detect residual disease activity in patients with no signs of clinical or ongoing radiological activity, we recently conducted a real-world study of 90 patients with RRMS and 47 with progressive MS (PMS) (either primary or secondary).7 CSF-NfL and CXCL13 con-centrations were determined at baseline, before initiat-ing or switching DMT, and after 12 and 27 months of follow-up. Even patients with no ongoing disease activity had elevations of NfL and CXCL13, while after 12 months of treatment with a DMT (mostly second line), 80% to 90% of the patients had decreased bio-markers (Table 1).7 We concluded that these markers seemed considerably more sensitive to disease activity than clinical and MRI measures.
Influence of Timing on Conditions Associated with Elevated NfL
Any condition that causes axonal damage may lead to increased NfL spillage into CSF and blood. For some neurodegenerative dis-eases, NfL may have diagnostic or predictive
Table 1. Residual disease activity in patients with RRMS and PMS without clinical/radiological signs of activity7
Before DMT• All patients with ongoing disease activity (relapse or contrast-
enhancing lesions on MRI) had increased NfL or CXCL13• RRMS (n = 90) and PMS patients (n = 47) without ongoing
disease activity:– 39% of RRMS and 50% of PMS had elevations of either NfL
or CXCL13– 11% of RRMS and 16% of PMS had elevations of both NfL
and CXCL13
After 12 months of DMT• DMT reduced CXCL13 and NfL in 80% to 90%• 22% of RRMS and 19% of PMS still had elevated CSF-NfL
despite no relapses or Gd+ lesions
Source: Novakova L, Axelsson M, Malmeström C, et al. NFL and CXCL13 may reveal disease activity in clinically and radiologically stable MS. Mult Scler Relat Disord. Nov 2020;46:102463.
Figure 2. CSF-NfL levels for diagnostics and disease severity in neurodegenerative disorders9
Source: Olsson B, Portelius, E, Cullen, NC, et al. Association of cerebrospinal fluid neurofilament light protein levels with cognition in patients with dementia, motor neuron disease, and movement disorders. JAMA Neurol. 2019;76(3):318-325.

International Journal of MS Care17
time of or prior to a Gd+ lesion, sNFL elevations aver-aged 32.3% (P = 0.002) compared with remission. In this study, significant elevations in sNfL after a clinical relapse occurred only when associated with a Gd+ lesion. The authors concluded that sNfL peaks in a 3-month window around the appearance of Gd+ lesions.17
What is the Influence of Age on NfL?In healthy controls, sNfL levels do not vary signifi-
cantly by sex, but do increase with age by about 2.2% annually.18 Studies conducted in our lab show average CSF-NfL levels in healthy persons as shown in Table 2 (unpublished data). These values suggest neuronal degeneration is 5 times higher for persons over 59 years versus those under 30 years, based on CSF levels. In serum, the differential is lower. In our practice we do not factor in age with neurofilament samples from patients under age 60.
What Can We Learn From Timing of NfL Elevations?
NfL elevations in CSF and blood are unspecific and may occur in a wide range of neurologic disorders, including brain and spinal cord injuries. In MS, NfL elevations are mostly associated with inflammatory dis-ease activity. Confounding factors to NfL elevations in MS include age, head or spinal cord trauma, and other comorbidities (e.g., stroke, diabetes mellitus, other neu-rodegenerative diseases. Age dependence seems to be more important in CSF. We need to learn more about intra-individual day-to-day NfL fluctuations. Covariates in MS may include lesion volume on MRI, location of lesions, and whether there are cortical or spinal lesions.
Do Treatments Used in MS Have a Potential Neurotoxic Effect That May Be Reflected in NfL?
There is limited information on whether potentially toxic effects of MS treatments might lead to elevated NfL in either serum or CSF. The few studies avail-able suggest that use of high-dose vitamin D had no influence on sNfL levels.17, 19 Mesenchymal stem cell transplantation had no effect on sNfL.20 Autologous hematopoietic stem cell procedures using busulfan as a
can be informative as to the pattern of neuronal dam-age after trauma. A study in amateur boxers showed increased CSF-NfL 7 to 10 days after a bout, with nor-malization after 3 months.11 MRI was normal in these boxers, and NfL was shown to be much more sensitive than Tau protein and GFAP measures. Another study in soccer players revealed increased levels of serum NfL just 1 hour after a match involving 40 headers (directing the ball with one’s head) in 20 minutes.10
StrokeFollowing stroke, a steady increase in CSF-NfL and
sNfL is observed, peaking at 2 to 3 weeks.12 Three to 5 months later, there is still evidence of elevated NfL. A study of 136 patients (101 with acute ischemic stroke and 35 with transient ischemic attack) showed a cor-relation between NfL elevations and infarct size.13 A prospective study measuring sNfL in patients with stroke showed acute-phase sNfL levels to be at their highest concentrations 3 months post stroke. High sNfL cor-related with stroke severity and poor outcomes; both associations were strongest for sNfL at 3 months.14
Neural Damage Due to Neurosurgical TraumaIn a phase 1b study on intrathecal administion of
rituximab for PMS, an intraventricular catheter was inserted for drug delivery.15 CSF and serum samples were obtained from 12 patients before and after catheter insertion. One month after this limited neurosurgical trauma of essentially white matter, NfL peaked 5 fold in CSF and 3 fold in serum compared to baseline, and both returned to baseline levels within 6 months.15
Can NfL be Used to Monitor Individual Patients in MS?
Studies evaluating the potential of NfL to predict treatment response in patients with MS included an investigation of 15 patients with MS after immune reconstitution treatment with alemtuzumab.16 Monthly sNfL measurements correlated with EDSS, MRI, and relapse activity over a period of up to 102 months after initiation of treatment. sNfL levels were signifi-cantly increased before treatment with alemtuzumab but decreased quickly within the first 6 months. In patients classified as NEDA-3, sNfL declined and persisted at an individual low steady-state level of <8 pg/mL.16
Another recent study looked at sNfL levels before and after relapse or formation of Gd+ lesions.17 In the 3 months after appearance of a Gd+ lesion, the researchers observed an average 35% elevation in sNfL (P < 0.0001) compared to samples taken during remission. At the
Table 2. CSF-NfL levels by age in healthy individuals
Age (healthy subjects) CSF-NfL levels (ng/L)
< 30 < 38030 – 39 < 56040 – 59 < 890
> 59 < 1,850

International Journal of MS Care18
References 1. Malmeström C, Haghighi S, Rosengren L, Andersen O, Lycke J.
Neurofilament light protein and glial fibrillary acidic protein as biological markers in MS. Neurology. Dec 23 2003;61(12): 1720-1725.
2. Norgren N, Sundström P, Svenningsson A, Rosengren L, Stigbrand T, Gunnarsson M. Neurofilament and glial fibrillary acidic protein in multiple sclerosis. Neurology. Nov 9 2004;63(9):1586-1590.
3. Lycke JN, Karlsson JE, Andersen O, Rosengren LE. Neurofilament protein in cerebrospinal fluid: a potential marker of activity in multiple sclerosis. J Neurol Neurosurg Psychiatry. Mar 1998;64(3):402-404.
4. Modvig S, Degn M, Horwitz H, et al. Relationship between cerebrospinal fluid biomarkers for inflammation, demyelination and neurodegeneration in acute optic neuritis. PLoS One. 2013;8(10):e77163.
5. Romme Christensen J, Börnsen L, Khademi M, et al. CSF inflammation and axonal damage are increased and correlate in progressive multiple sclerosis. Mult Scler. Jun 2013;19(7):877-884.
6. Disanto G, Barro C, Benkert P, et al. Serum neurofilament light: A biomarker of neuronal damage in multiple sclerosis. Ann Neurol. Jun 2017;81(6):857-870.
7. Novakova L, Axelsson M, Malmeström C, et al. NFL and CXCL13 may reveal disease activity in clinically and radiologically stable MS. Mult Scler Relat Disord. Nov 2020;46:102463.
8. Khalil M, Teunissen CE, Otto M, et al. Neurofilaments as biomarkers in neurological disorders. Nat Rev Neurol. Oct 2018;14(10):577-589.
9. Olsson B, Portelius E, Cullen NC, et al. Association of cerebrospinal fluid neurofilament light protein levels with cognition in patients with dementia, motor neuron disease, and movement disorders. JAMA Neurol. Mar 1 2019;76(3):318-325.
10. Wallace C, Smirl JD, Zetterberg H, et al. Heading in soccer increases serum neurofilament light protein and SCAT3 symptom metrics. BMJ Open Sport Exerc Med. 2018;4(1):e000433.
11. Zetterberg H, Hietala MA, Jonsson M, et al. Neurochemical aftermath of amateur boxing. Arch Neurol. Sep 2006;63(9):1277-1280.
12. Pujol-Calderon F, Portelius E, Zetterberg H, Blennow K, Rosengren LE, Hoglund K. Neurofilament changes in serum and cerebrospinal fluid after acute ischemic stroke. Neurosci Lett. Apr 17 2019;698:58-63.
13. Onatsu J, Vanninen R, Jakala P, et al. Serum neurofilament light chain concentration correlates with infarct volume but not prognosis in acute ischemic stroke. J Stroke Cerebrovasc Dis. Aug 2019;28(8):2242-2249.
14. Pedersen A, Stanne TM, Nilsson S, et al. Circulating neurofilament light in ischemic stroke: temporal profile and outcome prediction. J Neurol. Nov 2019;266(11):2796-2806.
15. Bergman J, Dring A, Zetterberg H, et al. Neurofilament light in CSF and serum is a sensitive marker for axonal white matter injury in MS. Neurol Neuroimmunol Neuroinflamm. Oct 2016;3(5):e271.
16. Akgun K, Kretschmann N, Haase R, et al. Profiling individual clinical responses by high-frequency serum neurofilament assessment in MS. Neurol Neuroimmunol Neuroinflamm. May 2019;6(3):e555.
17. Rosso M, Gonzalez CT, Healy BC, et al. Temporal association of sNfL and gad-enhancing lesions in multiple sclerosis. Ann Clin Transl Neurol. Jun 2020;7(6):945-955.
18. Barro C, Benkert P, Disanto G, et al. Serum neurofilament as a predictor of disease worsening and brain and spinal cord atrophy in multiple sclerosis. Brain. Aug 1 2018;141(8):2382-2391.
19. Hänninen K, Jääskeläinen O, Herukka SK, Soilu-Hänninen M. Vitamin D supplementation and serum neurofilament light chain in interferon-beta-1b-treated MS patients. Brain Behav. Sep 2020;10(9):e01772.
20. Baldassari LE, Planchon SM, Bermel RA, et al. Serum neurofilament light chain concentration in a phase 1/2 trial of autologous mesenchymal stem cell transplantation. Mult Scler J Exp Transl Clin. Oct-Dec 2019;5(4):2055217319887198.
21. Thebault S, Lee H, Bose G, et al. Neurotoxicity after hematopoietic stem cell transplant in multiple sclerosis. Ann Clin Transl Neurol. May 2020;7(5):767-775.
conditioning agent resulted in NfL increases within 3 months post transplantation.21
Summary and ConclusionsRevisiting the questions posed in the beginning of the
paper, best practices based on current knowledge can be summarized as follows:During periods of perceived clinical quiescence, how often should re-baselining be done? How often when there is clinical activity or MRI activity?
• Following relapse: at 3- to 6-month follow-up• MRI with Gd+ lesion: at 3- to 6-month follow-up• MRI with new or enlarging T2 lesion: no new
baseline sampleHow often should re-sampling be done to evalu-ate the impact of a DMT in the absence of clinical or MRI change?
• 3-month intervalsHow often should re-sampling be done to take into account the impact of aging on NfL levels?
• CSF-NfL: 5- to 10-year intervals• Serum/plasma NfL: not before age 60?
Other than bone marrow transplant, are any other treatments known to have a paradoxical effect on NfL post treatment?
• Potentially, any treatment causing neurotoxicity o
PRACTICE POINTS• In healthy individuals and in people with MS, NfL
levels vary under a number of conditions.
• NfL levels are increased during all clinical courses of MS, but are highest in patients with active relapsing-remitting disease (RRMS). NfL levels are up to 10-fold higher during relapse versus remission.
• High NfL levels at disease onset correlate with faster disease progression (EDSS) in patients with active relapses and in clinically stable patients.
• NfL levels correlate well with CSF inflammatory biomarkers, including CHI3L1, CXCL13, and osteopontin.
• In real-world studies, even patients without ongoing disease activity had elevated NfL, but after 12 months of treatment with a second-line DMT 80% to 90% had decreased NfL levels. NfL appears to be considerably more sensitive to disease activity than are clinical and MRI measures.

International Journal of MS Care19
Confounders Affecting Interpretation of Neurofilament Biomarkers in MS
Michael Khalil, MD, PhDNeurology Biomarker Research Unit, Department of Neurology
Medical University of Graz, Austria
Neurofilament levels rise with neuroaxonal dam-age in both cerebrospinal fluid (CSF) and blood, indicating neuroaxonal injury that is
independent of causal pathways.1 Neurofilament light
chain (NfL) is a promising biomarker for assessing dis-
ease activity, monitoring treatment response, facilitating
treatment development, and determining prognosis in
multiple sclerosis (MS) and other neurologic condi-
tions.2 In order to understand the significance of changes
in NfL levels among individuals with MS and with MS
treatments, it is important to recognize what other fac-
tors influence NfL levels.
Key questions to be considered on NfL con-
founders include:
• How can we correct for the significant age-related
increase in NfL in healthy controls?
• Are body weight and blood volume relevant con-founders, and if so, should reference ranges reflect populations with higher body mass index (BMI)?
• How do comorbid neurologic conditions influ-ence measurement of NfL in MS?
Age-adjusted reference values and profound infor-mation on physiological levels of NfL will most likely be needed in order to assign meaning and changes in these levels.3, 4
Concentrations of NfL in people with neurologic diseases may overlap to a great degree with those of age-matched persons without disease, even when measured at high concentrations in CSF. This is especially true for NfL levels in the lower ranges, as shown in a meta-analysis involving pooled data from more than 10,000 individuals. The data sets included healthy controls and a population with 35 neurologic or inflammatory condi-tions (Figure 1).5
Figure 1. Neurofilament levels in neurologic diseasesData were collected for 10,059 individuals (mean age, 59.7 years; SD 18.8 years; 54.1% female). Thirty-five diagnoses were identified, including inflammatory diseases of the central nervous system (n = 2,795), dementias and predementia stages (n = 4,284), parkinsonian disorders (n = 984), and HC (n = 1,332). Source: Bridel C, et al. JAMA Neurol. 2019;76(9):1035-1048.

International Journal of MS Care20
NfL levels would represent a pathologic process, versus a change that is still within the range of normal. This question will require more experience with NfL and studies in larger cohorts.
If an absolute value is used for NfL, such as 10 pg/mL, then a higher proportion of people over age 60 will be above that number. This is why use of percentiles or Z-scores appears to correct for the wide variations seen in absolute NfL values. For example, for brain volume correlation, a cutoff level might be set at 80%, 90%, 97.5% or 99%. Patients with NfL levels above these per-centiles had markedly increased brain atrophy measures compared to those with lower levels.8
Sex- or Race-Related Variances in NfLThus far, studies looking at neurofilament levels have
not suggested a sex-related difference.2, 5, 9 The same is true of race and ethnicity, although further study is war-ranted on both of these questions.
Elevations of NfL in Other Neurologic Conditions
A wide range of neurologic conditions are associ-ated with an increase in NfL. A large body of evidence links increased NfL levels to dementia, stroke, traumatic brain injury (TBI), amyotrophic lateral sclerosis (ALS), and Parkinson’s disease (PD).2 Other diseases could be associated with elevated NfL, but they have not yet been systematically studied (Table 2).2
DementiasNeurofilament levels may be a useful biomarker
in predicting neurodegeneration and clinical progres-sion in Alzheimer’s disease (AD), even prior to symp-tom onset.10 A recent longitudinal study showed that
Influence of Age on NfLAge is a significant confounder affecting neurofila-
ment levels. NfL levels in CSF and serum are higher and show a broader distribution of values among persons age 60 and over, both in healthy controls and in people with neurologic conditions or injuries.6 This suggests an acceleration of neuronal injury with age. This could be driven by comorbid pathologies in older individuals that remain subclinical. In a study comparing NfL in people with and without human immunodeficiency virus (HIV), analysis of CSF-NfL in the healthy controls (n = 359) revealed a yearly NfL increase of 3.1%.7 Figure 2 shows the regression analysis from this healthy control group.7 Age-related upper normal cutoff levels for CSF were suggested from this analysis, as shown in Table 1.7
Close associations have been observed between serum NfL (sNfL) and age-related changes in brain volume.6 When we compared NfL with magnetic resonance imag-ing (MRI) measures in healthy individuals who had no neurologic impairments, we found that baseline sNfL and change in sNfL over 5 years correlated to change in brain volume. This correlation was strongly driven by the population over age 60.6 Defining cutoff levels by age might allow a determination of whether NfL levels are within normal range or could be pathologi-cal. However, we don’t know what degree of change in
Table 1. Age-related upper normal CSF-NfL
AgeCSF-NfL upper
reference values (ng/L)
20 38730 52540 71350 96760 131370 178180 2417
CSF-NfL = 210.22 x 1.031age
CSF, cerebrospinal fluid; NfL, neurofilament lightSource: Yilmaz A, et al. Neurofilament light chain protein as a marker of neuronal injury: review of its use in HIV-1 infection and reference values for HIV-negative controls. Expert Rev Mol Diagn. Aug 2017;17(8):761-770.
Figure 2. Cerebrospinal fluid NfL reference values in healthy controls, by ageSource: Yilmaz A, et al. Neurofilament light chain protein as a marker of neuronal injury: review of its use in HIV-1 infection and reference values for HIV-negative controls. Expert Rev Mol Diagn. Aug 2017;17(8):761-770.

International Journal of MS Care21
neurologic diseases and MND mimics with high sensi-tivity and specificity.13
Parkinson’s DiseaseRelatively few studies have assessed the role of NfL in
PD. A recent longitudinal study measured sNfL levels in subjects who converted from prodromal PD to manifest sporadic PD (converters), at-risk subjects, and matched controls.14 NfL levels were not increased at the pro-dromal stage, but those who converted to the manifest motor stage of PD had significant acceleration of age-dependent increases in NfL levels. However, there was some overlap observed in sNfL levels between those with PD and healthy controls.14
Subcortical InfarctionNfL might be a biomarker for cerebral small vessel
disease (CSVD). Our research group measured sNfL levels at baseline, 3 months, and 15 months in people who experienced small subcortical infarctions and found increased levels compared to healthy controls.15 These levels remained increased at the 3-month follow-up peri-od, but returned to normal 15 months after the stroke. NfL correlated with infarction size and severity of base-line white matter hyperintensities. NfL levels were espe-cially high in patients with new, clinically silent, CSVD-related lesions at follow-up. This suggests that NfL may serve as a valuable blood biomarker for active CSVD.15
CSF-NfL and sNfL levels are elevated in persons who carry mutations consistent with familial AD, even at the presymptomatic stages. Change in sNfL could be used to differentiate mutation carriers from non-muta-tion carriers almost a decade earlier (16.2 years before symptom onset) than the emergence of cross-sectional absolute NfL levels (6.8 years).10 Because NfL is also increased in other dementia types such as frontotempo-ral dementia, this biomarker is less useful in distinguish-ing between different dementia types. However, this goal might be accomplished using NfL in conjunction with other biomarkers such as plasma phosphorylated tau181 (phospho tau181).11
ALSNeurofilaments are present at higher levels in patients
with ALS relative to other neurologic conditions (Figure 3).12 Measures of NfL and phosphorylated heavy-chain neurofilament may be useful diagnostically to differenti-ate between early ALS and other neurologic diseases. A large multicenter European study measured serum and CSF levels of NfL and phosphorylated NfH in patients with early ALS, as well as patients with motor neuron disease (MND) and MND mimics.13 CSF and serum levels of both types of neurofilament were increased in early and later symptomatic phases of ALS (P < 0.0001) and could be used to discriminate patients with ALS with early symptom onset from those with other
Figure 3. NfL levels in neurologic diseasesCSF-NfL levels are higher in ALS relative to other neurologic diseases. AD, Alzheimer’s disease; DS, Down syndrome; ALS, amyotrophic lateral sclerosis; FTD, frontotemporal dementia; DLB, dementia with Lewy bodies; CBS, corticobasal syndrome; PSP, progressive supranuclear palsy. Source: Delaby C., et al. Differential levels of neurofilament light protein in cerebrospinal fluid in patients with a wide range of neurodegenerative disorders. Sci Rep. Jun 8 2020;10(1):9161.
Table 2. Diagnostic and prognostic value of neurofilaments in neurological disorders
Evidence supports NfL value in diagnosis, prognosis, and/or monitoring treatment response
NfL could be of relevance, but associations have not been established
Multiple sclerosis Epilepsy
Dementia Encephalitis
Stroke Meningitis
Traumatic brain injury Hypoxic brain injury
Amyotrophic lateral sclerosis Optic neuropathics
Parkinson’s disease Intracranial pressure
Huntington’s disease Neurotoxicity
Bipolar disorder (limited evidence for clinical utility)
Peripheral neuropathies (Guillain-Barré syndrome, chronic inflammatory demyelinating neuropathy, Charcot-Marie-Tooth disease)
Khalil M, et al. Neurofilaments as biomarkers in neurological disorders. Nat Rev Neurol. Oct 2018;14(10):577-589.

International Journal of MS Care22
seen for the CSF-NfL, but correlations between CSF and sNfL levels were improved when the investigators corrected for BV and BMI.4 Similarly, in a study of patients who had recovered from anorexia nervosa at least 1 year prior, plasma NfL was negatively associated with BMI, suggesting that anorexia nervosa is associated with neuronal damage, which partially normalizes with weight recovery.22
ChildbirthAn interesting study looked at the potential impact
of parturition on maternal cardiovascular and neuronal integrity.23 Samples taken before the mother gave birth and the first postpartum day showed increased levels of NfL in the serum postpartum, suggesting some effect on neuronal integrity related to childbirth. No correlations were found for the type of anesthesia used or method of birth. This study suggests a possible confounding factor in this population that warrants further investigation.23
General AnesthesiaAnother question is whether general anesthesia for
surgery may have an impact on NfL. A study of patients
Traumatic Brain InjuryTBI has demonstrated the significant detrimental
impact on neuronal tissues from certain contact sports such as boxing and hockey. Blood levels of NfL are elevated 7 to 10 days following a boxing match and decrease gradually over a 3-month rest period. However, even after recovery the NfL remains higher than that of controls (P < 0.0001).16 Boxers who received many (> 15) hits to the head during a bout or were groggy after a bout had higher concentrations of sNfL. Neurofilament levels could potentially be used to separate athletes with rapidly resolving post-concussion symptoms (PCS) from those with prolonged PCS.16, 17
Guillain-Barré SyndromeA study from Vienna looked at sNfL levels in patients
with Guillain-Barré syndrome and found increased levels compared to controls, correlating to a severity score, time of hospitalization, and the risk of admission to an intensive care unit.18 Although NfL is exclusive to neurons, it is not exclusive to the central nervous system (CNS). A study in Guillain-Barré syndrome concluded that in this disease, most of the NfL released into the peripheral blood came from the peripheral nervous sys-tem and not from the CNS.19
Other Potential Confounders Affecting NfLNeurotoxicity
CNS toxicity (e.g., due to chemotherapy) might affect NfL levels and could be an important confound-ing factor when applying this biomarker in MS and other diseases.20 Thebault and colleagues studied 22 patients with MS undergoing autologous hematopoietic stem cell transplantation (AHSCT) involving immu-noablation.21 Three months after AHSCT, levels of sNfL and serum glial fibrillary acidic protein (sGFAP) increased from baseline by 32.1% and 74.8%, respec-tively. sNfL increases correlated with total busulfan dose, EDSS worsening at 6 months, and MRI grey matter vol-ume. NfL levels returned to baseline, but these findings suggest that CNS toxicity immediately after AHSCT may be mediated by chemotherapy and contributes to transient increases in NfL levels and MRI atrophy.21
Body WeightDifferences in BMI or blood volume (BV) might
be reflected in NfL levels and affect its correlation to other biomarkers and disease outcomes. One study showed a significant negative correlation, with higher BMI and BV equating to lower sNfL. This was not
PRACTICE POINTS• A wide range of neurologic conditions are associated
with increased NfL, including dementia, stroke, traumatic brain injury, amyotrophic lateral sclerosis, and Parkinson’s disease.
• Concentrations of NfL in people with neurologic diseases may overlap to some degree with those of aged-matched persons without disease, even when measured at high concentrations in CSF. This is especially true when NfL values are in the lower ranges.
• Age is a significant confounder affecting neurofilament levels. sNfL levels increase with age by about 2.2% annually. Neuronal degeneration may be 5 times higher for persons over 59 years versus those under 30 years. Close associations have been observed between sNfL and age-related changes in brain volume.
• No links have been shown between NfL and sex, race, or ethnicity, although further studies are ongoing. Differences in body mass index or blood volume might be reflected in NfL levels and affect its correlation to other biomarkers and disease outcomes.
• CNS toxicity (e.g., due to chemotherapy) might affect NfL levels and could be an important confounding factor when applying this biomarker in MS and other diseases.

International Journal of MS Care23
infection and reference values for HIV-negative controls. Expert Rev Mol Diagn. Aug 2017;17(8):761-770.
8. Barro C, Benkert P, Disanto G, et al. Serum neurofilament as a predictor of disease worsening and brain and spinal cord atrophy in multiple sclerosis. Brain. Aug 1 2018;141(8):2382-2391.
9. Bjornevik K, Munger KL, Cortese M, et al. Serum neurofilament light chain levels in patients with presymptomatic multiple sclerosis. JAMA Neurol. Jan 1 2020;77(1):58-64.
10. Preische O, Schultz SA, Apel A, et al. Serum neurofilament dynamics predicts neurodegeneration and clinical progression in presymptomatic Alzheimer’s disease. Nat Med. Feb 2019;25(2):277-283.
11. Thijssen EH, La Joie R, Wolf A, et al. Diagnostic value of plasma phosphorylated tau181 in Alzheimer’s disease and frontotemporal lobar degeneration. Nat Med. Mar 2020;26(3):387-397.
12. Delaby C, Alcolea D, Carmona-Iragui M, et al. Differential levels of neurofilament Light protein in cerebrospinal fluid in patients with a wide range of neurodegenerative disorders. Sci Rep. Jun 8 2020;10(1):9161.
13. Feneberg E, Oeckl P, Steinacker P, et al. Multicenter evaluation of neurofilaments in early symptom onset amyotrophic lateral sclerosis. Neurology. Jan 2 2018;90(1):e22-e30.
14. Wilke C, Dos Santos MCT, Schulte C, et al. Intraindividual neurofilament dynamics in serum mark the conversion to sporadic parkinson’s disease. Mov Disord. Jul 2020;35(7):1233-1238.
15. Gattringer T, Pinter D, Enzinger C, et al. Serum neurofilament light is sensitive to active cerebral small vessel disease. Neurology. Nov 14 2017;89(20):2108-2114.
16. Shahim P, Zetterberg H, Tegner Y, Blennow K. Serum neurofilament light as a biomarker for mild traumatic brain injury in contact sports. Neurology. May 9 2017;88(19):1788-1794.
17. Shahim P, Politis A, van der Merwe A, et al. Neurofilament light as a biomarker in traumatic brain injury. Neurology. Aug 11 2020;95(6):e610-e622.
18. Altmann P, De Simoni D, Kaider A, et al. Increased serum neurofilament light chain concentration indicates poor outcome in Guillain-Barré syndrome. J Neuroinflammation. Mar 17 2020;17(1):86.
19. Körtvelyessy P, Kuhle J, Düzel E, et al. Ratio and index of neurofilament light chain indicate its origin in Guillain-Barré syndrome. Ann Clin Transl Neurol. Nov 2020;7(11):2213-2220.
20. Petzold A, Mondria T, Kuhle J, et al. Evidence for acute neurotoxicity after chemotherapy. Ann Neurol. Dec 2010;68(6):806-815.
21. Thebault S, Lee H, Bose G, et al. Neurotoxicity after hematopoietic stem cell transplant in multiple sclerosis. Ann Clin Transl Neurol. May 2020;7(5):767-775.
22. Nilsson IAK, Millischer V, Karrenbauer VD, et al. Plasma neurofilament light chain concentration is increased in anorexia nervosa. Transl Psychiatry. Aug 1 2019;9(1):180.
23. Evers KS, Huhn EA, Fouzas S, et al. Impact of parturition on maternal cardiovascular and neuronal integrity in a high risk cohort - a prospective cohort study. BMC Pregnancy Childbirth. Nov 5 2019;19(1):403.
24. Evered L, Silbert B, Scott DA, Zetterberg H, Blennow K. Association of changes in plasma neurofilament light and tau levels with anesthesia and surgery: results from the CAPACITY and ARCADIAN studies. JAMA Neurol. May 1 2018;75(5):542-547.
25. Benedict C, Blennow K, Zetterberg H, Cedernaes J. Effects of acute sleep loss on diurnal plasma dynamics of CNS health biomarkers in young men. Neurology. Mar 17 2020;94(11):e1181-e1189.
26. Røsjø E, Lindstrøm JC, Holmøy T, Myhr KM, Varhaug KN, Torkildsen Ø. Natural Variation of vitamin d and neurofilament light chain in relapsing-remitting multiple sclerosis. Front Neurol. 2020;11:329.
27. Krogh Nielsen M, Subhi Y, Rue Molbech C, Sellebjerg F, Sørensen TL. Serum neurofilament light chain in healthy elderly and in patients with age-related macular degeneration. Acta Ophthalmol. May 2020;98(3):e393-e394.
28. Benkert P, Schaedelin S, Maceski A, et al. Serum NfL z-scores derived from a large healthy control group reflect different levels of treatment effect in a real-world setting. MS Virtual 2020. P0160.
undergoing knee surgery clearly showed that NfL levels increased 6 hours after the surgery and continued to increase through a 48-hour time period. In contrast, tau levels increased transiently after 6 hours but declined more quickly.24
No Significant NfL Variations Seen in Sleep Loss, Vitamin D, Macular Degeneration
In a study of healthy male volunteers, NfL was found to be unchanged in subjects with acute sleep loss versus those without.25 Another study in people with MS com-pared NfL levels at different months of the year along with vitamin D levels, and showed that natural varia-tions in serum 25(OH)D values do not seem to be asso-ciated with alterations in serum NfL concentrations.26 In a study of macular degeneration, elevations in NfL were attributed to age and did not differ between persons with and without macular degeneration.27
ConclusionAge is the most significant confounding factor influ-
encing NfL as a biomarker in neurologic disease. To determine cutoff levels that correct for age, calculating Z-scores or using a percentile model appears to be the best approach, using a validated reference population. This work is ongoing; a study was recently completed in more than 10,000 NfL samples from a database of more than 5,000 persons from the general population without signs of CNS disease.28 A number of confounding fac-tors exist related to other diseases that occur comorbidly with MS. Gender and race or ethnicity do not seem to affect NfL, but BMI and BV do seem to be affected. This suggests that regional differences in the body weight of populations studied may lead to additional refinement when determining what cutoff levels could be considered an elevation of NfL. o
References 1. Khalil M, Salzer J. CSF neurofilament light: A universal risk biomarker
in multiple sclerosis? Neurology. Sep 13 2016;87(11):1068-1069. 2. Khalil M, Teunissen CE, Otto M, et al. Neurofilaments as biomarkers in
neurological disorders. Nat Rev Neurol. Oct 2018;14(10):577-589. 3. Akgun K, Kretschmann N, Haase R, et al. Profiling individual clinical
responses by high-frequency serum neurofilament assessment in MS. Neurol Neuroimmunol Neuroinflamm. May 2019;6(3):e555.
4. Manouchehrinia A, Piehl F, Hillert J, et al. Confounding effect of blood volume and body mass index on blood neurofilament light chain levels. Ann Clin Transl Neurol. Jan 2020;7(1):139-143.
5. Bridel C, van Wieringen WN, Zetterberg H, et al. Diagnostic value of cerebrospinal fluid neurofilament light protein in neurology: a systematic review and meta-analysis. JAMA Neurol. Jun 17 2019;76(9):1035-1048.
6. Khalil M, Pirpamer L, Hofer E, et al. Serum neurofilament light levels in normal aging and their association with morphologic brain changes. Nat Commun. Feb 10 2020;11(1):812.
7. Yilmaz A, Blennow K, Hagberg L, et al. Neurofilament light chain protein as a marker of neuronal injury: review of its use in HIV-1

International Journal of MS Care24
Significance of Dynamic Change in Neurofilament Levels in MS
David Leppert, MDUniversity Hospitals Basel
Research Center for Clinical Neuroimmunology and NeuroscienceBasel, Switzerland
For neurofilament light (NfL) to be a useful bio-marker of multiple sclerosis (MS) disease activity and treatment effect, it is essential to understand
what degree of change in NfL is meaningful. Key ques-tions to be addressed include:
• Are there differences depending on anatomical location of disease (e.g., brain, spinal cord, or optic nerve)?
• How much of NfL change is variability or “noise” in the assay, versus meaningful or disease-related change?
• Are there relevant enough controls to use as com-parators in order to judge change?
• What is the typical impact of relapse in MS?– Sustained Expanded Disability Status Scale
(EDSS) progression– Brain atrophy or other magnetic resonance imag-
ing (MRI) metrics
Interpreting Dynamic Change in NfL LevelsVariability in NfL levels across different neurode-
generative diseases contributes to the difficulty of inter-preting measurements on the individual level.1 While statistically significant changes in NfL can be meaningful on a group level, the large value spread makes it difficult to identify how important these changes may be on an individual level. A study by Piehl et al looked at correla-tions of cerebrospinal fluid NfL (CSF-NfL) with that of serum and plasma, as well as change in plasma levels when the patient was switched from an injectable MS
therapy to fingolimod.2 Mean NfL levels for controls and patients with MS are shown in Table 1.2
Change in NfL Levels on Treatment and Correlation to Other Markers in MS
In the above study, CSF/serum and plasma/serum levels were highly correlated (P < 0.0001), but the smaller degree of differential in serum measures between patients with MS and healthy controls illustrates the potential for overlap when evaluating serum NfL (sNfL). In patients starting fingolimod (n = 243), mean plasma NfL was reduced from baseline (20.4 pg/mL, standard deviation (SD) 10.7) at 12 months (13.5 pg/mL, SD 7.3) and remained stable at 24 months.2
A study based on data from the EXPAND study of siponimod correlated baseline serum NfL and brain atrophy in 1,452 patients with secondary-progressive MS (SPMS) and 378 with primary progressive MS (PPMS).3 In this analysis by Kuhle and colleagues, patients’ NfL levels were categorized as either low (< 30 pg/mL), medium (30–60 pg/mL), or high (> 60 pg/mL). Mean baseline NfL levels were higher for patients with SPMS (32.1 pg) versus those with PPMS (22.0 pg/mL). Gadolinium-enhancing (Gd+) lesion counts and T2 lesion volume at baseline correlated well with base-line NfL levels. Decrease in sNfL with siponimod treat-ment was more pronounced among patients who had relapses in the prior year. Patients with higher NfL levels had more brain atrophy at 12 and 24 months, with or without a prior relapse. NfL was able to predict brain volume loss in patients with and without prior relapses, suggesting that NfL may be a biomarker of neurodegen-erative changes.3
In the ASCEND study of natalizumab in progressive MS presented at ECTRIMS 2019 by Kapoor and col-leagues, patients with and without relapses were catego-rized by whether they had or did not have Gd+ lesions at
Table 1. CSF and serum NfL levels: comparison of MS and healthy controlsMean NfL Levels (standard deviation) CSF Serum
Controls 341 pg/mL (267) 8.2 (3.58)Patients with MS 1,475 (2,358) 17.0 (16.94)
Source: Piehl F, et al. Mult Scler. Jul 2018;24(8):1046-1054.

International Journal of MS Care25
elimination half-life time is still unknown, as no in vivo studies have yet been done. Available data suggest that NfL increases in the first 1 to 2 weeks after injury and may remain elevated for as much as 1 year after trauma (Figure 1), which reflects the “effective half-life time” or “fall rate,” which is distinct from the elimination half-life. The long effective half-life time observed is due to constant release of NfL from injured neurons, indicat-ing that the process of neuronal injury is long-lasting. Compared with other brain biomarkers such as S100B, neuron-specific enolase (NSE), GFAP, and ubiquitin carboxy-terminal hydrolase L1 (UCH-L1), NfL appears to have the longest half-life.7
Comparison of MRI and NfLTable 2 compares qualities of NfL with MRI as a
measure of dynamic change in MS. While MRI is a ret-rospective measure of atrophy or structural damage, NfL offers a real-time readout of what is happening in the CNS. Much of what we call progression in MS occurs in the brain, but about 25% of patients have inflammation occurring exclusively in the spinal cord.8 Across a num-ber of studies, we see that patients without Gd+ lesions (about 25% of patients with relapsing MS, 50% of SPMS, and 20% of PPMS) have high NfL levels. This indicates that NfL covers an aspect of the disease pathol-ogy that escapes routine MRI.Timing of Dynamic Change in NfL Levels Following Treatment
NfL f ind ing s f rom the FREEDOMS and TRANSFORMS studies of fingolimod have shown that change in serum NfL levels from baseline occurs about
baseline.4 Baseline sNfL concentrations were significant-ly associated with the number of Gd+ lesions, T2 lesion volume, other clinical measures, and brain atrophy over 96 weeks (P < 0.0001 for all). There was a small change from 17 pg/mL to 10 pg/mL in patients treated with natalizumab. This was less pronounced in patients who had no evidence of acute inflammatory activity, but the degree of dynamic change was determined to be clinical-ly meaningful.5 In this study, patients with no evidence of progression over time had lower NfL levels than those who experienced progressive events.Influence of Acute Brain Injury
Placement of an intraventricular catheter for intrathe-cal rituximab administration would be expected to cause minimal trauma to the central nervous system (CNS), yet a study has shown it can lead to sustained release of NfL.6 At 30 days post surgery, there was a distinct peak in CSF and serum NfL concentrations, which returned to baseline after 6 to 9 months. In contrast, other biomarkers such as S100 calcium binding protein B (S100B), glial fibrillary acidic protein (GFAP), and microtubule-associated protein tau did not show any significant changes. This suggests that NfL in both CSF and serum can be a sensitive marker for axonal white matter injury in MS.6
We used an animal model of traumatic brain injury called delayed-type hypersensitivity (DTH) to shed some light on what is happening behind the blood-brain barrier. We simulated Gd+ lesion activity starting on day 12 and peaking on day 18. After day 28 the acute inflammation ceased, but higher levels of NfL were sus-tained over 2 weeks, indicating that inflammatory and neuro-degenerative activity continued despite the absence of acute inflammation. Our hypothesis is that there is ongoing brain injury beyond what we think is a relapse or a traumatic injury, leading to increased levels of NfL. (Anthony D, Leppert D, Kuhle J, unpublished)NfL Half-Life
How long after NfL has been released into the blood and CSF does it remain in the system? From an analysis of current evidence on NfL, the
16
Thelin et al.Front in Neurology 2017
The big 'known-unknown': NfL half-life time
Figure 1. Prolonged elevation of NfL levels after trauma7
Source: Thelin EP, et al. Front Neurol. 2017;8:300.

International Journal of MS Care26
Simoa as a highly stable technique. NfL measurements in a given individual remain stable over time, as shown in Figure 2, with higher levels associated with advanced age. There is little intra-individual change over time, while inter-individual variation suggests pathologic activity.10 We believe that small changes in sNfL are meaningful on a group level, but feel more work is needed to define what is clinically meaningful on an individual level.
Do we have relevant control sNfL values to use as comparators, in order to judge clinical change? To determine how sNfL predicted disease outcomes in MS, we studied 2,183 serum samples as part of an ongoing cohort study from 259 patients with MS (189 relapsing and 70 progressive) and 259 healthy controls. Clinical assessment, serum sampling, and MRI were done annu-ally, and the median follow-up time was 6.5 years.11
• sNfL levels above the 90th percentile of values of healthy controls was an independent predictor of EDSS worsening in the subsequent year (P < 0.001).
• The probability of EDSS worsening gradually increased by higher sNfL percentile category. Gd+ and new/enlarging lesions were independently associated with increased sNfL.
• Higher sNfL percentile levels were associated with more pronounced future brain and cervical spinal volume loss.
3 to 6 months after treatment initiation, followed by a ceiling effect over the remaining 24-month period.3 Remaining elevations in NfL may reflect new degen-eration outside the reach of anti-inflammatory therapy. In a study of patients receiving alemtuzumab, sNfL levels decreased quickly within the first 6 months.9 In patients classified as having no evidence of disease activ-ity (NEDA) based on NEDA-3 criteria, sNfL decline persisted at an individual low steady-state level of < 8 pg/mL.9 When sNfL peaks occurred, these were directly associated with clinical or MRI disease activity. sNfL elevations even appeared to predict relapse activity for patients who reported suspicious symptoms. In relapse, sNfL levels began to increase about 5 months before, peaked at clinical onset, and recovered within 4 to 5 months. Higher sNfL levels were seen in patients with active disease who required retreatment with alemtu-zumab, compared with responder patients who did not require retreatment.9
NfL appears to be an appropriate method for comparing efficacy of drugs—such as oral versus injectable therapies—consistent with other clinical approaches. The degree of change can be considered statistically meaningful on a group level. The challenge remains how to transition these findings to treatment decision-making on an individual level.
Assay “Noise” Versus Clinically Meaningful Change
A question that has arisen with use of sNfL is how much “noise” or biological/analytical variability, may occur with the single-molecular array (Simoa) assay, possibly cloud-ing any meaningful clinical change. The evidence appears to support
Table 2. MS disease activity: MRI versus NfLMRI NfL
Relation to progression of MS
Brain atrophy Continuous axonal injury, predominantly in spinal cord
Time Retrospective (Gd+ > T2 > atrophy)
Real-time readout
Space Restricted mainly to brain imaging
Captures damage in entire CNS
23
NfL levels are very stable over time: biological and analytical aspects
Day 1Review of NfL assays
Ronald Booth
Little intra-individual change over time: little biological and analytical 'noise'
Small changes we observe are meaningful:on the group level
Inter- individual range is big: interpretation of individual levels as pathologic, 'meaningful' etc. is difficult.Several approaches under consideration
Figure 2. Stability of NfL over time in an individualKuhle lab. Unpublished data.

International Journal of MS Care27
may lead to decreased use of monitoring MRIs during the routine follow-up of patients with MS. o
References 1. Khalil M, Teunissen CE, Otto M, et al. Neurofilaments as biomarkers in
neurological disorders. Nat Rev Neurol. Oct 2018;14(10):577-589. 2. Piehl F, Kockum I, Khademi M, et al. Plasma neurofilament light
chain levels in patients with MS switching from injectable therapies to fingolimod. Mult Scler. Jul 2018;24(8):1046-1054.
3. Kuhle J, Kropshofer H, Haering DA, et al. Blood neurofilament light chain as a biomarker of MS disease activity and treatment response. Neurology. Mar 5 2019;92(10):e1007-e1015.
4. Kapoor R, Sellebjerg F, Hartung H-P, et al. Natalizumab reduced serum levels of neurofilament light chain in secondary progressive multiple sclerosis patients from the phase 3 ASCEND study. Presented at ECTRIMS 2019. Abstract P1740.
5. Kapoor R, Smith KE, Allegretta M, et al. Serum neurofilament light as a biomarker in progressive multiple sclerosis. Neurology. Sep 8 2020;95(10):436-444.
6. Bergman J, Dring A, Zetterberg H, et al. Neurofilament light in CSF and serum is a sensitive marker for axonal white matter injury in MS. Neurol Neuroimmunol Neuroinflamm. Oct 2016;3(5):e271.
7. Thelin EP, Zeiler FA, Ercole A, et al. Serial sampling of serum protein biomarkers for monitoring human traumatic brain injury dynamics: a systematic review. Front Neurol. 2017;8:300.
8. Ruggieri S, Logoteta A, Tinelli E, et al. Measuring disease activity in multiple sclerosis: the essential role of spinal cord MRI monitoring. ECTRIMS Online Library. 10/10/18;P621.
9. Akgun K, Kretschmann N, Haase R, et al. Profiling individual clinical responses by high-frequency serum neurofilament assessment in MS. Neurol Neuroimmunol Neuroinflamm. May 2019;6(3):e555.
10. Khalil M, Pirpamer L, Hofer E, et al. Serum neurofilament light levels in normal aging and their association with morphologic brain changes. Nat Commun. Feb 10 2020;11(1):812.
11. Barro C, Benkert P, Disanto G, et al. Serum neurofilament as a predictor of disease worsening and brain and spinal cord atrophy in multiple sclerosis. Brain. Aug 1 2018;141(8):2382-2391.
12. Lorscheider J, Benkert P, Yaldizli O, et al. Serum neurofilament light chain captures and predicts confirmed progression independent of relapses (PIRA) in multiple sclerosis. MS Virtual 2020, Sept 11-13, P0154.
• sNfL also correlated with concurrent and future clinical and MRI measures of disease activity and severity.
In the Swiss MS Cohort study, we showed how Z-scores can be used to reflect the deviation of a patient’s sNfL value from the mean value of same-age healthy controls. In a population of patients with MS exhibiting NEDA-3, or no evidence of disease activity, higher Z-scores predicted EDSS worsening or relapse in the following year.12 This has clinical value by suggesting that a patient with a very high Z score for sNfL warrants escalation of therapy.
ConclusionIn summary, changes are meaningful on the group
level. The sensitivity of NfL is sufficiently high to detect activity, such as smoldering lesions, even when no activ-ity is evident on conventional MRI. We do need more normative data. Relative to absolute values using pg/mL, percentiles or Z-scores may offer a more meaningful comparison, as the latter discern the signal due to patho-logical NfL increase from the physiological age-related increase, and hence allow valuating intraindividual-levels over time and inter-individual levels without age as a confounding factor. Over time, measurement of NfL
PRACTICE POINTS• The sensitivity of NFL is sufficiently high to detect
activity, such as smoldering lesions, even when no activity is evident on conventional MRI.
• Gadolinium enhancing (Gd+) lesion counts and T2 lesion volume at baseline correlate strongly with baseline NfL levels.
• NfL is able to predict brain volume loss in patients with or without prior relapses. This suggests that NfL may be a biomarker of neurodegenerative changes.
• More normative data are needed to determine the degree of change in NfL that is clinically meaningful in MS. Rather than absolute NfL measurements using pg/ mL, percentiles or Z-scores may offer a more meaningful comparison.
• The elimination half-life time of NfL is still unknown. Available data suggest that NfL increases in the first 1 to 2 weeks after acute brain injury and may remain elevated for as much as 1 year after trauma.
• While MRI is a retrospective measure of atrophy or structural damage, NfL offers a real-time readout of what is happening in the CNS. NfL appears to cover aspects of MS disease pathology that are not seen on standard MRI.

International Journal of MS Care28
Role of Neurofilament Light Chain in MS Clinical Trials and Clinical Practice
Jens Kuhle, MD, PhDMS Center and Research Center for Clinical Neuroimmunology and Neuroscience (RC2NB)
University Hospital Basel, Switzerland
Peter A. Calabresi, MDDivision of Neuroimmunology, Johns Hopkins Multiple Sclerosis Center, Baltimore, MD
In patients with multiple sclerosis (MS), serum neurofilament light chain (sNfL) is a biomarker of neuroaxonal loss that can be used as a measure of
1) acute disease activity; 2) therapeutic response and 3) to predict the course of disability progression.1, 2 Area under the curve (AUC) measures of sNfL can potentially serve as an outcome measure for screening effective neu-roprotective drugs for late-phase development. These advances in research suggest that peripheral blood NfL may prove to be as important a biomarker in neurology as C-reactive protein is in cardiology or rheumatology.3
NfL represents a “first in class” blood-based bio-marker in MS that measures current disease activity. The rationale for using sNfL as a biomarker in multiple sclerosis (MS) clinical practice is based on the following proven concepts:4
• NfL in cerebrospinal fluid (CSF), plasma, and serum are highly correlated;
• sNfL levels are increased in all stages of MS com-pared to controls. Baseline measurements of NfL are predictive of outcomes in MS;
• sNfL levels are consistently associated with clinical and magnetic resonance imaging (MRI) disease activity, including T2 lesion volume and gadolini-um-enhancing (Gd+) lesions;
• Change in sNfL is observed in response to MS disease-modifying therapy (DMT).
Clinical Trials of sNfLClinical trials using sNfL have greatly expanded
what can be learned about MS disease progression and treatment efficacy. sNfL remains highly stable in blood samples over many years and can be obtained more eas-ily and less invasively than CSF. In addition, serum and CSF samples drawn from patients with MS participat-ing in clinical trials of MS therapies are stored at −70°C and can later be analyzed for sNfL or CSF-NfL values.5 Research using serum rather than CSF paves the way for implementation of sNfL into the clinical care of MS.
Validation of Serum Neurofilament Light Chain as a Prognostic and Monitoring Biomarker in Multiple Sclerosis (NINDS 1U01NS111678) is an ongoing study
underway in conjunction with the National Institute of Neurological Disorders and Stroke (NINDS). This is a natural history cohort using the MS Paths database to examine the cross-sectional relationship of neurofilament with other aspects of MS, with 2 principal aims:
1) Assess the cross-sectional relationship of sNfL lev-els with demographics and comorbid conditions, MS clinical characteristics, disability status, and imaging measures;
2) Assess the relationship between baseline and/or serial sNfL levels with short-term and longer-term clinical and/or imaging outcomes in MS therapeu-tic efficacy: clinical outcomes, imaging outcomes and composite clinical and imaging outcomes,
The MS Paths MS population database is derived from 7 US cities and 3 European Union cities and is now up to 7,288 participants.6 This and other popula-tions in the analysis are outlined in Table 1. MS Paths will capture patient data from the electronic medical record, including real absence and switches in drugs—traditionally difficult data to capture due to delays in prior authorization and other factors. The group with NfL levels rising to about the 97.5th percentile will be compared with those patients who do not have high NfL levels.7 Preliminary data from the study, presented in April 2021, showed that factors associated with elevated sNfL levels included: progressive MS, non-White race, diabetes mellitus, smoking.
Compared with those who did not have elevated sNfL, patients with MS and elevated sNfL levels had poorer clinical outcomes in measures such as walking speed and manual dexterity, higher T2 lesion volume, and lower brain volume measures.7
Relevance of sNfL Z-Scores in Research and Clinical Practice
Ongoing studies can help clinicians better determine how changes in sNfL measurements over time predict outcomes in MS such as relapse, disease progression, and atrophy. To interpret sNfL in MS clinical practice, we need to correct for the effects of aging on neurofilament

International Journal of MS Care29
• T2 lesion volume. Higher T2 lesion volumes independently drive higher Z-scores.
• Suboptimal therapy. More effective treatments typically lead to lower sNfL Z-scores.9
Numerous studies have shown that sNfL is associated with clinical and MRI disease activity as well as treat-ment response.1, 2, 10, 11 Correlations between sNfL and conventional outcomes of MS treatment response have been confirmed in a series of retrospective phase 3 stud-ies (e.g., FREEDOMS, TRANSFORMS, ADVANCED, ASCEND, CARE-MS 1, EXPAND, INFORMS) and patient registries using plasma or serum.4
On the group level, the reduction in Z-scores for sNfL was more profound with the use of highly active monoclonal antibody (mAb) therapies, more moder-ate for oral therapies, and lowest for injectable DMTs.9 This is consistent with previous MS research findings and clinical experience. For patients on DMT, signifi-cant reductions in sNfL can be seen in the first 12 to 18 months. The change is seen more quickly with the use of an mAb, which may allow sNfL to reach close to normal levels.9
Use of sNfL as a Prognostic Indicator in MSIn addition to reflecting current neuroaxonal injury,
data show that NfL is actually a dynamic predictor of future outcomes in MS.
• Baseline sNfL predicts percentage of brain volume change over 2 and 5 years;2
• When patients in the FREEDOMS trial were clas-sified as having either high, medium, or low base-line NfL levels, more pronounced brain volume loss was seen in the high NFL group, with a clear treatment effect observed for fingolimod;4
levels. A population-based study of sNfL in healthy con-trols from baseline (n=335) and after a mean follow-up time of 5.9 years (n=103) has shown that sNfL levels increased at a rate of 2.2% per year, then accelerated beginning at age 60.8 Change in sNfL levels from base-line correlated with brain volume loss in healthy control subjects as they aged (Figure 1).8
One way to correct for age and similar to percentiles, is to use the Z-score calculation, which represents a mea-sure of degrees of deviation from mean levels in normal controls. In comparison to absolute sNfL levels (pg/mL), sNfL Z-scores do not increase with age in patients with MS. This was demonstrated in Z-scores from the Swiss MS Cohort.9 Our research group has generated a nor-mative database which now includes more than 10,000 sNfL samples from more than 5,000 healthy control subjects. These data have been submitted for publica-tion in the medical literature and will recommend a nor-mative database to calculate Z-scores for sNfL.9
Factors associated with elevated sNfL Z-scores (i.e., higher sNfL vs healthy con-trols of the same age) include:
• Shorter disease dura-tion. A higher propor-tion of pathological sNfL levels (high Z-scores) are seen in younger patients with MS (i.e., those with more active disease).
• Relapse. Recent relapse increases sNfL.
Figure 1. Serum neurofilament levels in healthy controls by ageReprinted with permission from: Khalil et al. Nature Communications, 2020.
Table 1. Research approach: serum neurofilament light chain as a prognostic and monitoring biomarker in multiple sclerosis
Source of patient data N
People with MS
MS PATHS 001, 002:7 U.S. cities, 3 E.U. cities
> 7,000 participants followed over 5 years
TREAT-MS Trial (PCORI):high-efficacy therapy vs first-line therapy
700 participants followed over 4 years
Healthy controls
MS PATHS 005 200, followed over 2 years
Johns Hopkins MS Center
200, followed over 5 years
CDC US population reference cohort
2,300

International Journal of MS Care30
of 6-month disability progression, compared with those with low levels at both time points (P = 0.0373).15
The Swiss MS Cohort looked at sNfL patterns in patients treated with fingolimod over a 3- to 24-month period.16 Having a high sNfL while on treatment was associated with 2 to 6 times higher relapse rates in the following 12 or 24 months, and 2 to 5 times more T2 white matter lesions. Additionally, this analysis showed an association between high serum NfL in treated patients and accelerated brain volume loss. Patients with sNfL levels above the 99th percentile had an additional 0.95% yearly brain volume loss compared with patients below the 99th percentile. These findings indicate that sNfL can be used to predict suboptimal response in patients on DMT.16
Can sNfL Predict Future Clinical Events in Patients with NEDA?
Another interesting question is, does the current sNfL value in patients with NEDA-3 (no evidence of disease activity) predict clinical events in the following year? This was explored in patients from the Swiss MS Cohort with relapsing MS, on DMT for at least 3 months, with MRIs done every 6 or 12 months. Outcomes were reported for 1,062 patients with 5,000 serum samples and 3,573 MRIs:16
• sNfL Z-score predicted relapse or EDSS worsen-ing in the following year
• sNfL Z-score predicted new/enlarging T2 in the following year
The discriminative capacity of sNfL for the degree of drug response could serve as an endpoint in phase 2 trials for specific features of disease progression or con-firmed disability progression in the absence of relapse. This represents an aspect of MS where currently no trial paradigm is established.
• In the EXPAND trial of siponimod in patients with SPMS, elevated NfL (≥ 30 pg/mL) increased the risk of disability progression by 32%. In the INFORMS trial of fingolimod in PPMS, elevated NfL (≥ 30 pg/mL) was associated with a 49% increase in risk of disability progression.12
• In the ADVANCE study, baseline sNfL was a predictor of brain atrophy at 4 years and develop-ment of new T2 lesions.13
At the recent virtual meeting of ECTRIMS in 2020, we presented data on sNfL as a predictor of confirmed EDSS progression independent of relapse activity (PIRA).14 We included patients of all MS sub-types enrolled in the Swiss MS Cohort who had at least three prospective follow-up visits and no relapses during the median follow-up period of 4.7 years. PIRA was defined as:
• EDSS increase of ≥ 1.5 steps from baseline EDSS of 0
• ≥ 1.0 step from baseline EDSS of 1.0 to 5.5• ≥ 0.5 steps from baseline EDSS > 5.5Of the 1,400 patients, 800 met study criteria and
4,000 serum samples were taken. sNfL levels were observed to increase with age (1.7% per year) and baseline EDSS (7.6% per step). PIRA occurred in 153 patients (19.0%). Those experiencing PIRA had 11.6% higher sNfL levels, compared with stable patients. sNfL levels were lower during mAb therapy (–10.8%) and oral DMT (–10.4%), compared with untreated time points.14
• In terms of predicting future disability progres-sion, the hazard of future PIRA increased by 23.5% for every 1 standard deviation from base-line sNfL Z-score (95% CI: 8.3–40.8%, P = 0.002). This finding was confirmed after adjust-ing for age, sex, EDSS score, and treatment at baseline.
• Patients with a baseline sNfL Z-score >2 had a 2.5-fold higher risk for future PIRA compared to patients with a sNfL Z-score ≤2 (95% CI 1.7-3.9, P < 0.001 (Figure 2).14
Blood NfL as a Measure of Suboptimal Treatment Response
A few studies have shown that measuring sNfL in a patient receiving DMT can identify those likely to have breakthrough disease activity or progression despite therapy. In LONGTERMS, a 14-year open-label exten-sion of the FREEDOMS trial of fingolimod, high NfL levels at month 6 and month 12 predicted future risk of confirmed disability progression. Patients with high NfL at both 6 and 12 months had a 2-fold higher risk
Figure 2. sNfL scores predict patients with disability progression in the absence of relapse

International Journal of MS Care31
tor MS in a routine diagnostic setting can only be valid when these confounding factors are well con-trolled, and when levels are interpreted in relation to age-matched physiological values.
4. An effort to establish a large normative database of age-related reference values in normal controls is ongoing,7, 9 specifically also in the typical age range of progressive MS, is prerequisite to establish sNfL as a standard biomarker of MS in clinical practice.
5. Commutability of values across the different assay protocols and platforms needs to be established in order to be on common ground with what can be considered normal versus pathologic levels of sNfL. o
References 1. Disanto G, Barro C, Benkert P, et al. Serum neurofilament light: A
biomarker of neuronal damage in multiple sclerosis. Ann Neurol. Jun 2017;81(6):857-870.
2. Barro C, Benkert P, Disanto G, et al. Serum neurofilament as a predictor of disease worsening and brain and spinal cord atrophy in multiple sclerosis. Brain. Aug 1 2018;141(8):2382-2391.
3. Pencina MJ, D’Agostino RB Sr., D’Agostino RB, Jr., Vasan RS. Evaluating the added predictive ability of a new marker: from area under the ROC curve to reclassification and beyond. Stat Med. Jan 30 2008;27(2):157-172; discussion 207-112.
4. Kuhle J, Kropshofer H, Haering DA, et al. Blood neurofilament light chain as a biomarker of MS disease activity and treatment response. Neurology. Mar 5 2019;92(10):e1007-e1015.
5. Kuhle J, Plavina T, Barro C, et al. Neurofilament light levels are associated with long-term outcomes in multiple sclerosis. Mult Scler. Nov 2020;26(13):1691-1699.
6. Mowry EM, Bermel RA, Williams JR, et al. Harnessing real-world data to inform decision-making: Multiple Sclerosis Partners Advancing Technology and Health Solutions (MS PATHS). Front Neurol. 2020;11:632.
7. Sotirchos E, Fitzgerald K, Smith M, et al. Associations of serum neurofilament light chain with clinico-radiological characteristics in the MSPATHS Network: A cross-sectional evaluation. Presented at: 2021 American Academy of Neurology Virtual Annual Meeting. April 20 2021.
8. Khalil M, Pirpamer L, Hofer E, et al. Serum neurofilament light levels in normal aging and their association with morphologic brain changes. Nat Commun. Feb 10 2020;11(1):812.
9. Benkert P, Schaedelin S, Maceski A, et al. Serum NfL z-scores derived from a large healthy control group reflect different levels of treatment effect in a real-world setting. MS Virtual 2020. P0160.
10. Novakova L, Axelsson M, Khademi M, et al. Cerebrospinal fluid biomarkers as a measure of disease activity and treatment efficacy in relapsing-remitting multiple sclerosis. J Neurochem. Apr 2017;141(2):296-304.
11. Piehl F, Kockum I, Khademi M, et al. Plasma neurofilament light chain levels in patients with MS switching from injectable therapies to fingolimod. Mult Scler. Jul 2018;24(8):1046-1054.
12. Kuhle J, Kropshofer H, Barro C, et al. Siponimod reduces neurofilament light chain blood levels in secondary progressive multiple sclerosis patients (S8.006). Neurology. 2018;90(suppl 15):S8.006.
13. Calabresi PA, Arnold DL, Sangurdekar D, et al. Temporal profile of serum neurofilament light in multiple sclerosis: Implications for patient monitoring. Mult Scler. 2020 Dec 14:1352458520972573. Epub ahead of print. PMID: 33307998.
14. Lorscheider J, Benkert P, Yaldizli O, et al. Serum neurofilament light chain captures and predicts confirmed progression independent of relapses (PIRA) in multiple sclerosis. MS Virtual 2020, Sept 11-13, P0154.
15. Kuhle J, Danner S, Meinert R, et al. Elevated levels of plasma neurofilament light at months 6 and 12 after fingolimod treatment initiation predict disability worsening in patients with relapsing-remitting multiple sclerosis. Presented at: ECTRIMS 2019, Stockholm, Sweden: Abstract P1605.
16. Yaldizli Ö, Barro C, Michalak M, et al. Value of serum neurofilament light chain levels as a biomarker of suboptimal treatment response in MS clinical practice. Mult Scler. 2018; 24(Suppl. 2):97–98.
ConclusionsNfL levels in individual patients with MS correlate
with symptoms of activation of disease. This has been demonstrated even when routine clinical and MRI assessments have shown false negative results. Thus the use of NfL may have immediate consequences for initia-tion or escalation of DMT.
The algorithm on page 6 suggests how, using the current state of knowledge, NfL can be used for thera-peutic decision-making in MS clinical practice. A newly diagnosed patient with clinically active or highly active MS on MRI can be placed on a high-efficacy disease-modifying therapy (DMT), as shown in the top row of the algorithm. In a clinically stable patient for whom active disease is not observed on the MRI, the presence of high NfL levels would help to inform the decision for escalation to a high-efficacy DMT.
Some caveats to consider:1. sNfL shows strong age dependency with increase
in older adults. However, physiological levels in children—specifically early childhood—are not well defined.
2. Medical comorbidities (e.g., increased body weight) or neurological comorbid diseases (e.g., Alzheimer’s disease) correlate with an increase of sNfL.
3. While there is clear distinction of sNfL levels between MS and controls, and between different stages of MS on the group level, the range of levels among individual patients shows relevant overlap.1 Interpretation of individual sNfL values to moni-
PRACTICE POINTS• Data from more than 1,600 patients across 5 Phase
3 studies demonstrate the feasibility of establishing clinically relevant sNfL levels for disease severity stratification and treatment monitoring in relapsing-remitting MS.
• sNfL levels >16 pg/mL (using Simoa NF-light Advan-tage Kit) predict a high probability of disease activity and worse short- and long-term outcome (clinical, MRI, and OCT) but are confounded by the known strong age effect on sNfL.
• sNfL levels are lowered with the efficient use of DMT.• Elevated sNfL was associated with poorer neuro-
logic function including slower walking speed and manual dexterity, poorer cognitive performance, and increased self-reported disability.
• In order to implement sNfL into MS clinical practice, we need to have a standardized, widely accessible assay; generate comprehensive normative data; and validate sNfL in prospective real-world cohorts.

International Journal of MS Care32
1. Which of the following best describes the significance of neurofilament markers in the diagnosis of multiple sclerosis (MS)?A. Neurofilament light (NfL) is an important marker for initial
MS diagnosis but the significance of medium- and heavy-chain neurofilaments in MS diagnosis is unknown.
B. NfL may be useful in distinguishing progressive MS from relapsing MS in the early diagnostic stages.
C. Neurofilament levels in cerebrospinal fluid (CSF) have diagnostic value in MS; the diagnostic value of NfL in serum is unknown.
D. Because neurofilaments are elevated in a range of neurologic conditions, they have limited diagnostic value in MS.
2. To evaluate a patient’s blood NfL levels, the appropriate assay would be:A. Single-molecule array (Simoa)B. High-sensitivity ELISAC. Complete blood count with differentialD. These tests are not yet available outside of research studies
3. The recommended sequence for evaluation of CSF and serum NfL in patients with MS is:A. CSF is not recommended because of the invasiveness of
lumbar puncture; use serum at baseline and for follow-up.B. Serum NfL is less reliable than CSF so MS patient follow-up
should be based on CSF levels.C. Evaluate baseline CSF level with initial (diagnostic) lumbar
puncture; obtain baseline blood NfL at start of treatment and at follow-up unless a repeat lumbar puncture is indicated.
D. Evaluate baseline CSF and serum NfL and then re-check levels if patients have clinical or MRI activity.
4. To account for normal age-related changes in NfL, the panel recommends:A. Re-baseline CSF levels every 1 to 2 years to account for
impact of age.B. After baseline, CSF re-sampling may be done every 5 to 10
years to account for impact of age.C. Re-baseline serum or plasma NfL level at around age 60D. Both B and C above
5. Which of the following statements is most accurate regarding the prognostic value of NfL in MS?A. Higher serum NfL (sNfL) levels predict risk of developing
gadolinium-enhancing lesions and new T2 lesions in the coming year.
B. NfL levels correlate with short-term outcomes (<2 years) but not with longer-term outcomes (> 5 years).
C. sNfL levels correlate well with T2 lesion burden but not with brain atrophy measures.
D. Correlation of NfL levels with clinical milestones such as time to EDSS 6.0 is unclear based on available data.
6. Which of the following is TRUE when comparing NfL as a biomarker of MS with MRI and other imaging studies:A. NfL is an excellent marker of acute inflammation but does
not predict subclinical disease activity to the extent that advanced grey matter imaging can.
B. Compared to MRI, NfL is a real-time marker of disease activity with greater tissue specificity.
C. NfL is capable of capturing brain atrophy and other changes but does not capture spinal pathology.
D. NfL can replace optical coherence tomography (OCT) since both offer the same types of information.
7. In addition to age, the most important confounding factors that may affect NfL levels are:A. Cardiovascular disease, including hypertension and
dyslipidemiaB. Body weight and diabetesC. Racial differences that may influence MS prognosisD. Kidney dysfunction that slows clearance of NfL fragments
from the blood8. A patient with MS is on a standard disease-modifying
therapy and appears to be stable clinically. A recent Simoa assay shows a significant rise in serum NfL compared with 6 months ago. What do the available data suggest about this patient’s prognosis?A. Because the patient is clinically stable, the elevation in NfL is
most likely related to a minor, transient condition.B. The elevated NfL level is a definite indicator that the DMT
is not working; the therapy should be escalated to a high-efficacy agent.
C. Elevated NfL in a clinically stable patient is likely an indicator of subclinical disease activity and should be evaluated along with other findings to consider a switch in therapy.
D. The patient should be monitored again in 6 months with MRI and repeat sNfL.
CMSC Consensus Statement on Neurofilament Biomarkers in MS
To receive credit, please read the program in its entirety, answer the following post-test questions, and complete the program evaluation. A certificate will be awarded for 5 correct answers or better. A certificate will be emailed (or mailed) to you within 2 weeks. There is no charge for CE credit.
Via the Web: To view this activity and receive CE credit online, please visit https://www.highmarksce.com/mscare/.Create a new account, or log in with your user name and password.*
Select the Enduring Materials tab; then select this activity from the listing and follow the instructions to complete the activity and receive credit.
*If you forgot your username or password, your username and a link to reset your password will be emailed to you.
By Mail: CMSC • Attn: CE Dept. • 3 University Plaza Drive, Suite 116 • Hackensack, NJ 07601
By Fax: 862-772-7275
PLEASE SELECT THE BEST ANSWER
Post-test

International Journal of MS Care33
Evaluation FormCMSC Consensus Statement on
Neurofilament Biomarkers in MSPlease answer the following questions by circling the appropriate rating:
5 = Outstanding 4 = Good 3 = Satisfactory 2 = Fair 1 = Poor
Extent to Which Program Activities Met the Identified Objectives: After completing this activity, participants should be better able to:
1) Review techniques used to measure neurofilament biomarkers in serum and cerebrospinal fluid of patients with multiple sclerosis (MS) 5 4 3 2 12) Define NfL values and timing of NfL measurements and their clinical relevance in MS .............................................................................. 5 4 3 2 13) Discuss the influence of comorbid medical conditions on NfL outcomes ................................................................................................... 5 4 3 2 14) Outline available strategies for applying NfL as a biomarker to aid in the clinical management of MS ...................................................... 5 4 3 2 1
To what extent was the content:
5) Well-organized and clearly presented ........................................................................................................................................................... 5 4 3 2 16) Current and relevant to your area of professional interest ............................................................................................................................ 5 4 3 2 17) Free of commercial bias ............................................................................................................................................................................... 5 4 3 2 18) Clear in providing disclosure information ................................................................................................................................................... 5 4 3 2 1
General Comments
9) As a result of this continuing education activity (check only one):
r I will modify my practice. (If you checked this box, how do you plan to modify your practice?) _________________________________
__________________________________________________________________________________________________________
r I will wait for more information before modifying my practice.r The program reinforces my current practice.r No, I will not modify my practice.
Please indicate any barriers you perceive in implementing these changes:r Cost r Cultural or language barriersr Lack of time to assess/counsel patients r Reimbursement/insurance issuesr Lack of administrative support r Concerns about patient safety/well being
10) This activity will assist in the improvement of my (check all that apply): r Competence r Performance r Patient outcomes
Suggestions for future topics/additional comments: _____________________________________________________________________
____________________________________________________________________________________________________________
Follow-Up
As part of our continuous quality-improvement effort, we conduct postactivity follow-up surveys to assess the impact of our educational interven-tions on professional practice. Please check one:
r Yes, I would be interested in participating in a follow-up survey.r No, I would not be interested in participating in a follow-up survey.
There is no fee for this educational activity.
Post-test Answer Key1 2 3 4 5 6 7 8
Request for Credit (Please print clearly)
Name _________________________________________________________________ Degree ____________________________________
Organization __________________________________________________________ Specialty ____________________________________
Address ____________________________________________________________________________________________________________
City _____________________________________________________________________________ State ____________ ZIP _____________
Phone ___________________________________________________________________________ Fax ________ E-mail _____________
Signature ________________________________________________________________ Date __________________________________

ijmsc.org