Embed Size (px)
Citation preview

Cluster Analysis

Cluster Analysis
What is Cluster Analysis? Types of Data in Cluster Analysis A Categorization of Major Clustering Methods Partitioning Methods Hierarchical Methods Density-Based Methods Grid-Based Methods Model-Based Clustering Methods Outlier Analysis Summary

CURE (Clustering Using REpresentatives )
CURE: proposed by Guha, Rastogi & Shim, 1998 Stops the creation of a cluster hierarchy if a level
consists of k clusters
Uses multiple representative points to evaluate the distance between clusters, adjusts well to arbitrary shaped clusters and avoids single-link effect
data to be clustered clusters generated by conventional methods (e.g., k-means, BIRCH)

Drawbacks of Distance-Based Method
Drawbacks of single representative methods (b) Consider only one point as representative of a cluster Good only for convex shaped, similar size and density, and if k can be
reasonably estimated
Drawbacks of density-based methods (c) Can merge clusters which are connected by a very narrow dense link
data to be clustered

Cure: The Algorithm
Draw random sample s.
Partition sample to p partitions with size s/p
Partially cluster partitions into s/pq clusters
Eliminate outliers
By random sampling
If a cluster grows too slow, eliminate it.
Cluster partial clusters.
Label data in disk
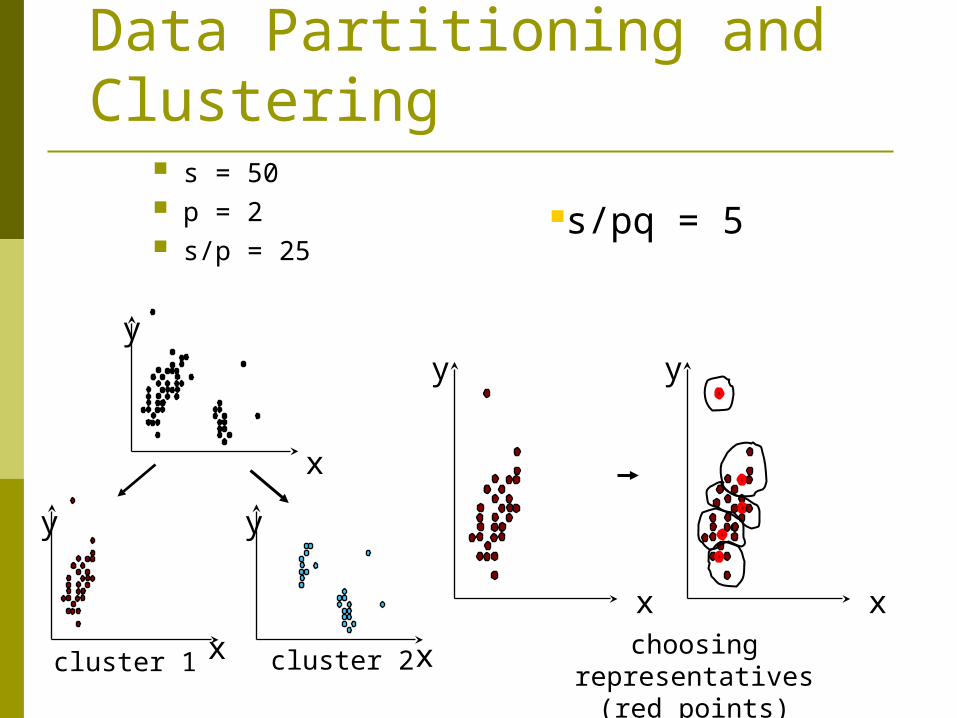
Data Partitioning and Clustering
s = 50 p = 2 s/p = 25
xx
x
y
y y
y
x
y
x
s/pq = 5
cluster 1 cluster 2choosing representatives
(red points)

Cure: Shrinking Representative Points
Shrink the multiple representative points towards the gravity center by a fraction of .
Multiple representatives capture the shape of the cluster
x
y
x
y

Clustering Categorical Data: ROCK ROCK: Robust Clustering using linKs,
by S. Guha, R. Rastogi, K. Shim (ICDE’99). Use links to measure similarity/proximity Not distance based
Basic ideas: Similarity function (Jaccard coefficient) Two points are neighbors if their similarity is at least θ. Let
T1 = {1,2,3}, T2={3,4,5}
Let θ=0.5. T1 and T2 are not neighbors. However T1 = {1,2,3}, T3={2,3,4} are neighbors (why?)
Sim T TT T
T T( , )1 2
1 2
1 2
Sim T T( , ){ }
{ , , , , }.1 2
3
1 2 3 4 5
1
50 2
Cluster Analysis
What is Cluster Analysis? Types of Data in Cluster Analysis A Categorization of Major Clustering Methods Partitioning Methods Hierarchical Methods Density-Based Methods Grid-Based Methods Model-Based Clustering Methods Outlier Analysis Summary

Density-Based Clustering Methods
Clustering based on density (local cluster criterion), such as density-connected points
Major features: Discover clusters of arbitrary shape Handle noise One scan Need density parameters as termination condition
Several interesting studies: DBSCAN: Ester, et al. (KDD’96) OPTICS: Ankerst, et al (SIGMOD’99). DENCLUE: Hinneburg & D. Keim (KDD’98) CLIQUE: Agrawal, et al. (SIGMOD’98)
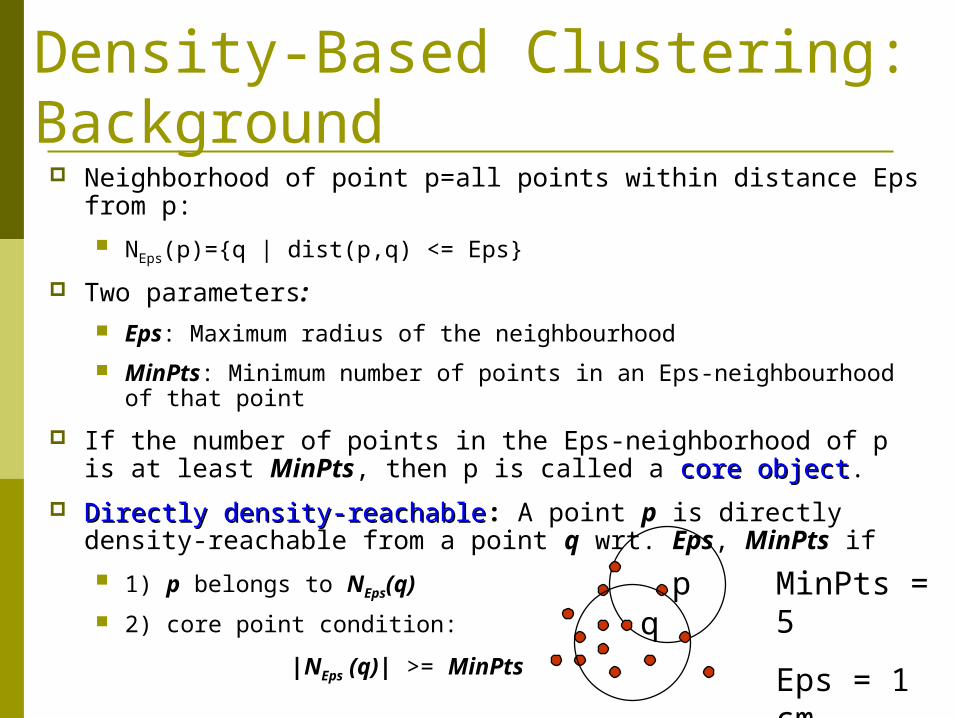
Density-Based Clustering: Background
Neighborhood of point p=all points within distance Eps from p: NEps(p)={q | dist(p,q) <= Eps}
Two parameters: Eps: Maximum radius of the neighbourhood
MinPts: Minimum number of points in an Eps-neighbourhood of that point
If the number of points in the Eps-neighborhood of p is at least MinPts, then p is called a core objectcore object.
Directly density-reachableDirectly density-reachable: A point p is directly density-reachable from a point q wrt. Eps, MinPts if 1) p belongs to NEps(q)
2) core point condition:
|NEps (q)| >= MinPts
pq
MinPts = 5
Eps = 1 cm

Density-Based Clustering: Background (II)
Density-reachableDensity-reachable: A point p is density-reachable from
a point q wrt. Eps, MinPts if there is a chain of points p1, …, pn, p1 = q, pn = p such that pi+1 is directly density-reachable from pi
Density-connectedDensity-connected A point p is density-connected to a
point q wrt. Eps, MinPts if there is a point o such that both, p and q are density-reachable from o wrt. Eps and MinPts.
p
qp1
p q
o

DBSCAN: Density Based Spatial Clustering of Applications with Noise Relies on a density-based notion of cluster: A
cluster is defined as a maximal set of density-connected points
Discovers clusters of arbitrary shape in spatial databases with noise
Core
Border
Outlier
Eps = 1cm
MinPts = 5
DBSCAN: The Algorithm
Arbitrary select a point p
Retrieve all points density-reachable from p wrt Eps and MinPts.
If p is a core point, a cluster is formed.
If p is a border point, no points are density-reachable from p and DBSCAN visits the next point of the database.
Continue the process until all of the points have been processed.

Cluster Analysis
What is Cluster Analysis? Types of Data in Cluster Analysis A Categorization of Major Clustering Methods Partitioning Methods Hierarchical Methods Density-Based Methods Grid-Based Methods Model-Based Clustering Methods Outlier Analysis Summary

Grid-Based Clustering Method
Using multi-resolution grid data structure
Several interesting methods STING (a STatistical INformation Grid approach) by
Wang, Yang and Muntz (1997)
WaveCluster by Sheikholeslami, Chatterjee, and Zhang (VLDB’98)
A multi-resolution clustering approach using wavelet method
CLIQUE: Agrawal, et al. (SIGMOD’98)

CLIQUE (Clustering In QUEst)
Agrawal, Gehrke, Gunopulos, Raghavan (SIGMOD’98).
Automatically identifying subspaces of a high dimensional data space that allow better clustering than original space
CLIQUE can be considered as both density-based and grid-based It partitions each dimension into the same number of equal
length interval It partitions an m-dimensional data space into non-
overlapping rectangular units A unit is dense if the fraction of total data points contained
in the unit exceeds the input model parameter A cluster is a maximal set of connected dense units within a
subspace

CLIQUE: The Major Steps Partition the data space and find the number of
points that lie inside each cell of the partition. Identify the subspaces that contain clusters using
the Apriori principle Identify clusters:
Determine dense units in all subspaces of interests Determine connected dense units in all subspaces of
interests.
Generate minimal description for the clusters Determine maximal regions that cover a cluster of
connected dense units for each cluster Determination of minimal cover for each cluster
CLIQUE can find projected clusters in subspaces of the dimensional space

Sala
ry
(10,
000)
20 30 40 50 60age
54
31
26
70
20 30 40 50 60age
54
31
26
70
Vac
atio
n(w
eek)
age
Vac
atio
n
Salary 30 50
= 3
projected cluster in (salary, age) subspace
projected cluster in (vacation, age) subspace

Strength and Weakness of CLIQUE
Strength It automatically finds subspaces of the highest
dimensionality such that high density clusters exist in those subspaces
It is insensitive to the order of records in input and does not presume some canonical data distribution
It scales linearly with the size of input and has good scalability as the number of dimensions in the data increases
Weakness The accuracy of the clustering result may be degraded
at the expense of simplicity of the method

Cluster Analysis
What is Cluster Analysis? Types of Data in Cluster Analysis A Categorization of Major Clustering Methods Partitioning Methods Hierarchical Methods Density-Based Methods Grid-Based Methods Model-Based Clustering Methods Outlier Analysis Summary

Model based clustering Assume data generated from K probability
distributions Typically Gaussian distribution Soft or
probabilistic version of K-means clustering Need to find distribution parameters. EM Algorithm

EM Algorithm
Initialize K cluster centers Iterate between two steps
Expectation step: assign points to clusters
Maximation step: estimate model parameters
j
jijkikki cdwcdwcdP ) |Pr() |Pr() (
m
ik
ji
kiik cdP
cdPd
m 1 ) (
) (1
N
cdw i
ki
k
) Pr(

Cluster Analysis
What is Cluster Analysis? Types of Data in Cluster Analysis A Categorization of Major Clustering Methods Partitioning Methods Hierarchical Methods Density-Based Methods Grid-Based Methods Model-Based Clustering Methods Outlier Analysis Summary

What Is Outlier Discovery? What are outliers?
The set of objects are considerably dissimilar from the remainder of the data (exceptions or noise)
Problem Find top n outlier points
Applications: Credit card fraud detection Telecom fraud detection Customer segmentation Medical analysis

Outlier Discovery: Statistical Approaches
Assume a model underlying distribution that generates data set (e.g. normal distribution)
Use discordancy tests depending on data distribution distribution parameter (e.g., mean, variance) number of expected outliers
Drawbacks most tests are for single attribute (not applicable for
multidimensional data) In many cases, data distribution may not be known

Outlier Discovery: Distance-Based Approach
Introduced to counter the main limitations imposed by statistical methods We need multi-dimensional analysis without knowing
data distribution. Distance-based outlier: A DB(p, D)-outlier is an
object O in a dataset T such that at least a fraction p of the objects in T lies at a distance greater than D from O
Algorithms for mining distance-based outliers Index-based algorithm Nested-loop algorithm Cell-based algorithm