Embed Size (px)
Citation preview

CLUSTER ANALYSIS

What is cluster analysis?
Cluster analysis is a group of multivariate techniques whose primary purpose is to group objects (e.g., respondents, products, or other entities) based on the characteristics they possess.
It attempts to maximize the homogeneity of objects within the clusters while also maximize the heterogeneity between clusters.

Examples of Clustering Applications
Marketing: Help marketers discover distinct groups in their
customer bases, and then use this knowledge to develop targeted
marketing programs
Land use: Identification of areas of similar land use in an earth
observation database
Insurance: Identifying groups of motor insurance policy holders
with a high average claim cost

City-planning: Identifying groups of houses according to
their house type, value, and geographical location.
Earth-quake studies: Observed earth quake epicenters
should be clustered along continent faults.

Quality: What Is Good Clustering?
A good clustering method will produce high quality clusters
with
high intra-class similarity
low inter-class similarity
The quality of a clustering result depends on both the
similarity measure used by the method and its
implementation
The quality of a clustering method is also measured by its
ability to discover some or all of the hidden patterns
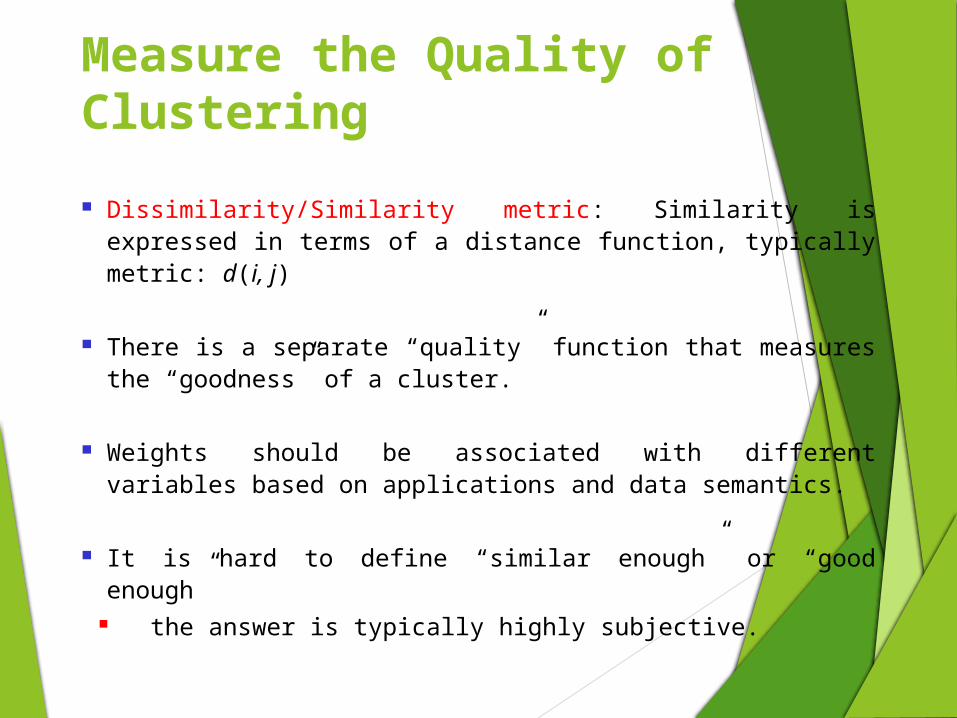
Measure the Quality of Clustering
Dissimilarity/Similarity metric: Similarity is expressed in terms of a distance function, typically metric: d(i, j)
There is a separate “quality” function that measures the “goodness” of a cluster.
Weights should be associated with different variables based on applications and data semantics.
It is hard to define “similar enough” or “good enough” the answer is typically highly subjective.

Steps in cluster analysis
Formulating the problem
Select a similarity measure
Select a clustering procedure
Decide on the number of clusters
Interpret and profile clusters
Access the validity of clustering

Formulating the problem
Select the variables in which clustering is based.
The variables selected must be relevant to marketing research problem.
In exploratory research, researcher should exercise judgment and intuition.

Select a similarity measure
The objective of clustering is to group similar objects together. Some measure is needed to assess how similar or different the objects are.
◦ Distance Measures.Most often used as a measure of similarity, with higher values representing greater dissimilarity (distance between cases), not similarity.

Distance Measures
Euclidean distance The most commonly recognized to as straight- line distance.
Squared Euclidean distance. The sum of the
squared differences without taking the square root.
City- block (Manhattan) distance Uses the sum of the variables’ absolute differences

Select a clustering procedure
Mainly of 3 types:
Hierarchical method Non Hierarchical method Combination method

Decide on the number of clusters
Theoretical, conceptual or practical considerations may suggest a certain number of clusters.
In hierarchical clustering the distance in which clusters are combined can be used.
The relative size of clusters must be meaningful.

Interpret and profile clusters
It involves examining the cluster Centroids
Centroids represent mean values of the objects contained in the cluster on each of the variables
Centroid enable us to describe each cluster by assigning it a name

Access the validity of clustering
Perform cluster analysis on the same data using different distance measures and compare them to determine the stability of the solutions
Use different methods of clustering and compare the results

Simple example
Suppose a marketing researcher wishes to determine market
segments in a community based on patterns of loyalty to
brands and stores. A small sample of seven respondents is
selected as a pilot test of how cluster analysis is applied. Two
measures of loyalty- V1(store loyalty) and V2(brand loyalty)-
were measured for each respondent on 0-10 scale.
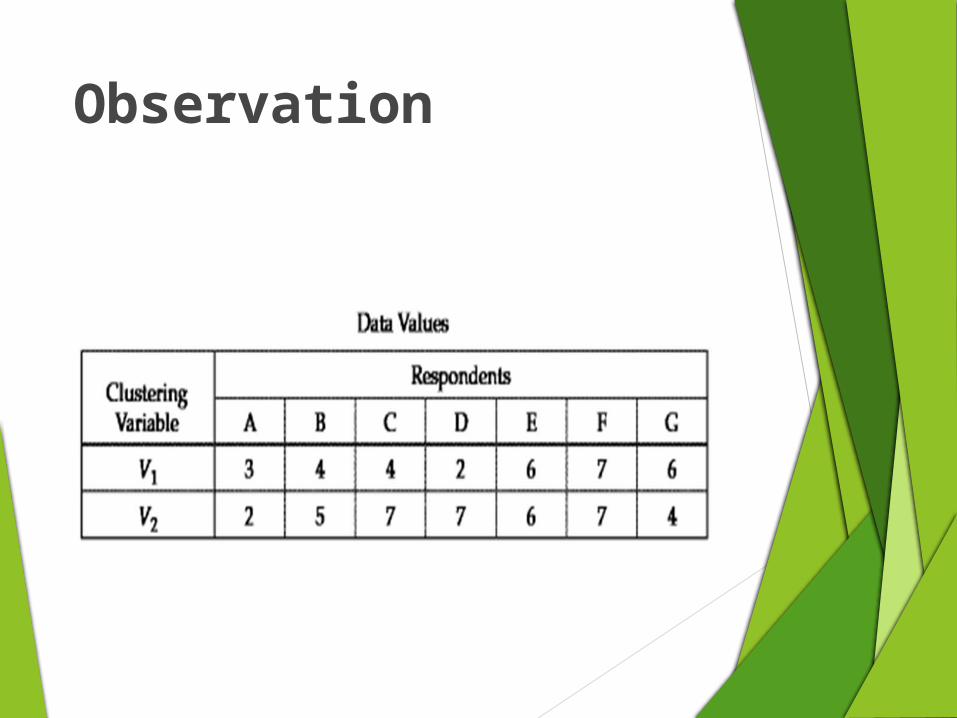
Observation

How do we measure similarity?
Proximity Matrix of Euclidean Distance Between Observations

How do we form clusters?
SIMPLE RULE:◦ Identify the two most similar(closest) observations not
already in the same cluster and combine them.
◦ Starting with each observation as its own “cluster” and then combining two clusters at a time until all observations are in a single cluster.
◦ This process is termed a hierarchical procedure because it moves in a stepwise fashion to form an entire range of cluster solutions. It is also an agglomerative method because clusters are formed by combining existing clusters

Scatter Diagram

How do we form clusters?
In steps 1,2,3 and 4, the OSM does not change substantially, which indicates that we are forming other clusters with essentially the same heterogeneity of the existing clusters. When we get to step 5, we see a large increase. This indicates that joining clusters (B-C-D) and (E-F-G) resulted a single cluster that was markedly less homogenous or 2 dissimilar clusters were joined.

How many groups do we form?
Therefore, the three – cluster solution of Step 4 seems the most appropriate for a final cluster solution, with two equally sized clusters, (B-C-D) and (E-F-G), and a single outlying observation (A).
This approach is particularly useful in identifying outliers, such as Observation A. It also depicts the relative size of varying clusters.

Dendogram
Clustering process in a tree like graph
Shows graphically how the clusters are combined at each step of the procedure until all are contained in a single cluster

Clustering methods
There are number of different methods that can
be used to carry out a cluster analysis; these
methods can be classified as follows:
Hierarchical Cluster Analysis
Nonhierarchical Cluster Analysis
Combination of Both Methods

Hierarchical Cluster Analysis
The stepwise procedure attempts to identify relatively
homogeneous groups of cases based on selected
characteristics using an algorithm either agglomerative or
divisive, resulting to a construction of a hierarchy or
treelike structure (dendogram) depicting the formation of
clusters. This is one of the most straightforward method.
HCA are preferred when:
◦ The sample size is moderate ( not exceeding 1000).

Two Basic Types of HCA
Agglomerative Algorithm
Divisive Algorithm

Agglomerative Algorithm
Hierarchical procedure that begins with each object or observation in a separate cluster. In each subsequent step, the two clusters that are most similar are combined to build a new aggregate cluster. The process is repeated until all objects a finally combined into a single clusters. From n clusters to 1.
Similarity decreases during successive steps. Clusters can’t be split.

Divisive Algorithm
Begins with all objects in single cluster, which is
then divided at each step into two additional
clusters that contain the most dissimilar objects.
The single cluster is divided into two clusters,
then one of these clusters is split for a total of
three clusters. This continues until all
observations are in a single – member clusters.
From 1 cluster to n sub clusters

Agglomerative Algorithms
Among numerous approaches, the five most
popular agglomerative algorithms are:
◦ Single – Linkage
◦ Complete – Linkage
◦ Average – Linkage
◦ Centroid Method

Agglomerative Algorithms
Single – linkage
Also called the nearest – neighbor method, defines similarity between clusters as the shortest distance from any object in one cluster to any object in the other.

Agglomerative Algorithms
Complete linkage
Also known as the farthest – neighbor method.
The oppositional approach to single linkage assumes that the distance between two clusters is based on the maximum distance between any two members in the two clusters.

Agglomerative Algorithms
Average Linkage The distance between two clusters is defined as the
average distance between all pairs of the two clusters’ members

Agglomerative Algorithms
Centroid Method◦ Cluster Centroids
- are the mean values of the observation on the variables of the cluster.
The distance between the two clusters equals the distance between the two centroids.

Advantages of HCA
Simplicity. With the development of dendogram, the HCA so afford the researcher with a simple, yet comprehensive portrayal of clustering solutions.
Measures of similarity. HCA can be applied to almost any type of research question.
Speed. HCA have the advantage of generating an entire set of clustering solutions in an expedient manner.

Disadvantages of HCA
To reduce the impact of outliers, the researcher may wish to cluster analyze the data several times, each time deleting problem observations or outliers.
Hierarchical Cluster Analysis is not amenable to analyze large samples.

REFERENCES
Hair, Black, Babin, Anderson And Tatham ‘Multivariate Data Analysis’, Pearson Education.
http://www.wikipedia.com accessed 1-1-2015.