Embed Size (px)
Citation preview
ISSN 1054-6618, Pattern Recognition and Image Analysis, 2006, Vol. 16, No. 1, pp. 82–84. © Pleiades Publishing, Inc., 2006.
Cluster Analysis of Ultrasonic Testing Data
1
A. O. Skomorokhov, P. A. Belousov, and A. V. Nakhabov
State Technical University for Nuclear Power Engineering, P.O. Box 5061, Obninsk-5, Kaluga oblast, 249020 Russia
e-mail: [email protected], [email protected], [email protected]
Abstract
—The methods of cluster analysis are applied to ultrasonic testing data of welded joints. The methodsof principal component analysis, K-means clustering, and support vector machines are considered. The appli-cation methodology and the results obtained are presented.
DOI:
10.1134/S1054661806010263
Received October 25, 2004
1
INTRODUCTION
Ultrasonic flaw detection is among the techniquesused for the nondestructive testing of welded joints atnuclear power plants. It is currently common practicethat the test results are processed by the experts, whomake a decision about the condition of the joint. Thedevelopment of a system that could assist in this task byautomatically processing ultrasonic testing data is thegeneral aim of our research. In this study, we explorethe applicability of the methods of cluster analysis totypical problems that such a system is expected tosolve. The ultrasonic testing setup used is a unit inte-grating eight transducers (sensors). To test a joint, itmakes one turn around the pipe while the transducersrealize 16 working schemes (or strokes). The outputresult is a matrix composed of 1020 rows (the numberof measurements along the joint coordinate) and 17 col-umns (the coordinate and signal from each of the 16strokes). The strokes are divided into two groupsaccording to the type of signal they employ: an echo ora shadow signal. A crack is indicated by a peak of theecho signal and a fall of the shadow signal.
Although the idea of this method is simple enough,the data processing is complicated by the presence ofnoise, the variability of parameters, and the co-strokeinterference. Now let us consider a number of typicaldata analysis problems arising in the ultrasonic testing.
CLUSTER ANALYSISOF DATA DISTRIBUTION PATTERNS
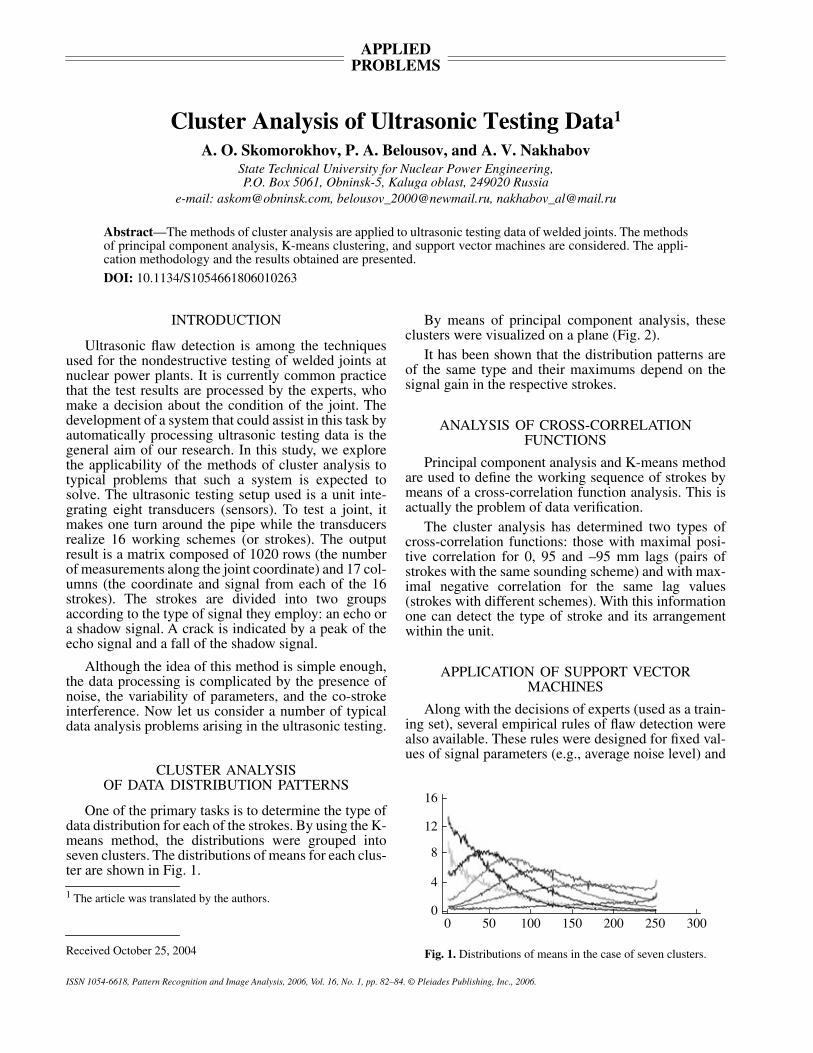
One of the primary tasks is to determine the type ofdata distribution for each of the strokes. By using the K-means method, the distributions were grouped intoseven clusters. The distributions of means for each clus-ter are shown in Fig. 1.
1
The article was translated by the authors.
By means of principal component analysis, theseclusters were visualized on a plane (Fig. 2).
It has been shown that the distribution patterns areof the same type and their maximums depend on thesignal gain in the respective strokes.
ANALYSIS OF CROSS-CORRELATION FUNCTIONS
Principal component analysis and K-means methodare used to define the working sequence of strokes bymeans of a cross-correlation function analysis. This isactually the problem of data verification.
The cluster analysis has determined two types ofcross-correlation functions: those with maximal posi-tive correlation for 0, 95 and –95 mm lags (pairs ofstrokes with the same sounding scheme) and with max-imal negative correlation for the same lag values(strokes with different schemes). With this informationone can detect the type of stroke and its arrangementwithin the unit.
APPLICATION OF SUPPORT VECTOR MACHINES
Along with the decisions of experts (used as a train-ing set), several empirical rules of flaw detection werealso available. These rules were designed for fixed val-ues of signal parameters (e.g., average noise level) and
APPLIEDPROBLEMS
00
4
8
12
16
50 100 150 200 250 300
Fig. 1.
Distributions of means in the case of seven clusters.
PATTERN RECOGNITION AND IMAGE ANALYSIS
Vol. 16
No. 1
2006
CLUSTER ANALYSIS OF ULTRASONIC TESTING DATA 83
were not faultless when applied to a real data set. Tocheck these rules, we made an attempt to construct therespective classification rule. Based on the empiricalrules, two classes of data were picked out (the coordi-nates of longitudinal and transverse flaws) and supportvector machine was trained.
Support vector machines (SVMs) were introducedin the 1990s and have demonstrated high performancein many application areas including pattern recogni-tion. One of their main benefits is that, relying on thestatistical learning theory, they provide a robust solu-tion for high-dimensional input data. In addition to thedecision rule, SVMs also yield the so-called supportvectors, which are the training examples defining thatrule. Nonlinearity is introduced by means of kernels,which map input data into a higher dimensionality fea-ture space [1].
There is a great variety of the SVM implementa-tions. Here, we use the LIBSVM algorithm with Rinterface [2].
The training set included 1226 examples represent-ing all the 16 attributes. Linear and RBF kernels wereused with tuning the parameters of the algorithm. Inboth cases, the minimal number of the support vectorswas 35 (~30%) and the training error remained withinten points (0.8%). The interpretation of these errorsmade it possible to reveal errors in the constructed rulesleading to misclassification. Moreover, this fallibility ofthe rules was shown to account for all the trainingerrors.
Thus, application of SVM prepared grounds for theverification of the empirical rules.
CLUSTER ANALYSIS OF CRACKSBY USING EMPIRICAL RULES
Principal component analysis was used to detect theattributes producing the greatest effect on the crack dis-tribution in the input space.
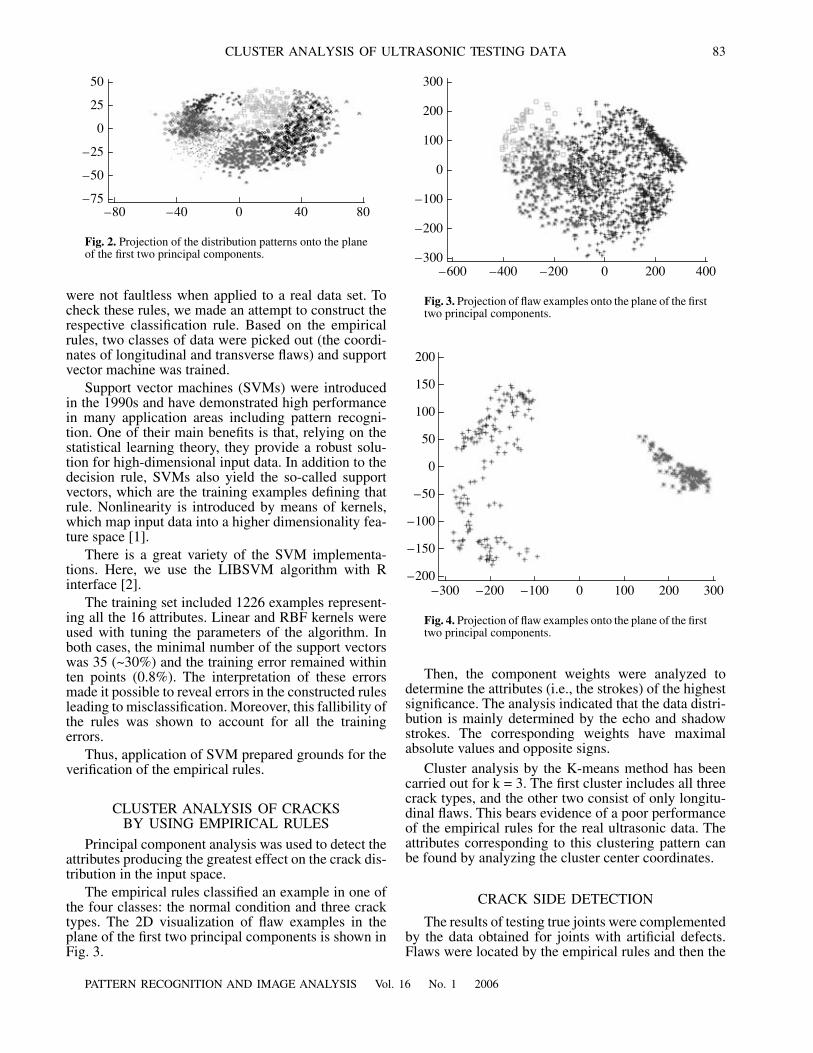
The empirical rules classified an example in one ofthe four classes: the normal condition and three cracktypes. The 2D visualization of flaw examples in theplane of the first two principal components is shown inFig. 3.
Then, the component weights were analyzed todetermine the attributes (i.e., the strokes) of the highestsignificance. The analysis indicated that the data distri-bution is mainly determined by the echo and shadowstrokes. The corresponding weights have maximalabsolute values and opposite signs.
Cluster analysis by the K-means method has beencarried out for k = 3. The first cluster includes all threecrack types, and the other two consist of only longitu-dinal flaws. This bears evidence of a poor performanceof the empirical rules for the real ultrasonic data. Theattributes corresponding to this clustering pattern canbe found by analyzing the cluster center coordinates.
CRACK SIDE DETECTION
The results of testing true joints were complementedby the data obtained for joints with artificial defects.Flaws were located by the empirical rules and then the
–75–80
–50
–25
0
25
50
–40 0 40 80
Fig. 2.
Projection of the distribution patterns onto the planeof the first two principal components.
–200
–600 –400 –200 0 200 400
–100
0
100
200
300
–300
Fig. 3.
Projection of flaw examples onto the plane of the firsttwo principal components.
–200–300
–150
–100
–50
0
50
100
150
200
–200 –100 0 100 200 300
Fig. 4.
Projection of flaw examples onto the plane of the firsttwo principal components.
84
PATTERN RECOGNITION AND IMAGE ANALYSIS
Vol. 16
No. 1
2006
SKOMOROKHOV
et al
.
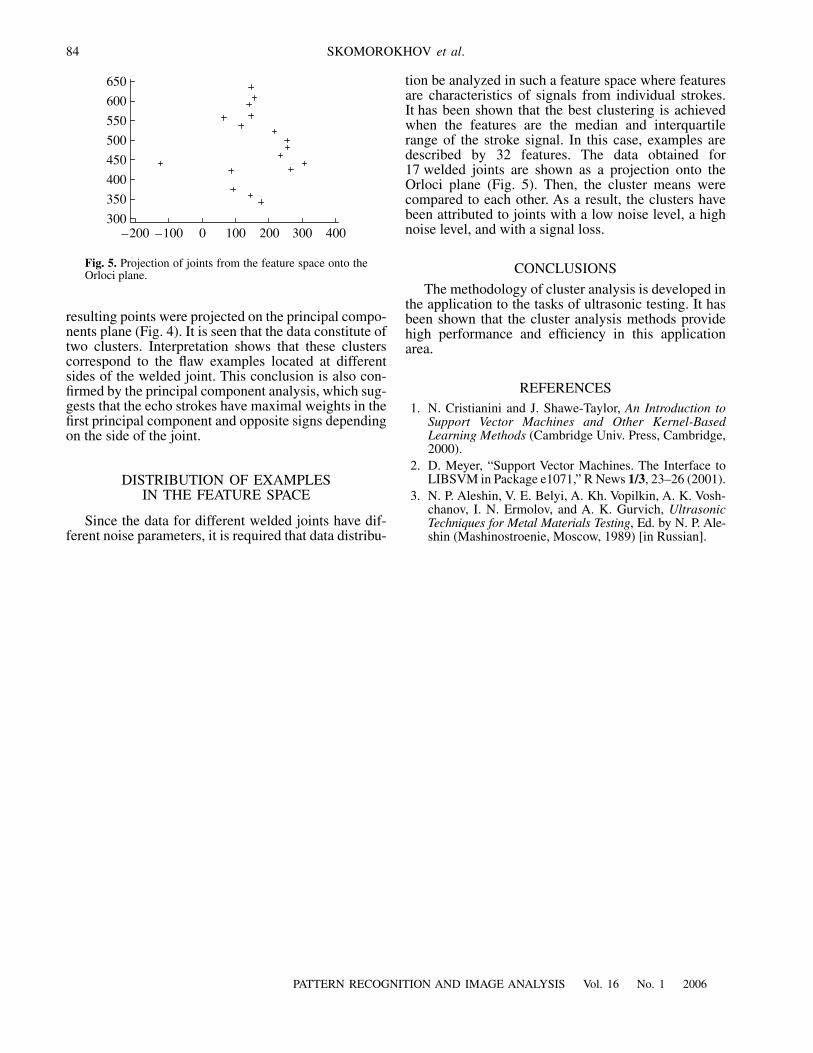
resulting points were projected on the principal compo-nents plane (Fig. 4). It is seen that the data constitute oftwo clusters. Interpretation shows that these clusterscorrespond to the flaw examples located at differentsides of the welded joint. This conclusion is also con-firmed by the principal component analysis, which sug-gests that the echo strokes have maximal weights in thefirst principal component and opposite signs dependingon the side of the joint.
DISTRIBUTION OF EXAMPLESIN THE FEATURE SPACE
Since the data for different welded joints have dif-ferent noise parameters, it is required that data distribu-
tion be analyzed in such a feature space where featuresare characteristics of signals from individual strokes.It has been shown that the best clustering is achievedwhen the features are the median and interquartilerange of the stroke signal. In this case, examples aredescribed by 32 features. The data obtained for17 welded joints are shown as a projection onto theOrloci plane (Fig. 5). Then, the cluster means werecompared to each other. As a result, the clusters havebeen attributed to joints with a low noise level, a highnoise level, and with a signal loss.
CONCLUSIONS
The methodology of cluster analysis is developed inthe application to the tasks of ultrasonic testing. It hasbeen shown that the cluster analysis methods providehigh performance and efficiency in this applicationarea.
REFERENCES
1. N. Cristianini and J. Shawe-Taylor,
An Introduction toSupport Vector Machines and Other Kernel-BasedLearning Methods
(Cambridge Univ. Press, Cambridge,2000).
2. D. Meyer, “Support Vector Machines. The Interface toLIBSVM in Package e1071,” R News
1/3
, 23–26 (2001).3. N. P. Aleshin, V. E. Belyi, A. Kh. Vopilkin, A. K. Vosh-
chanov, I. N. Ermolov, and A. K. Gurvich,
UltrasonicTechniques for Metal Materials Testing
, Ed. by N. P. Ale-shin (Mashinostroenie, Moscow, 1989) [in Russian].
650
600
550
500
450
400
350
300–200 –100 0 100 200 300 400
Fig. 5.
Projection of joints from the feature space onto theOrloci plane.