Embed Size (px)
Citation preview
CLP Holdings2018 Interim ResultsAnalyst Briefing
6 August 2018

2
Disclaimer
Potential investors, analysts and shareholders of CLP Holdings Limited (the Company) and other recipients of this document are reminded that this document and any oral discussion made together with this document (the presentation) are provided for your information purposes only and you may not forward, publish, distribute, release or disseminate any part of the presentation directly or indirectly to any other person.
It is important to note that the contents of the presentation have not been audited or independently verified. Maps included in the presentation are indicative only. They are provided for the purpose of showing the approximate location of the Company's assets, and do not purport to show the official political borders between different countries. Some comments, including comments relating to future events and our expectations about the performance of CLP's business, are based on a number of factors that we cannot accurately predict or control. We do not make, and expressly disclaim, any representations and warranties in respect of any matters contained in the presentation. We cannot provide any assurance that the information contained in the presentation is or will be accurate or complete and so they should not be relied on. We assume no liability whatsoever for any loss howsoever arising from use of, or in connection with, any of the information and data contained in this presentation. From time to time as circumstances change we may update our website at www.clpgroup.com and will update the Hong Kong Stock Exchange when relevant to comply with our continuous disclosure obligations.
This presentation is not, and is not intended to be, for publication, distribution, release or dissemination, directly or indirectly, in or into any other jurisdiction which to do so would be restricted, unlawful or a breach of a legal or regulatory requirement.
This presentation does not constitute a public offer for the purposes of any applicable law or an offer to sell or solicitation of any offer to purchase any securities or other financial instruments or any recommendation in respect of such securities or instruments.
By attending or reading this presentation, you will be deemed to have agreed to the terms, obligations and restrictions set out herein.

Performance Overview
Group Financial Performance
Performance by Business Units
Outlook
Questions and Answers
Appendices
Agenda
3

PerformanceOverview
2018 Annual General Meeting

5
✓ First half results demonstrate strength in our three largest markets
✓ Near term outlook: less favourable market conditions in the second half
✓ Long term outlook: growth supported by solid fundamentals
• Local demand growth
• High wholesale results
• Yangjiang contribution
Strong first half
✓ Rate of return reset
✓ Lower prices, intense competition
✓ Pressure on coal profitability
Second half outlook
✓ Growth in SoC investments
✓ Value Restoration in Australia
✓ Strong financial position
✓ Diversified and resilient portfolio
Strong first half and solid fundamentals position us for demanding second half
Focus • Delivery • Growth

Earnings dynamics and investments lay foundation for growth
6
HK$3.12 +33%
Operating Earnings Per Share
HK$0.61 +3%
First Interim Dividend
HK$2.94 +26%
Total Earnings Per Share
SoC Capex
HK$4.2bn
Others (incl. acquisitions)
HK$2.1bn
Capital Investment
HK$7,886m +33%
Operating Earnings
HK$0.61 +3%
Second Interim Dividend
HK$7,436m +26%
Total Earnings
Credit Ratings
New 5-year Plan approved with HK$52.9 billion capital expenditure
New SoC Development Plan
S&P Moody’s
CLP Holdings A A2
CLP Power A+ A1
CAPCO AA- A1
EnergyAustralia BBB+ -

Average minutes lost pa (rolling 3 years)
1.49 +0.13
Reliability in Hong Kong (1)
Hong Kong 16.4 TWh +4.9%
Australia 9.5 TWh stable
Electricity Sales
In operation 23.5 GW +0.6
Non-carbon Emitting (4) 5.3 GW +0.6
Committed/In construction 1.1 GW +0.2
Generation Capacity (3)
Operating Performance
7
Total recordable injury rate
0.19 -0.07
Safety
Hong Kong 2.577m +36k
Australia 2.563m -87k
Customer Accounts
Electricity sent out (2)
44.7 TWh +16%
Generation Performance
(1) Unplanned customer minutes lost - average of the past 36 months. The increase in 1H2018 was mainly due to the impact of Severe Typhoon Hato in 2017(2) Equity basis and capacity purchase arrangements. Also includes long-term power contracts from facilities in which we hold an equity interest(3) Equity basis and capacity purchase arrangements(4) Non-carbon emitting includes wind, hydro, solar and nuclear
Favourable Stable/Satisfactory Unfavourable

Battery Storage Systems at Gannawarra, Australia
Group Financial Performance

9
HK$M 1H2018 1H2017 Change
Revenue 46,464 43,337 7%
Operating Earnings
Hong Kong electricity and related activities 4,628 4,504 3%
Local electricity business 4,497 4,356
Sales to Guangdong 28 27
PSDC and Hong Kong Branch Line 103 121
Outside Hong Kong 3,687 1,718 115%
Mainland China 1,116 637
India 251 242
Southeast Asia and Taiwan 63 81
Australia 2,257 758
Other earnings and unallocated items (429) (308)
Operating Earnings 7,886 5,914 33%
Items affecting comparability# (450) (5)
Total Earnings 7,436 5,909 26%
# Item affecting comparability in 1H2018 represented the provision for Paguthan’s deemed generation receivables^ Comparative numbers have been restated for a change of presentation of other earnings from Hong Kong business to other earnings and unallocated items
Strong first half financial performance
^
^

HK$M 1H2018 1H2017 Change
Operating Earnings(Attributable to CLP)
7,886 5,914 33%
Exclude:
Fair value adjustments
125 (206)
Net finance costs # (1,039) (1,155)
Income tax expense (2,141) (1,337)
Non-controlling interests
(441) (420)
ACOI 11,382 9,032 26%
Adjusted Current Operating Income or ACOI
▪ ACOI equals EBIT excluding items affecting
comparability and fair value adjustments, and
includes Group’s share in net earnings from joint
ventures and associates
Fair value adjustments
▪ Predominantly gains on energy derivative contracts in
EnergyAustralia reflecting less volatile wholesale
prices (HK$131m)
Net finance costs #
▪ Lower finance costs mainly attributable to favourable
fair value movements of financial derivative
instruments
Income tax expense
▪ In line with increase in profit in particular Australia
Non-controlling interests
▪ CSG’s 30% share of CAPCO
# Included the distribution to perpetual capital securities holders
Adjusted Current Operating Income (ACOI)
10

(32)9,000
11,382
9,032 223 493
(23)(21)
(8)1,718
(2,000)
-
2,000
4,000
6,000
8,000
10,000
12,000
1H2017 FX Normalised1H2017
Hong Kong MainlandChina
India SEA andTaiwan
Australia Others andUnallocated
1H2018
HK$m
HK$M 1H2018 1H2017
Hong Kong electricity and related activities 6,604 6,417 Reliable performance and continuing capital investments
Mainland China 1,359 820 Growth in earnings from non-carbon portfolio
India 661 681 Stable operating performance and lower wind resources
Southeast Asia and Taiwan 62 79 Extended overhaul and tax rate increase at Ho-ping
Australia 3,095 1,350 High wholesale prices and competitive retail market
Other earnings and unallocated items (399) (315) FX loss * and higher corporate & innovation costs
Total 11,382 9,032 26% increase
Increase on like-for-like basis after adjusting for FX
Adjusted Current Operating Income (ACOI)
11
Australia
SEA & Taiwan
India
Mainland China
Hong Kong
Other earnings &
unallocated items
+26%
^ Comparative numbers have been restated for a change in presentation of other earnings from Hong Kong business to other earnings and unallocated items* FX loss reflects the impact of the weakening RMB on deposits
^
^
0

Performance by Business Units
Yangjiang Nuclear Power Station, Guangdong, China

6,417
( 36 )
6,381 227 (4)
6,604
-
2,000
4,000
6,000
8,000
1H2017 FX Normalised1H2017
SoC Others 1H2018
HK$mHong Kong ACOI
Reliable performance and continuing capital investments
(1) 1H2017 figure has been restated for a change in presentation of other earnings from Hong Kong business to other earnings and unallocated items(2) Supply reliability based on average unplanned customer minutes lost per year 13
Local sales increased 5% reflecting hot weather in 1H2018
Supply reliability >99.999% (2)
Construction of CCGT unit D1 in progress
Public inspection on EIA for offshore LNG terminal completed. Significant progress made on LNG supply and FSRU vessel arrangements
Higher earnings predominantly reflecting investment in fixed assets
Capex spent in 1H2018
• T&D + Retail capex ~HK$1.9 bn• Generation capex ~HK$2.0 bn
Others: variance in a number of items including PSDC, sales to Guangdong and Hong Kong branch line
Lower SoC return from 1 October
Deliver new 5-year Development Plan for 2018-2023 and SoC initiatives
Continue construction of D1
Seek approval on EIA for offshore LNG terminal and finalise contracting for gas supply
Operational Performance
+3.5%(1)
0

820 46 866 67
330 119
(37)
797
517
(200)
-
200
400
600
800
1,000
1,200
1,400
1,600
1H2017 FX Normalised1H2017
Renewables Nuclear Thermal Others 1H2018
HK$mMainland China ACOI
82
Growth in earnings from non-carbon portfolio
Renewables
Nuclear
Thermal
Others
14
Renewables • Existing projects: higher wind dispatch and
less grid curtailment, stable solar and lower hydro flows
• 50MW of wind and 55MW of solar projects added since 2H2017
Nuclear• Daya Bay: refueling outage lowered output• Yangjiang: completed 3 planned refueling
outages. Unit 5 operational from 12 July
Thermal• Reliable operation, higher demand at FCG
Renewables
• Higher contribution from existing projects, less grid curtailment and new projects
Nuclear
• Initial contribution from Yangjiang
• Modestly lower earnings from Daya Bay reflecting planned outage cycle
Thermal
• Higher earnings from higher output, but continuously impacted by adverse market conditions including high coal prices, import constraints and discounted market sales
Adapt operating model as the energy transition and market evolve
Further increase of contribution from non-carbon generation
High coal price and volume competition to continue with lower output and margin anticipated
Operational Performance
(1) Our share of earnings of Yangjiang included amortisation of fair value adjustment on acquisition
+57%
(23)
(1)
1,359
0

661
367
681 1 682
(71)
58
( 21 )
13
294
-
100
200
300
400
500
600
700
800
1H2017 FX Normalised1H2017
Wind Solar Thermal Others 1H2018
HK$mIndia ACOI
Stable operating performance and lower wind resources
Renewables
Thermal
15
Renewables• Lower generation due to lower wind
resource
• Full commissioning of Veltoor Solar completed in February
Thermal
• Strong operating performance
• High availability for Paguthan and Jhajjar
Renewables• Less wind resource
• Contribution from Veltoor Solar
Thermal • Solid underlying financial performance
Others
• Non-recurring items in 1H2017 include cancellation costs of Yermala wind development and favourable coal inventory adjustment at Jhajjar
Maintain operational excellence and strengthen business foundations
Explore new commercial possibilities for operations in Paguthan
Pursue diversified expansion
Operational Performance
-3%
0

62
42
79 6 85 1
(31)
7
36
(16)
(20)
-
20
40
60
80
100
1H2017 FX Normalised1H2017
Renewables Thermal Opex & Depex 1H2018
HK$m Southeast Asia and Taiwan ACOI
Lower earnings from extended overhaul and tax rate increase at Ho Ping
Renewables
Thermal
Others
16
Renewables - Lopburi
• Good performance and high utilisation
Thermal - Ho-Ping
• Lower plant availability caused by longer period of annual overhaul
Renewables - Lopburi
• Stable solar resource
Thermal - Ho-Ping
• Lower earnings due to extended overhaul and increase in tax rate (including adverse impact on deferred tax adjustment)
Ongoing engagement with Vietnamese Government on Vinh Tan III and Vung Ang II projects
Return to steady performance of Ho-Ping
Operational Performance
-27%
0

Customer 1,001
1,350 27 1,377
( 578 )
2,316(20)
3,095 Energy3,039
Enterprise(945)
-
1,000
2,000
3,000
4,000
5,000
1H2017 FX Normalised1H2017
Customer Energy Enterprise 1H2018
HK$mAustralia ACOI
High wholesale prices and competitive retail market
17
Customer
• Market highly competitive with increased discounting
• Customer accounts lower (churn below market average, but new customer acquisitions have declined)
• Supported vulnerable customers by reducing fees and through advocacy on energy policy
Energy
• Acquisition of Ecogen Energy completed• Agreement finalised to operate two
utility scale battery storage systems• Generation marginally lower driven by
outages
Customer
• Gross margin reduced on higher energy costs, lower customer numbers and discounting
• Cost to serve higher on increased regulatory costs
Energy
• High realised wholesale energy prices have increased generation margins while low volatility has reduced costs to acquire energy at peak periods
Lower wholesale price outlook and increase in volatility
Intense competition and discounting likely to continue
Focus on customer service and retention in highly competitive retail market
Engage with key stakeholders on energy industry reforms including the National Energy Guarantee (NEG)
Integrate Ecogen, demand response and utility scale batteries into the business and evaluate new value creation opportunities such as pumped hydro and gas peaking assets
Operational Performance
0
+125%

Net Debt/Total CapitalNet Debt
Free Cash Flow Dividends paidCapital Investments
Financial strength supports business acquisitions
Details on Page 3318
Credit Ratings S&P Moody’s
CLP HoldingsA
Stable A2
Stable
CLP Power Hong Kong
A+ Stable
A1 Stable
CAPCOAA-
Stable A1
Stable
EnergyAustraliaBBB+Stable -

Outlook
Training in a virtual reality environment, Hong Kong

Penny’s BayPower Station
Daya Bay NuclearPower Station
Guangzhou Pumped Storage Power Station
Black PointPower Station
Castle PeakPower Station
New Development Plan addresses growing demand & supply reliability
20
Maintaining Supply Reliability
Meeting New Towns needs
Enhancing Clean Energy Transmission
Supporting Key Developments
Proposed Offshore LNG Terminal
132kV Circuit
132kV Submarine Cable
400kV Circuit
Servicing New Infrastructure

The Plan drives the transition to cleaner and smarter energy…
21
GasNuclear
Coal
RE
Offshore LNG Terminal
2023
Clean Energy Transmission
System Enhancement
RE Feed-in TariffRE certificates
Energy efficiencySmart Meters
Black Point
New CCGT Units D1 & D2,
Black Point upgrades
Retire 1,400MW of coal
Clean EnergyNew Gas Infrastructure
save

…delivering major benefits while maintaining a competitive tariff
22* Comparison based on average monthly domestic consumption of 275kWh
CLP’s tariff as of Oct 2018; Tariff as of Jun 2018 for other cities. Exchange rate of Jun 2018 was applied
✓ Secure and reliable supply maintained and enhanced
✓ Environmentally responsible as we transition to gas and continue to reduce emissions
✓ Globally competitive tariff maintained as we undertake these significant changes 0.0
0.5
1.0
1.5
2.0
2.5
3.0
CLP Power Singapore London New York Sydney
Globally Competitive Tariff*HK$/kWh

Investment in digital energy solutions and the best global technologies
23
Data Analytics
Investment & partnership
Demand Response &
Energy Management
Next Generation Renewables
& Storage
Energy Management
Systems
Energy management & Smart Lighting
Clean energy and smart city
technology
Digital energy technologies
Recent developments
Partnership
Artificial & digital
technologies

13%
23%20%
30%30%
40%
0 1 2 3 4 5 6
% o
f G
ener
atio
n C
apac
ity
Milestones for renewables and non-carbon capacity increased
2017 2020 2030
Emission Intensity Targets Clean Energy Targets
*
*
Non-Carbon Targets Renewables Targets
0.69
0.6
0.5
0.34
0.15
0 2 4 6
(kg
CO
2/k
Wh
)
*
Carbon Emissions Target (kg CO2/KWh)(kg CO2/kWh)
2017 2020 2030 2040 2050
Continuing our commitment to the Energy Transition
* Equity basis and capacity purchase arrangements
24
(200)
-
200
400
600
800
1,000
1,200
Coal Gas Renewables Nuclear
Commitments and actions to combat Climate Change• Tightened targets for reducing carbon emissions• Increased the share of renewables & non-carbon emitting generation
2050 carbon emission intensity target reduced from 0.2 to 0.15
Increased investment in zero and low emission technologies and reduced
exposure to coal (2014-2017)
Decarbonising our Portfolio
0
MW

Looking forward
Australia
Southeast Asia
and Taiwan
Hong Kong
Progress Vietnam
opportunities
Deliver new Development
Plan and SoC initiatives
India
Climate Vision 2050
Pursue energy transition targets
Digital Transformation
Utility of the future
Energy transition
and optimising
assets across
the portfolio
Support customer
base and target
value creating
assets
Broaden portfolio along
the energy supply chain
25
Mainland China

CLP and CGNPC renewed the Strategic Partnership Agreement
Questions and Answers
Partnership between CLP and TUS-Clean Energy

CLPV Appreciation Ceremony
Appendices

Earnings and Dividends 1H2018 1H2017 Change
Operating earnings (HK$M) 7,886 5,914 +33%
Total earnings (HK$M) 7,436 5,909 +26%
Operating earnings per share (HK$) 3.12 2.34 +33%
Total earnings per share (HK$) 2.94 2.34 +26%
Dividends per share (HK$)
First interim dividend 0.61 0.59 +3%
Second interim dividend 0.61 0.59 +3%
Total interim dividends 1.22 1.18 +3%
Capex (HK$M)
SoC Capex 4,219 4,016 +5%
Other Capex 2,086 842 +148%
30 Jun 2018 31 Dec 2017 Change
Leverage
Net Debt (HK$M) 49,069 47,411 +3.5%
Net Debt/Total Capital (%) 28.3% 27.8% +0.5%
CLP Group – Financial Highlights – Additional Information
28Favourable Stable/Satisfactory

(1) Equity basis and capacity purchase arrangements. Also includes long-term power contracts from facilities in which we hold an equity interest(2) Equity basis and capacity purchase arrangements(3) Non-carbon emitting includes wind, hydro, solar and nuclear(4) Unplanned customer minutes lost - average of the past 36 months. The increase in 1H2018 was mainly due to the impact of Severe Typhoon Hato in 2017
Operating Information 1H2018 1H2017 Change
Safety (Total Recordable Injury Rate) 0.19 0.26 -0.07
Electricity sent out (TWh) (1) 44.7 38.4 +16%
Generation Capacity (GW) (2)
Total in Operation 23.5 22.9 +0.6
Non-Carbon Emitting (3) 5.3 4.6 +0.6
Committed / Under Construction 1.1 0.8 +0.2
Customer Accounts (Thousand)
Hong Kong
Australia
2,577
2,563
2,541
2,650
+36
-87
Hong Kong local electricity sales (TWh) 15.8 15.1 +0.7
Reliability in Hong Kong (minutes lost pa) (4) 1.49 1.36 +0.13
CLP Group – Operating Highlights – Additional Information
29
Favourable Unfavourable

* Including net fair value loss/(gain) on financing related derivative financial instruments, and other net exchange loss/(gain) on financing activities and distribution to perpetual capital securities holders# Including net fair value loss/(gain) on derivative financial instruments relating to transactions not qualifying as hedges and ineffectiveness of cash flow hedges
^ Comparative numbers have been restated for a change in presentation of other earnings from Hong Kong segment to other earnings and unallocated items
HK$MHong Kong
electricity and related
Mainland China India SEA & Taiwan Australia Other earnings &
unallocated itemsGroup total
2018 Interim results
Operating Earnings (as per Segment
Information in Interim Report)4,522 1,219 251 63 2,257 (426) 7,886
Allocation PSDC & HK Branch line 103 (103) - - - - -
Allocation of Other Earnings 3 - - - - (3) -
Operating Earnings (as per Management
Reporting in this presentation pack)4,628 1,116 251 63 2,257 (429) 7,886
Add back
Non-controlling interests 422 5 14 - - - 441
Net finance costs/(income) * 594 124 290 (1) 13 19 1,039
Income tax expense 953 114 106 - 956 12 2,141
Fair value adjustments # 7 - - - (131) (1) (125)
ACOI 6,604 1,359 661 62 3,095 (399) 11,382
2017 Interim results ^
Operating Earnings (as per Segment
Information in Interim Report)4,346 758 242 81 758 (271) 5,914
Allocation PSDC & HK Branch line 121 (121) - - - - -
Allocation of Other earnings 37 - - - - (37) -
Operating Earnings (as per Management
Reporting in this presentation pack)4,504 637 242 81 758 (308) 5,914
Add back
Non-controlling interests 412 9 (1) - - - 420
Net finance costs/(income) * 675 110 332 (2) 53 (13) 1,155
Income tax expense 833 64 108 - 325 7 1,337
Fair value adjustments # (7) - - - 214 (1) 206
ACOI 6,417 820 681 79 1,350 (315) 9,032
CLP Group – Reconciliation of Operating Earnings and ACOI
30

(1) Capital investments include fixed assets, leasehold land and land use rights, investmentproperties, intangible assets, investments in and advances to joint ventures and associates,and acquisition of businesses/assets
(2) Capital expenditure on fixed assets and leasehold land and land use rights are furtheranalysed into• SoC capex - capital expenditure related to the SoC business• Growth capex - capital expenditure for additional generation capacity• Maintenance capex - capital expenditure other than the above
(3) Capital investments on intangibles assets and investments in and advances to jointventures and associates
(4) Acquisition of businesses includes the acquisition of Ecogen in April 2018 and Jinchang Solarin May 2018
(5) Net of bank balance, cash and other liquid funds
Cash Flow
▪ Higher SoC inflow mainly due to increase in units sold, basic tariff and
higher fuel cost recovery from customers (as opposed to the payment of
special fuel rebate in 2017); Strong operating performance (including
favourable settlements of energy contracts) in Australia also brought in
more free cash flow
▪ Cash from divestment represents the divestment proceed of our
minority interests in the CGN Wind in China
Capital Investments
▪ HK$4.2 billion SoC capex related to enhancement of transmission and
distribution networks and generation facilities including construction of
CCGT in Hong Kong
▪ Growth capex mainly represented our investments in solar project inIndia
▪ Maintenance capex mainly represented capital works on Yallourn andMount Piper in Australia
▪ Acquisition of Ecogen in April (HK$1 billion) and remaining 49% interestof Jinchang Solar in May (HK$0.2 billion)
Net Debt/Total Capital
▪ Increase in net debt/total capital mainly related to cash outflow forinvestments to support business growth
HK$M 1H2018 1H2017
Cash Flow
EBITDAF 14,936 12,600
Less: Items affecting comparability 450 5
Recurring EBITDAF 15,386 12,605
Less: Movement in SoC items (1,228) (1,756)
Less: Movement in working capital & others (3,713) (3,862)
Funds from operations 10,445 6,987
Less: Tax paid (1,152) (581)
Less: Net finance costs paid (1,195) (1,126)
Less: Maintenance capex (441) (314)
Add: Dividends from joint ventures & an associate 995 1,379
Free Cash Flow 8,652 6,345
Cash from divestment 958 -
Capital Investments (1)
• SoC capex(2)
4,219 4,016
• Maintenance capex(2)
441 314
• Growth capex (2)
210 364
• Others(3)
192 164
• Acquisitions of businesses(4)
1,243 -
Total 6,305 4,858
Dividend paid 4,421 4,245
End of period30 Jun 2018
31 Dec 2017
Net Debt (5) (HK$M) 49,069 47,411
Net Debt/Total Capital (%) 28.3% 27.8%
CLP Group – Cash Flow and Financial Structure
31

30 Jun 2018 31 Dec 2017
HONG KONG HK$M HK$M
Total borrowings of CLPH, CLPP, CAPCO & PSDC 45,816 44,954
Minus: Bank balances and liquid funds (4,731) (5,964)
Net Debt 41,085 38,990
OVERSEAS
Total borrowings of EnergyAustralia, India and Mainland China subsidiaries (non-recourse to CLPH) 11,733 12,387
Minus: Bank balance and liquid funds (3,749) (3,966)
Net debt 7,984 8,421
CONSOLIDATED total borrowings of CLP Group 57,549 57,341
Minus: Consolidated bank balance and liquid funds (8,480) (9,930)
Consolidated Net debt 49,069 47,411
Total Debt/Total Capital 31.7% 31.8%
Net Debt/Total Capital 28.3% 27.8%
Increase in net debt/total capital mainly related to cash outflow for investments to support business growth
CLP Group – Financial Obligations at a Glance
32

A1
Stable
A1
Stable
A+
Stable
A+
Stable
Long term Rating
Foreign Currency
Outlook
Local Currency
Outlook
Short term Rating
Foreign Currency
Local Currency
S&P Moody’s S&P
CLP Holdings EnergyAustralia
A-1
A-1
P-1
P-1
A-1
A-1
-
-
P-1
P-1
A
Stable
A
Stable
A2
Stable
A2
Stable
In May and June 2018, S&P and Moody’s affirmed all the credit ratings of CLPH, CLP Power Hong Kong and CAPCO with stable outlooks
BBB+
Stable
BBB+
Stable
CLP Group – Credit Ratings
33
S&P Moody’s
CLP Power
S&P Moody’s
CAPCO
AA-
Stable
AA-
Stable
A1
Stable
A1
Stable
A-1+
A-1+
P-1
P-1

• Ample liquidity in the Group with undrawn facilities of HK$24.1 billion and HK$8.5 billion bank balances as at 30 June 2018
• CLP Holdings completed HK$2.5 billion refinancing through arrangement of new bank loan facilities with three banks at preferential interest rates.
CLP Holdings
• New financing obtained at extremely cost effective interest rates. CLP Power Hong Kong arranged a HK$1 billion 15-year fixed rate private placement bond and HK$1.3 billion three and five-year bank loan facilities at attractive interest rates.
CLP Power Hong Kong
• Our financial management is held in high regard in the industry. In May 2018, the arrangement of CAPCO’s HK$5.7 billion term loan facilities for funding of the new Combined Cycle Gas Turbine plant at Black Point Power Station was recognised as the Hong Kong Power Deal of the Year at the Triple A Asia Infrastructure Awards 2018 organised by The Asset magazine. This comprised HK$1.4 billion, 15-year export credit facility arranged in March 2017 and HK$4.3 billion, five-year commercial loan facility arranged in January 2017.
CAPCO
• Continued financing at competitive terms. Tapping from diversified resources including offshore RMB bank facilities.
Mainland China
• Lower interest margins by 0.7% for Rs2.9 billion (HK$331 million) project loans of Jhajjar Power Limited after successful negotiation with two lenders.
• Arranged a Rs1.5 billion (HKD171 million) 18-year project loan in June 2018 for the solar project.
India
• Stronger operating cash flow and more surplus fund. EnergyAustralia cancelled A$850 million (HK$4.9 billion) bank loan facilities and early repaid US$30 million (HK$235 million) private placement bond to reduce finance costs.
• Re-arranged a A$500 million (HK$2.9 billion) syndicated guarantee facility in March 2018 at more favourable costs.
• Extended the maturity date of an existing A$300 million (HK$1.7 billion) working capital facility by three years to June 2021.
EnergyAustralia
CLP Group – Highlights of Financing Activities
34
For more information on CLP Climate Action Finance Framework

52%48%
52%48%
1) The maturity of revolving loans is in accordance with the maturity dates of the respective facilities instead of the current loan drawdown tenors
2) For floating rate borrowings, if assuming 1% increase in interest rate and based on outstanding debt balance as at 30 June 2018, the additional interest payment is around HK$279m per annum
3) CLP continues to obtain debt (re)financing at very cost effective interest rates. Some representative examples in the first half of 2018 are highlighted on page 34 (“CLP Group – Highlights of Financing Activities”)
CLP Group – Loan Balances by Type and Maturity
35
Jun 2018
Dec 2017
Floating rate (2) Fixed rate
Proportion of debt on fixed and floating rate

Generation Transmission Distribution Retail
8,963 MW of installed capacity
> 15,700 km of transmission and high voltage distribution lines
233 primary and > 14,500 secondary substations
During 1H2018:
▪ Local electricity sales increased 4.7% to 15,831 GWh as compared with 1H2017
▪ No. of customer accounts increased by 36k to 2,577k ascompared with 1H2017
▪ Major infrastructure projects ongoing
▪ Construction of a new 550MW gas-fired generation unit atBlack Point Power Station in progress and on schedule forcommissioning the unit before 2020
▪ The second and third unit of gas turbine upgrade project atBlack Point Power Station completed with a total of 50MWgeneration capacity added
▪ Commissioned 1 new 132kV substations to provide a powersupply to a data centre in Tseung Kwan O
▪ Over 80 km of new transmission and high voltage distributionlines & over 90 new substations added
▪ Upgraded flagship shop in Mong Kok to bring in newinteractive and personalised retail experience
We generate, transmit and distribute electricity to over 80% of Hong Kong’s population in Kowloon, the New Territories and on Lantau Island
15,831 GWh sold and
2.58 million customer accounts
Hong Kong – Growing Business Scale
36

5,6155,152 4,996
4,523
1,930
1,3681,735
1,607 2,481
817743
587
1,370
689
1,064
0
1,000
2,000
3,000
4,000
5,000
6,000
7,000
8,000
9,000
2014 2015 2016 2017 1H2018
25%
41%
28%
6% 26%
41%
28%
5%
1H2018
Total Capital Expenditure in line with Development Plan (DP)
Capex incurred up to June 2018 of HK$34.7bn, vs. Development Plan from January 2014 to September 2018: HK$37.1bn
Electricity Sales
GWh 1H2018 1H2017 Change
Residential 4,077 3,820 6.7%
Commercial 6,458 6,226 3.7%
Infrastructure & Public Services 4,479 4,246 5.5%
Manufacturing 817 823 (0.7%)
Total Local Sales 15,831 15,115 4.7%
Export Sales 537 483 11.2%
Total Sales 16,368 15,598 4.9%
Capital Expenditure
HK$M 1H2018 1H2017 Change
CLP Power Hong Kong 1,930 1,957 (1.4%)
CAPCO 1,957 1,580 23.9%
Total Capex 3,887 3,537 9.9%
6,9836,887 6,603
3,300
CAPCO - JV partner’s share CAPCO - CLP’s share CLP Power Hong Kong
HK$M
Sales Mix
1H2017
Residential
Commercial
Infra & Public services
Manufacturing
Hong Kong – Electricity Sales and Capex
37
7,004

Hong Kong – New Development Plan 2018-2023
38
Year(HKȼ/kWh)
Q1-3 2018Q4 2018 &
2019
Forecast
2020 2021 2022 2023
Basic Tariff 94.5 91.0 93.4 96.5 99.1 101.9
Change - - 3.7% + 2.6% + 3.3% + 2.7% + 2.8%
Fuel Clause Charge 22.0 27.8 32.4 36.2 37.4 37.4
Change - +26.4% +16.5% +11.7% +3.3% -
Rent & Rates Special Rebate (1.1) (1.1) - - - -
Average Net Tariff 115.4 117.7 125.8 132.7 136.5 139.3
Change - +2.0% +6.9% +5.5% +2.9% +2.1%
New Dev Plan Period
Key projects
• Two additional CCGT units including D1 (currently under construction) and D2
• Enhancement of existing gas generation facilities
• Offshore LNG Terminal
• Enhancement of Clean Energy Transmission System
• Installation of generation units at West New Territories Landfill
• Smart City and Digital Developments
Maintaining Reliability (38%)
Lowering Carbon & Emissions (30%)
Smart City & Digitalization (8%)
Meeting Demand (24%)
Smart City & Digitalisation (8%)
Allocation of capital investment Total Investment of HK$52.9 billion (Oct 2018 – Dec 2023)

Environmental ImprovementOver 80% emissions reduction with 80% increase in electricity sales since 1990
Hong Kong – Tariff, Reliability & Environmental Improvement
39
HK$/kWh
Remarks: Comparison based on average monthly domestic consumption of 275kWh
CLP’s tariff as of Oct 2018; Tariff as of Jun 2018 for other cities
Exchange rate of Jun 2018 was applied
Remarks:2015-2017 average for CLP Power and New York, 2014-2016 average for all other citiesThere is no overhead lines in Singapore
More Reliable Less Reliable
High Reliability Low Tariff
0.5 1.6
8.5
19 21
0
10
20
30
40
50
0.5 CLP Power
Unplanned customer
minutes lost per year
Sydney
(CBD)
New York LondonSingapore0.0
0.5
1.0
1.5
2.0
2.5
3.0
CLP Power Singapore London New York Sydney
Change
-100%
-80%
-60%
-40%
-20%
0%
20%
40%
60%
80%
100%
NOx Emission SO2 Emission RSP Emission Electricity Demand
- 80% in Emissions
1990 1995 2000 2005 2010 2015 2017
Nitrogen Oxide (NOx)Sulphur Dioxide (SO2) Respirable Suspended Particulates (RSP) Electricity Sales
+ 80% in Electricity Demand

2012 2013 2014 2015 2016 2017
WEP II Gas
Short Term SouthChina Sea Gas
Yacheng Gas
Average tariff
Gas Volume
Hong Kong – Tariff, Energy Cost and Gas Volume
40
1,418 2,222
2,801
3,394
3,532
3,001 241
183 7,9928,800
0
2,000
4,000
6,000
8,000
10,000
1H2017 1H2018
Others
Nuclear
Gas
Coal
HK$M
+10%
Energy Cost Gas volume to approximate double by 2020
-20
0
20
40
60
80
100
120
91.0
117.7HK¢/kWh
Average Net Tariff
Basic Tariff
Fuel Cost Adjustment 27.8
Special Rebate (1.1)*
*At some point in the fourth quarter of 2018 or in 2019, the Rent and Rates refund available from Government as a “R&R Special Rebate” is expected to be used up, when the Net Tariff will be 118.8 cents per kWh.
• CLP will increase the use of natural gas for power generation in order to meet the fuel mix target set by the Government of around 50% gas-fired power generation in 2020
• As the cost of generating electricity from natural gas is more than double than that of coal-fired generation, it is expected that fuel cost will increase considerably
• Starting from Oct 2018, the Basic tariff will decrease by 3.7% which is more than offset by the rise in fuel cost
• A new monthly fuel cost adjustment will be introduced to reflect fuel price changes in a timelier manner
• CLP will pursue continuous cost containment measures to minimise future tariff increases

The average foreign exchange rates used to convert Mainland China Segment earnings to Hong Kong dollars are 1.13518 for 1H2017 and 1.22872 for 1H2018. Note that in the ACOI variance analysis presented in the body of the presentation.
Mainland China – Financials (HK$)
41
Mainland China
HK$M Operating/Total Earnings ACOI
1H2018 1H2017 1H2018 1H2017
Renewables 335 262 517 418
- Wind 249 161 332 215
- Hydro 16 42 70 109
- Solar 70 59 115 94
Nuclear 740 441 797 464
- Daya Bay 409 441 430 464
- Yangjiang 331 - 367 -
Thermal 80 (35) 82 (33)
- Shandong 14 2 16 3
- Guohua 28 13 28 14
- Fangchenggang 38 (50) 38 (50)
Operating and development expenditure
(39) (31) (37) (29)
Operating earnings /ACOI 1,116 637 1,359 820
Total earnings 1,116 637

Mainland China – Financials (Local Currency)
42
Mainland China
RMB’M Operating/Total Earnings ACOI
1H2018 1H2017 1H2018 1H2017
Renewables 273 231 421 368
- Wind 203 142 270 189
- Hydro 13 37 57 96
- Solar 57 52 94 83
Nuclear 602 388 649 409
- Daya Bay 333 388 350 409
- Yangjiang 269 - 299 -
Thermal 65 (31) 67 (29)
- Shandong 11 2 13 3
- Guohua 23 11 23 12
- Fangchenggang 31 (44) 31 (44)
Operating and development expenditure (32) (53) (30) (51)
Operating earnings /ACOI 908 535 1,107 697
Total earnings 908 535

(35) 80 (33)82
441
740
464
797 262
335
418
517
(31) (39) (29) (37)
-300
-
300
600
900
1,200
1,500
1H2017 1H2018 1H2017 1H2018
Operating Earnings ACOI
▪ Economy continued to grow steadily and operating environment remains challenging from reforms inmacroeconomic policies at the energy sector and high coal price
▪ Strong power demand due to unusually cold weather
▪ Higher dispatch at Fangchenggang from strengthening economic growth in Guangxi Zhuang Autonomous Regionand easing competition from hydro power generation due to low rainfall
▪ Efficiency and emission standards enhanced for Fangchenggang Unit 1 and in progress for Unit 2 for compliancewith Mainland China’s 2020 emissions requirements
▪ Strong contribution from Yangjiang following completion of acquisition in December 2017
▪ Good solar and wind resources with less grid curtailment (average grid curtailment down from 10% in 1H2017 to3% in 1H2018)
▪ Acquisition of additional 49% interest in Jinchang Solar in May 2018
▪ CLP has commenced construction of CLP Laizhou II Wind (49.5MW) in Shandong
▪ Lingyuan Solar (17MW) in Liaoning commenced commercial operation in July 2018
(1) CLP equity interest and capacity purchase rightsContributions of renewables were higher than 1H2017
Renewable Nuclear Thermal Others
HK$M
Mainland China – Renewables and Generation
43
0
2,000
4,000
6,000
8,000
10,000
2007 2008 2009 2010 2011 2012 2013 2014 2015 2016 2017 June2018
MW CLP capacity(1) in Mainland China
Thermal Nuclear Renewable PSDC Under construction
0

▪ On 12 December 2017, we completed the acquisition of a 17% interest in 6,516 MW Yangjiang nuclear facility in Guangdong (1,108 equity MW)
▪ Earnings sharing commenced from 12 December 2017
▪ Consideration
▪ Purchase consideration: RMB5.0bn (around HK$5.9bn) plus audited completion payment
▪ Total Investment: Not exceeding RMB7.0bn (around HK$8.3bn) to full COD of 6 Units in 2019
Mainland China – Yangjiang Nuclear
Daya Bay
Yangjiang
Hong Kong
Macau
GUANGDONG
44(1) CLP equity interest and capacity purchase rights
▪ Units 1-4 in operation; Unit 5 commenced operation in July 2018; Unit 6 under construction and expected to commission during 2019
▪ Market in 2018
▪ Majority of output will be paid according to the nuclear benchmark tariff with the remainder subject to a competitive discount process
0
1,000
2,000
3,000
4,000
5,000
2008 2009 2010 2011 2012 2013 2014 2015 2016 2017 June2018
MW Non-carbon emitting portfolio (1) in Mainland China
Nuclear Under construction - Nuclear Renewables Under construction - Renewables

Mainland China – Climate Policy and National Carbon Market
45
• Reduce CO2 emissions per unit of GDP by 60-65% compared to 2005 level
• By 2030: Increase share of non-fossil fuel energy to 20%
• Peak CO2 emissions
2030
• Reduce CO2 emissions per unit of GDP by 40-45% compared to 2005 level
• Increase share of non-fossil fuel energy to 15%
• 9% of power generation from non-hydro renewables
2020
National ETS market and RECs are key for China to meet its climate change targets
China set ambitious climate change targets
National Emission Trading Scheme (ETS) market Renewable Energy Certificates (RECs)
• In December 2017, the Chinese Government announced the launch of a nationwide carbon market, which is set to be the world’s largest carbon trading system and underlines the country’s pledge to peak carbon emissions by the end of 2030. The initial phase of the market will cover only power generation
• Power generators will be granted a certain amount of free allowance by the Government and those emitting beyond the allocation will have to procure the shortfall from the market
• Renewable energy (RE) companies may benefit from selling China Certified Emission Reductions (CCERs)
• Seven regional pilot scheme were launched since 2013• Continue to monitor the opportunities and impact arise from
the new policy
• A market-based mechanism which allows certain RE operators (exclude offshore wind farms and distributed solar projects) to earn the subsidy portion of tariffs through the issuance of green certificates
• RECs mechanism may replace the current feed-in-tariff scheme for renewables
• Voluntary launched in July 2017• Mandatory system may be launched in 2018• Trading price in the voluntary phase capped at the level of RE
subsidy• In March 2018, the NEA announced a policy consultation draft
for RPS in order to resolve RE curtailment: Renewable power targets are set for each province, with targets sets for both a) total renewable (including hydro) and b) non-hydro renewable, for 2018 to 2020.
• Continue to monitor the opportunities and impact arise from the new policy

Mainland China – Market sales in 1H2018
46
JILIN
LIAONING
HEBEI
GANSU
SHAANXI
SICHUAN
GUIZHOU
JIANGSU
GUANGDONGGUANGXI
TIANJIN
SHANDONG
SHANGHAI
INNER MONGOLIA
Province Projects (Equity MW)
Guangxi FCG thermal (1,806MW)
Yunnan Xundian Wind (50MW) Xicun Solar (84MW) Dali Yang_er Hydro (50MW)
Sichuan Jiangbian Hydro (330MW)
Gansu Jinchang Solar (85MW)
Inner Mongolia
Zhungeer thermal (257MW)
Liaoning Suizhong thermal (564MW) Mazongshan Wind (12MW) Qujiagou Wind (12MW)
Jilin Qian’an Wind (99MW) Changling II Wind (22MW) Datong Wind (24MW) Shuangliao Wind (48MW)
Tianjin Panshan thermal (207MW)
Hebei Sanhe thermal (220MW)
Market sales are prevailing in various forms in different provinces in China. Overall
around 45% of our share of generation volumes were under market sales in 1H2018.
It is expected that market sales will continue to increase going forward
YUNNAN100% market sales
>50% market sales
>20-50% market sales
20% or less market sales
no market sales

HK$ Local Currency
1H2018 1H2017 1H2018 1H2017
HK$M HK$M Rs’M Rs’M
Thermal (Jhajjar) 246 284 2,073 2,391
Thermal (Paguthan) 121 156 1,020 1,313
Renewables 294 241 2,477 2,029
ACOI 661 681 5,570 5,733
Thermal (Jhajjar) 50 94 421 791
Thermal (Paguthan) 115 120 969 1,010
Renewables 86 28 725 236
Operating earnings 251 242 2,115 2,037
Provision for Paguthan’sdeemed generation receivables
(450) - (3,796) -
Total earnings (199) 242 (1,681) 2,037
The average foreign exchange rates used to convert Indian Segment earnings to Hong Kong dollars are 0.11878 for 1H2017 and 0.11867 for 1H2018. Note that in the ACOI variance analysis presented in the body of the presentation. 1H2017 earnings are adjusted for changes in scope and foreign exchange before year on year variance in underlying performance is illustrated.
India – Financials
47
India

▪ CLP has been investing in renewable energy in India for over a decade
▪ The renewable generation portfolio in India has been diversified with our first solar project Veltoor (100/49MW) fullycommissioned in February 2018. Lower wind capacity in 2016 & 2017 reflects the cancellation of the Yermala project
▪ India’s economic growth has softened recently, which has had a negative impact on power demand. However, weremain confident of the long-term prospects of India’s power industry
▪ The current Power Purchase Arrangement for Paguthan will end in December 2018. Discussion with off-taker isongoing for post-PPA arrangements
▪ We will continue our prudent approach in exploring new opportunities in renewable generation in support of India’sgoal of increasing the share of its clean electricity supply. In addition we are looking for growth opportunities alongthe energy supply chain including evaluating transmission and distribution opportunities
Higher renewables earnings in 1H2018 reflects contribution from Veltoor solar and one time cancellation
costs of Yermala wind development in 1H2017
Thermal Renewables
HK$M
India – Renewable Generation
48
ACOI
(1) CLP equity interest
214 165
440367
28 86
241 294
-
100
200
300
400
500
600
700
800
1H2017 1H2018 1H2017 1H2018
Operating Earnings
0
200
400
600
800
1,000
1,200
2009 2010 2011 2012 2013 2014 2015 2016 2017 June2018
MWCLP Renewable Portfolio (1) in India
Wind Under Construction - Wind Solar Under Construction - Solar
0

The average foreign exchange rates used to convert SEA & Taiwan Segment earnings to Hong Kong dollarsare 0.2251 and 0.2547 for 1H2017 and 0.2465 and 0.2647 for 1H2018 for Thai Baht and New Taiwan Dollarsrespectively. Note that in the ACOI variance analysis presented in the body of the presentation 1H2017earnings are adjusted for changes in scope and foreign exchange before year on year variance in underlyingperformance is illustrated
SEA & Taiwan
HK$ Local Currency
1H2018 1H2017 1H2018 1H2017
HK$M HK$M M M
ACOI
Thermal 42 70 NT$161 NT$276
Renewables 36 32 THB144 THB143
Operating expenditure (5) (9) - -
Development expenditure (11) (14) - -
Total 62 79
Operating earnings
Thermal 42 70 NT$161 NT$276
Renewables 36 32 THB144 THB143
Operating expenditure (5) (9) - -
Development expenditure (10) (12) - -
Total 63 81
Southeast Asia & Taiwan – Financials
49

The average foreign exchange rates used to convert Australian Segment earnings to Hong Kong dollars are 5.8977 for 1H2017 and 6.0148 for 1H2018. Note that in the ACOI variance analysis presented in the body of the presentation 1H2017 earnings are adjusted for changes in scope and foreign exchange before period on period variance in underlying performance is illustrated.
Australia
Australia – Financials
50
* Fair value adjustments have been mainly driven by moderation of wholesale prices which favourably impact contracts to sell energy, however adversely impacts our contracts to buy energy including our windfarm offtake contracts. A loss was recorded in 2017 and a gain in 2018.^ 1H2017 ACOI has been restated to reflect a change in organisational structure where Business Sales Group (BSG) customers have been reclassified from Customer to Energy.
HK$ Local Currency
1H2018 1H2017^ 1H2018 1H2017
HK$M HK$M A$M A$M
EBITDAF (before itemsaffecting comparability)
3,913 1,955 650 331
Depreciation & Amortisation (818) (605) (136) (102)
ACOI
Customer (Retail) 1,001 1,548^ 166 263^
Energy (Wholesale) 3,039 709^ 505 120^
Enterprise (Corporate) (945) (907) (157) (154)
Total 3,095 1,350 514 229
Fair value adjustments* 131 (214) 22 (36)
Net finance costs (13) (53) (2) (9)
Income tax expense (956) (325) (159) (55)
Total/Operating earnings 2,257 758 375 129

Australia – Customer Operations
1Weighted Average Mass Market is the average accounts of our mass market customer base during the yearNote: Individual items and totals are rounded to the nearest appropriate number. Some totals may not add down the page due to rounding of individual components
▪ Mass Market Customer accounts havedeclined as a result of strong competitionin the retail market reducing customeracquisitions
▪ Decreased gas sales volume due mostly tolower sales to low margin Commercial &Industrial customers
▪ EnergyAustralia continues to have belowmarket churn rates (blended acrosselectricity and gas) in the key states ofVictoria and New South Wales
51
0.0
0.5
1.0
1.5
2.0
2.5
3.0
-
5%
10%
15%
20%
25%
30%
35%
40%
45%
VIC NSW SA QLD Total
Customer Churn and Accounts (million)
Mkt Churn 1H 2017 Mkt Churn 1H 2018
EA Churn 1H 2017 EA Churn 1H 2018
Account Numbers
0%
Mass Market
Commercial & Industrial
Total Account Numbers
Weighted Average Mass Market (1)
Mass Market
Commercial & Industrial
Total Sales Volume
Sales Revenue (A$m)
9.5 19.5 9.5 26.5
2,298.3 472.5 2,003.2 473.7
5.2 14.8 5.4 15.3
4.3 4.7 4.0 11.2
Sales Volume & Revenue1H2018 1H2017
Electricity (TWh) Gas (PJ) Electricity (TWh) Gas (PJ)
2,620.7
1,701.2 862.1 2,563.3 1,773.4 877.0 2,650.4
1,714.7 867.1 2,581.8 1,754.9 865.8
15.5
1,689.1 861.8 2,550.9 1,758.3 876.5 2,634.8
12.1 0.3 12.4 15.1 0.5
Customer Account Numbers
(000s)
1H2018 1H2017
Electricity Gas Total Electricity Gas Total

Continue to Improve Customer Experience
Australia – Customer Operations
52
▪ Continue to invest to improve customer experience
including:
▪ Implementation of the new, simpler e-bill and pro-
active customer alerts
▪ Introduction of our first mobile app, which provides
customers with usage and cost information
▪ Cost to serve has increased with pressure from regulatory
changes, energy affordability issues and implementation
of Power of Choice reforms
▪ Ombudsman complaints have decreased despite
disruptive conditions across the industry
▪ Stable bad debt expense despite higher wholesale costs
which have flowed through to retail tariffs impacting
energy affordability. EnergyAustralia supports our
customers through:
▪ Removal of fees to receive paper bills and settle
accounts over-the-counter at Australia Post branches
for all our customers
▪ Introduction of a fixed rate commitment plan (Secure
Saver) which caps rates for a 2 year period
▪ Delivering initiatives through the A$10m additional
funding for our hardship programme announced in
2017
0%
20%
40%
60%
80%
100%
1H 2015 2H 2015 1H 2016 2H 2016 1H 2017 2H 2017 1H 2018
Paper Bill E-BillImproving Efficiency
0
2,000
4,000
6,000
8,000
10,000
0
20
40
60
80
100
120
1H 2015 2H 2015 1H 2016 2H 2016 1H 2017 2H 2017 1H 2018
Ombudsman Complaints
Ombudsman Complaints/10k acct (LHS) Ombudsman Complaints volumes (RHS)
0.0%
0.5%
1.0%
1.5%
2.0%
1H 2015 2H 2015 1H 2016 2H 2016 1H 2017 2H 2017 1H 2018
Performance of Bad & Doubtful Debt as % Revenue
38% reduction in Total Bad& Doubtful Debt as a % of Revenue since 1H2015

Australia – Wholesale Market Conditions
53
▪ Lower volatility reduced the cost to procure peak energy
in NSW during H1 2018
▪ After a period of very high prices reflecting shortage after
Hazelwood closing, forward prices are now moving
downwards as market prices and regulatory schemes
continue to promote renewable build
▪ Focus on our portfolio’s alignment with changing market
by:
▪ Investing in two utility scale batteries
▪ Acquired 940MW of gas fired generation capacity
at Ecogen Energy previously under contract to
EnergyAustralia
▪ Evaluating future projects that deliver flexible
capacity
▪ Demand response initiatives
▪ National Energy Guarantee (NEG) design progressing,
which will provide increased certainty on future
investment decisions
0
50
100
150
200
Jan Feb Mar Apr May Jun Jul Aug Sep Oct Nov Dec
$/MWh Average Monthly Electricity Spot Price
NSW '1H18 VIC '1H18
NSW '17 VIC '17
50
60
70
80
90
100
110
120
Q32018
Q42018
Q12019
Q22019
Q32019
Q42019
Q12020
Q22020
Q32020
Q42020
$/MWh Electricity Forward Spot Price (1)
NSW - Jun 2018 VIC - Jun 2018
1. Prices presented is the Quarterly Flat price

▪ Our Restore Value programme has positive momentum and is ahead of plan
Australia – Value Restoration
54
▪ Customer Business
▪ Improved customer service with higher transactional Net Promoter Score
▪ Introduction of mobile phone application
▪ Significant investment in retail systems
▪ Energy Business
▪ Optimising asset portfolio to support the Customer Business including battery storage, flexible capacity and demand response
▪ Initial tailwind from strong increase in wholesale prices following closure of Hazelwood. Wholesale prices likely to soften as new renewables come on line
▪ Underpinned development of around 500MW renewables
▪ EnergyAustralia will continue to drive process efficiency and invest in systems
(1): Average Invested Capital consists of net fixed assets, net working capital, equity investments and intangibles, excluding deferred tax assets & liabilities, financialassets, cash and cash equivalents, and short and long-term debt. Asset values are based on written down and post-impairment positions.(2): Return on Invested Capital = ACOI (post-nominal tax) / Invested Capital (Average). Note that ACOI is adjusted for nominal tax payable at 30%.
2014 2015 2016 2017
ACOI (before tax) 285 372 423 682
ACOI (post-nominal tax) 199 261 296 476
Invested Capital (Avg.) (1) 6,037 5,686 5,065 5,178
ROIC(2) 3.3% 4.6% 5.9% 9.2%
A$m Actuals
0%
2%
4%
6%
8%
10%
0
100
200
300
400
500
600
700
800
2014 2015 2016 2017
A$m ACOI & ROIC %
ACOI ROIC %

TaiwanHong Kong
Australia
India
Mainland China
Thailand
• Station Name Gross MW / CLP Equity MW* including capacity purchase# Solar projects in AC outputFuel Source: (c) – coal-fired (g) – gas-fired (w) – wind (h) – hydro (n) – nuclear (d) – diesel (s) – solar
20,303 Equity MW and 4,258MW Capacity Purchase (total 24,561MW)
(a) Acquisition of Ecogen (Newport and Jeeralang) was completed on 17 April.(b) Gas turbine upgrade of Black Point Power Station Unit C6 & C8.(c) Agreement reached to increase proportion of supply to HK to about 80% from 2015 to 2018, with the remainder continuing to be sold to Guangdong.(d) Shut down of Shenmu on 28 February.(e) Unit 5 of Yangjiang (1086/185MW) is qualified for commercial operation on 12 July.
CLP Group – Generation Portfolio – 30 Jun 2018
AUSTRALIA total 4,989MW*
Operational
Yallourn 1,480 / 1,480 (c)
Mount Piper 1,400 / 1,400 (c)
Hallett 203 / 203 (g)
Newport (a) 500 / 500 (g)
Jeeralang (a) 440 / 440 (g)
Tallawarra 420 / 420 (g)
Wind Projects 580 / 493* (w)
Solar Project # 50 / 50* (s)
Wilga Park 16 / 3 (g)
INDIA total 2,948 MW
Operational
Jhajjar 1,320 / 1,320 (c)
Paguthan 655 / 655 (g)
Wind Projects 924 / 924 (w)
Solar Project # 100 / 49 (s)
TAIWAN total 264 MW
Operational
Ho-Ping 1,320 / 264 (c)
THAILAND total 21 MW
Operational
Lopburi Solar # 63 / 21 (s)
HONG KONG total 7,533MW*
Operational
Castle Peak 4,108 / 4,108* (c)
Black Point(b) 2,575 / 2,575* (g)
Penny's Bay 300 / 300* (d)
Under Construction/ Committed
Black Point - D1 550 / 550* (g)
MAINLAND CHINA total 8,806* MW
Operational
Daya Bay (c) 1,968 / 1,380* (n)
Yangjiang 4,344 / 738 (n)
Pumped Storage 1,200 / 600* (h)
Fangchenggang I & II 2,580 / 1,806 (c)
SZPC 3,060 / 900 (c)
Guohua (d) 7,470 / 1,248 (c)
Hydro Projects 509 / 489 (h)
Wind Projects 1,354 / 835 (w)
Solar Projects # 275 / 275 (s)
Under Construction/ Committed
Yangjiang (e) 2,172 / 369 (n)
Wind Projects 149 / 149 (w)
Solar Project # 17 / 17 (s)
55

Australia
India
Mainland China
Thailand
Solar project (s)
Hydro projects (h)
Wind projects (w)
(a) Revised to reflect removal of one wind turbine.(b) Gannawarra Solar was commissioned in April and CLP has a PPA to purchase 50MW from the solar plant.(c) CLP India has the option to acquire the remaining 51% in the future. Remaining 6 MW of Veltoor Solar became operational in 1H2018. (d) Transfer of the remaining 49% interest to CLP was completed on 30 May. (e) Lingyuan Solar commenced commercial operation on 1 July.
2,791 Equity MW and 511MW Capacity Purchase (total 3,302MW) - 13% of CLP total generation portfolio
• Station Name Gross MW / CLP Equity MW* including capacity purchase# Solar projects in AC output
CLP Group – Renewable Generation Portfolio – 30 Jun 2018
AUSTRALIA total 543 MW*
Operational
Waterloo 111 /56*
Cathedral Rocks (a) 64 /32
Boco Rock 113 /113*
Taralga 107 /107*
Mortons Lane 20 /20*
Gullen Range 166 /166*
Gannawarra Solar # (b) 50 /50*
INDIA total 973 MW
Operational
Wind 924 MW
Solar 49 MW
Khandke 50 /50
Samana I & II 101 /101
Saundatti 72 /72
Theni I 50 /50
Theni II 50 /50
Harapanahalli 40 /40
Andhra Lake 106 /106
Sipla 50 /50
Bhakrani 102 /102
Mahidad 50 /50
Jath 60 /60
Tejuva 101 /101
Chandgarh 92 /92
Veltoor Solar # (c) 100 /49
THAILAND total 21 MW
Operational
Lopburi Solar # 63 /21
MAINLAND CHINA total 1,765 MW
Operational
Wind 835 MWHydro 489 MW
Solar 275 MWWeihai I & II 69 / 31
Nanao II & III 60 / 15
Shuangliao I & II 99 / 48
Datong 50 / 24
Laizhou I 41 / 18
Changling II 50 / 22
Guohua Wind 395 / 194
Qujiagou 50 / 12
Mazongshan 50 / 12
Qian'an I & II 99 / 99
Penglai I 48 / 48
Chongming I 48 / 14
Laiwu I & II 99 / 99
Xundian I 50 / 50Sandu I 99 / 99
CLP Laizhou I 50 / 50
Jiangbian Hydro 330 / 330
Huaiji Hydro 129 / 110
Dali Yang_er Hydro 50 / 50
Jinchang Solar #(d) 85 / 85
Xicun I & II Solar # 84 / 84
Sihong Solar # 93 / 93
Huai’an Solar # 13 / 13
Under Construction/ Committed
Wind 149 MW
Solar 17 MW
Sandu II 99 / 99
CLP Laizhou II 50 / 50
Lingyuan Solar #(e) 17 / 17
56

Capacity by
Energy Type
Total
MW
(a) + (b)
%
Operational MW
(a)
%
Under construction / Committed
MW
(b)
%
Coal 12,525 51% 12,525 51% - -
Gas 5,346 22% 4,796 20% 550 2%
Nuclear 2,488 10% 2,118 9% 369 2%
Wind 2,400 10% 2,252 9% 149 1%
Hydro 489 2% 489 2% - -
Solar 412 2% 395 2% 17 <1%
Others 900 4% 900 4% - -
Total 24,561 100% 23,476 96% 1,085 4%
24,561 MW Attributable to CLP GroupCLP Group – Generation Capacity* by Fuel Mix – 30 Jun 2018
57
* Equity basis and including capacity purchase arrangementsNote: Individual items and totals are rounded to the nearest appropriate number. Some totals may not add down the page due to rounding of individual components
(200)
-
200
400
600
800
1,000
1,200
Coal Hydro Solar Wind Gas Nuclear
Net change in Generation portfolio (2014- 2017)
Coal Hydro Solar Wind Gas Nuclear
0
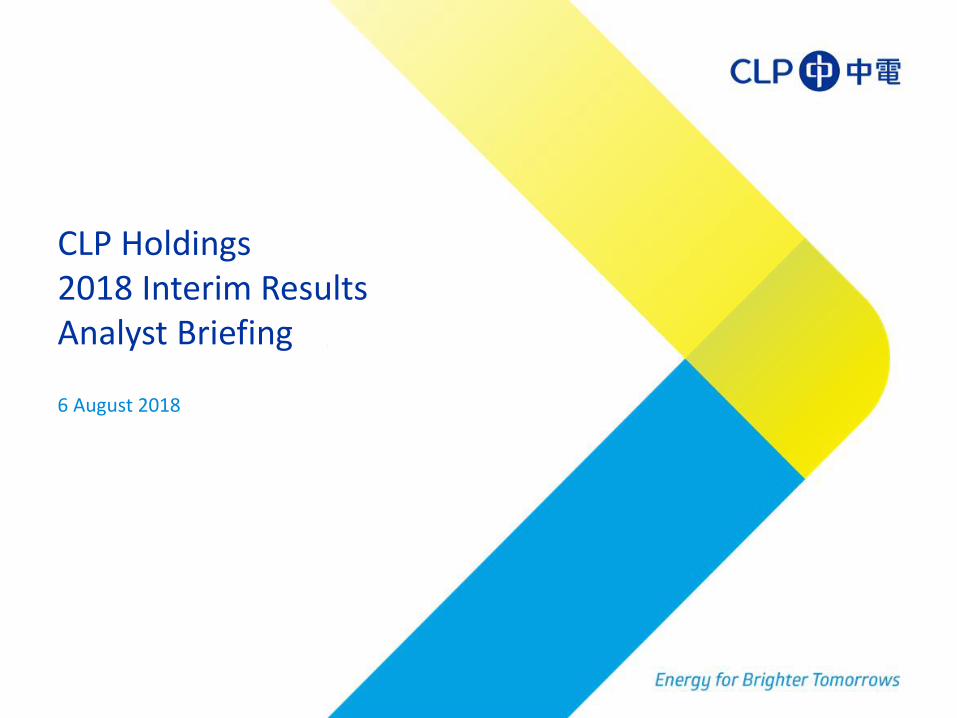
* Equity basis and including capacity purchase arrangements
CLP Group – Energy Sent Out – 1H2018
58
0.9 0.8
16.2 17.0
2.74.6
10.6 10.5
8.0
11.9
-5
0
5
10
15
20
25
30
35
40
1H2017 1H2018 1H2017 1H2018 1H2017 1H2018 1H2017 1H2018 1H2017 1H2018
Hong Kong Mainland China India Southeast Asia &Taiwan
Australia
TWh
Energy Sent Out*
Pumped Storage Nuclear Coal Gas Wind Solar Hydro Others
61%
14%
7%<1%2%
16%
63%
12%
5%
<1%1%
18%
CLP 2018 Interim Generation as Sent Out*
1H2017: 38.4 TwH1H2018: 44.7 TwH
1H2018
1H2017

Additional Resources
* To be published in mid-August 2018
59

CLP Holdings
Thank you


![[XLS] · Web viewInstrument list Symbol Code Description Exchange 00001:xhkg Cheung Kong (Holdings) Ltd Hong Kong Stock Exchange 00002:xhkg CLP Holdings Ltd Hong Kong Stock Exchange](https://img.dokumen.tips/doc/110x75/5aa315bc7f8b9a80378dd404/xls-viewinstrument-list-symbol-code-description-exchange-00001xhkg-cheung-kong.jpg)