Embed Size (px)
Citation preview
Important disclosures appear on the last page of this report.
The Henry Fund
Henry B. Tippie College of Business
Megann Bohlken [[email protected]]
Cloud Computing Industry February 12, 2020
Information Technology Industry Rating Overweight
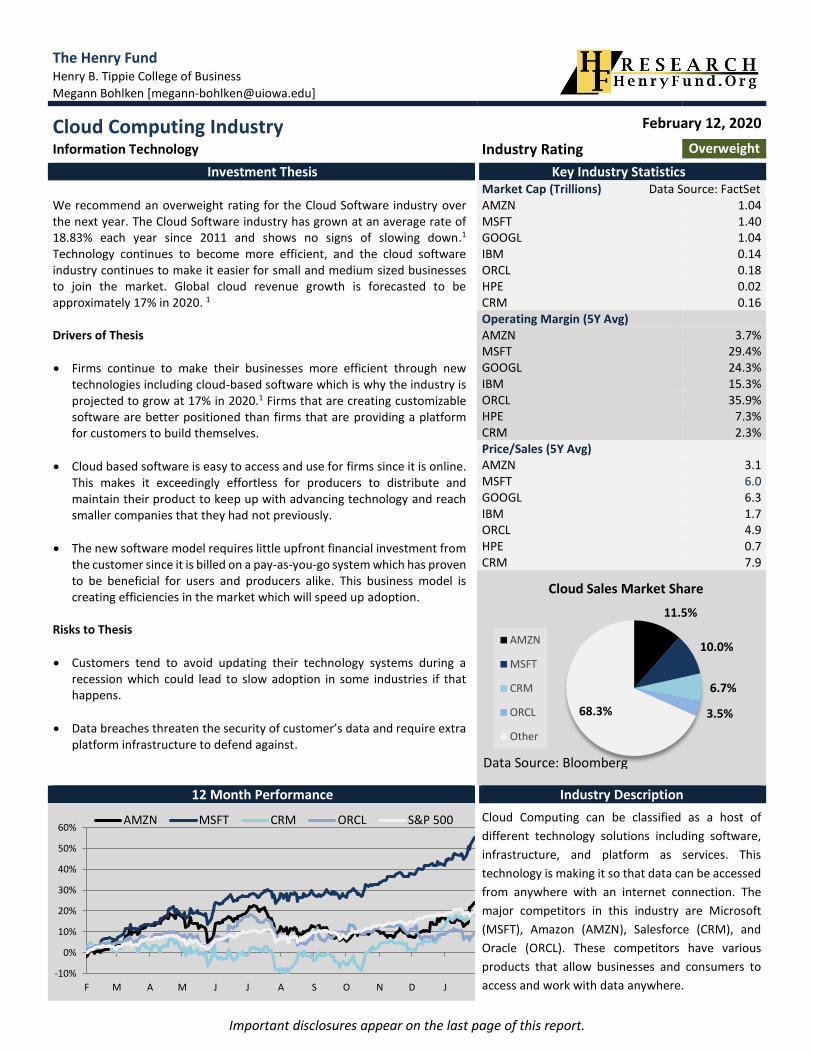
Investment Thesis Key Industry Statistics We recommend an overweight rating for the Cloud Software industry over the next year. The Cloud Software industry has grown at an average rate of 18.83% each year since 2011 and shows no signs of slowing down.1 Technology continues to become more efficient, and the cloud software industry continues to make it easier for small and medium sized businesses to join the market. Global cloud revenue growth is forecasted to be approximately 17% in 2020. 1
Drivers of Thesis
• Firms continue to make their businesses more efficient through new technologies including cloud-based software which is why the industry is projected to grow at 17% in 2020.1 Firms that are creating customizable software are better positioned than firms that are providing a platform for customers to build themselves.
• Cloud based software is easy to access and use for firms since it is online. This makes it exceedingly effortless for producers to distribute and maintain their product to keep up with advancing technology and reach smaller companies that they had not previously.
• The new software model requires little upfront financial investment from the customer since it is billed on a pay-as-you-go system which has proven to be beneficial for users and producers alike. This business model is creating efficiencies in the market which will speed up adoption.
Risks to Thesis
• Customers tend to avoid updating their technology systems during a recession which could lead to slow adoption in some industries if that happens.
• Data breaches threaten the security of customer’s data and require extra platform infrastructure to defend against.
Market Cap (Trillions) Data Source: FactSet AMZN 1.04 MSFT 1.40 GOOGL 1.04 IBM 0.14 ORCL 0.18 HPE 0.02 CRM 0.16 Operating Margin (5Y Avg) AMZN 3.7% MSFT 29.4% GOOGL 24.3% IBM 15.3% ORCL 35.9% HPE 7.3% CRM 2.3% Price/Sales (5Y Avg) AMZN 3.1 MSFT 6.0 GOOGL 6.3 IBM 1.7 ORCL 4.9 HPE 0.7 CRM 7.9
12 Month Performance Industry Description
Cloud Computing can be classified as a host of
different technology solutions including software,
infrastructure, and platform as services. This
technology is making it so that data can be accessed
from anywhere with an internet connection. The
major competitors in this industry are Microsoft
(MSFT), Amazon (AMZN), Salesforce (CRM), and
Oracle (ORCL). These competitors have various
products that allow businesses and consumers to
access and work with data anywhere.
11.5%
10.0%
6.7%
3.5%68.3%
Cloud Sales Market Share
AMZN
MSFT
CRM
ORCL
Other
-10%
0%
10%
20%
30%
40%
50%
60%
F M A M J J A S O N D J
AMZN MSFT CRM ORCL S&P 500
Data Source: Bloomberg
Page 2
EXECUTIVE SUMMARY
The Cloud Software and Computing industry is taking off due to companies obtaining, storing, and utilizing more data for optimization of their everyday business processes. The Cloud Computing and Software industry is about 19% of technology spending but it is a fast-growing segment in the overall Information Technology industry.2,3 Public cloud revenues in 2019 were $258 Billion.1 This growing industry will continue this trend as customers realize the benefits of the cloud for their business. For these reasons, we are recommending an OVERWEIGHT rating for the cloud services industry.
We believe Microsoft is best positioned to take market share in this industry over the next three years. Microsoft acquired GitHub in 2018 and became a trusted open-source platform. This has allowed them to provide software-as-a-service products and platform-as-a-service products in order to satisfy more customers. Amazon and Microsoft have the largest variety and customizable options for their customers. Companies such as Oracle and Salesforce seem relatively overvalued and offer more niche products to a smaller market making it difficult to grow beyond that market once it is saturated. The only way to increase revenue at that point would be to increase prices which is difficult in a competitive market.
Industry Description
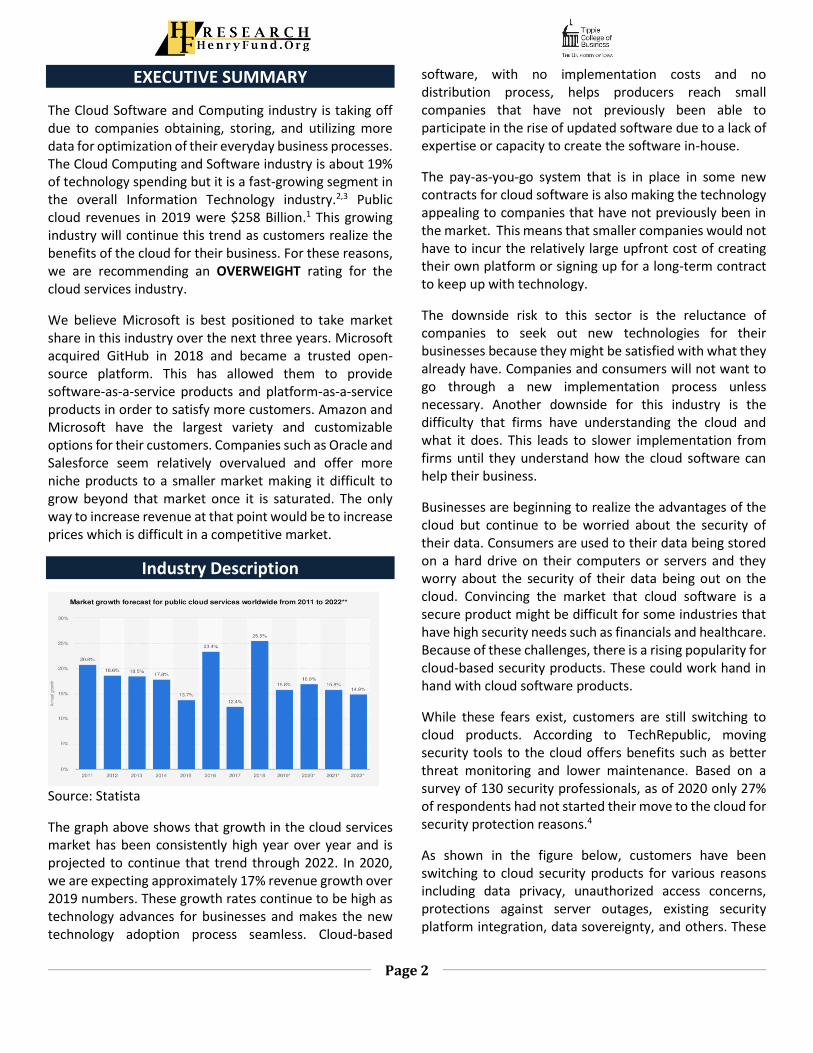
Source: Statista
The graph above shows that growth in the cloud services market has been consistently high year over year and is projected to continue that trend through 2022. In 2020, we are expecting approximately 17% revenue growth over 2019 numbers. These growth rates continue to be high as technology advances for businesses and makes the new technology adoption process seamless. Cloud-based
software, with no implementation costs and no distribution process, helps producers reach small companies that have not previously been able to participate in the rise of updated software due to a lack of expertise or capacity to create the software in-house.
The pay-as-you-go system that is in place in some new contracts for cloud software is also making the technology appealing to companies that have not previously been in the market. This means that smaller companies would not have to incur the relatively large upfront cost of creating their own platform or signing up for a long-term contract to keep up with technology.
The downside risk to this sector is the reluctance of companies to seek out new technologies for their businesses because they might be satisfied with what they already have. Companies and consumers will not want to go through a new implementation process unless necessary. Another downside for this industry is the difficulty that firms have understanding the cloud and what it does. This leads to slower implementation from firms until they understand how the cloud software can help their business.
Businesses are beginning to realize the advantages of the cloud but continue to be worried about the security of their data. Consumers are used to their data being stored on a hard drive on their computers or servers and they worry about the security of their data being out on the cloud. Convincing the market that cloud software is a secure product might be difficult for some industries that have high security needs such as financials and healthcare. Because of these challenges, there is a rising popularity for cloud-based security products. These could work hand in hand with cloud software products.
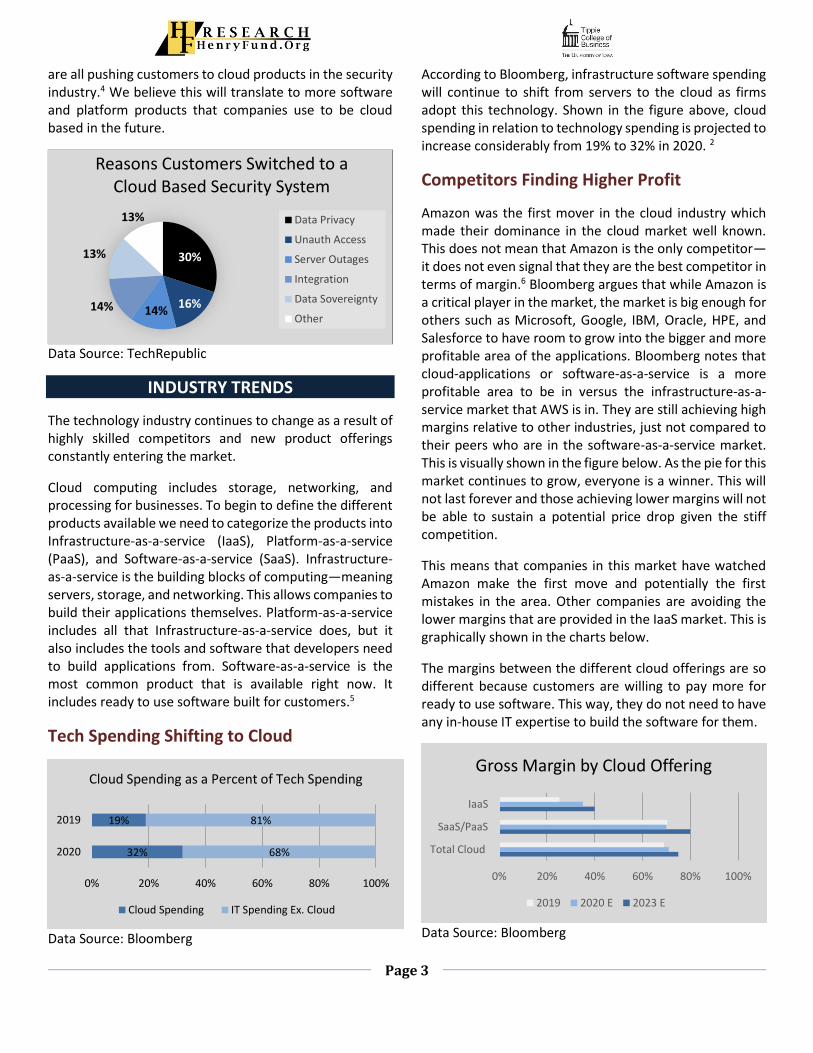
While these fears exist, customers are still switching to cloud products. According to TechRepublic, moving security tools to the cloud offers benefits such as better threat monitoring and lower maintenance. Based on a survey of 130 security professionals, as of 2020 only 27% of respondents had not started their move to the cloud for security protection reasons.4
As shown in the figure below, customers have been switching to cloud security products for various reasons including data privacy, unauthorized access concerns, protections against server outages, existing security platform integration, data sovereignty, and others. These
Page 3
are all pushing customers to cloud products in the security industry.4 We believe this will translate to more software and platform products that companies use to be cloud based in the future.
Data Source: TechRepublic
INDUSTRY TRENDS
The technology industry continues to change as a result of highly skilled competitors and new product offerings constantly entering the market.
Cloud computing includes storage, networking, and processing for businesses. To begin to define the different products available we need to categorize the products into Infrastructure-as-a-service (IaaS), Platform-as-a-service (PaaS), and Software-as-a-service (SaaS). Infrastructure-as-a-service is the building blocks of computing—meaning servers, storage, and networking. This allows companies to build their applications themselves. Platform-as-a-service includes all that Infrastructure-as-a-service does, but it also includes the tools and software that developers need to build applications from. Software-as-a-service is the most common product that is available right now. It includes ready to use software built for customers.5
Tech Spending Shifting to Cloud
Data Source: Bloomberg
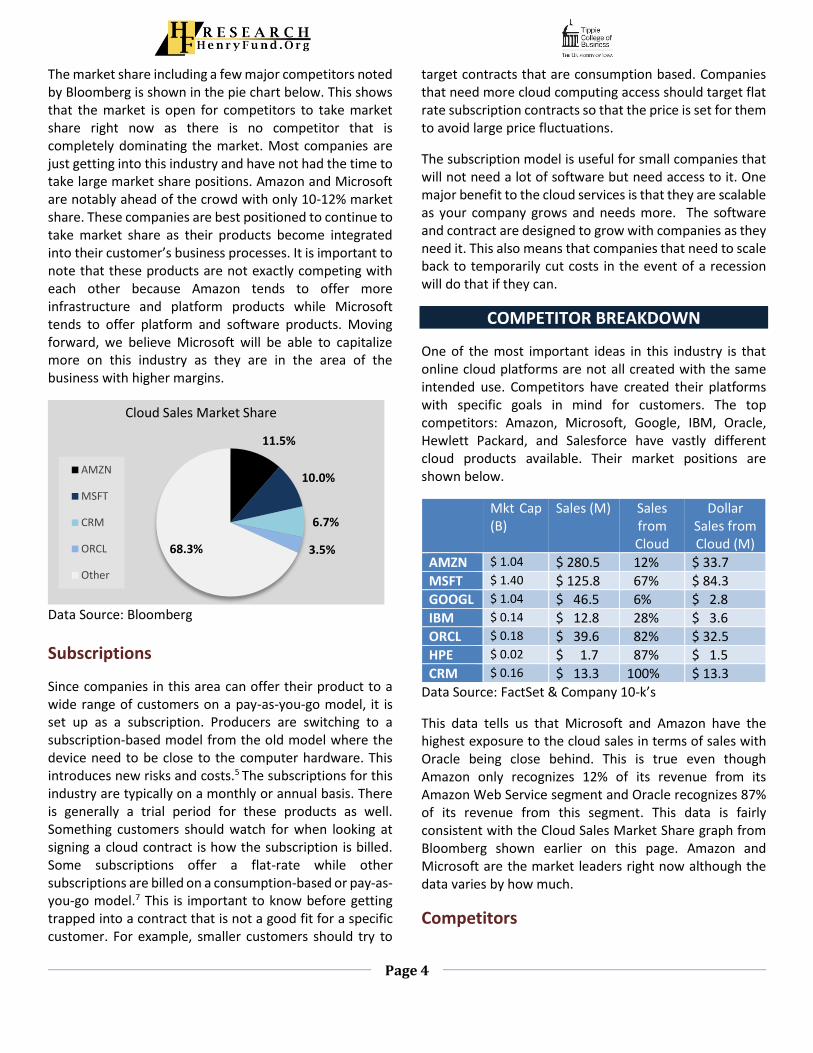
According to Bloomberg, infrastructure software spending will continue to shift from servers to the cloud as firms adopt this technology. Shown in the figure above, cloud spending in relation to technology spending is projected to increase considerably from 19% to 32% in 2020. 2
Competitors Finding Higher Profit
Amazon was the first mover in the cloud industry which made their dominance in the cloud market well known. This does not mean that Amazon is the only competitor—it does not even signal that they are the best competitor in terms of margin.6 Bloomberg argues that while Amazon is a critical player in the market, the market is big enough for others such as Microsoft, Google, IBM, Oracle, HPE, and Salesforce to have room to grow into the bigger and more profitable area of the applications. Bloomberg notes that cloud-applications or software-as-a-service is a more profitable area to be in versus the infrastructure-as-a-service market that AWS is in. They are still achieving high margins relative to other industries, just not compared to their peers who are in the software-as-a-service market. This is visually shown in the figure below. As the pie for this market continues to grow, everyone is a winner. This will not last forever and those achieving lower margins will not be able to sustain a potential price drop given the stiff competition.
This means that companies in this market have watched Amazon make the first move and potentially the first mistakes in the area. Other companies are avoiding the lower margins that are provided in the IaaS market. This is graphically shown in the charts below.
The margins between the different cloud offerings are so different because customers are willing to pay more for ready to use software. This way, they do not need to have any in-house IT expertise to build the software for them.
Data Source: Bloomberg
30%
16%14%14%
13%
13%
Reasons Customers Switched to a Cloud Based Security System
Data Privacy
Unauth Access
Server Outages
Integration
Data Sovereignty
Other
32%
19%
68%
81%
0% 20% 40% 60% 80% 100%
2020
2019
Cloud Spending as a Percent of Tech Spending
Cloud Spending IT Spending Ex. Cloud
0% 20% 40% 60% 80% 100%
Total Cloud
SaaS/PaaS
IaaS
Gross Margin by Cloud Offering
2019 2020 E 2023 E
Page 4
The market share including a few major competitors noted by Bloomberg is shown in the pie chart below. This shows that the market is open for competitors to take market share right now as there is no competitor that is completely dominating the market. Most companies are just getting into this industry and have not had the time to take large market share positions. Amazon and Microsoft are notably ahead of the crowd with only 10-12% market share. These companies are best positioned to continue to take market share as their products become integrated into their customer’s business processes. It is important to note that these products are not exactly competing with each other because Amazon tends to offer more infrastructure and platform products while Microsoft tends to offer platform and software products. Moving forward, we believe Microsoft will be able to capitalize more on this industry as they are in the area of the business with higher margins.
Data Source: Bloomberg
Subscriptions
Since companies in this area can offer their product to a wide range of customers on a pay-as-you-go model, it is set up as a subscription. Producers are switching to a subscription-based model from the old model where the device need to be close to the computer hardware. This introduces new risks and costs.5 The subscriptions for this industry are typically on a monthly or annual basis. There is generally a trial period for these products as well. Something customers should watch for when looking at signing a cloud contract is how the subscription is billed. Some subscriptions offer a flat-rate while other subscriptions are billed on a consumption-based or pay-as-you-go model.7 This is important to know before getting trapped into a contract that is not a good fit for a specific customer. For example, smaller customers should try to
target contracts that are consumption based. Companies that need more cloud computing access should target flat rate subscription contracts so that the price is set for them to avoid large price fluctuations.
The subscription model is useful for small companies that will not need a lot of software but need access to it. One major benefit to the cloud services is that they are scalable as your company grows and needs more. The software and contract are designed to grow with companies as they need it. This also means that companies that need to scale back to temporarily cut costs in the event of a recession will do that if they can.
COMPETITOR BREAKDOWN
One of the most important ideas in this industry is that online cloud platforms are not all created with the same intended use. Competitors have created their platforms with specific goals in mind for customers. The top competitors: Amazon, Microsoft, Google, IBM, Oracle, Hewlett Packard, and Salesforce have vastly different cloud products available. Their market positions are shown below.
Mkt Cap (B)
Sales (M) Sales from Cloud
Dollar Sales from Cloud (M)
AMZN $ 1.04 $ 280.5 12% $ 33.7
MSFT $ 1.40 $ 125.8 67% $ 84.3
GOOGL $ 1.04 $ 46.5 6% $ 2.8
IBM $ 0.14 $ 12.8 28% $ 3.6
ORCL $ 0.18 $ 39.6 82% $ 32.5
HPE $ 0.02 $ 1.7 87% $ 1.5
CRM $ 0.16 $ 13.3 100% $ 13.3
Data Source: FactSet & Company 10-k’s
This data tells us that Microsoft and Amazon have the highest exposure to the cloud sales in terms of sales with Oracle being close behind. This is true even though Amazon only recognizes 12% of its revenue from its Amazon Web Service segment and Oracle recognizes 87% of its revenue from this segment. This data is fairly consistent with the Cloud Sales Market Share graph from Bloomberg shown earlier on this page. Amazon and Microsoft are the market leaders right now although the data varies by how much.
Competitors
11.5%
10.0%
6.7%
3.5%68.3%
Cloud Sales Market Share
AMZN
MSFT
CRM
ORCL
Other
Page 5
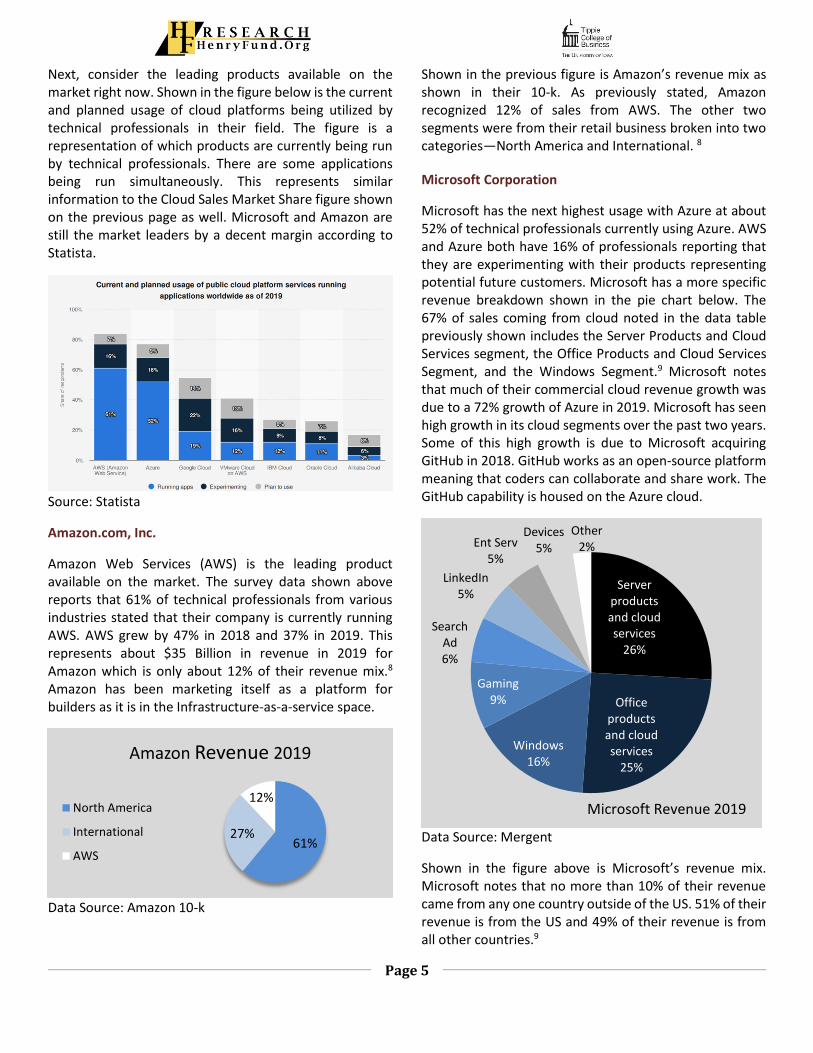
Next, consider the leading products available on the market right now. Shown in the figure below is the current and planned usage of cloud platforms being utilized by technical professionals in their field. The figure is a representation of which products are currently being run by technical professionals. There are some applications being run simultaneously. This represents similar information to the Cloud Sales Market Share figure shown on the previous page as well. Microsoft and Amazon are still the market leaders by a decent margin according to Statista.
Source: Statista
Amazon.com, Inc.
Amazon Web Services (AWS) is the leading product available on the market. The survey data shown above reports that 61% of technical professionals from various industries stated that their company is currently running AWS. AWS grew by 47% in 2018 and 37% in 2019. This represents about $35 Billion in revenue in 2019 for Amazon which is only about 12% of their revenue mix.8
Amazon has been marketing itself as a platform for builders as it is in the Infrastructure-as-a-service space.
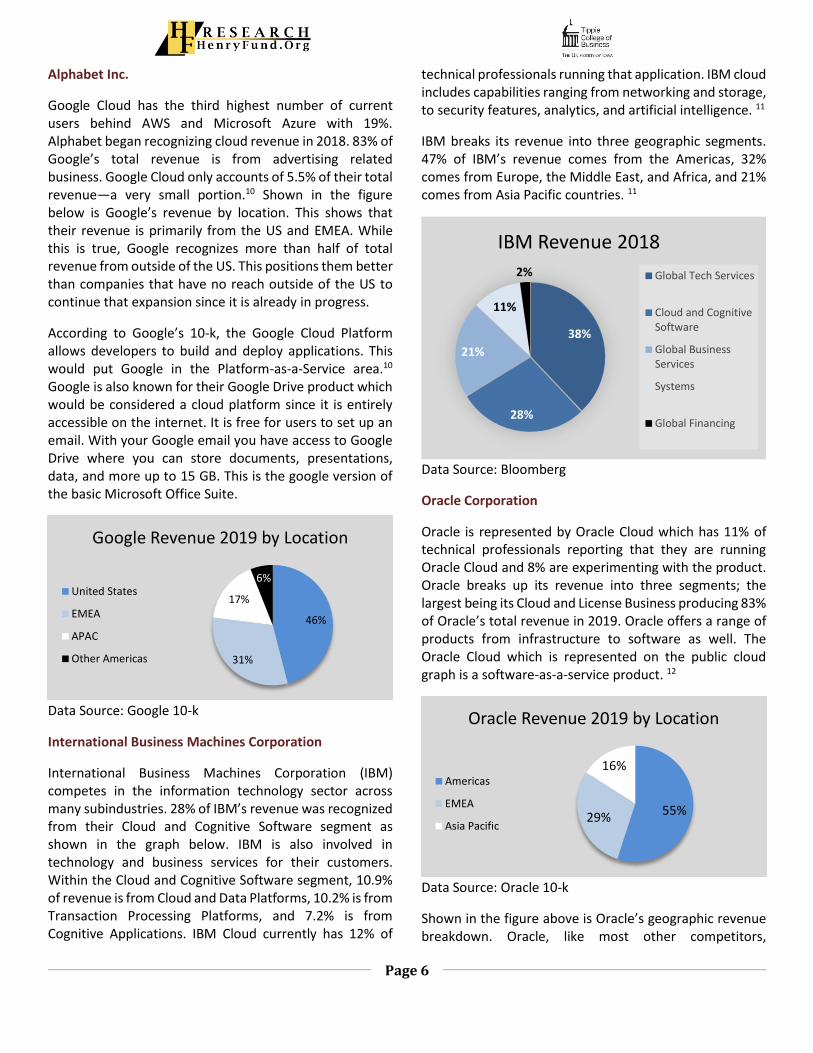
Data Source: Amazon 10-k
Shown in the previous figure is Amazon’s revenue mix as shown in their 10-k. As previously stated, Amazon recognized 12% of sales from AWS. The other two segments were from their retail business broken into two categories—North America and International. 8
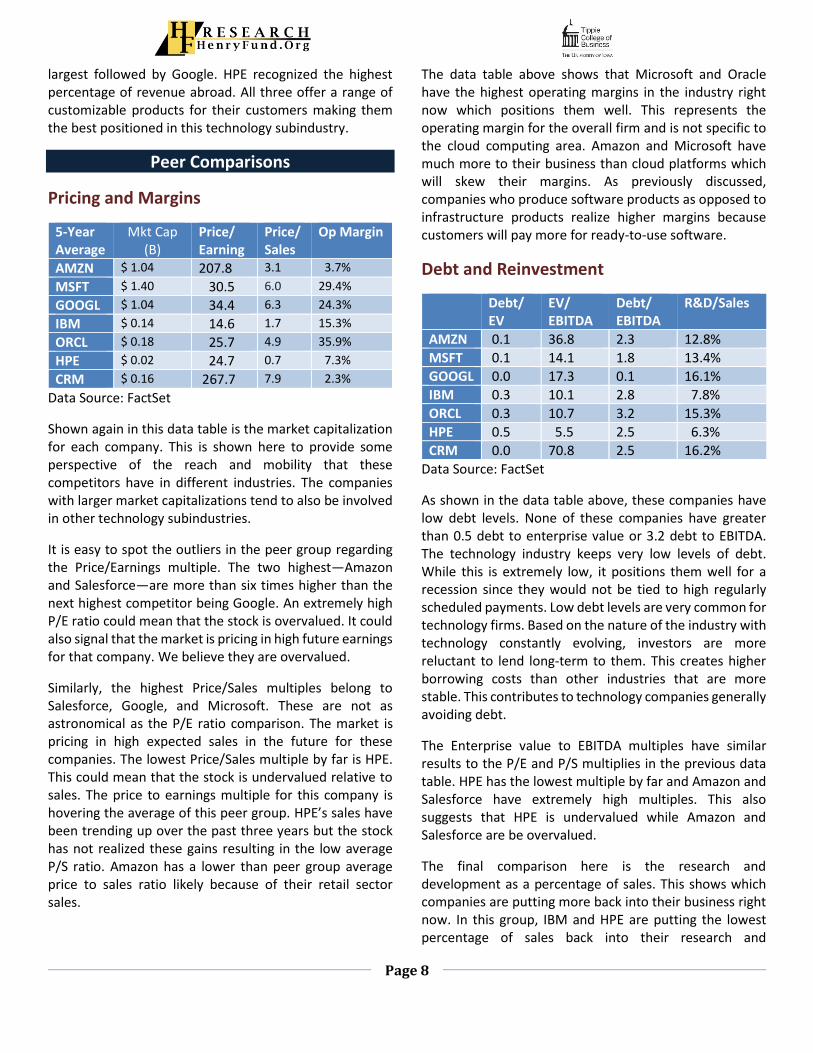
Microsoft Corporation
Microsoft has the next highest usage with Azure at about 52% of technical professionals currently using Azure. AWS and Azure both have 16% of professionals reporting that they are experimenting with their products representing potential future customers. Microsoft has a more specific revenue breakdown shown in the pie chart below. The 67% of sales coming from cloud noted in the data table previously shown includes the Server Products and Cloud Services segment, the Office Products and Cloud Services Segment, and the Windows Segment.9 Microsoft notes that much of their commercial cloud revenue growth was due to a 72% growth of Azure in 2019. Microsoft has seen high growth in its cloud segments over the past two years. Some of this high growth is due to Microsoft acquiring GitHub in 2018. GitHub works as an open-source platform meaning that coders can collaborate and share work. The GitHub capability is housed on the Azure cloud.
Data Source: Mergent
Shown in the figure above is Microsoft’s revenue mix. Microsoft notes that no more than 10% of their revenue came from any one country outside of the US. 51% of their revenue is from the US and 49% of their revenue is from all other countries.9
61%27%
12%
Amazon Revenue 2019
North America
International
AWS
Server products and cloud services
26%
Office products and cloud services
25%
Windows 16%
Gaming 9%
Search Ad6%
LinkedIn 5%
Ent Serv5%
Devices 5%
Other 2%
Microsoft Revenue 2019
Page 6
Alphabet Inc.
Google Cloud has the third highest number of current users behind AWS and Microsoft Azure with 19%. Alphabet began recognizing cloud revenue in 2018. 83% of Google’s total revenue is from advertising related business. Google Cloud only accounts of 5.5% of their total revenue—a very small portion.10 Shown in the figure below is Google’s revenue by location. This shows that their revenue is primarily from the US and EMEA. While this is true, Google recognizes more than half of total revenue from outside of the US. This positions them better than companies that have no reach outside of the US to continue that expansion since it is already in progress.
According to Google’s 10-k, the Google Cloud Platform allows developers to build and deploy applications. This would put Google in the Platform-as-a-Service area.10 Google is also known for their Google Drive product which would be considered a cloud platform since it is entirely accessible on the internet. It is free for users to set up an email. With your Google email you have access to Google Drive where you can store documents, presentations, data, and more up to 15 GB. This is the google version of the basic Microsoft Office Suite.
Data Source: Google 10-k
International Business Machines Corporation
International Business Machines Corporation (IBM) competes in the information technology sector across many subindustries. 28% of IBM’s revenue was recognized from their Cloud and Cognitive Software segment as shown in the graph below. IBM is also involved in technology and business services for their customers. Within the Cloud and Cognitive Software segment, 10.9% of revenue is from Cloud and Data Platforms, 10.2% is from Transaction Processing Platforms, and 7.2% is from Cognitive Applications. IBM Cloud currently has 12% of
technical professionals running that application. IBM cloud includes capabilities ranging from networking and storage, to security features, analytics, and artificial intelligence. 11
IBM breaks its revenue into three geographic segments. 47% of IBM’s revenue comes from the Americas, 32% comes from Europe, the Middle East, and Africa, and 21% comes from Asia Pacific countries. 11
Data Source: Bloomberg
Oracle Corporation
Oracle is represented by Oracle Cloud which has 11% of technical professionals reporting that they are running Oracle Cloud and 8% are experimenting with the product. Oracle breaks up its revenue into three segments; the largest being its Cloud and License Business producing 83% of Oracle’s total revenue in 2019. Oracle offers a range of products from infrastructure to software as well. The Oracle Cloud which is represented on the public cloud graph is a software-as-a-service product. 12
Data Source: Oracle 10-k
Shown in the figure above is Oracle’s geographic revenue breakdown. Oracle, like most other competitors,
46%
31%
17%
6%
Google Revenue 2019 by Location
United States
EMEA
APAC
Other Americas
38%
28%
21%
11%
2%
IBM Revenue 2018
Global Tech Services
Cloud and CognitiveSoftware
Global BusinessServices
Systems
Global Financing
55%29%
16%
Oracle Revenue 2019 by Location
Americas
EMEA
Asia Pacific

Page 7
recognizes most of its revenue from the Americas.12 Oracle is similarly positioned with most of the peer group in this way.
Hewlett Packard Enterprise Co.
Hewlett Packard Enterprise (HPE) recognizes 87.6% of revenue from cloud software related business. 77.7% of that revenue results from their Hybrid IT segment.13 This includes computing and storage products that are in the infrastructure industry. These products offer artificial intelligence capabilities. Their Intelligent Edge segment makes up 9.9% of total revenue. This includes cloud solutions as well. The last 12.5% of Hewlett Packard revenue comes from their Financial Services segment. 13 HPE is not included on the cloud industry figure above. This is likely because they are a smaller company in relation to the technology giants that are included. HPE is included as a competitor in this industry because of the high percentage of Hewlett Packard sales coming from the cloud industry.
Data Source: HPE 10-k
HPE recognizes the lowest percentage of revenue from the Americas compared to its competitors. This means that HPE is the best positioned on a percentage of revenue basis to take market share abroad. While this is true, HPE also has the lowest market capitalization and sales of the peer group. Their reach is not as far as some of the technology giants in this peer group because of this. They are just a smaller company.
Salesforce.com, Inc.
Salesforce is not represented on the above graph—this might be because Salesforce is not big enough in the overall cloud services industry as well. While it is not included in the above figure, similar to HPE, a large
percentage of Salesforce revenue comes from the cloud. In this case it is 100% of revenue. Salesforce offers a few very targeted products including Sales Cloud, Service Cloud, Marketing and Commerce Cloud, and Salesforce Platform represented in the below pie chart. This range of Infrastructure to Software products allow Salesforce to be involved in all segments of the market in the niche sales and marketing industry. Shown below is a pie chart representing the percentage of revenue that each cloud service produces for Salesforce.14 This shows that the Sales Cloud portion of their revenue is the largest portion, but the four revenue streams are fairly evenly distributed overall. This shows that they are well diversified across their platforms and well positioned in the sales and marketing subindustry. Salesforce realized 71% of their total revenues from the Americas. Europe accounted for 19% and Asia Pacific countries accounted for 10%. 14 Of the competitors, Salesforce is recognizing the highest percentage of revenue from the Americas. This means that they have considerable work to do to expand internationally.
Data Source: Salesforce 10-k
Summary
These companies are the leading competitors in the cloud industry. Companies that offer the most customizable contracts, software, and platforms are the best positioned. There is no one-size-fits-all software for every customer. Software and platform products offer the highest margin for competitors. This positions them well to put more back into their software in terms of capital expenditure and research and development. This would allow them to improve their product. Companies with wide geographic exposure will do better as international companies will be able to provide their product to more customers. We believe that the best positioned companies include Microsoft, HPE, and Google. Of these, Microsoft is the
39%
37%
23%
HPE Revenue 2019 by Location
Americas
EMEA
Asia Pacific
32.5%
29.2%
23.0%
15.3%
Salesforce Revenue 2019
Sales Cloud
Service Cloud
Salesforce Platform
Marketing andCommerce Cloud
Page 8
largest followed by Google. HPE recognized the highest percentage of revenue abroad. All three offer a range of customizable products for their customers making them the best positioned in this technology subindustry.
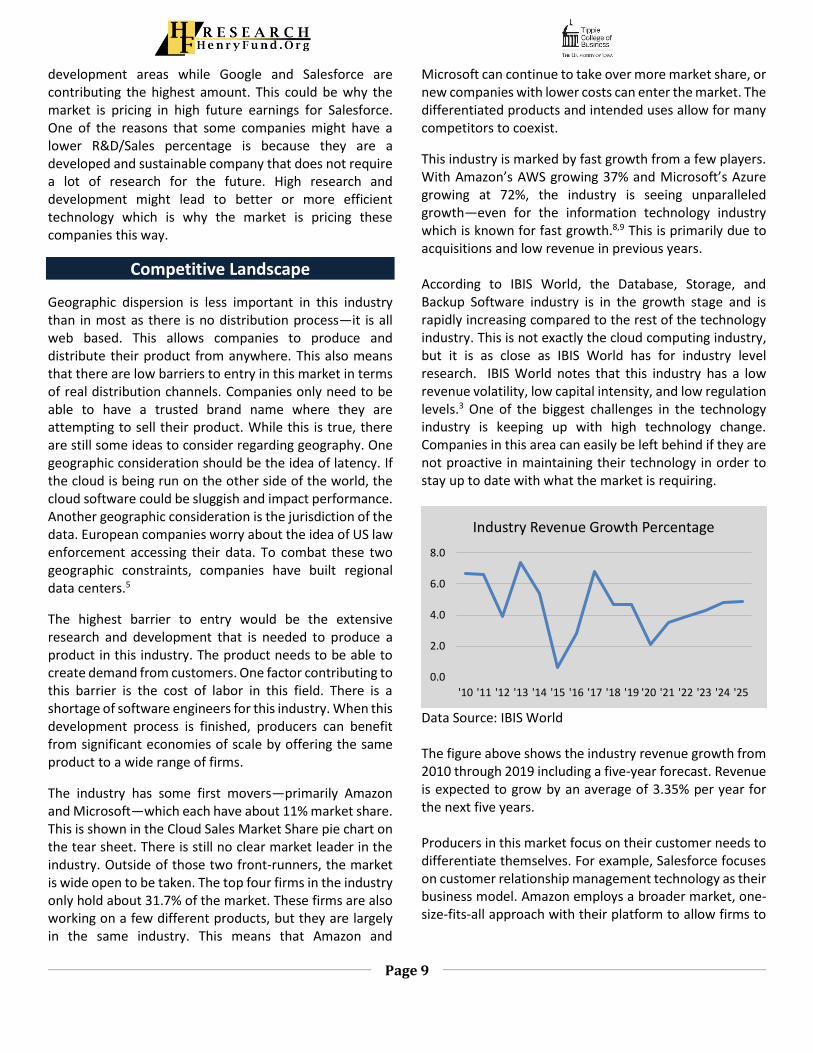
Peer Comparisons
Pricing and Margins
5-Year Average
Mkt Cap (B)
Price/ Earning
Price/Sales
Op Margin
AMZN $ 1.04 207.8 3.1 3.7%
MSFT $ 1.40 30.5 6.0 29.4%
GOOGL $ 1.04 34.4 6.3 24.3%
IBM $ 0.14 14.6 1.7 15.3%
ORCL $ 0.18 25.7 4.9 35.9%
HPE $ 0.02 24.7 0.7 7.3%
CRM $ 0.16 267.7 7.9 2.3%
Data Source: FactSet
Shown again in this data table is the market capitalization for each company. This is shown here to provide some perspective of the reach and mobility that these competitors have in different industries. The companies with larger market capitalizations tend to also be involved in other technology subindustries.
It is easy to spot the outliers in the peer group regarding the Price/Earnings multiple. The two highest—Amazon and Salesforce—are more than six times higher than the next highest competitor being Google. An extremely high P/E ratio could mean that the stock is overvalued. It could also signal that the market is pricing in high future earnings for that company. We believe they are overvalued.
Similarly, the highest Price/Sales multiples belong to Salesforce, Google, and Microsoft. These are not as astronomical as the P/E ratio comparison. The market is pricing in high expected sales in the future for these companies. The lowest Price/Sales multiple by far is HPE. This could mean that the stock is undervalued relative to sales. The price to earnings multiple for this company is hovering the average of this peer group. HPE’s sales have been trending up over the past three years but the stock has not realized these gains resulting in the low average P/S ratio. Amazon has a lower than peer group average price to sales ratio likely because of their retail sector sales.
The data table above shows that Microsoft and Oracle have the highest operating margins in the industry right now which positions them well. This represents the operating margin for the overall firm and is not specific to the cloud computing area. Amazon and Microsoft have much more to their business than cloud platforms which will skew their margins. As previously discussed, companies who produce software products as opposed to infrastructure products realize higher margins because customers will pay more for ready-to-use software.
Debt and Reinvestment
Debt/ EV
EV/ EBITDA
Debt/ EBITDA
R&D/Sales
AMZN 0.1 36.8 2.3 12.8%
MSFT 0.1 14.1 1.8 13.4%
GOOGL 0.0 17.3 0.1 16.1%
IBM 0.3 10.1 2.8 7.8%
ORCL 0.3 10.7 3.2 15.3%
HPE 0.5 5.5 2.5 6.3%
CRM 0.0 70.8 2.5 16.2%
Data Source: FactSet
As shown in the data table above, these companies have low debt levels. None of these companies have greater than 0.5 debt to enterprise value or 3.2 debt to EBITDA. The technology industry keeps very low levels of debt. While this is extremely low, it positions them well for a recession since they would not be tied to high regularly scheduled payments. Low debt levels are very common for technology firms. Based on the nature of the industry with technology constantly evolving, investors are more reluctant to lend long-term to them. This creates higher borrowing costs than other industries that are more stable. This contributes to technology companies generally avoiding debt.
The Enterprise value to EBITDA multiples have similar results to the P/E and P/S multiplies in the previous data table. HPE has the lowest multiple by far and Amazon and Salesforce have extremely high multiples. This also suggests that HPE is undervalued while Amazon and Salesforce are be overvalued.
The final comparison here is the research and development as a percentage of sales. This shows which companies are putting more back into their business right now. In this group, IBM and HPE are putting the lowest percentage of sales back into their research and
Page 9
development areas while Google and Salesforce are contributing the highest amount. This could be why the market is pricing in high future earnings for Salesforce. One of the reasons that some companies might have a lower R&D/Sales percentage is because they are a developed and sustainable company that does not require a lot of research for the future. High research and development might lead to better or more efficient technology which is why the market is pricing these companies this way.
Competitive Landscape
Geographic dispersion is less important in this industry than in most as there is no distribution process—it is all web based. This allows companies to produce and distribute their product from anywhere. This also means that there are low barriers to entry in this market in terms of real distribution channels. Companies only need to be able to have a trusted brand name where they are attempting to sell their product. While this is true, there are still some ideas to consider regarding geography. One geographic consideration should be the idea of latency. If the cloud is being run on the other side of the world, the cloud software could be sluggish and impact performance. Another geographic consideration is the jurisdiction of the data. European companies worry about the idea of US law enforcement accessing their data. To combat these two geographic constraints, companies have built regional data centers.5
The highest barrier to entry would be the extensive research and development that is needed to produce a product in this industry. The product needs to be able to create demand from customers. One factor contributing to this barrier is the cost of labor in this field. There is a shortage of software engineers for this industry. When this development process is finished, producers can benefit from significant economies of scale by offering the same product to a wide range of firms.
The industry has some first movers—primarily Amazon and Microsoft—which each have about 11% market share. This is shown in the Cloud Sales Market Share pie chart on the tear sheet. There is still no clear market leader in the industry. Outside of those two front-runners, the market is wide open to be taken. The top four firms in the industry only hold about 31.7% of the market. These firms are also working on a few different products, but they are largely in the same industry. This means that Amazon and
Microsoft can continue to take over more market share, or new companies with lower costs can enter the market. The differentiated products and intended uses allow for many competitors to coexist.
This industry is marked by fast growth from a few players. With Amazon’s AWS growing 37% and Microsoft’s Azure growing at 72%, the industry is seeing unparalleled growth—even for the information technology industry which is known for fast growth.8,9 This is primarily due to acquisitions and low revenue in previous years. According to IBIS World, the Database, Storage, and Backup Software industry is in the growth stage and is rapidly increasing compared to the rest of the technology industry. This is not exactly the cloud computing industry, but it is as close as IBIS World has for industry level research. IBIS World notes that this industry has a low revenue volatility, low capital intensity, and low regulation levels.3 One of the biggest challenges in the technology industry is keeping up with high technology change. Companies in this area can easily be left behind if they are not proactive in maintaining their technology in order to stay up to date with what the market is requiring.
Data Source: IBIS World The figure above shows the industry revenue growth from 2010 through 2019 including a five-year forecast. Revenue is expected to grow by an average of 3.35% per year for the next five years. Producers in this market focus on their customer needs to differentiate themselves. For example, Salesforce focuses on customer relationship management technology as their business model. Amazon employs a broader market, one-size-fits-all approach with their platform to allow firms to
0.0
2.0
4.0
6.0
8.0
'10 '11 '12 '13 '14 '15 '16 '17 '18 '19 '20 '21 '22 '23 '24 '25
Industry Revenue Growth Percentage
Page 10
customize and build products on their own using the platform and infrastructure.
Porter’s Five Forces
Porter’s five forces impact every industry differently. The cloud computing industry is a new industry in the commercial space which is driving how the competitors in the market interact. There is a high threat of new entrants in this market because there is no clear market leader and it is not extremely expensive to distribute a built product. Differentiated products allow companies to grab different pieces of the market. Firms have various needs that are being met by competitors differently. IBIS World notes that there are medium barriers to entry. This is because of skilled labor scarcity and high technology maintenance and investment.3 We believe that when companies reach the point of creating large economies of scale, this will be a much harder market to enter. Since firms have changing needs, they can substitute with other platforms that better suit them as they feel fit. This means that there is a high threat of substitutes. The threat of changing platforms between competitors drops dramatically when a firm has been using the platform long enough to have their business processes all integrated into the platform. Changing platforms at that point would end up being time consuming and inefficient. Firms would carefully consider this decision and it would take a significant reason to switch. 3
Right now, there is no clear market leader. This means that buyers have a decent amount of bargaining power. Cloud computing prices are falling because of stiff competition between large producers.6 Rivalry among existing competitors is high in this industry.3 Companies in this industry should be prepared for new entrants and continue to make large investments to capitalize on market share. Amazon, Microsoft, and Google are best prepared to make large investments and take market share in this industry.
ECONOMIC OUTLOOK
The technology industry is particularly sensitive to how well the market is doing. Firms will not want to be making any major changes during a recession for fear of extra
costs and further slowdown of productivity when they are often already at capacity. While this is true, the cloud computing subindustry should be a way for companies to save money as they would not require the same infrastructure as in-house technology systems.
Coronavirus
The market started the year off well until the Coronavirus scared consumers into a bit of a slowdown through the end of January. We do not believe that this will be cause for concern through the end of the year but if it does continue, technology spending might be one of the first things to feel that pullback as customers will not want to make any major moves that they don’t have to during this time. Bloomberg predicts that the pace of shifting from servers to the cloud could slow down if we do see a recession.15 We believe this is because this spending would be considered discretionary for companies. This would negatively impact the industry in the short-term by delaying companies switching from in house software to cloud based software products.
Yield Curve
The yield curve flattening over the last six months has spooked the markets considerably but does not seem to be signaling for anything in the very near future. The ten year and three-month yield curve did just invert again in late January and early February. This is an indicator to continue to watch but is not currently impacting the cloud computing market as there is not high debt levels and is therefore not impacting the weighted average cost of capital as much for these companies as it would for other industries.
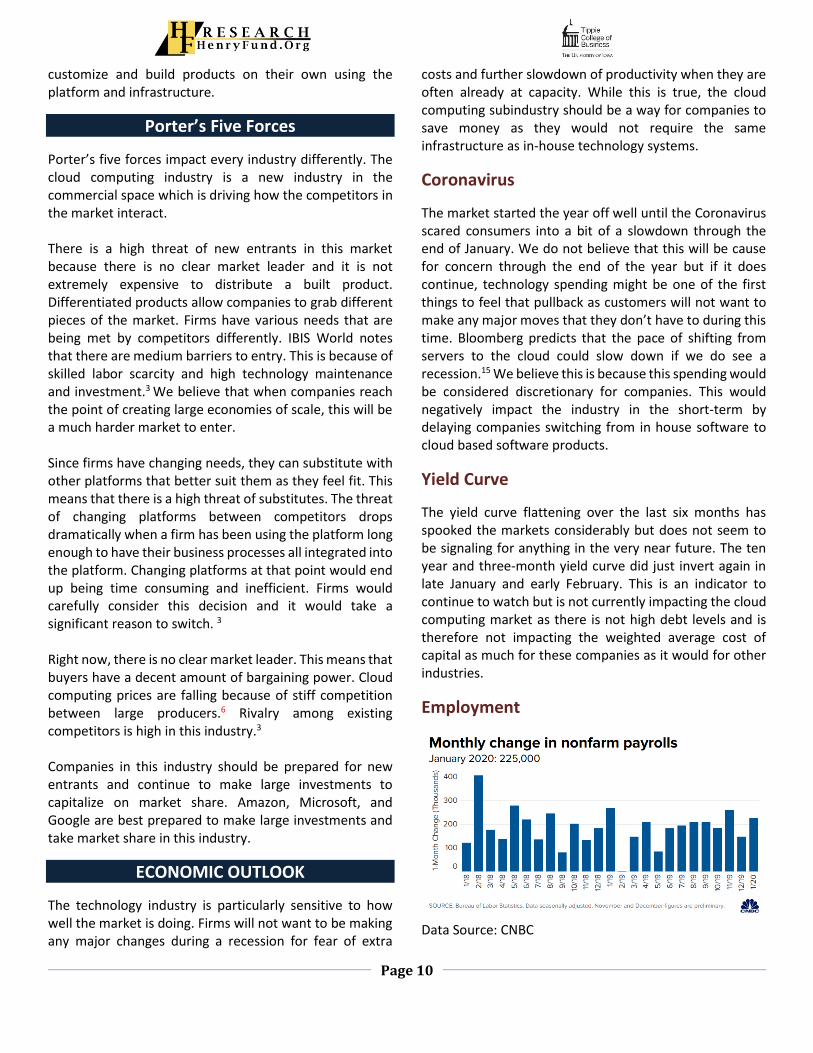
Employment
Data Source: CNBC
Page 11
The January job report came out well above the estimated numbers with 225,000 non-farm payrolls being added to the economy. The unemployment rate went up slightly to 3.6% as a result of the labor force participation increasing. CNBC attributes this to the mild weather that we have had in January.16 This signals that the market is currently in a high growth stage—even above what the market thought since more jobs were added than the upper bound of the consensus estimate. We believe that unemployment will continue this trend of lowering unemployment but at a slower rate. The unemployment rate will eventually reach a level where it cannot go much lower. The technology industry is not experiencing the same employment situation as the overall economy. This is largely because these companies require highly skilled labor in a very specified field. We believe that as demand for these employees increases, wages will increase, and more employees will be drawn to the field.
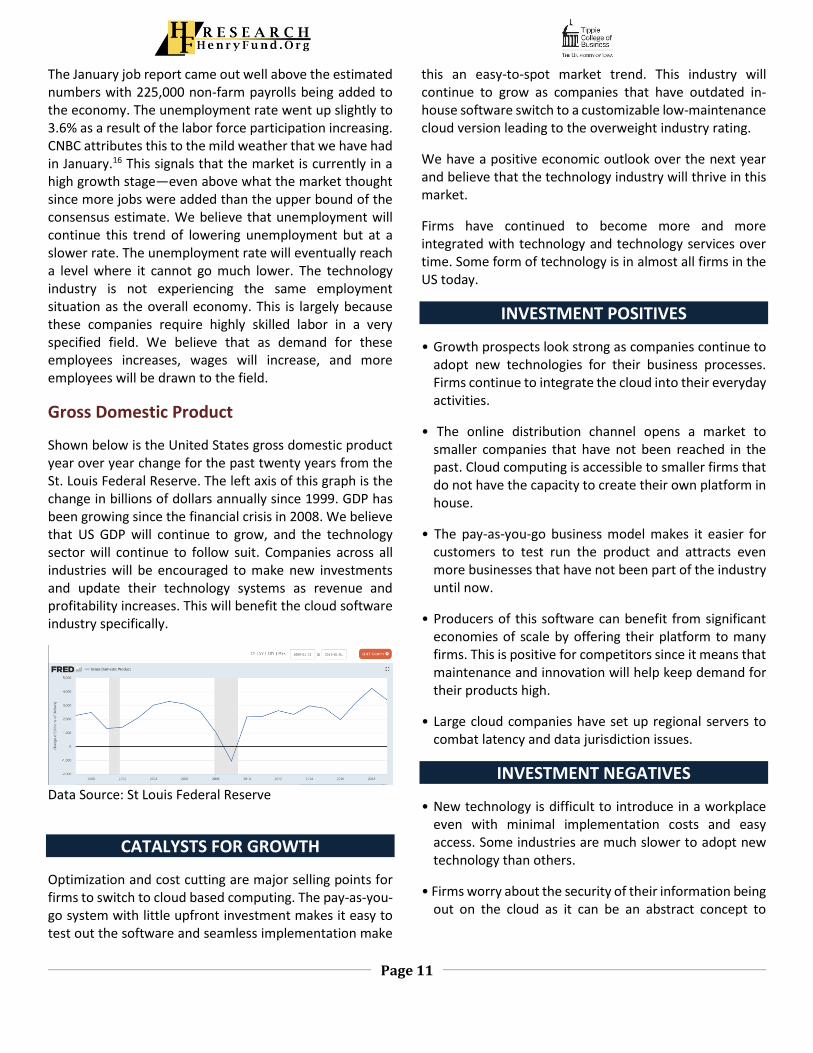
Gross Domestic Product
Shown below is the United States gross domestic product year over year change for the past twenty years from the St. Louis Federal Reserve. The left axis of this graph is the change in billions of dollars annually since 1999. GDP has been growing since the financial crisis in 2008. We believe that US GDP will continue to grow, and the technology sector will continue to follow suit. Companies across all industries will be encouraged to make new investments and update their technology systems as revenue and profitability increases. This will benefit the cloud software industry specifically.
Data Source: St Louis Federal Reserve
CATALYSTS FOR GROWTH
Optimization and cost cutting are major selling points for firms to switch to cloud based computing. The pay-as-you-go system with little upfront investment makes it easy to test out the software and seamless implementation make
this an easy-to-spot market trend. This industry will continue to grow as companies that have outdated in-house software switch to a customizable low-maintenance cloud version leading to the overweight industry rating.
We have a positive economic outlook over the next year and believe that the technology industry will thrive in this market.
Firms have continued to become more and more integrated with technology and technology services over time. Some form of technology is in almost all firms in the US today.
INVESTMENT POSITIVES
• Growth prospects look strong as companies continue to adopt new technologies for their business processes. Firms continue to integrate the cloud into their everyday activities.
• The online distribution channel opens a market to smaller companies that have not been reached in the past. Cloud computing is accessible to smaller firms that do not have the capacity to create their own platform in house.
• The pay-as-you-go business model makes it easier for customers to test run the product and attracts even more businesses that have not been part of the industry until now.
• Producers of this software can benefit from significant economies of scale by offering their platform to many firms. This is positive for competitors since it means that maintenance and innovation will help keep demand for their products high.
• Large cloud companies have set up regional servers to combat latency and data jurisdiction issues.
INVESTMENT NEGATIVES
• New technology is difficult to introduce in a workplace even with minimal implementation costs and easy access. Some industries are much slower to adopt new technology than others.
• Firms worry about the security of their information being out on the cloud as it can be an abstract concept to
Page 12
understand and trust. This may result in increased cybersecurity investment instead.
• The upfront investment by firms in this industry to create the platforms and software necessary for the market will eventually start squeezing out smaller competitors and there will be less competition.
KEYS TO MONITOR
The economy entering a recession will hurt this industry as firms will be less likely to make changes to their business processes during a recession. The only way firms will make changes is if they know that the changes will optimize processes in order to cut costs.
Watch for server-based solutions that are cheaper than the current server solutions. This might attract firms that do not yet trust the cloud computing system but would switch to a different server system.
REFERENCES
1. Statista -Link Source 2. Bloomberg- Global Infrastructure Software 2020
Outlook 3. IBIS World- Link Source 4. Techrepublic- Security 5. ZDNet- What is cloud computing? Everything you need
to know about the cloud, explained Link Source 6. Bloomberg- Amazon Cloud Dominance Overblown in
Crowded Market 7. Techtarget.com- Subscriptions 8. Amazon 10-k 2019- Link Source 9. Microsoft 10-k 2019- Link Source 10. Alphabet 10-k 2019- Link Source 11. IBM 10-k 2019- Link Source 12. Oracle 10-k 2019- Link Source 13. HPE 10-k 2019- Link Source 14. Salesforce 10-k 2019- Link Source 15. Bloomberg- Coronavirus Scare Could Temper
Enterprise IT Spending 16. CNBC- Link Source 17. Chart/Table Data Sources
a) Bloomberg b) Yahoo Finance c) Statista d) Mergent e) St Louis Federal Reserve
IMPORTANT DISCLAIMER
Henry Fund reports are created by graduate students enrolled in the Applied Securities Management program at the University of Iowa’s Tippie College of Business. These reports provide potential employers and other interested parties an example of the analytical skills, investment knowledge, and communication abilities of our students. Henry Fund analysts are not registered investment advisors, brokers or officially licensed financial professionals. The investment opinion contained in this report does not represent an offer or solicitation to buy or sell any of the aforementioned securities. Unless otherwise noted, facts and figures included in this report are from publicly available sources. This report is not a complete compilation of data, and its accuracy is not guaranteed. From time to time, the University of Iowa, its faculty, staff, students, or the Henry Fund may hold an investment position in the companies mentioned in this report.