Embed Size (px)
Citation preview
C
CI
a
ARR1AA
KSSMMmSG
1
aodttudtCittattc
bhts
0d
Journal of Process Control 22 (2012) 72– 81
Contents lists available at SciVerse ScienceDirect
Journal of Process Control
j ourna l ho me pag e: www.elsev ier .com/ locate / jprocont
losed-loop control of crystal shape in cooling crystallization of l-glutamic acid
hao Y. Ma, Xue Z. Wang ∗
nstitute of Particle Science and Engineering, School of Process, Environmental and Materials Engineering, University of Leeds, Leeds LS2 9JT, UK
r t i c l e i n f o
rticle history:eceived 24 April 2011eceived in revised form4 September 2011ccepted 6 October 2011vailable online 23 November 2011
eywords:
a b s t r a c t
Recent simulation research has proved the principle that it is possible to exercise closed-loop controlover the particle shape of the crystals produced from cooling crystallisation processes through trackingan optimum temperature or supersaturation profile which can be obtained through optimisation usinga morphological population balance (M-PB) model. Here, attention is given to experimentally designinga closed-loop control system on a real crystallisation process to produce the desired shape for rod-like crystals. An optimization algorithm was applied to an M-PB model developed for l-glutamic acidcrystallisation to find the optimal profiles of cooling temperature and supersaturation that lead to the
hape distribution controleeded batch cooling crystallisationorphological population balance modelulti-dimensional population balanceodel
upersaturation control
desired shape of �-form rod-like product crystals. A closed-loop feedback control system was designed tocontrol the solution temperature or concentration to track the optimum trajectory. On a 1-l crystalliser,it was demonstrated that crystals of different shape can be obtained using the developed closed-loopcontrol methodology. Both supersaturation control and temperature control are compared with eachother, and also with constant supersaturation strategy in performance in achieving the final productshape.
lutamic acid
. Introduction
The size of crystals or the crystal size distribution (CSD) isn important property that defines to a great extent the qualityf the crystal product. However, it is not possible to rationallyiscuss the size of a particle or any distribution associated withhe sizes of a collection of particles without firstly consideringhe three-dimensional characteristics of the particle itself because,ltimately, the size of a particle is expressed in terms of linearimension characteristics derived from its shape. In several indus-rial applications, to express the physical properties of the crystals,SD solely has been used with success [1], nevertheless, in many
nstances, problems arise when the desired CSD is obtained but dueo morphological characteristics the performance of the bulk crys-al product is poor [2]. For example, about 90% of newly marketedctive pharmaceutical ingredient (API) shows reduced efficacy dueo poor dissolution in water and the dissolution rate of drug crys-als depends on its shape [3]. Hence, rigorous characterization andontrol of crystal shape is needed.
Closed-loop control of crystal shape in a crystalliser has longeen considered to be too challenging to achieve, and early efforts
ave therefore focused on CSD control where the size of a crys-al is often defined as its volume equivalent diameter. Previouslyome, though still limited efforts were made to explore the area of∗ Corresponding author. Tel.: +44 223 343 2427; fax: +44 113 343 2405.E-mail addresses: [email protected], [email protected] (X.Z. Wang).
959-1524/$ – see front matter © 2011 Elsevier Ltd. All rights reserved.oi:10.1016/j.jprocont.2011.10.007
© 2011 Elsevier Ltd. All rights reserved.
crystal shape monitoring and control. The growth kinetics and mor-phological change of single l-glutamic acid crystal on the growthcell equipment had been studied based on straightforward micro-scopic and video-TV system observation [4,5]. Some other workcarefully designed experiments by changing the operational pro-file, e.g. cooling rate from fast to slow, and then compared the finalproduct shape difference [6–9]. Despite the above mentioned work,research is still needed in order to fully achieve closed-loop controlof the shape for a population of crystals in a crystalliser.
Currently, the on-line visual imaging technique is probablythe most effective and reliable method which can give directinformation on crystal shape during the crystallisation process.Several research groups have explored the use of these systemsfor crystallisation process monitoring and control. Scott et al. [10]used an in-line camera for qualitative monitoring of industrialcrystallisation. Wilkinson et al. [11] from GlaxoSmithKline werealso among the first researchers to study on-line imaging for mon-itoring crystallisation processes. Barrett and Glennon [12] used thePVM imaging probe in the determination of the metastable zoneof an inorganic compound. Patience and Rawlings [8] investigatedthe use of the PVM for measuring the shape and size informationof sodium chlorate crystals. Larsen et al. [13,14] developed newalgorithms for image analysis of high-aspect-ratio particles cap-tured in moderately dense suspensions. Scholl et al. [15] studied
in situ monitoring of polymorphic transformation using focusedbeam reflective measurement (FBRM), PVM, Raman and ATR-FTIRspectroscopy. De Anda et al. [16–18] have investigated the useof the GlaxoSmithKline’s imaging system for monitoring the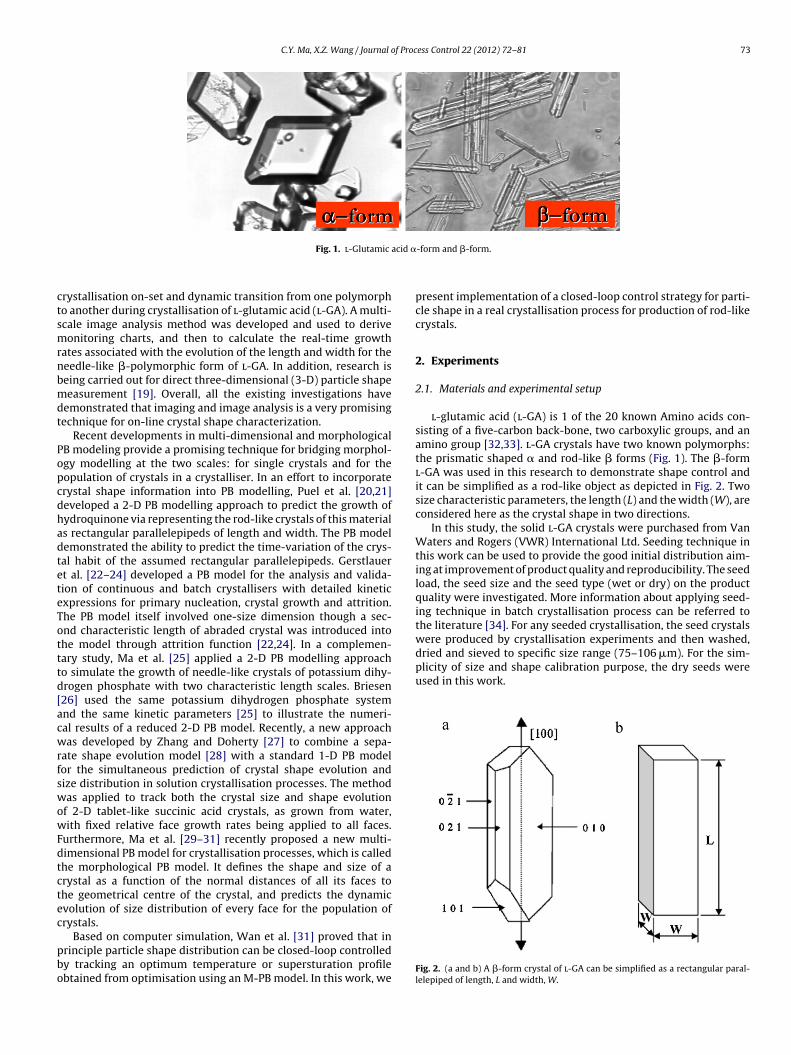
C.Y. Ma, X.Z. Wang / Journal of Process Control 22 (2012) 72– 81 73
acid �
ctsmrnbmdt
PopcdhadteteTotttd[acwrfswowFdtctec
pbo
dried and sieved to specific size range (75–106 �m). For the sim-plicity of size and shape calibration purpose, the dry seeds wereused in this work.
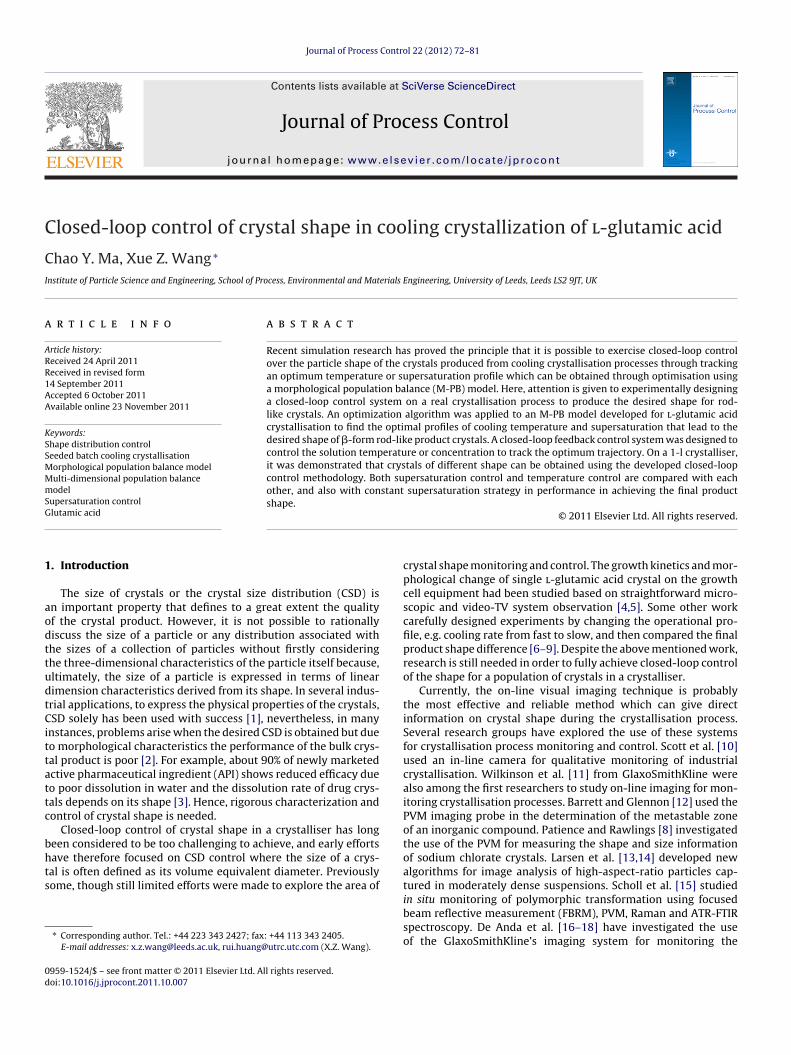
Fig. 1. l-Glutamic
rystallisation on-set and dynamic transition from one polymorpho another during crystallisation of l-glutamic acid (l-GA). A multi-cale image analysis method was developed and used to deriveonitoring charts, and then to calculate the real-time growth
ates associated with the evolution of the length and width for theeedle-like �-polymorphic form of l-GA. In addition, research iseing carried out for direct three-dimensional (3-D) particle shapeeasurement [19]. Overall, all the existing investigations have
emonstrated that imaging and image analysis is a very promisingechnique for on-line crystal shape characterization.
Recent developments in multi-dimensional and morphologicalB modeling provide a promising technique for bridging morphol-gy modelling at the two scales: for single crystals and for theopulation of crystals in a crystalliser. In an effort to incorporaterystal shape information into PB modelling, Puel et al. [20,21]eveloped a 2-D PB modelling approach to predict the growth ofydroquinone via representing the rod-like crystals of this materials rectangular parallelepipeds of length and width. The PB modelemonstrated the ability to predict the time-variation of the crys-al habit of the assumed rectangular parallelepipeds. Gerstlauert al. [22–24] developed a PB model for the analysis and valida-ion of continuous and batch crystallisers with detailed kineticxpressions for primary nucleation, crystal growth and attrition.he PB model itself involved one-size dimension though a sec-nd characteristic length of abraded crystal was introduced intohe model through attrition function [22,24]. In a complemen-ary study, Ma et al. [25] applied a 2-D PB modelling approacho simulate the growth of needle-like crystals of potassium dihy-rogen phosphate with two characteristic length scales. Briesen26] used the same potassium dihydrogen phosphate systemnd the same kinetic parameters [25] to illustrate the numeri-al results of a reduced 2-D PB model. Recently, a new approachas developed by Zhang and Doherty [27] to combine a sepa-
ate shape evolution model [28] with a standard 1-D PB modelor the simultaneous prediction of crystal shape evolution andize distribution in solution crystallisation processes. The methodas applied to track both the crystal size and shape evolution
f 2-D tablet-like succinic acid crystals, as grown from water,ith fixed relative face growth rates being applied to all faces.
urthermore, Ma et al. [29–31] recently proposed a new multi-imensional PB model for crystallisation processes, which is calledhe morphological PB model. It defines the shape and size of arystal as a function of the normal distances of all its faces tohe geometrical centre of the crystal, and predicts the dynamicvolution of size distribution of every face for the population ofrystals.
Based on computer simulation, Wan et al. [31] proved that inrinciple particle shape distribution can be closed-loop controlledy tracking an optimum temperature or supersturation profilebtained from optimisation using an M-PB model. In this work, we
-form and �-form.
present implementation of a closed-loop control strategy for parti-cle shape in a real crystallisation process for production of rod-likecrystals.
2. Experiments
2.1. Materials and experimental setup
l-glutamic acid (l-GA) is 1 of the 20 known Amino acids con-sisting of a five-carbon back-bone, two carboxylic groups, and anamino group [32,33]. l-GA crystals have two known polymorphs:the prismatic shaped � and rod-like � forms (Fig. 1). The �-forml-GA was used in this research to demonstrate shape control andit can be simplified as a rod-like object as depicted in Fig. 2. Twosize characteristic parameters, the length (L) and the width (W), areconsidered here as the crystal shape in two directions.
In this study, the solid l-GA crystals were purchased from VanWaters and Rogers (VWR) International Ltd. Seeding technique inthis work can be used to provide the good initial distribution aim-ing at improvement of product quality and reproducibility. The seedload, the seed size and the seed type (wet or dry) on the productquality were investigated. More information about applying seed-ing technique in batch crystallisation process can be referred tothe literature [34]. For any seeded crystallisation, the seed crystalswere produced by crystallisation experiments and then washed,
Fig. 2. (a and b) A �-form crystal of l-GA can be simplified as a rectangular paral-lelepiped of length, L and width, W.
74 C.Y. Ma, X.Z. Wang / Journal of Process Control 22 (2012) 72– 81
f
c
w
rnJtpotiec
tp
2
wtoiwTs3
tcfhist
2
ueiww
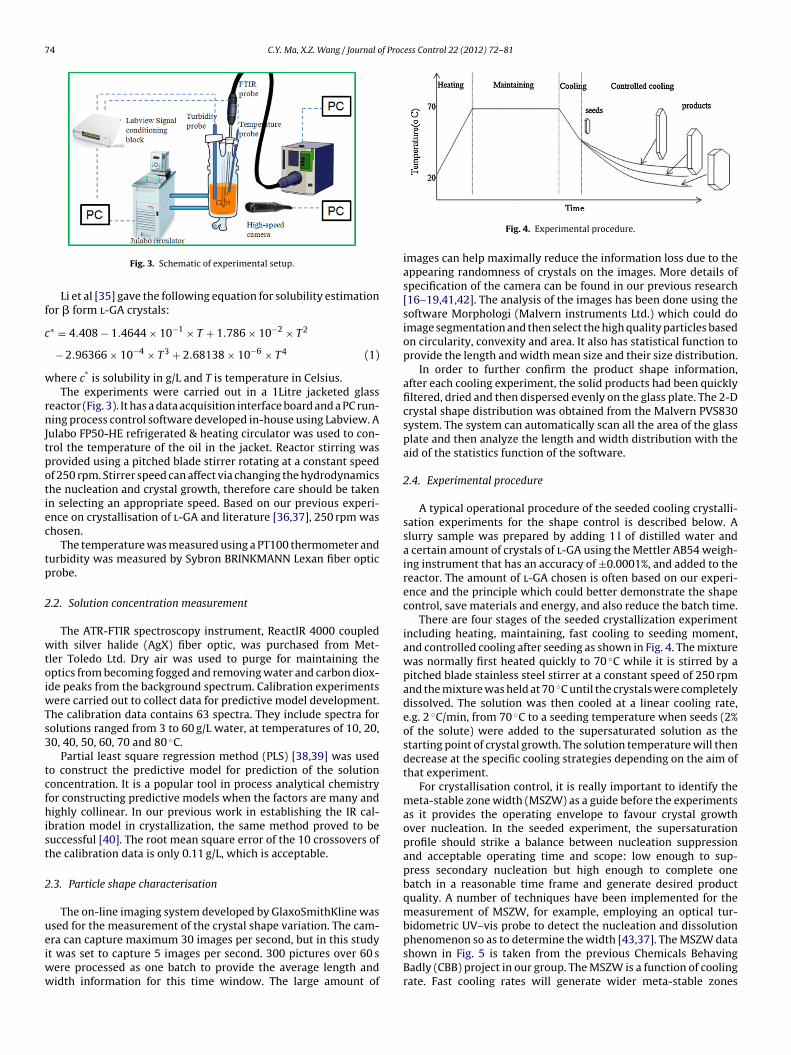
Fig. 3. Schematic of experimental setup.
Li et al [35] gave the following equation for solubility estimationor � form l-GA crystals:
∗ = 4.408 − 1.4644 × 10⁻¹ × T + 1.786 × 10⁻² × T2
− 2.96366 × 10⁻⁴ × T3 + 2.68138 × 10⁻⁶ × T4 (1)
here c* is solubility in g/L and T is temperature in Celsius.The experiments were carried out in a 1Litre jacketed glass
eactor (Fig. 3). It has a data acquisition interface board and a PC run-ing process control software developed in-house using Labview. A
ulabo FP50-HE refrigerated & heating circulator was used to con-rol the temperature of the oil in the jacket. Reactor stirring wasrovided using a pitched blade stirrer rotating at a constant speedf 250 rpm. Stirrer speed can affect via changing the hydrodynamicshe nucleation and crystal growth, therefore care should be takenn selecting an appropriate speed. Based on our previous experi-nce on crystallisation of l-GA and literature [36,37], 250 rpm washosen.
The temperature was measured using a PT100 thermometer andurbidity was measured by Sybron BRINKMANN Lexan fiber opticrobe.
.2. Solution concentration measurement
The ATR-FTIR spectroscopy instrument, ReactIR 4000 coupledith silver halide (AgX) fiber optic, was purchased from Met-
ler Toledo Ltd. Dry air was used to purge for maintaining theptics from becoming fogged and removing water and carbon diox-de peaks from the background spectrum. Calibration experiments
ere carried out to collect data for predictive model development.he calibration data contains 63 spectra. They include spectra forolutions ranged from 3 to 60 g/L water, at temperatures of 10, 20,0, 40, 50, 60, 70 and 80 ◦C.
Partial least square regression method (PLS) [38,39] was usedo construct the predictive model for prediction of the solutiononcentration. It is a popular tool in process analytical chemistryor constructing predictive models when the factors are many andighly collinear. In our previous work in establishing the IR cal-
bration model in crystallization, the same method proved to beuccessful [40]. The root mean square error of the 10 crossovers ofhe calibration data is only 0.11 g/L, which is acceptable.
.3. Particle shape characterisation
The on-line imaging system developed by GlaxoSmithKline wassed for the measurement of the crystal shape variation. The cam-
ra can capture maximum 30 images per second, but in this studyt was set to capture 5 images per second. 300 pictures over 60 sere processed as one batch to provide the average length andidth information for this time window. The large amount of
Fig. 4. Experimental procedure.
images can help maximally reduce the information loss due to theappearing randomness of crystals on the images. More details ofspecification of the camera can be found in our previous research[16–19,41,42]. The analysis of the images has been done using thesoftware Morphologi (Malvern instruments Ltd.) which could doimage segmentation and then select the high quality particles basedon circularity, convexity and area. It also has statistical function toprovide the length and width mean size and their size distribution.
In order to further confirm the product shape information,after each cooling experiment, the solid products had been quicklyfiltered, dried and then dispersed evenly on the glass plate. The 2-Dcrystal shape distribution was obtained from the Malvern PVS830system. The system can automatically scan all the area of the glassplate and then analyze the length and width distribution with theaid of the statistics function of the software.
2.4. Experimental procedure
A typical operational procedure of the seeded cooling crystalli-sation experiments for the shape control is described below. Aslurry sample was prepared by adding 1 l of distilled water anda certain amount of crystals of l-GA using the Mettler AB54 weigh-ing instrument that has an accuracy of ±0.0001%, and added to thereactor. The amount of l-GA chosen is often based on our experi-ence and the principle which could better demonstrate the shapecontrol, save materials and energy, and also reduce the batch time.
There are four stages of the seeded crystallization experimentincluding heating, maintaining, fast cooling to seeding moment,and controlled cooling after seeding as shown in Fig. 4. The mixturewas normally first heated quickly to 70 ◦C while it is stirred by apitched blade stainless steel stirrer at a constant speed of 250 rpmand the mixture was held at 70 ◦C until the crystals were completelydissolved. The solution was then cooled at a linear cooling rate,e.g. 2 ◦C/min, from 70 ◦C to a seeding temperature when seeds (2%of the solute) were added to the supersaturated solution as thestarting point of crystal growth. The solution temperature will thendecrease at the specific cooling strategies depending on the aim ofthat experiment.
For crystallisation control, it is really important to identify themeta-stable zone width (MSZW) as a guide before the experimentsas it provides the operating envelope to favour crystal growthover nucleation. In the seeded experiment, the supersaturationprofile should strike a balance between nucleation suppressionand acceptable operating time and scope: low enough to sup-press secondary nucleation but high enough to complete onebatch in a reasonable time frame and generate desired productquality. A number of techniques have been implemented for themeasurement of MSZW, for example, employing an optical tur-bidometric UV–vis probe to detect the nucleation and dissolution
phenomenon so as to determine the width [43,37]. The MSZW datashown in Fig. 5 is taken from the previous Chemicals BehavingBadly (CBB) project in our group. The MSZW is a function of coolingrate. Fast cooling rates will generate wider meta-stable zones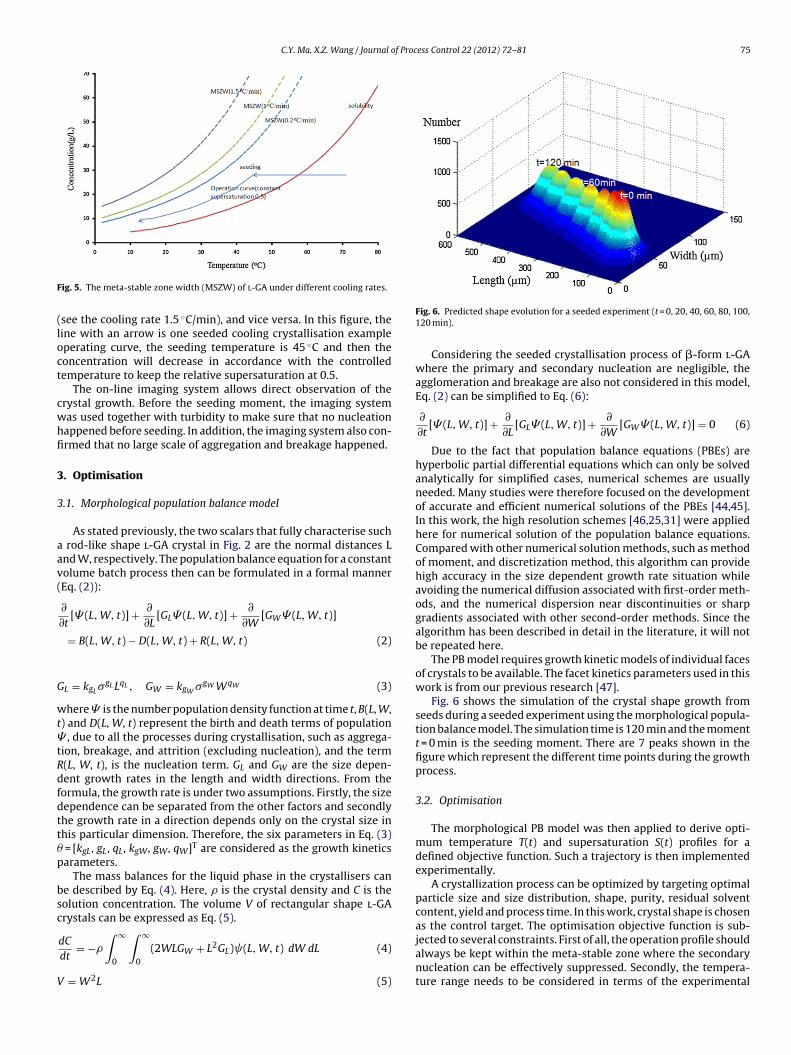
C.Y. Ma, X.Z. Wang / Journal of Process Control 22 (2012) 72– 81 75
F
(loct
cwhfi
3
3
aav(
G
wt�tRdfdtt�p
bsc
V
ig. 5. The meta-stable zone width (MSZW) of l-GA under different cooling rates.
see the cooling rate 1.5 ◦C/min), and vice versa. In this figure, theine with an arrow is one seeded cooling crystallisation exampleperating curve, the seeding temperature is 45 ◦C and then theoncentration will decrease in accordance with the controlledemperature to keep the relative supersaturation at 0.5.
The on-line imaging system allows direct observation of therystal growth. Before the seeding moment, the imaging systemas used together with turbidity to make sure that no nucleationappened before seeding. In addition, the imaging system also con-rmed that no large scale of aggregation and breakage happened.
. Optimisation
.1. Morphological population balance model
As stated previously, the two scalars that fully characterise such rod-like shape l-GA crystal in Fig. 2 are the normal distances Lnd W, respectively. The population balance equation for a constantolume batch process then can be formulated in a formal mannerEq. (2)):
∂
∂t[� (L, W, t)] + ∂
∂L[GL� (L, W, t)] + ∂
∂W[GW� (L, W, t)]
= B(L, W, t) − D(L, W, t) + R(L, W, t) (2)
L = kgL�gL LqL , GW = kgW �
gWWqW (3)
here � is the number population density function at time t, B(L, W,) and D(L, W, t) represent the birth and death terms of population
, due to all the processes during crystallisation, such as aggrega-ion, breakage, and attrition (excluding nucleation), and the term(L, W, t), is the nucleation term. GL and GW are the size depen-ent growth rates in the length and width directions. From theormula, the growth rate is under two assumptions. Firstly, the sizeependence can be separated from the other factors and secondlyhe growth rate in a direction depends only on the crystal size inhis particular dimension. Therefore, the six parameters in Eq. (3)
= [kgL, gL, qL, kgW, gW, qW]T are considered as the growth kineticsarameters.
The mass balances for the liquid phase in the crystallisers cane described by Eq. (4). Here, � is the crystal density and C is theolution concentration. The volume V of rectangular shape l-GArystals can be expressed as Eq. (5).∫ ∫
dCdt= −�
∞
0
∞
0
(2WLGW + L2GL) (L, W, t) dW dL (4)
= W2L (5)
Fig. 6. Predicted shape evolution for a seeded experiment (t = 0, 20, 40, 60, 80, 100,120 min).
Considering the seeded crystallisation process of �-form l-GAwhere the primary and secondary nucleation are negligible, theagglomeration and breakage are also not considered in this model,Eq. (2) can be simplified to Eq. (6):
∂
∂t[� (L, W, t)] + ∂
∂L[GL� (L, W, t)] + ∂
∂W[GW� (L, W, t)] = 0 (6)
Due to the fact that population balance equations (PBEs) arehyperbolic partial differential equations which can only be solvedanalytically for simplified cases, numerical schemes are usuallyneeded. Many studies were therefore focused on the developmentof accurate and efficient numerical solutions of the PBEs [44,45].In this work, the high resolution schemes [46,25,31] were appliedhere for numerical solution of the population balance equations.Compared with other numerical solution methods, such as methodof moment, and discretization method, this algorithm can providehigh accuracy in the size dependent growth rate situation whileavoiding the numerical diffusion associated with first-order meth-ods, and the numerical dispersion near discontinuities or sharpgradients associated with other second-order methods. Since thealgorithm has been described in detail in the literature, it will notbe repeated here.
The PB model requires growth kinetic models of individual facesof crystals to be available. The facet kinetics parameters used in thiswork is from our previous research [47].
Fig. 6 shows the simulation of the crystal shape growth fromseeds during a seeded experiment using the morphological popula-tion balance model. The simulation time is 120 min and the momentt = 0 min is the seeding moment. There are 7 peaks shown in thefigure which represent the different time points during the growthprocess.
3.2. Optimisation
The morphological PB model was then applied to derive opti-mum temperature T(t) and supersaturation S(t) profiles for adefined objective function. Such a trajectory is then implementedexperimentally.
A crystallization process can be optimized by targeting optimalparticle size and size distribution, shape, purity, residual solventcontent, yield and process time. In this work, crystal shape is chosenas the control target. The optimisation objective function is sub-
jected to several constraints. First of all, the operation profile shouldalways be kept within the meta-stable zone where the secondarynucleation can be effectively suppressed. Secondly, the tempera-ture range needs to be considered in terms of the experimental
76 C.Y. Ma, X.Z. Wang / Journal of Process Control 22 (2012) 72– 81
F rate d
ctos
m
wuptel
vrc
smcp(b
ops
An alternative effective way is to control the crystalisationprocess based on solution concentration measurement, or in otherwords, supersaturation control (SC). Supersaturation control basedon solution concentration measurement possesses the capability
ig. 7. Optimal temperature (a) and supersaturation (b–d) profiles in order to gene
onditions. Thirdly, the batch time is also a constrain. Fourthly,he batch product yield efficiency is also considered. Therefore, theptimization problem containing equality and non-equality con-traints was formulated in Eq. (7).
in�(t)
(desired shape of crystals at end of batch
− model predicted shape of crystals at end of batch) (7)
Subject to : Cr min(t) ≤ Cr(t) ≤ Cr max(t)T min ≤ T(t) ≤ T max0 ≤ t ≤ tmax
Y ≥ Ymin
here Cr is cooling rate, T is temperature, t is time, Y is final prod-ct yield. The optimisation task is therefore to find the temperaturerofile that minimises the error between the desired shape of crys-als at end of batch and the model predicted shape of crystals atnd of batch. In Eq. (7), ‘shape of crystals’ is defined as the averageength of the crystals divided by their average width.
The temperature profile is divided into a number of time inter-als (each interval is 6 min), Cr(1), Cr(2), . . ., Cr(final) (Cr – coolingates). Then the optimisation method attempted to find the bestombination of the intervals to form the temperature profile.
The set of algebraic equality and non-equality constraints pre-ented in Eq, (7), in addition to the non-linear population balanceodel, make the optimization problem fall into the category of a
onstrained non-linear programming problem (NLP). The operationrofile was calculated by the successive quadratic programmingSQP) method named ‘fmincon’ in the MATLAB optimisation tool-ox.
The target shape should be within a rational range in termsf the shape of seeds, experimental conditions and the material’shysical and chemical properties. In this work, the target crystalhape of mean length and width ratio is set between [4:1] and [5:1]
ifferent shapes (crystal mean length:mean width, 4:1, 4.5:1, and 5:1, respectively).
which is within the control scope based on previous experimentalexperience. The result of the derived optimal curve can be seen inFig. 7.
To reduce the optimisation calculation burden, the initial tem-perature T(0) and cooling rate range is given by the experimentalconditions and trial-and-error method. From the optimisationresults, it can be concluded that the supersaturation level and dura-tion of the generation of short, medium and long particles areextremely different. The high supersaturation and short durationexperiment could produce short crystals while low supersaturationand long duration experiment will generate long particles.
4. The control system
The feedback control system including sensor, controller andactuator can be developed to control process conditions to trackthe optimum T(t) or S(t) profile.
Temperature control (TC), can be easily implemented by a feed-back control loop. In this work, the controller tracks a setpointtemperature profile in time by manipulating the jacket coolingoil flow rates in the Julabo circulator. The proportional-integral-derivative (PID) control parameters of the temperature controllercan be automatically adjusted by the circulator itself.
Fig. 8. Block diagram of supersaturation control.

C.Y. Ma, X.Z. Wang / Journal of Process Control 22 (2012) 72– 81 77
Fig. 9. (a and b) Measured concentration profiles plotted against model predictedps
tcgctlmtmrrTsctdrs
Mtwstr
vud[pmtsr
rofiles for experimental runs of optimum temperature control (O-TC) and optimumupersaturation control (O-SC).
o absorb some disturbances in operating conditions, such ashanges in initial solute concentration, seed loading, and crystalrowth rate. The supersaturation control can be implemented by aascaded structure which uses the concentration feedback loop ashe ‘master’ loop and the temperature feedback loop as the ‘slave’oop as shown in Fig. 8. At each time interval, the supersaturation
easurement at the current system temperature was comparedo the user-specified supersaturation setpoint. The primary loop
inimized the error between the two by manipulating the coolingate setpoint by an in-house designed controller. The coolingate was translated into a new reactor temperature setpoint.he secondary loop ensured that the new temperature setpointpecified by the primary loop was achieved by manipulating theirculator. In this way, the control system continually adjustedhe reactor temperature to maintain supersaturation at theesired setpoint. The advantage of the cascade control is a fastesponse and robustness to disturbances compared to that with aingle loop.
The supersaturation controller is implemented in-house byATLAB. As with the cascaded control parameter tuning strategy,
he supersaturation loop was tuned once acceptable performanceas achieved with the temperature loop. Initial estimates for the
upersaturation loop control parameters were obtained by moni-oring the response of supersaturation to a step change in coolingate and applying the process reaction curve method.
For the set-point profile of supersaturation, either a constantalue or an optimal trajectory deduced from optimisation can besed. Theoretically the latter choice is better when it makes a bigifference from the former operation as demonstrated by Jones48]. However, the former choice is also attractive due to its sim-licity for commercial application: no kinetics study, no process
odels, no optimisation, and no concerns about parameter uncer-ainties [49]. In this study, both optimal and constant profiles ofupersaturation control strategies have been attempted and theesults will be compared.
Fig. 10. Closed-loop control of supersaturation to track the set point profile obtainedfrom model (O-SC4).
In summary of the control schemes, there are three types ofexperiments including optimal temperature control (O-TC), opti-mal supersaturation control (O-SC) and constant supersaturationcontrol (C-SC) carried out to implement the shape control of l-GAas listed in Table 1. The three short, medium, long target shapes cor-responding to the mean length and mean width ratio of 4:1, 4.5:1and 5:1 are listed in the second column. After each experiment,the product will be filtered, washed and dried. The supersaturationrange is estimated from the model prediction.
5. Results and discussion
In this section, the results of different control strategies, i.e. opti-mal temperature control (O-TC), optimal supersaturation control(O-SC) and constant supersaturation control (C-SC) are compared.The experiments to generate short-rod-like (4:1) shape (see runsO-TC1-3, O-SC1-3, and C-SC1-3) are chosen as a reference and per-formed in triplicate in order to assess the reproducibility of theacquired experimental data.
5.1. The secondary nucleation effect
Secondary nucleation is the formation of nuclei attributable tothe influence of the existing crystals in the slurry. It can be causedby fluid shear or the collisions between already existing crystalswith either a solid surface of the crystalliser or with other crystalsthemselves. Generally in practice, secondary nucleation could besuppressed to some extent in the seeded experiments. Our mod-elling work was based on the assumption of negligible secondarynucleation. Although totally avoiding this phenomenon is difficultin real experiments, the proper stirrer speed based on experimen-tal experience and the comparatively low supersaturation will helpto greatly reduce the rate of secondary nucleation to a very lowlevel. The number of seeds and final products were compared tosee the secondary nucleation impact. Ideally, the number of prod-uct crystals and seeds should be the same if there was no nucleationtaking place. There is approximately 1.0566 × 10⁹ number of seedparticles in the 0.54 g l-GA. After the experiment O-TC1, O-TC4, O-TC5, the product was weighed as 14.1 g, 15.9 g, 15.0 g and basedon the shape distribution the particle number was calculated tobe around 1.8445 × 10⁹, 1.6883 × 10⁹, 1.5087 × 10⁹, respectively.From previous literature [6,7,50,51], the total product number afterthe seeded cooling crystallisation process is usually around 10times as the seeds number due to the secondary nucleation andcrystal breakage. Although the experimental system is differentfrom the literature, the product number in this experiment hasthe same order of magnitude as the seeds number still indicatingthat the secondary nucleation has been depressed at a low levelwhich is in accordance with the model assumption. There are some
published papers that discussed the effect of ignoring second nucle-ation on simulation [52–54,6,7]. The general conclusion is that, inseeded crystallisation, although there can be a significant increasein the number of crystals due to secondary nucleation, since they
78 C.Y. Ma, X.Z. Wang / Journal of Process Control 22 (2012) 72– 81
Table 1Operating conditions of the shape control experiments.a
Experiment type Target shape Duration (min) Temperature range (◦C) Supersaturation range
O-TC1 4:1 75 40–15 0.75–0.82O-TC2 4:1 75 40–15 0.75–0.82O-TC3 4:1 75 40–15 0.75–0.82O-TC4 4.5:1 180 45–20 0.40–0.52O-TC5 5:1 440 49–25 0.25–0.32O-SC1 4:1 75 40–15 0.75–0.82O-SC2 4:1 75 40–15 0.75–0.82O-SC3 4:1 75 40–15 0.75–0.82O-SC4 4.5:1 180 45–20 0.40–0.52O-SC5 5:1 440 49–25 0.25–0.32C-SC1 4:1 75 40–15 0.75–0.82C-SC2 4:1 75 40–15 0.75–0.82C-SC3 4:1 75 40–15 0.75–0.82C-SC4 4.5:1 180 45–20 0.40–0.52C-SC5 5:1 440 49–25 0.25–0.32
C-SC: constant supersaturation control.
aiIlt
5
5
elem
Table 2Comparison of the optimal control experiments.a
Experiment type Target shape (�m) Product shape (�m)
O-TC1-3 416:104 (4:1) 414:112 (3.7:1)419:114 (3.7:1)424:118 (3.6:1)
O-TC4 468:104 (4.5:1) 475:110 (4.3:1)O-TC5 530:106 (5:1) 510:111 (4.6:1)O-SC1-3 416:104 (4:1) 412:107 (3.9:1)
415:108 (3.8:1)410:106 (3.9:1)
O-SC4 468:104 (4.5:1) 471:107 (4.4:1)
a O-TC: optimum temperature control; O-SC: optimum supersaturation control;
re much smaller than the crystals grown from the seed crystals,gnoring second nucleation in simulation only leads to small errors.t was estimated that the maximum difference between the simu-ated and the experimental concentration is only 6.5% by ignoringhe secondary nucleation.
.2. Comparisons of the control strategies
.2.1. Optimal control resultTable 2 summarizes all the experimental results of the differ-
nt control schemes. The numbers in the table represent the meanength and mean width value and their ratio in the bracket. Forxample, 416:104 (4:1) means the mean length is 416 �m andean width is 104 �m, and their ratio is 4:1. The target shape is
O-SC5 530:106 (5:1) 522:105 (5.0:1)
a Mean length of seeds = 95 �m, mean width of seeds = 41 �m. 416:104 (4:1)means the mean length and mean width of the crystal population are 416 and 104,respectively, and the ratio of the two is 4:1.
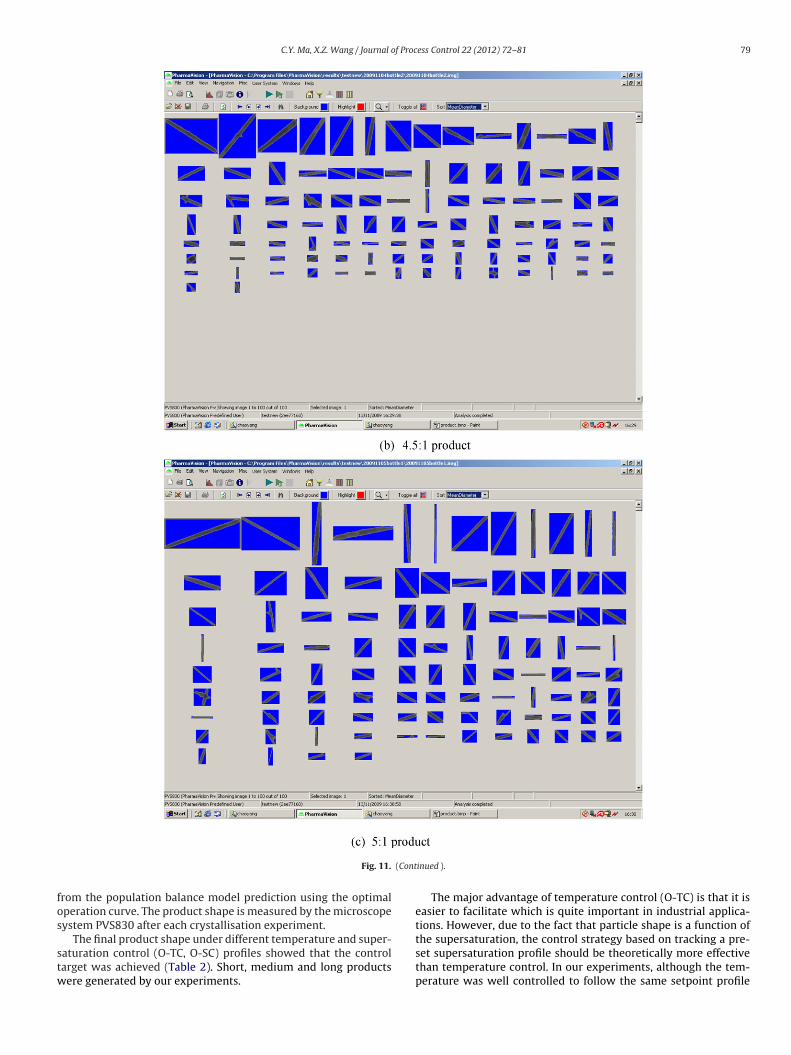
Fig. 11. (a–c) The PVS830 images of final products from C-SC.
C.Y. Ma, X.Z. Wang / Journal of Process Control 22 (2012) 72– 81 79
(Cont
fos
stw
Fig. 11.
rom the population balance model prediction using the optimalperation curve. The product shape is measured by the microscopeystem PVS830 after each crystallisation experiment.
The final product shape under different temperature and super-aturation control (O-TC, O-SC) profiles showed that the controlarget was achieved (Table 2). Short, medium and long productsere generated by our experiments.
inued ).
The major advantage of temperature control (O-TC) is that it iseasier to facilitate which is quite important in industrial applica-tions. However, due to the fact that particle shape is a function of
the supersaturation, the control strategy based on tracking a pre-set supersaturation profile should be theoretically more effectivethan temperature control. In our experiments, although the tem-perature was well controlled to follow the same setpoint profile
80 C.Y. Ma, X.Z. Wang / Journal of Proc
Table 3Result of constant supersaturation control.
Experiment type Product shape (�m)
C-SC1-3 416:106 (3.9:1)420:108 (3.9:1)418:108 (3.9:1)
(miwetHctbnipdtst
ctTaciMtp
5
ttsdutczgb
0miiw
wsMtt
a5m
C-SC4 480:104 (4.6:1)C-SC5 525:103 (5.1:1)
O-TC1, O-TC2, and O-TC3), the solution concentration measure-ent curves do not follow the model prediction trend after 50 min
n Fig. 9. The solution concentrations of the three experimentsere not complete duplicates due to the batch to batch variation,
specially after 30 min. The average error of the solution concen-ration between the expectation and real measurement is 2.23 g/L.owever, the solution concentrations of the three supersaturationontrol experiments (O-SC1, O-SC2, and O-SC3) were quite closeo the expectation. The average error of the solution concentrationetween the model and the real measurement is 1.12 g/L. This phe-omenon explained that the product shape of temperature control
s not as consistent as supersaturation control in Table 2. Thereforerevious research attempted to carry out supersaturation controlue to its production of more consistent products in terms of par-icle size distribution. Here we demonstrated that for the crystalhape, the supersaturation control can also generate better resultshan temperature control.
In Fig. 10, the supersaturation setpoint profile and the actualontrol profile are compared. From the figure, it is indicated thathere were large control errors (nearly 8%) in some time points.his is partly from the solution concentration measurement noisend partly from the limitation of the control system. More sophisti-ated control methods, e.g. adaptive control, have the potential tomprove the track of the convex setpoint profile in future work.
oreover, this optimal temperature and supersaturation con-rol approach requires very accurate model solutions and growtharameters, otherwise the benefits of optimal control may be lost.
.2.2. Constant control resultsAs presented before, several research papers [55–57] argued
hat constant supersaturation profiles can achieve similar size dis-ribution to the optimal supersaturation for many crystallisationystems. Without extensive modelling studies, it is not possible toetermine a priori the optimal supersaturation profile for a partic-lar complex crystallisation process. Previous studies have shownhat the crystal size distribution control can be achieved by simplyhoosing a preset supersaturation setpoint value in the meta-stableone. A suitable setpoint value should be one that will promoterowth while suppressing nucleation and will ensure a reasonableatch time.
The setpoint values of supersaturation are selected to be 0.8,.5, 0.3 by average the optimal profile values to generate the short,edium and long crystals respectively. The experimental duration
s chosen as the same as the optimal supersaturation control as seenn Table 1. Again, the final product result is also shown in Table 3
hich demonstrates the effectiveness of the method.From Tables 1 and 3, the mean value of the product length and
idth generated by the superstation control, both optimal and con-tant are closer to the shape requirement than temperature control.oreover, the supersaturation control can generate more consis-
ent results than the temperature control due to the robustness tohe disturbance of experimental conditions.
The constant supersaturation control although did not gener-te as accurately as the optimal control when producing the shape:1 by comparing the results in Tables 2 and 3. The rigorous deter-ination of an optimal batch recipe requires accurate growth and
[
[
ess Control 22 (2012) 72– 81
nucleation kinetics, which can be determined in a series of batchexperiments. For aggregating and other complex crystallisationsystems, it can be time consuming to construct models and deter-mine kinetics that is accurate enough to compute an optimal batchrecipe. Therefore, the constant supersaturation control is highlyrecommended to scale up to industrial applications.
The PVS830 images of products from supersaturation controlwere shown in Fig. 11. These straightforward image data furtherconfirmed our shape control methods.
6. Final remarks
The contribution of the paper is twofold. First, the shape controlof � form l-GA was achieved in a real crystalliser. The effectivenessof the temperature control and supersaturation control strategieswas compared. From the result of this work, the supersaturationcontrol provided more consistent crystal shape of l-GA. Secondly,the work also found that although choosing the set-point for theconstant supersaturation control is still based on experience; itproved a promising approach not only in particle size control, butalso for the desired particle shape production.
This research takes into account only crystal growth period andmakes assumptions that nucleation, agglomeration, and breakageare negligible. Future work can focus on adding these phenomenainto the model.
Acknowledgements
Financial support from the UK Engineering and Physical SciencesResearch Council (EPSRC) for the projects of Shape (EP/C009541)and Stereo Vision (EP/E045707) are acknowledged. We would alsolike to thank the industrial collaborators including AstraZeneca (Dr.Gerry Steele and Dr. Mike J. Quayle), Malvern Instruments (Mr.Fraiser-McNeil Watson, Dr. Jason Corbett, Mr. David Watson andMr. Duncan Roberts), National Nuclear Laboratory (Dr. DominicRhodes), Pfizer (Dr. Ivan Marziano and Prof. Robert Docherty), Syn-genta (Dr. Neil George) and 3M Health Care (Dr. Chris Blatchford).Additional gratitude is also owed to Dr. Cai Y. Ma for valuable dis-cussions and support.
References
[1] S. Rohani, N.S. Tavare, J. Garside, Control of crystal size distribution in abatch cooling crystallizer, Canadian Journal of Chemical Engineering 68 (1990)260–267.
[2] M.A. Lovette, A.R. Browning, D.W. Griffin, J.P. Sizemore, R.C. Snyder, M.F.Doherty, Crystal shape engineering, Industrial & Engineering ChemistryResearch 47 (2008) 9812–9833.
[3] M. Singh, J. Chakraborty, D. Ramkrishna, Morphological population balancemodeling of faceted crystals with large number of faces: the division of internalcoordinate space into dynamic and invariant coordinates, in: 4th InternationalConference on Population Balance Modelling, Berlin, 2010.
[4] M. Kitamura, T. Ishizu, Kinetic effect of l-phenylalanine on growth process ofl-glutamic acid polymorph, Journal of Crystal Growth 192 (1998) 225–235.
[5] M. Kitamura, T. Ishizu, Growth kinetics and morphological change of poly-morphs of l-glutamic acid, Journal of Crystal Growth 209 (2000) 138–145.
[6] M. Oullion, F. Puel, G. Fevotte, S. Righini, P. Carvin, Industrial batch crystalliza-tion of a plate-like organic product. In situ monitoring and 2D-CSD modelling.Part 2. Kinetic modelling and identification, Chemical Engineering Science 62(2007) 833–845.
[7] M. Oullion, F. Puel, G. Fevotte, S. Righini, P. Carvin, Industrial batch crystalliza-tion of a plate-like organic product. In situ monitoring and 2D-CSD modelling.Part 1. Experimental study, Chemical Engineering Science 62 (2007) 820–832.
[8] D.B. Patience, J.B. Rawlings, Particle-shape monitoring and control in crystal-lization processes, AIChE Journal 47 (2001) 2125–2130.
[9] G.Y. Yang, N. Kubota, Z.L. Sha, M. Louhi-Kultanen, J.F. Wang, Crystal shape con-trol by manipulating supersaturation in batch cooling crystallization, CrystalGrowth & Design 6 (2006) 2799–2803.
10] D.M. Scott, A. Boxman, C.E. Jochen, In-line particle characterization, Particle &Particle Systems Characterization 15 (1998) 47–50.
11] M.J. Wilkinson, K.H. Jennings, M. Hardy, Non-invasive video imaging for interro-gating pharmaceutical crystallization, Microscopy and Microanalysis 6 (2000)996–997.
f Proc
[
[
[
[
[
[
[
[
[
[
[
[
[
[
[
[
[
[
[
[
[
[
[
[
[
[
[[
[
[
[
[
[
[
[
[
[
[
[
[
[
[
[
[
[
C.Y. Ma, X.Z. Wang / Journal o
12] P. Barrett, B. Glennon, Characterizing the metastable zone width and solubilitycurve using lasentec FBRM and PVM, Chemical Engineering Research & Design80 (2002) 799–805.
13] P.A. Larsen, J.B. Rawlings, N.J. Ferrier, An algorithm for analyzing noisy, in situimages of high-aspect-ratio crystals to monitor particle size distribution,Chemical Engineering Science 61 (2006) 5236–5248.
14] P.A. Larsen, J.B. Rawlings, N.J. Ferrier, Model-based object recognition to mea-sure crystal size and shape distributions from in situ video images, ChemicalEngineering Science 62 (2007) 1430–1441.
15] J. Scholl, D. Bonalumi, L. Vicum, M. Mazzotti, M. Muller, In situ monitoring andmodeling of the solvent-mediated polymorphic transformation of l-glutamicacid, Crystal Growth & Design 6 (2006) 881–891.
16] J.C. De Anda, X.Z. Wang, X. Lai, K.J. Roberts, Classifying organic crystals via in-process image analysis and the use of monitoring charts to follow polymorphicand morphological changes, Journal of Process Control 15 (2005) 785–797.
17] J.C. De Anda, X.Z. Wang, X. Lai, K.J. Roberts, K.H. Jennings, M.J. Wilkinson, D. Wat-son, D. Roberts, Real-time product morphology monitoring in crystallizationusing imaging technique, AIChE Journal 51 (2005) 1406–1414.
18] J.C. De Anda, X.Z. Wang, K.J. Roberts, Multi-scale segmentation image anal-ysis for the in-process monitoring of particle shape with batch crystallisers,Chemical Engineering Science 60 (2005) 1053–1065.
19] X.Z. Wang, K.J. Roberts, C. Ma, Crystal growth measurement using 2D and 3Dimaging and the perspectives for shape control, Chemical Engineering Science63 (2008) 1173–1184.
20] F. Puel, G. Fevotte, J.P. Klein, Simulation and analysis of industrial crystallizationprocesses through multidimensional population balance equations. Part 1. Aresolution algorithm based on the method of classes, Chemical EngineeringScience 58 (2003) 3715–3727.
21] F. Puel, G. Fevotte, J.P. Klein, Simulation and analysis of industrial crystallizationprocesses through multidimensional population balance equations. Part 2. Astudy of semi-batch crystallization, Chemical Engineering Science 58 (2003)3729–3740.
22] A. Gerstlauer, C. Gahn, H. Zhou, M. Rauls, M. Schreiber, Application of populationbalances in the chemical industry – current status and future needs, ChemicalEngineering Science 61 (2006) 205–217.
23] A. Gerstlauer, A. Mitrovic, S. Motz, E.D. Gilles, A population model for crys-tallization processes using two independent particle properties, ChemicalEngineering Science 56 (2001) 2553–2565.
24] A. Gerstlauer, S. Motz, A. Mitrovic, E.D. Gilles, Development, analysis and val-idation of population models for continuous and batch crystallizers, ChemicalEngineering Science 57 (2002) 4311–4327.
25] D.L. Ma, D.K. Tafti, R.D. Braatz, High-resolution simulation of multidimen-sional crystal growth, Industrial & Engineering Chemistry Research 41 (2002)6217–6223.
26] H. Briesen, Simulation of crystal size and shape by means of a reducedtwo-dimensional population balance model, Chemical Engineering Science 61(2006) 104–112.
27] Y.C. Zhang, M.F. Doherty, Simultaneous prediction of crystal shape and size forsolution crystallization, AIChE Journal 50 (2004) 2101–2112.
28] X.Y. Liu, P. Bennema, Theoretical consideration of the growth morphology ofcrystals, Physical Review B 53 (1996) 2314–2325.
29] C.Y. Ma, X.Z. Wang, Crystal growth rate dispersion modeling using morpholog-ical population balance, AIChE Journal 54 (2008) 2321–2334.
30] C.Y. Ma, X.Z. Wang, K.J. Roberts, Morphological population balance for modelingcrystal growth in face directions, AIChE Journal 54 (2008) 209–222.
31] J. Wan, X.Z. Wang, C.Y. Ma, Particle shape manipulation and optimization incooling crystallization involving multiple crystal morphological forms, AIChEJournal 55 (2009) 2049–2061.
32] AminoScience, 2007. l-Glutamic acid. http://www.ajinomoto.co.jp/amino/eaminoscience/bc/amino 06.html.
33] N. Garti, H. Zour, The effect of surfactants on the crystallization and polymor-phic transformation of glutamic acid, Journal of Crystal Growth 172 (1997)486–498.
34] S.H. Chung, D.L. Ma, R.D. Braatz, Optimal seeding in batch crystallization, Cana-dian Journal of Chemical Engineering 77 (1999) 590–596.
35] R.F. Li, X.Z. Wang, S.B. Abebe, Monitoring batch cooling crystallization usingNIR: development of calibration models using genetic algorithm and PLS, Par-ticle & Particle Systems Characterization 25 (2008) 314–327.
[
ess Control 22 (2012) 72– 81 81
36] J. Scholl, C. Lindenberg, L. Vicum, J. Brozio, M. Mazzotti, Precipitation of alphal-glutamic acid: determination of growth kinetics, Faraday Discussions 136(2007) 247–264.
37] N.C.S. Kee, R.B.H. Tan, R.D. Braatz, Selective crystallization of the metastablealpha-form of l-glutamic acid using concentration feedback control, CrystalGrowth & Design 9 (2009) 3044–3051.
38] Eigenvector Research, I., PLS.39] S. Wold, M. Sjostrom, L. Eriksson, PLS-regression: a basic tool of chemo-
metrics, Chemometrics and Intelligent Laboratory Systems 58 (2001) 109–130.
40] A. Borissova, S. Khan, T. Mahmud, K.J. Roberts, J. Andrews, P. Dallin, Z.P. Chen, J.Morris, In situ measurement of solution concentration during the batch coolingcrystallization of l-glutamic acid using ATR-FTIR spectroscopy coupled withchemometrics, Crystal Growth & Design 9 (2009) 692–706.
41] X.Z. Wang, J.C. De Anda, K.J. Roberts, Real-time measurement of the growthrates of individual crystal facets using imaging and image analysis – a feasibil-ity study on needle-shaped crystals of l-glutamic acid, Chemical EngineeringResearch & Design 85 (2007) 921–927.
42] J.C. De Anda, Real-time Particle Morphology Monitoring in Crystallisation usingOn-line Microscopy Imaging and Image Analysis Chemical Engineering, PhDvol., Leeds University, Leeds, 2005.
43] X.W. Ni, A.T. Liao, Effects of cooling rate and solution concentration on solutioncrystallization of l-glutamic acid in an oscillatory baffled crystallizer, CrystalGrowth & Design 8 (2008) 2875–2881.
44] S. Kumar, D. Ramkrishna, On the solution of population balance equations bydiscretization. III. Nucleation, growth and aggregation of particles, ChemicalEngineering Science 52 (1997) 4659–4679.
45] D. Ramkrishna, Population Balances: Theory and Applications to ParticulateSystems in Engineering, Academic Press, San Diego, CA, 2000.
46] R. Gunawan, I. Fusman, R.D. Braatz, High resolution algorithms for mul-tidimensional population balance equations, AIChE Journal 50 (2004)2738–2749.
47] C.Y. Ma, X.Z. Wang, Model identification of crystal facet growth kinet-ics in morphological population balance modeling of l-glutamic acidcrystallization and experimental validation, Chemical Engineering Science,doi:10.1016/j.ces.2011.05.042.
48] A.G. Jones, Optimal operation of a batch cooling crystallizer, Chemical Engi-neering Science 29 (1974) 1075–1087.
49] Z.Q. Yu, P.S. Chow, R.B.H. Tan, Seeding and constant-supersaturation control byATR-FTIR in anti-solvent crystallization, Organic Process Research & Develop-ment 10 (2006) 717–722.
50] K. Sato, H. Nagai, K. Hasegawa, K. Tomori, H.J.M. Kramer, P.J. Jansens, Two-dimensional population balance model with breakage of high aspect ratiocrystals for batch crystallization, Chemical Engineering Science 63 (2008)3271–3278.
51] S.K. Sikdar, A.D. Randolph, Secondary nucleation of 2 fast growth systems ina mixed suspension crystallizer – magnesium–sulfate and citric–acid watersystems, AIChE Journal 22 (1976) 110–117.
52] A. Mesbah, H.J.M. Kramer, A.E.M. Huesman, P.M.J. Van den Hof, A controloriented study on the numerical solution of the population balance equa-tion for crystallization processes, Chemical Engineering Science 64 (2009)4262–4277.
53] S. Qamar, S. Noora, M. Rehman, A. Seidel-Morgenstern, Numerical solution ofa multi-dimensional batch crystallization model with fines dissolution, Com-puters & Chemical Engineering 35 (2011) 412–422.
54] E. Aamir, Z.K. Nagy, C.D. Rielly, Optimal seed recipe design for crystal size distri-bution control for batch cooling crystallisation processes, Chemical EngineeringScience 65 (2010) 3602–3614.
55] J.W. Chew, S.N. Black, P.S. Chow, R.B.H. Tan, Comparison between open-looptemperature control and closed-loop supersaturation control for cooling crys-tallization of glycine, Industrial & Engineering Chemistry Research 46 (2007)830–838.
56] Z.K. Nagy, J.W. Chew, M. Fujiwara, R.D. Braatz, Comparative performance of con-
centration and temperature controlled batch crystallizations, Journal of ProcessControl 18 (2008) 399–407.57] N. Nonoyama, K. Hanaki, Y. Yabuki, Constant supersaturation control ofantisolvent-addition batch crystallization, Organic Process Research & Devel-opment 10 (2006) 727–732.