Embed Size (px)
Citation preview

Financial regulations improving but public fossil fuel finance continues
Page 7
Page XPage X
Raised ambition but the G20 is not on track for a 15degC world Page 2
Vulnerability of G20 members highlights the need to adapt now Page 6
Fossil fuels subsidised throughout the recovery Page 4
Rebounding emissions signal a return to business as usual
HH
Page 12Page 9
Transformative policies urgently needed in key sectors to curb rising emissions
CLIMATE TRANSPARENCY REPORT COMPARING G20 CLIMATE ACTION TOWARDS NET ZERO
THE HIGHLIGHTS
CLIMATE TRANSPARENCY REPORT | 2021 | RUSSIA ADAPTATION 1
Hold the increase in the global average temperature to well below 2degC above pre-industrial levels and pursue efforts to limit to 15degC recognising that this would significantly reduce the risks and impacts of climate change
PARISAGREEMENT
CLIMATE AMBITION
RAISED AMBITION BUT THE G20 IS NOT ON TRACK FOR A 15degC WORLD
G20 members need to urgently strengthen climate action
-125
-100
-75
-50
-25
0
25
50
75
100
125
150
175
UKUSAZAFJPNITAGERFRAEUKORMEXIDNIND CHNCANBRAAUSARGSAURUSTUR
Almost sucient
Critically insucient
Not available Highly insucient InsucientCAT overall
rating
NDC target (excl LULUCF) National target Current policy projection Ambition gap15degC modelled domestic pathway
GHG
emiss
ions
in 2
030
com
pare
d to
201
0 (
)
ROADMAP TO A 15degC WORLDThe Intergovernmental Panel on Climate Change (IPCC) recently issued a lsquocode redrsquo for the world to take urgent action to avoid the worst impacts of the escalating climate crisis and provided an updated estimate of the remaining global carbon budget The data show that for a 67 chance of limiting warming to 15degC the world has a remaining carbon budget of 400 GtCO2 ndash or 10 years of emissions at 2020 levels2
Collectively the G20 is responsible for around 75 of global greenhouse gases (GHGs) including land use change and forestry3 To limit the global temperature rise to 15degC the G20 therefore has an important leadership role to play by committing to emissions reduction targets and implementing policies that align with
15degC pathways For developed countries this includes providing climate finance to assist developing countriesrsquo mitigation and adaptation actions4
The combined mitigation effect of Nationally Determined Contribution (NDC) targets assessed by April 2021 is not sufficient and will lead to warming of 24degC by the end of the century5 This underlines the urgent need for G20 members to strengthen current climate policies and action and submit more ambitious 2030 targets that align with mid-century net zero targets
RAISED AMBITION REDUCING THE GAPNet zero targetsBy August 2021 14 G20 members had announced net zero targets by mid-century covering 61 of global GHG emissions If fully implemented these targets would go a long way to limiting global temperature rise to 15degC Canada the EU France Germany
Japan South Korea and the UK ndash together accounting for 14 of global GHGs ndash have also enshrined their target in law (see Figure 2)6 However more ambitious near-term targets that halve global CO2 emissions by 2030 are critical to achieving these long-term targets
NDCsBy September 2021 G20 members had officially submitted 13 NDC updates to the United Nations Framework Convention on Climate Change (UNFCCC) with six ndash Argentina Canada the EU (including France Germany and Italy) South Africa the UK and the USA ndash containing more ambitious 2030 targets than their last ones (see Figure 3) Three members ndash China Japan and South Korea ndash have also proposed higher ambition but have not yet officially submitted enhanced NDCs The greatest decreases were in submitted NDCs from the USA and the EU and in the NDC announced by China This is promising as these are among the highest emitting members of the G207
Figure 1 G20 NDC targets current policy projections and 15degC modelled domestic pathways
The Ambition gap is the gap between the NDC and the 15degC compatible range as modelled by the 15degC National Pathways Explorer and derived from 11 global models of the IPCC special report on 15degC More detail at http1p5ndc-pathwaysclimateanalyticsorgabout The CAT rating here is a new overall rating that combines several separately rated elements of policies and actions domestic and internationally supported targets lsquofair-sharersquo target and contribution to climate finance Detailed assessments and explanation of methodology at httpwwwclimateactiontrackerorgcountries
The national targets of France Germany and Italy are represented here As Turkey has yet to ratify the Paris Agreement its submission remains an Intended Nationally Determined Contribution (INDC)
Only Germanyrsquos national target has been assessed and rated by CAT Any rating associated with France and Italy is a rating of the EUrsquos NDC
In 2030 global CO2 emissions need to be 45 below 2010
levels reaching net zero by around 20501
Source CAT 2021 8 Climate Analytics 2021 9
2CLIMATE TRANSPARENCY REPORT | 2021
KEY ACTIONS FOR G20 MEMBERS
G20 members that have not yet done so need to adopt mid-century net zero targets that are embedded in law
G20 members that do not have 15degC aligned targets need to submit stronger ones before COP26 and all G20 members need to strengthen climate policies and actions to meet 15degC pathways
Developed countries need to ramp up climate finance contributions to assist developing countriesrsquo climate action
2 Provide a precise description of the target
Explain how the reference indicators are defined the assumptions behind the business-as-usual (BAU) projections the coverage of the target and the implementation period
3 Make a link to Paris Agreement goals
Describe when emissions are projected to peak (or have peaked) and refer to national policyies commitment to net zero emissions
4 Share the planning process
Provide information on institutional arrangements for developing and implementing the NDC including consultation processes that allow for public participation and engagement with local communities and indigenous peoples in a gender-responsive manner
5 Describe implementation plans
Provide information on which policies and measures will be implemented to achieve target(s)
1 Describe ambition and fairness
Provide detailed information sustained by emissions reduction analysis on how the current or updated NDC a) comprises a fair and ambitious contribution to global efforts to mitigate climate change and precisely how it is a progression on the last NDC mitigation target or action and b) will reflect the ldquohighest possible ambitionrdquo taking into account common but differentiated responsibilities and respective capabilities
In comparison Australia Brazil Indonesia Mexico and Russia have submitted NDCs with no change to their ambition with Brazil and Mexico altering their baselines which weakens their NDCs as it will result in higher emissions in 2030
BUT THE G20 IS NOT YET ALIGNED WITH A 15degC PATHWAYAll NDC updates submitted and announced up to April 2021 leave a significant emissions gap of about 23 GtCO2e from a 15degC pathway with the G20 collectively making up around two-thirds of this gap
If all G20 members strengthened their 2030 NDCs along a 15degC compatible domestic emissions pathway (see Figure 1) and reached net zero targets by 2050 with a faster timeline for developed countries than
Law Policy DocumentNet zero target covers all GHGs
Canada EU France Japan UK
USA China (2060)
No detail in net zero target on which GHGs are covered
Germany (2045) South Korea
Argentina Brazil Italy South Africa Indonesia (2060)
Figure 2 Timing status GHG coverage and use of offsets in current G20 net zero targets
Submitted a more ambitious NDC target
Proposed a more ambitious NDC target
Did not increase ambition in NDC target
Not yet submitted or proposed an updated NDC
Argentina (2nd
NDC) Canada EU (incl France Germany and Italy) South Africa UK (1st NDC) USA
China Japan South Korea
Australia Brazil Indonesia Mexico Russia
India Saudi Arabia
Figure 3 Status of updated NDCs
Turkeyrsquos submission remains an Intended Nationally Determined Contribution (INDC) until it ratifies the Paris Agreement
contributions to support action in developing countries Russia and Saudi Arabia are rated overall as ldquoCritically insufficientrdquo which means that if all governments took this approach global warming would exceed 4degC
The UK is the only G20 member with a domestic target that aligns with a 15degC modelled domestic pathway in 2030 however the overall rating is ldquoAlmost sufficientrdquo as its policies and action are not yet 15degC aligned nor is it meeting its lsquofair-sharersquo target or climate finance contribution Following closely are the EU Germany Japan South Africa and the USA which are rated overall as ldquoInsufficientrdquo From this group the EU and Germany are the only ones rated as ldquoAlmost sufficientrdquo for both their targets and their policies and action However none are meeting their lsquofair-sharersquo targets or climate finance contributions14
NDC Transparency Check recommendations15
The NDC Transparency Check assesses the quality of NDCs relating to whether a partyrsquos communication is clear transparent and understandable in terms of the requirements set out in the Paris Agreement its accompanying decision (1CP21) and Annex I to decision 4CMA1
for developing countries the current gap of 23 GtCO2e could be narrowed by 64 This would also result in a lower temperature of 17degC by 2100 This effort could get us about three-quarters of the way to limiting global warming to 15degC compared with the estimated 24degC of warming under current targets13
In CATrsquos new rating system most G20 membersrsquo are rated overall as ldquoHighly insufficientrdquo or ldquoCritically insufficientrdquo Argentina Australia Brazil Canada China India Indonesia Mexico and South Korea are rated overall as ldquoHighly Insufficientrdquo with Canadarsquos domestic target and Indiarsquos policies and action being the only elements within this group rated as ldquoAlmost sufficientrdquo These G20 members need to introduce much more ambitious domestic and internationally supported targets policies and action and for developed countries ramp up climate finance
Reductions or removals outside of own borders Note 11 of the G20 members have a net zero target year of 2050 excl China Germany and Indonesia
International offsets included No international offsets Unclear or undecided
Sources Climate Watch nd10 Energy amp Climate Intelligence Unit nd11
Source Climate Action Tracker 2021b 12
No targetAustralia India Mexico Russia Saudi Arabia Turkey
CLIMATE TRANSPARENCY REPORT | 2021 3
COVID RECOVERY
FOSSIL FUELS SUBSIDISED THROUGHOUT THE RECOVERY
The G20 missed the opportunity to shift away from fossil fuels through recovery investments
CLIMATE TRANSPARENCY REPORT | 2021
G20 total spending14244bn
1839bn
300bn
G20 Recovery spending
Green recovery spending
132
Liquidity support for large businesses
Liquidity support for subnational public entities
Targeted welfare cash transfers
Healthcare services support
Job continuation support
Liquidity support for SMEs
Current leaders80
70
60
50
40
30
20
10
001 005 01 05 1 5 10 500
BRA
TUR
CAN
MEXIND
Gree
n re
cove
ry s
pend
ing
( o
f tot
al re
cove
ry sp
endi
ng)
Recovery spending ( GDP logarithmic scale)
Developing countries Developed countries
(100)
Potential to act
IDN RUSARG
ITA
SAU
ZAF
Missing opportunities
GER
FRA
JPN KOR
UK
AUS
CHNUSA
$
FROM CRISES TO OPPORTUNITIESThe COVID-19 pandemic continues to devastate families and communities ndash around 47 million people worldwide had died by September 202116 While lockdowns and social restrictions have made life difficult for billions of people these responses also caused fewer car journeys flights and entire industries shutting down17 As a result energy-related CO2 emissions declined steeply by 6 in 2020 but are already projected to rebound strongly by 4 in 202118 Nonetheless the convergence of global health economic and climate crises has led to an opportunity for governments to ldquorecover betterrdquo by aligning medium-term recovery objectives with longer-term social and environmental objectives to achieve a clean green and resilient recovery
MISSED OPPORTUNITIES FOR A GREEN RECOVERYSince the beginning of the COVID-19 pandemic the G20 has mobilised USD 142tn in total stimulus spending to keep health services households and businesses afloat (see Figure 4) When implementing recovery packages governments missed the opportunity to transition to low carbon economies Only USD 300bn of the USD 18tn total recovery spending was directed to the much-heralded ldquogreenrdquo recovery
Canada France and Germany are identified as lsquocurrent leadersrsquo of the green recovery and based on recent announcements the EU would also fall into this group (see Figure 5) The majority of G20 members are however categorised as lsquomissing opportunitiesrsquo or having lsquopotential to actrsquo Non-OECD G20 members face greater
To avoid double counting the EU is not included when adding up total spending
Figure 5 G20 green recovery spending (January 2020-August 2021)
challenges to rebuild after multiple crises having to grapple with chronic problems and inequalities such as access to funds debt constraints and extreme poverty19 These members except China are mainly identified as having lsquopotential to actrsquo as they allocated less than 2 of their respective GDP to recovery spending of which less than 5 is for green investments In contrast OECD G20 members plus China who were mainly identified as lsquomissing opportunitiesrsquo allocated a higher proportion (of between 2-14) of their respective GDP to recovery but less than 30 was for green investments
Figure 4 G20rsquos total COVID-19 rescue and recovery spending (January 2020-August 2021)
Source Own analysis based on Global Recovery Observatory August 202120
The European Commission recently endorsed a budget of more than USD 1tn for 2021-2027 recovery spending including 37 allocated to a green transition This means that the EU would fall into the lsquocurrent leadersrsquo group in the graph To avoid double counting the EU is not included
Green recovery spending is based on potential impact on long- and short-term emissions air pollution natural capital quality of life and inequality Recovery spending includes incentive and investment measures such as worker retraining and job creation or transport and energy infrastructure investment Current leader means countries that allocated above 1 GDP to recovery spending and above 30 of recovery spending was for a green recovery Missing opportunities means countries allocated above 1 GDP to recovery spending but less than 30 of recovery spending was for a green recovery Potential to act means countries spent less than 1 GDP on recovery spending Bubble sizes represent total value of recovery spending
Source Own analysis based on Global Recovery Observatory August 2021 21
4
Figure 6 Conditional and unconditional fossil fuel subsidies in the G20 (January 2020-August 2021)
Total green recovery spending
300bn
G20 total spending
Green market creation25 UK
JPN
GER
Green energy24
CHI
KOR CAN
Green transport
Green building Green RampD
Natural capital1915
89
UK
GERKOR
CHI
KORUSA
FRA KORUK
KORFRA
Valu
e in
USD
bill
ion
Unconditional fossil fuel subsidies Conditional fossil fuel subsidies
0
10
20
30
40
50
60
70
80
BRAZAFAUSARGJPNMEXITAKORRUSSAUIDNTURCHNFRAGERINDCANUKUSA
KEY ACTIONS FOR G20 MEMBERS
MEANWHILE FOSSIL FUEL SUBSIDIES CONTINUED The G20 has continued to pour money into the fossil fuel industry with a total of USD 298bn committed in subsidies from January 2020 to August 2021 which is almost equal to the G20rsquos total green recovery allocation of USD 300bn (see Figure 6) These subsidies also ignore previous G20 promises to remove inefficient fossil fuel subsidies22 The majority or USD 248bn has gone towards unconditional fossil fuel subsidies with no lsquogreen stringsrsquo attached and the rest to conditional ones Oil and gas have benefited from the highest proportion of subsidies at USD 219bn whilst coal and fossil-fuel-based hydrogen have received USD 47bn and USD 11mn respectively China and India each announced subsidies of approximately USD 15bn aimed at expanding coal mining domestically whilst Canada France Germany the UK and the USA provided subsidies of more than USD 200bn to support oil and gas However more transparency about these figures is needed as Brazil Japan Saudi Arabia South Africa South Korea Turkey and the UK have been categorised as lsquoopaquersquo in terms of the full extent of fossil fuel funding and ldquohiddenrdquo subsidies23
GREEN SPENDING IN FOCUSGreen market creation green energy green transport natural capital green buildings and green research and development were among the sectors that benefited with G20 members including Canada China Germany France Japan South Korea the UK and the USA accounting for the majority of spending (see Figure 7) However to reach net zero emissions by mid-century and prevent emissions surging to a new record investments of USD 1tn per year from 2021-23 are needed across the power industry transport and building sectors where only 35 of these investment needs are currently being met25
G20 members need to introduce conditionality or ldquogreen stringsrdquo for recovery spending and reinforce policy regulations and incentives that align with near-term climate targets
G20 members that are still supporting fossil fuel industries need to redirect subsidies towards sector transformation and investments in renewable energy and other green sectors
Developing countries need support from developed G20 members to mobilise additional finance to encourage investment in green sectors
Figure 7 Total vs green spending and proportion of G20 member (excl EU) spending in various green sectors (January 2020-August 2021)
To avoid double counting the EU is not included when adding up total spending
Green market creation Investments promote the creation of green markets through a) increased clean energy market participation b) modernisation and transition investments and c) capacity investment For instance investments that prompt the integration of more renewable energy generation into electricity markets or investments which catalyse new green transitional industries
Source Own analysis based on Global Recovery Observatory August 2021 26
Policies are classified as unconditional if they support production and consumption of fossil fuels without any climate targets or additional pollution reduction requirements while policies with climate targets or additional pollution reduction requirements are categorised as conditional
Source Energy Policy Tracker 2021 24
CLIMATE TRANSPARENCY REPORT | 2021 5
Increase the ability to adapt to the adverse effects of climate change and foster climate resilience and low-GHG development PARISAGREEMENT
ADAPTATION ADDRESSING AND REDUCING VULNERABILITY TO CLIMATE CHANGE
CLIMATE TRANSPARENCY REPORT | 2021
Urgent implementation of plans and strategies is needed to reduce climate risk
VULNERABILITY OF G20 MEMBERS HIGHLIGHTS THE NEED TO ADAPT NOW
Figure 8 G20 membersrsquo readiness to adapt
03
04
05
06
07
08
09
028 032 036 040 044 048 052
Have great challenges but are adopting solutionsWell-positioned with fewer challenges
Fewer present challenges have time to get ready Greatest challenges and urgency to act
Adap
tatio
n re
adin
ess
Vulnerability
SAU
BRA
AUS
CAN
GER
FRA
UK
IDNIND
MEX
ITA
ARG
CHN
USA
KOR
RUS
TURZAF
G20
JPN
EU
KEY ACTIONS FOR G20 MEMBERS
LIVING IN A CLIMATE EMERGENCYGlobal warming will reach or exceed 15degC in the early 2030s in nearly all emissions scenarios considered by IPCC AR6 Under the very low emissions scenario however it will drop slightly to 15degC by the end of this century27 In 2021 G20 members are already experiencing first-hand the lsquolocked-inrsquo climate impacts of a warming world with record-breaking fires floods droughts extreme cold and heatwaves28 2020 was recorded as one of the hottest years on record and the last decade as the hottest ever29 Urgently allocating resources and planning to reduce vulnerability and strengthen resilience is of importance for all G20 members but especially for the most vulnerable ones30 From 2020-2030 it is estimated that an investment of USD 18tn in just five areas ndash early warning systems climate-resilient infrastructure dryland agriculture mangrove protection and water generation ndash would result in net benefits of USD 71tn31
HIGHER TEMPERATURES INCREASE CLIMATE RISK Chronic impacts and extreme weather events result in high human and economic costs which can be compounded by underlying inequalities poorly funded infrastructure and the effect of multiple crises including COVID-1932 Between 1999 and 2018 there have been nearly 500000 fatalities and close to USD 35tn of economic costs due to climate impacts worldwide with China India Japan Germany and the USA being hit particularly hard in 2018 Even if we meet 15degC and certainly if we exceed it the G20 will be exposed to even greater-than-average weather- and climate-related impacts Australia Brazil France Italy Mexico and Turkey will likely be exposed to severe water scarcity or droughts and it is expected that Australia India Mexico Saudi Arabia and South Africa will have many more days with extreme high temperatures Most G20 members could experience agricultural impacts such as reduced crop duration decreased rainfall and an increase in damaging hot spells for key crops all of which could lead to intensified local and global food insecurity33
DEVELOPING COUNTRIES FACE GREATEST CHALLENGES TO ADAPTAcross the G20 developing countries have the highest level of vulnerability to climate change but the lowest level of readiness and therefore face the greatest challenges (see Figure 8) Argentina Brazil China India Indonesia Mexico Saudi Arabia and South Africa are exposed to higher levels of vulnerability in the water and food sectors including projected change of cereal yields
low agricultural adaptive capacity and change of annual runoff These countries plus Turkey are also not ready to take on adaptation actions by leveraging public and private sector investments mainly due to issues of corruption regulatory quality rule of law or lower levels of innovation34 However recent extreme weather events have shown that developed countries must also improve their adaptation readiness and their ability to handle the worsening impacts of a fast-changing climate
G20 members urgently need adaptation plans and strategies in place across key systems ndash including food water health ecosystems habitat and infrastructure ndash and should strengthen their social economic and governance readiness to accelerate implementation of these plans
G20 members need to balance funding for adaptation not only with loss and damage for locked-in impacts but also with resources allocated to mitigation
Developed countries need to increase climate finance contributions to assist developing countries through bilateral and multilateral channels and with regular reviews
This graph shows the 2018 observed Readiness Index and 2050 projected Readiness Index describing a countryrsquos ability to improve climate resilience The readiness component of the Index created by the Notre Dame Global Adaptation Initiative (ND-GAIN) encompasses social economic and governance indicators to assess a countryrsquos readiness to deploy private and public investments in aid of adaptation The overlaid 2050 projections are qualitative and quantitative representations of a range of possible futures The range of scenarios shown here in lines are qualitatively described as a sustainable development compatible sce-nario (SSP1) a middle-of-the-road (SSP2) and a lsquoRegional Rivalryrsquo (SSP3) scenarioObserved (2018)
2050 ProjectionSSP1
SSP2
SSP3
Key
Source Own analysis based on Andrijevic et al 2020 35 ND-GAIN database (nd) 36
6
MITIGATION REDUCING EMISSIONS TO LIMIT GLOBAL TEMPERATURE INCREASE
Figure 9 Energy-related CO2 emissions and GDP variation (2019-2021)
REBOUNDING EMISSIONS SIGNAL A RETURN TO BUSINESS AS USUAL
Drastic cuts in CO2 emissions from the energy sector can be achieved by rapidly phasing out fossil fuels and stimulating growth in renewable energy
PARISAGREEMENT
Hold the increase in the global average temperature to well below 2degC above pre-industrial levels and pursue efforts to limit to 15degC recognising that this would significantly reduce the risks and impacts of climate change
-20
-15
-10
-5
0
5
10
ZAFUKMEXBRAAUSITASAUJPNEUFRARUSGERARGG20KORCANCHNUSAINDIDNTUR
Year
-on-
year
chan
ge in
ene
rgy-
rela
te C
O 2 em
issio
ns (
)
2019 GDP variation
share of G20 (2020)
1 2 9 17 38 22 1 2 6 1 4 29 1 1 2 1 1 2
Trend (2020-2021) -03 -04 -04 -08 -08 -12+72 +64 +62 +52 +49 +47 +41 +33 +31 +29 +24 +2 +18 +13+5
2019 CO2 emissions (from fuel combustion) 2020 GDP variation2020 CO2 emissions
(from fuel combustion) 2021 GDP variation2021 CO2 emissions projections(from fuel combustion)
CO2
In 2030 global CO2 emissions need to be around 45
below 2010 levels and reach net zero by around 2050 Global energy-related CO2 emissions must be cut by 40 below 2010 levels by 2030 and reach net zero by 2060 The share of fossil fuels globally needs to fall to 67 of global total primary energy by 2030 and to 33 by 2050 and to substantially lower levels without carbon capture and storage37
TRANSFORMING THE ENERGY SECTOR IS KEY TO A LOW-CARBON ECONOMYCO2 emissions from the energy sector make up 78 of all GHG emissions (including land use change and forestry) with the highest proportion coming from the power sector followed by industry and transport38 Increased energy efficiency reduced demand (including lifestyle and consumption shifts) fuel switching and electrification ndash in tandem
with decarbonisation of the power sector ndash will be necessary in all major sectors for the energy sector to be 15degC compatible
BUT CO2 EMISSIONS ARE REBOUNDING TO PEAK LEVELSDue to the COVID-19 pandemic in 2020 energy-related CO2 emissions dipped across the G20 by 6 compared to 2019 levels which was stronger than the 5 decrease in GDP In 2021 CO2 emissions are projected to rebound by 4 across the G20 however this is less than the projected GDP increase of 7 (see Figure 9) Nearly half of this rebound is being driven by the power sector and a quarter by the transport sector In OECD G20 members the projected rebound in 2021 will not fully offset the decline in 2020 despite the USArsquos significant rebound of 5 For non-OECD G20 members 2019 emissions levels however are likely to be exceeded Argentina China India and Indonesia are projected to exceed their 2019 emissions levels which is significant given that their combined energy-related CO2 emissions accounted for almost half of G20 CO2 emissions in 202039
Source Enerdata 2021
RENEWABLES ACCELERATEThe G20 has however increased its average share of renewables (excluding large hydro) in its total primary energy supply (TPES) mix by 32 from 2015-2020 to the current value of 7 in 2020 (see Figure 10) From 2019-20 the G20rsquos share of renewables (including large hydro) increased from 9 to 10 and this trend is projected to continue rising to 12 in 202140 Despite the pandemic there has been significant growth among G20 members in solar and wind power with new records being set in terms of overall installed capacities For example in 2020 newly installed capacity of 108 GW of wind power almost doubled compared to 2019 installations of 56 GW This has been driven mainly by Australia Brazil China the EU and the USA Solar photovoltaics (PV) have also shown strong growth in 2020 with new installations in Brazil China the EU and the USA totalling 85 GW41 The outlook for renewables is also good with both solar PV and wind power projected to continue growing during 2021 as projects restart As a result between 2015 -2020 the carbon intensity of the energy sector has decreased overall by 4 across the G2042
Due to rounding some graphs may sum to slightly above or below 100
7CLIMATE TRANSPARENCY REPORT | 2021
KEY ACTION FOR G20 MEMBERS
Figure 10 Total Primary Energy Supply (TPES) mix (level 2020 percentage change 2015-2020)
This graph shows the fuel mix for total primary energy supply including energy used not only for electricity generation heating and cooking but also for industrial and transport fuels
Renewables include wind solar hydro geothermal and biomass (excl residential biomass use)
BUT COAL IS GOING UP AGAIN The average share of fossil fuels in the G20rsquos TPES was 808 in 2020 but is projected to increase slightly to 812 in 2021 as demand for coal oil and gas returns to ldquonormalrdquo From 2015-2020 the share of fossil fuels in TPES decreased from 829 to 808 driven by a reduction in the G20rsquos total coal consumption of 8 due to reduced energy demand and the implementation of coal phase-out policies in the UK (-78 ) Italy (-63 ) Germany (-45 ) the EU (-42 ) and Canada (-28) However coal consumption is projected to
Just Transitions recent developmentsA Just Transition48 is an important part of the transition to a low-carbon economy
Canada The Canadian Coal Transition Initiative helps communities and workers affected by Canadarsquos move to a low-carbon economy in Alberta Saskatchewan and Atlantic Canada In 2021 Canada also launched discussions on proposed just transition legislation49
EU As part of the European Green Deal a Just Transition Mechanism (JTM) has been proposed to ensure that the transition to a climate-neutral economy takes place in a fair way It provides targeted support to help mobilise at least EUR 65-75bn over the period 2021-2027 in the most affected regions to alleviate the socio-economic impact of the transition50
South Korea The 2050 Carbon Neutral Strategy lays the framework for both a phase-out of coal-fired power plants and a just transition for persons who are economically dependent on the countryrsquos fossil fuel industries This includes retraining workers from these industries to prepare them for opportunities in new low-carbon industries Furthermore the Strategy calls for mobilising financial resources for climate-vulnerable communities52
South Africa A Presidential Commission has committed funds and resources to diversifying coal-dependent economies and introducing a range of reskilling social protection and job creation incentives across new green sectors Part of this initiative is to enable social dialogue and build support to establish more tangible measures around a just transition51
G20 members need to prioritise investment in renewable energy ndash also to avoid stranded fossil fuel assets ndash and accelerate coal phase-outs across the G20
rise by almost 5 in 2021 with much of this growth concentrated in China (61) the USA (18) and India (17)43 Globally China remains the highest producer and consumer of coal responsible for half of all coal44
AND GAS IS A BRIDGE TO NOWHEREBetween 2015-2020 the G20rsquos average natural gas consumption increased by 12 and is projected to remain at similar levels in 2021 OECD and non-OECD G20 members have both played a role in this increase at
19 and 8 respectively China (+69) South Korea (+19) India (+17) Canada (+16) Germany (+14) the USA (+12) and the EU (+11) are driving the increase as countries that are pursuing coal phase-out policies simply switch from coal to natural gas45 This is a risky move though with a high likelihood of stranded gas assets as the transition to a low-carbon economy accelerates46 The USA is currently the highest producer and consumer of global gas and oil being responsible for more than 2047
Source Enerdata 2021
Ener
gy m
ix (
)
Coal and Lignite Oil Natural gas Nuclear Renewables Other
Chan
ge in
shar
e of
rene
wab
le e
nerg
y in
TPES
(201
5-20
20)
OECD
Non-
OECD
0
20
40
60
80
100
FRABRAEUINDIDNCANUKKORGERITAUSAG20TURMEXJPNARGCHIRUSZAFAUSSAU-50
0
50
100
150
200
(546) 177
114
6157
34 322921 19
13
83
5242
3631 2821 18
10-09
8CLIMATE TRANSPARENCY REPORT | 2021
TRANSFORMATIVE POLICIES URGENTLY NEEDED IN KEY SECTORS TO CURB RISING EMISSIONS
Transformative and innovative policies and action in all sectors can accelerate the transition to a low-carbon future
Figure 12 Current coal power capacities of G20 members (as of July 2021)
OperatingIn construction Cancelled 2010-2021Retired 2000-2021Announced + Pre-permit + Permitted
Coal
pow
er p
lant
capa
citie
s (M
W)
CHN IND USAARGAUS BRACAN FRAGERIDN ITAJPN KOR MEXRUS TUR UKZAF-1500
-1000
-500
0
500
1000
1500
-100
-60
-20
20
60
100
Annual growth rate
in 2020
in 2019
2009-2018
G20 energy-related CO2 emissions ndash power sector (2020)
-53-19+13
power
381
DEEP AND FAST EMISSIONS CUTS REQUIRED ACROSS ALL SECTORSThe power generation industry and transport sectors produce the majority of GHG emissions in the G20 (see Figure 11)53 The transformation of all sectors is pivotal to achieving net zero CO2 emissions by around 2050 as well as decreases in all GHG emissions rapidly thereafter including actions to maintain and expand critical global carbon sinks such as forests
773 Waste
10 Agriculture
10 Industry2018
37944MtCO2e
29 Power
18 Industry
16 Transport
7 Building
6 Other energy-related
1 Agriculture
Energy
Figure 11 G20 GHG emissions by sector (2018)
Source Enerdata 2021
(38) natural gas (20) and oil (2) whilst the rest is from renewables including large hydro (28) and nuclear (11) In 2020 CO2 emissions in the power sector decreased by 5 due to reduced electricity demand during the COVID-19 pandemic However in 2021 emissions from the power sector are projected to rebound by 5 compared to 2020 due to increased demand56
Reducing the emissions intensity of electricity generation is a key mitigation strategy especially as global power demand is expected to at least double by 2050 compared to 201857 G20 emissions intensity has been decreasing from 2015-2020 However Australia China India Indonesia Saudi Arabia and South Africa registered above G20 average emissions intensity levels in 202058
POWER Coal phase-out urgent whilst renewables grow through the pandemic
Between 2030 and 2040 all the regions of the world need to phase
out coal-fired power generation By 2040 the share of renewable energy in electricity generation needs to be increased to at least 75 and the share of unabated coal reduced to zero54 55
Source Enerdata 2021
The power sector currently accounts for the highest share (at 38) of G20 energy-related CO2 emissions including heat from electricity production Fossil fuels are used for 60 of electricity needs including coal
Note Some G20 members have a very low to no coal power capacity (see Figure 10)
Source Global Energy Monitor 2021 59
China currently accounts for over half of the G20rsquos total coal capacity followed by India and the USA (see Figure 12) China also has the highest planned coal capacity (163 GW) followed by India (21 GW) Indonesia (18 GW) and Turkey (12 GW) G20 members have however started to take steps to phase out coal with France Italy and the UK all rated as
lsquofrontrunnersrsquo for coal phase-out policies with phase-out dates for coal by 2030 Despite these steps forward all G20 members will need to commit to phase out coal between 2030 and 2040 to meet the long-term temperature goal in the Paris Agreement60
From 2015-2020 the share of renewables in the G20rsquos power mix increased by 20 (see Figure 13) In 2020 renewables reached 286 of the G20rsquos power mix and this is projected to grow to 295 in 2021 This growth was partly due to decreased electricity demand in 202061 but also due to ongoing implementation of renewable energy policies and incentives as well as the falling cost of renewables62 Even though progress is being made this growth rate will need to accelerate significantly to reach 75 of the global power mix by 2040 Large and small hydro accounts for the highest proportion of the G20rsquos renewables (54) followed by wind (23) and solar (12)63 The EU Germany and the UK had the highest share of solar and wind power in 2020 but the UK alone is rated a lsquofrontrunnerrsquo as it has both short-term policies and long-term strategies for 100 renewables in place
9CLIMATE TRANSPARENCY REPORT | 2021
Figure 13 Share of renewables in power generation in 2020 and change in share of renewables incl large hydro (2015-2020)
Annual growth rate
in 2020
in 2019
2009-2018
G20 energy-related CO2 emissions ndashindustry sector (2020)
-12+00+12
sh
are
RE in
pow
er g
ener
atio
n
ch
ange
201
5-20
20
WindSolar GeothermalHydroBiomass amp waste
0
20
40
60
80
100
SAUKORZAFIDNUSARUSMEXINDARGAUSJPNFRAG20CHNEU27TURITAUKGERCANBRA0
40
80
120
160
200
163
117
7573 70
49 464340 39373130
24 2116
11 95 1
(523)
Industry
241
173Direct emissions
Indirect emissions
Note Saudi Arabia (523) South Korea (163) and South Africa (117) have had the highest increases over the last five years but renewables in their overall energy mix remain at 02 72 and 76 respectively
Annual growth rate
in 2020
in 2019
2009-2018
G20 energy-related CO2 emissions ndash transport sector (2020)
-146+10+17
transport
19Direct emissions
TRANSPORT More electric vehicles and modal shifting needed
The share of low-carbon fuels in the transport fuel mix globally
must increase to between 40 and 60 by 2040 and between 70 to 95 by 205064
Source Enerdata 2021
The transport sector is responsible for close to a fifth of the G20rsquos energy-related CO2 emissions ndash driven mainly by consumption of oil ndash with road travel accounting for two-thirds of these emissions mainly from passenger vehicles65 From 2009-2018 emissions increased by 17 per year and by 1 in 2019 In 2020 there was a significant decline due to the pandemic but in 2021 emissions are projected to rebound to near pre-pandemic levels66 To decarbonise the transport sector G20 members will need to engage in mass electrification switching to low-carbon fuels and modal shifting Across the G20 the cur-rent average market share of electric vehicles (EVs) in new car sales remains low at 32 (excluding the EU) with Germany France and the UK having the highest shares of EVs
INDUSTRY Steel and cement key to reducing emissions
Source Enerdata 2021
Source Enerdata 2021
Industrial emissions need to be reduced by 65-90 from 2010
levels by 205068
CO2 emissions in the industrial sector result from direct emissions (conversion of energy) indirect emissions (electricity and co-generated heat) and process emissions (mainly from iron steel or cement) From 2009-2018 in the G20 CO2 emissions from industry have grown by 12 per year In Argentina Brazil Mexico Russia and Saudi Arabia from 2012-2017 there has been an increase in emissions intensity of industry in part due to a shift in heavy industry moving to emerging and developing countries along with differences in technological standards and regulations69 Although challenging to decarbonise the production of steel and cement accounts for nearly half (44) of global CO2 emissions from industry worldwide and is therefore pivotal to transforming the industrial sector70
BUILDINGS Energy efficiency and electrification using low-carbon electricity needed
By 2040 global emissions from buildings need to be reduced by
90 from 2015 levels and reach 95-100 below 2015 levels by 205071 72
The building sector is responsible for close to a quarter of G20 energy-related CO2 emissions Building emissions occur directly (for heating and cooking) and indirectly (for air conditioning and appliances) From 2005-2018 energy-related emissions from the building sector increased by 05 per year Emissions intensity of existing residential and commercial buildings has however been gradually falling across major emitting economies partly due to improved energy efficiency and higher levels of electrification using low-carbon electricity73
Annual growth rate
in 2020
in 2019
2005-2018
G20 energy-related CO2 emissions ndash building sector (2020)
-28+06+05
Buildings
79
155Direct emissions
Indirect emissions
Source Enerdata 2021
Figure 14 Summary of policy ratings across sectors Low HighMedium FrontrunnerPolicy rating
Renewa-ble Energy in the power sector
Coal phase-out in the power sector
Phase-out of fossil fuel cars
Phase-out of fossil fuel heavy duty vehicles
Modal shift in ground transport
Near zero energy new buildings
Renova-tion of existing buildings
Energy efficiency in Industry
Target for net zero deforesta-tion
ARGAUSBRACANCHNEUFRAGERINDIDNITAJPNMEXRUSSAUZAFKORTURUKUSA
na
Source Climate Analytics 2021 67
10CLIMATE TRANSPARENCY REPORT | 2021
KEY ACTIONS FOR G20 MEMBERS
Forests can be a source of emissions when cut down or a carbon sink when more trees that take into account local ecosystems are either added to the landscape or protected The G20 has lost a total of 37 Mha per year of forest area between 2015-2020 (excluding Australia France Japan Saudi Arabia the UK and the USA for which data is unavailable) Afforestation activities have also increased between 2015 and 2020 leading to a net gain of +01 Mha per year to the G20rsquos total forest area Nonetheless from 2015-2020 Argentina Brazil Canada Indonesia Mexico and South Africa all registered net losses of forest area with Brazil and Indonesia driving global deforestation with massive losses of 15 Mha and 06 Mha per year respectively diminishing critical global carbon sinks In Brazil and Indonesia not only demand for land for food production but also the removal of environmental protections and regulations has contributed to increased deforestation Of note Australia is the only advanced G20 economy on a list of 24 global deforestation hotspots77 with an average forest loss of 04 Mha per year between 2010-201578
AGRICULTURELivestock driving increase in agricultural emissions
Methane emissions (mainly enteric fermentation) need to decline by
10 by 2030 and by 35 by 2050 (from 2010 levels) Nitrous oxide emissions (mainly from fertilisers and manure) need to be reduced by 10 by 2030 and by 20 by 2050 (from 2010 levels)79
Power Further stimulate and scale up growth in renewables whilst committing to a rapid phase-out of fossil fuels
Transport Introduce policies and measures aimed at fuel switching to low-carbon fuels mass electrification and modal shifting Sales of internal combustion engine (ICEs) vehicles should be banned by 2035 to limit temperatures to 15degC83
Industry Increase energy and material efficiency (fuel switching to low-carbon sources such as electrification green hydrogen) increase material recycling reduce demand and decarbonise production
Buildings Encourage retrofitting and electrifying existing buildings to reduce energy demand Require all new buildings to meet high energy-efficiency standards and be equipped with heating and cooling technologies that either are or can be zero emissions
Land use Implement net zero deforestation targets and policies protected area networks deforestation-free supply chains and forest-friendly infrastructure
Agriculture Improve productivity to feed a growing population shift high-meat diets towards plants slow the growth of food and agricultural land demand by reducing food loss and waste 28
Manure
43Entericfermentation (digestive processes of cattle)
20Syntheticfertilisers
7Burning of savanna2
Crop residues
2907MtCO2e
Figure 15 G20 GHG emissions from agriculture excl energy (2018)
Global deforestation needs to be halted and changed to net
zero CO2 removals by around 203076
On average building emissions per capita across the G20 are 14 tCO2capita a decrease of 29 between 2015-2020 but this is not a fast enough decrease74 In particular the USA (49 tCO2capita) and Australia (41 tCO2capita) have the highest building emissions per capita in the G20 reflecting the high share of fossil fuels especially natural gas and oil used for heat generation75
LAND USELoss of forest areas adding to the climate crisis
Emissions from agriculture accounted for 10 of the G20rsquos total GHG emissions in 2018 and 18 of the G20rsquos energy-related CO2 emissions The bulk of agricultural emissions
arise from methane and nitrous oxide with the main drivers being enteric fermentation (43) livestock manure (28) and synthetic fertilisers (20) (see Figure 15)81
Very high High Medium Low Very lowCurrent decarbonisation rating
Figure 16 Summary of 5-year trends and current decarbornisation ratings
Aviation emissions per capita 2013-2018 (tCO2capita change)
Building sector emissions per capita 2015-2020 (tCO2capita change)
Emissions intensity of industry 2012-2017 (kgCO2eUS$2015 GVA change)
Transport emissions per capita (exl aviation) 2015-2020 (tCO2capita change)
Growth in share of renewables in power generation (incl large hydro) 2015-2020 ( change)
1 5 9 11 16 21 24 26 31 37 39 40 43 46 49 70 73 75 117 163 523
ARG CAN ITA BRA CHN RUS G20 EU MEX TUR USA FRA JPN IND GER AUS UK IDN ZAF KOR SAU
Emissions intensity of the power sector 2015-2020 (gCP2kWh change)
-45 -42 -39 -31 -27 -23 -22 -22 -19 -15 -13 -13 -13 -13 -11 -11 -9 -8 -6 -3 -1
UK GER BRA CAN EU SAU USA ITA ARG FRA TUR KOR JPN AUS G20 CHN IND MEX RUS ZAF IDN
-18 -18 -15 -13 -12 -11 -11 -9 -8 -7 -5 -4 -3 -3 -2 0 0 1 25 23 22
UK ARG ITA SAU BRA ZAF JPN USA CAN MEX AUS G20 FRA EU TUR KOR RUS GER IND CHN IDN
-11 -8 4 7 8 11 13 16 17 17 21 23 24 25 29 32 35 45 45 54 102
BRA RUS FRA UK JPN AUS ARG CAN USA GER G20 EU ITA ZAF KOR IDN MEX SAU IND CHN TUR
-40 -27 -25 -24 -23 -23 -17 -17 -16 -15 -12 -12 -10 -4 -3 -1 0 3 19 29 38
SAU GER UK BRA EU ARG USA FRA AUS ITA MEX JPN CAN KOR G20 ZAF TUR IND RUS CHN IDN
-41 -30 -24 -19 -18 -17 -16 -16 -15 -13 -13 -12 -11 -11 -8 -8 0 0 1 8 24
UK CHN JPN USA IND AUS ITA G20 GER ZAF EU KOR TUR CAN IDN FRA MEX BRA RUS SAU ARG
Source Enerdata 2021 82
Current year is 2020 except for Aviation emissions per capita (2018) and Emissions intensity of industry (2017)
Source FAO 2021 80
11CLIMATE TRANSPARENCY REPORT | 2021
FINANCE MAKING FINANCE FLOWS CONSISTENT WITH CLIMATE GOALS
FINANCIAL REGULATIONS IMPROVING BUT PUBLIC FOSSIL FUEL FINANCE CONTINUES Financial actors from central banks to export credit agencies are finally integrating climate into their operations But continued public support for coal oil and gas must end immediately to have a chance of reaching climate targets
PARISAGREEMENT
Make finance flows consistent with a pathway towards low-GHG emissions and climate-resilient development
International public finance for coal must end immediately in all
G20 members to halt the development of coal power Investment in green energy and infrastructure needs to outweigh fossil fuel investments by 2025
Making all finance flows align with a low-carbon climate-compatible pathway is one of the key objectives of the Paris Agreement84 Due to the relative size of their economies and emissions G20 governments have a key role to play in showing leadership on this agenda by putting in place the right price signals and channelling all public finance away from high-carbon activities and assets towards clean climate-compatible ones and incentivising private finance flows to follow suit
FINANCIAL POLICIES AND REGULATIONSProgress on financial policies and regulations is moving at different speeds across the G2085 Some G20 members have continued taking steps to align their financial systems with sustainable development and address financial risks related to climate change There has been momentum on greening the financial sector at the international level
for example through the G20 sustainable finance working group and the Financial Stability Boardrsquos (FSB) climate risk roadmap86 However more concerted efforts are needed such as the standardisation of green finance practices promotion of disclosure standards for carbon and environmental risks and implementation of national sustainable finance roadmaps to transform the financial sector into a sustainable one
Significant regulatory and policy developments were seen in France Canada Japan the USA South Korea the UK and the EU (see Figure 17)
Some encouraging progress has also been seen in Australia China Germany India and Mexico where the central banks and financial regulatory authorities have stepped up to manage climate-related risks and opportunities within their financial sector through issuing relevant guidance and strategies or joining international networks that coordinate action in this area95 96 97 98 99
While most other G20 members have acknowledged the effects of climate change on their financial sector progress has been slow on green finance initiatives No major policy or regulatory level green finance commitments were identified in Russia Saudi Arabia or Turkey (aside from limited evidence
Figure 17 Regulatory and policy developments in G20 members to align financial systems with climate action
Note This figure illustrates examples of some key actions in G20 members but is not exhaustive of all recent developments in this areaSource Authorsrsquo own based on various sources
on efforts to stimulate green bonds or establish an ESG framework)100 101 102
FISCAL POLICIESAppropriate taxation and pricing instruments constitute incentives to align finance flows and investment with a climate-compatible future Removing budgetary support and tax exemptions for fossil fuels and putting in place effective carbon pricing schemes are key steps to this end alongside complementary fiscal policies supporting adaptation and a just transition
Fossil fuel subsidies remain very highThe continued provision of subsidies for the production and consumption of fossil fuels by G20 governments hinder the low-carbon transition by creating perverse incentives for their extraction and use thereby prolonging the life of fossil fuel assets
In 2009 G20 members committed to ldquorationalise and phase out over the medium-term inefficient fossil fuel subsidies that encourage wasteful consumptionrdquo103 However progress has been limited In 2019 alone G20 members excluding Saudi Arabia104 provided at least USD 152bn in subsidies for the production and consumption of coal oil and gas (see Figure 18)105
France
Responsible Investments Policy91 (Central Bank of France) 2021
Definitive exit from coal by 2024
South Korea
Official support for TCFD guidelines 202192
USA
Bill on climate risk disclosure 2021
Executive order to incorporate physical and transition climate risk in financial regulations 202189 90
UK
Task Force on Climate-related Financial Disclosures (TCFD) recommended report regulations 202187
Canada
Canadian Net-Zero Emissions Accountability Act 2021
Ministry of Finance to annually report on measures to address financial risks and climate change opportunities88
European Union
Climate change considerations in European Central Bank (ECB) monetary policy framework 2021
ECB climate change centre launched 202194
Japan
Regulatory guidelines on climate transition finance 202193
Bank of Japan to provide no-interest loans to financial institutions undertaking disclosure initiatives
12CLIMATE TRANSPARENCY REPORT | 2021
Five-year trends (2015-2019) for fossil fuel subsidies as a share of each countryrsquos GDP (which helps correct against currency and oil price fluctuations) show various extents of decrease in most G20 members most notably for Argentina106 China and Saudi Arabia (of between 57 and 70) but an increase in several others especially in Mexico Russia and France (in the order of 29-68) while remaining fairly stable in Canada and Turkey
Almost 40 of the total subsidies over the past years have been directed to petroleum
According to preliminary aggregate estimates107 government support for the production and consumption of fossil fuels in G20 economies excluding Saudi Arabia for which comparable data is not available decreased by 9 from 2019 This reduction was mostly due to COVID-19 impacts such as the fall in consumption of transport fuels brought about by mobility restrictions and a 10 decrease in support to the fossil fuel production sector driven by the drop in oil demand and the ensuing OPEC quotas of production in response108 However this decrease may well be offset by several examples of large sums of government support devoted to fossil fuel production in the form of sizeable bailouts to state oil and electricity companies once these are officially reported During 2020 G20 members pledged at least USD 252bn to fossil fuel energy as part of their energy-related funding commitments and COVID-19 economic response109
Most countries now have carbon pricing Pricing carbon effectively can encourage emitters across the entire economy to put in place efficiency measures and low-carbon transition plans Currently a total of 13 G20 members (as opposed to only 10 five years ago) have in place some form of explicit national carbon pricing scheme such as carbon taxes and emissions trading schemes (ETS) Brazil Indonesia Russia and Turkey are currently considering introducing such a scheme and some are currently trialling pilot schemes In 2020 explicit carbon pricing schemes generated total revenue of USD 47bn in the G20 with France and Japan recording the highest amounts of USD 93bn and USD 62bn respectively
Among the latest updates China launched its long-awaited national carbon ETS for the power sector (July 2021) the German government officially launched (January 2021) a national ldquocap-and-traderdquo system for the heating and road transport sectors (which are currently not covered by the EU ETS) and a UK ETS (as of January 2021) replaced the UKrsquos participation in the EU ETS following Brexit110 111 112
Figure 18 2019 G20 members fossil fuel subsidies (absolute values and per-unit of GDP shares) and 2015-2019 subsidy trends
Foss
il fue
l sub
sidie
s in
2019
(USD
bn)
Increased Decreased Remained steady
Five-year trends
Foss
il fue
l sub
sidie
s
of G
DP 2
019
(USD
bn)
0
5
10
15
20
USAJPNKORCHNGERCANINDTURIDNBRARUSFRAITAUKARGAUSZAFMEX00
02
04
06
08
climate aims (see Figure 19) France is the only G20 member whose carbon price is above the USD 40tCO2e threshold by 2020 recommended by the High-Level Commission on Carbon Prices A few G20 members (Canada Germany Italy South Korea the UK and the EU) have a carbon price that is defined as ldquolowrdquo (USD 11-39tCO2e)
Figure 19 Coverage and average price of explicit carbon pricing schemes in G20 members
Country Coverage Price (USD)
Argentina 20 95
Australia 0 na
Brazil 0 na
Canada 31 328
China 0 na
France 74 540
Germany 39 325
India 0 na
Indonesia 0 na
Italy 39 325
Japan 68 27
Mexico 46 33
Russia 0 na
Saudi Arabia 0 na
South Africa 80 95
South Korea 74 194
Turkey 0 na
UK 62 325
USA 0 na
EU 39 325
Coverage criteria based on that which was used in the BNEF Climate Policy Factbook
High gt66
Medium 33-66
Sufficient gtUSD 40
Low USD 11-39 Very low USD 1-10
Low lt33
None 0
Coverage
Price
while carbon prices in the rest of the G20 remain below the USD 10tCO2e threshold When emissions coverage is considered for national-level explicit carbon pricing schemes only schemes in France Japan South Africa and South Korea currently cover more than 66 of domestic emissions
Trends were assumed to have remained steady for increases or decreases within a +- 10 rangeNote Saudi Arabia is not included as comparable data is unavailable
Source OECD inventory of fossil fuel 2020113 For more information on the data see the Methodology note
Notes This table only includes national-level schemes and their prices It does not include sub-national schemes the inclusion of which would increase the overall level of coverage and pricing of carbon in a country For example according to the BNEF report Climate Policy Factbook in countries with significant sub-national schemes the overall coverage and prices can vary the levels and are as follows Canada 78 USD 31tCO2 China 43 USD 6tCO2 USA 8 USD 6tCO2114 For EU countries the table includes the EU ETS as well as any national scheme prices and it assumes that the EU ETS coverage is uniform across EU members and equal to the EU average coverage of 39 When a country has both its own national carbon pricing scheme and the EU ETS the one with the highest nominal price was chosen to determine the price in the table
Source Analysis based on data provided by I4CE 2021115 For more information see the Methodology note
However emissions coverage greatly varies and the price of carbon remains generally too low across the G20 to be in line with
13CLIMATE TRANSPARENCY REPORT | 2021
KEY ACTIONS FOR G20 MEMBERS
Finally the EU recently released a proposal for a new Carbon Border Adjustment Mechanism (CBAM) a climate measure that should prevent the risk of ldquocarbon leakagerdquo (the practice of moving carbon-intensive production abroad to avoid paying the price of carbon) In their July 2021 communiqueacute G20 Finance Ministers also mentioned the need for closer collaboration on carbon pricing mechanisms116
PUBLIC FINANCE FOR FOSSIL FUELSGovernments channel financing through public finance institutions including national and multi-lateral development banks and export credit agencies by providing direct funding and encouraging private investments by lowering the cost of and risk for capital Steering this financing away from high-carbon assets and towards appropriate adaptation and mitigation activities is crucial to aligning with the Paris Agreementrsquos goals
International public finance for fossil fuels continuesDuring 2018-19 G20 members provided USD 507bn per year of public finance for fossil fuels117 Over three-quarters of this financing was for oil and gas The highest providers of public finance were Japan (USD 103bnyr) China ( just over USD 8bnyr) and South Korea ( just under USD 8bnyr) (see Figure 20)
There has however been encouraging progress in terms of G20 members restricting public spending on fossil fuels through public finance institutions (PFIs) Multilateral development banks (MDBs) and nationally-owned development banks have made commitments in recent years to mainstream climate considerations in their operations and lending Most recently in May 2021 G7 nations made a commitment to end the use of public finance for new unabated international coal power plants118 South Korea also made a similar commitment119 In addition the US Treasury has announced a significant step away from international coal and gas projects through MDBs120 In September 2021 China also committed to end coal financing overseas121
However to support the phase-out of these fuels in line with climate goals such restrictions must be rapidly expanded to include oil and gas The UK government has shown leadership by announcing in December 2020 that it would no longer provide any fossil fuel finance internationally though with lack of clarity on natural gas projects122 This follows similar commitments by the EUrsquos PFIs The European Investment Bank (EIB) banned financing for all fossil fuels in 2019 but with exemptions for certain types of natural gas projects123 In July 2021 the European Bank for Reconstruction and Development (EBRD) committed to stop investing in upstream oil and gas projects by the end of 2022 to align its activities with the Paris Agreement124
International climate finance is still lackingAustralia Canada the EU France Germany Italy Japan the UK the USA are considered Annex II under the UNFCCC and are therefore obliged to provide climate finance to non-Annex II countries They reported an annual average international public support amount of USD 43bn between 2017-18 which only increased by 2 between 2018-19126 127
Japan is the largest contributor of climate finance among G20 members at over USD 12bn in 2017-18 which includes so-called lsquocleanrsquo coal as climate finance Flows are delivered predominantly through the Japanese Bank for International Cooperation (JICA) Germany and France follow at USD 84bn and USD 66bn respectively making use of KfW and the French Development Agency (AFD)
A number of non-Annex II countries of the G20 are voluntarily contributing climate finance (Brazil China India Indonesia Mexico Russia South Africa and South Korea) Russia has provided data on climate finance provision while other countries have pledged multilateral climate change funds
COP26 in 2021 marks the official start of negotiations towards the new climate finance goal The new goal will need to
exceed the target of USD 100bn a year from 2020 that developed countries committed to mobilise for developing countries from public and private sources At the G7 Summit in July 2021 Canada France Germany Italy Japan the UK and the USA reaffirmed their commitment to the USD 100bn through 2025128 And in September 2021 the European Commission committed an additional EUR 4bn (USD 5bn) by 2027 to support low-income and climate vulnerable countries129 Yet many estimates suggest they are still falling short of the target130 131 132 and countries are not doing their lsquofair-sharersquo133
With climate finance needs estimated to be far beyond USD 100bn a year it will be critical to develop trust between Global South and G7G20 members for this goal to be met Many Annex II G20 countries will need to show clear commitments to greater climate finance ambition than the current target and must use robust transparency and accountability mechanisms to ensure resources are effectively spent on quality projects In this respect the G7 commitment to end overseas development aid (ODA) for new coal is a key step in ensuring all finance flows are aligned with the Paris Agreement goal
Figure 20 G20 public finance for fossil fuels (USD millions per year 2018-19 average)
0
2000
4000
6000
8000
10000
12000
ZAFAUSARGTURFRAIDNMEXRUSBRAIND GERSAUUKITAUSACANKORCHNJPN
3OtherCoal
82
15
Oil and gas
Total50779
Initiatives integrating climate risk and reporting into their financial systems must move from voluntary to compulsory reporting and price and coverage of carbon pricing schemes must be increased
G20 members must eliminate continued subsidies as well as domestic and international public finance for fossil fuels
The nine G20 members who are required to provide climate finance to developing countries need to deliver the delayed USD 100bn and reaffirm their commitment for sufficient and high-quality financing that meets the needs of recipients
Coal coal extraction or coal-fired power generation Oil and gas oil and gas extraction processing or gas-fired electricity Other where support is provided for fossil fuels but the allocation between the types of fuel is unknown or it is provided to coal oil and gas activities (combined)
Source Oil Change International 2020125
14CLIMATE TRANSPARENCY REPORT | 2021
ENDNOTES1 Rogelj J et al (2018) ldquoMitigation Pathways Compatible
with 15degC in the Context of Sustainable Developmentrdquo in Masson-Delmotte V et al (eds) Global Warming of 15degC An IPCC Special Report on the Impacts of Global Warming of 15degC httpswwwipccchsiteassetsuploadssites2201905SR15_Chapter2_Low_Respdf
2 IPCC (2021) Climate Change 2021 The Physical Science Basis Contribution of Working Group I to the Sixth Assessment Report of the Intergovernmental Panel on Climate Change Eds Masson-Delmotte V et al httpswwwipccchreportar6wg1SPM
3 Climate Watch (nd) Historical GHG Emissions httpswwwclimatewatchdataorgghg-emissionsend_year=2018ampregions=G20ampsectors=total-including-lucfampstart_year=1990
4 UN (2015) Paris Agreement httpsunfcccintsitesdefaultfilesenglish_paris_agreementpdf
5 CAT (2021a) Global Update httpsclimateactiontrackerorgpublicationsglobal-update-september-2021
6 Climate Watch (nd) Historical GHG Emissions httpswwwclimatewatchdataorgghg-emissionsend_year=2018ampregions=G20ampsectors=total-including-lucfampstart_year=1990
7 CAT (2021a) Global Update8 Ibid9 Climate Analytics (2021) 15degC National Pathways Explorer
http1p5ndcpathwaysclimateanalyticsorg10 Climate Watch (nd) Net-Zero Tracker httpswww
climatewatchdataorgnet-zero-tracker11 Energy and Climate Intelligence Unit (nd) Net Zero Tracker
httpseciunetnetzerotracker12 CAT (2021b) CAT Climate Target Update Tracker13 Climate Analytics (2021) Closing the Gap https
climateanalyticsorglatestnew-report-finds-ambitious-action-by-g20-countries-alone-can-limit-warming-to-17c-keeping-15c-goal-within-reach
14 CAT (2021a) Global Update15 Climate Transparency (nd) NDC Transparency Check https
wwwclimate-transparencyorgndc-transparency-check16 World Health Organisation (2021) WHO Coronavirus (COVID-19)
Dashboard httpscovid19whoint [At the time of writing there were 4654548 deaths figure updated 30 September 2021]
17 OECD (2020) COVID-19 and the Aviation Industry Impact and Policy Responses httpswwwoecdorg
18 Based on data received directly from Enerdata (2021)19 UNEP (2021) Are We Building Back Better Evidence from 2020
and Pathways for Inclusive Green Recovery Spending httpswwwuneporg
20 Global Recovery Observatory (August 2021) How Are Countries Investing in Recovery UNDP httpsdataundporgcontentglobal-recovery-observatory
21 Ibid22 G20 (2009) G20 Leaders Statement The Pittsburgh
Summit G20 Research Group httpwwwg20utorontoca20092009communique0925html
23 IISD et al (2020) Doubling Back and Doubling Down G20 Scorecard on Fossil Fuel Funding httpswwwiisdorgsystemfiles2020-11g20-scorecard-reportpdf
24 Energy Policy Tracker (2021) G20 Countries httpswwwenergypolicytrackerorgregiong20
25 IEA (2021a) Sustainable Recovery Tracker httpswwwieaorgreportssustainable-recovery-tracker
26 Global Recovery Observatory (August 2021) How Are Countries Investing in Recovery
27 IPCC (2021) Climate Change 2021 The Physical Science Basis 28 World Weather Attribution (2021) Western North American
Extreme Heat Virtually Impossible Without Human-Caused Climate Change httpswwwworldweatherattributionorg
29 World Meteorological Organisation (2021) 2020 Was One of the Three Warmest Years On Record httpspublicwmoint
30 ND-GAIN (nd) Methodology httpsgainndeduour-workcountry-indexmethodology
31 Global Centre on Adaptation (2020) State and Trends Report 2020 httpsgcaorgwp-contentuploads202103GCA-State-and-Trends-Report-2020-Online-3pdf
32 Germanwatch (2020) Global Climate Risk Index 2020 httpsgermanwatchorgen17307
33 Arnell N W et al (2019) ldquoGlobal and Regional Impacts of Climate Change at Different Levels of Global Temperature Increaserdquo Climatic Change httpslinkspringercomarticle1010072Fs10584-019-02464-z
34 ND-GAIN (nd) Country Index httpsgainndeduour-workcountry-index
35 Andrijevic M et al (2020) ldquoGovernance in Socioeconomic Pathways and its Role for Future Adaptive Capacityrdquo Nature Sustainability httpsdoiorg101038s41893-019-0405-0
36 ND-GAIN (nd) Country Index37 Rogelj J et al (2018) ldquoMitigation Pathways Compatible with
15degC in the Context of Sustainable Developmentrdquo38 Based on data received directly from Enerdata (2021)39 Ibid40 Ibid
41 Enerdata (2021) Global Energy and CO2 Data httpswwwenerdatanetresearchenergy-market-data-co2-emissions-databasehtml
42 Based on data received directly from Enerdata (2021)43 Ibid44 US Energy Information Administration (nd) Data https
wwweiagovinternationaldataworld45 Based on data received directly from Enerdata (2021)46 IEEFA (2021) Stranded Asset Risks For Gas Investments
Climbing Quickly httpsieefaorgstranded-asset-risks-for-gas-investments-climbing-quickly
47 US Energy Information Administration (nd) Data httpswwweiagovinternationaldataworld
48 International Labour Organisation (2015) Guidelines For a Just Transition Towards Environmentally Sustainable Economies and Societies For All httpswwwiloorg
49 Government of Canada (2021) People-Centred Just Transition Discussion Paper httpswwwrncanengagenrcanca
50 European Commission (nd) The Just Transition Mechanism Making Sure No One is Left Behind httpseceuropaeu
51 Department of Forestry Fisheries and the Environment (2020) Cabinet Approves Climate Change Emissions Reduction and Waste Management Plans httpswwwenvironmentgovza
52 The Government of the Republic of Korea (2020) 2050 Carbon Neutral Strategy of the Republic of Korea UNFCCC httpsunfcccintsitesdefaultfilesresourceLTS1_RKoreapdf
53 Based on data received directly from Enerdata (2021)54 CAT (2020) Paris Agreement Compatible Sectoral Benchmarks
Study httpsclimateactiontrackerorgpublicationsparis-agreement-benchmarks
55 Rogelj J et al (2018) ldquoMitigation Pathways Compatible with 15degC in the Context of Sustainable Developmentrdquo
56 Based on data received directly from Enerdata (2021)57 IRENA (2018) Global Energy Transformation A Roadmap to
2050 httpswwwirenaorg-mediaFilesIRENAAgencyPublication2018AprIRENA_Report_GET_2018pdf
58 Based on data received directly from Enerdata (2021)59 Global Energy Monitor (2021) Global Coal Plant Tracker ndash
Dashboard httpsglobalenergymonitororgprojectsglobal-coal-plant-trackerdashboard
60 It should be noted that some countries have a very low to no coal power capacity For example please see the energy mix graph (energy chapter) for details on fossil fuels in Argentina Saudi Arabia has never used coal and is also not planning to build any coal plants but is 100 dependent on oil and gas plants
61 Enerdata (2021) Global Energy and CO2 Data62 IEA (2020a) Global Energy Review 2020 httpsieablobcore
windowsnetassets7e802f6a-0b30-4714-abb1-46f21a7a9530Global_Energy_Review_2020pdf
63 Based on data received directly from Enerdata (2021)64 Rogelj J et al (2018) ldquoMitigation Pathways Compatible with
15degC in the Context of Sustainable Developmentrdquo 65 Ritchie H (2019) Who Has Contributed Most to Global CO2
Emissions Our World In Data httpsourworldindataorgcontributed-most-global-co2 Note aviation accounts for 116 and shipping accounts for 106 of transport emissions Long-distance road freight (large trucks) aviation and shipping are particularly difficult to eliminate
66 Based on data received directly from Enerdata (2021)67 Climate Transparency (2021) Country Profiles httpswww
climate-transparencyorg68 Rogelj J et al (2018) ldquoMitigation Pathways Compatible with
15degC in the Context of Sustainable Developmentrdquo69 Baumert KA (2005) Navigating the Numbers Greenhouse
Gas Data and International Climate Policy World Resources Institute httpswwwwriorgresearchnavigating-numbers
70 IPCC (2014) ldquoIndustryrdquo in Climate Change 2014 Mitigation of Climate Change Contribution of Working Group III to the Fifth Assessment Report of the Intergovernmental Panel on Climate Change Eds Edenhofer O et al httpswwwipccch
71 CAT (2020) Paris Agreement Compatible Sectoral Benchmarks Study
72 Rogelj J et al (2018) ldquoMitigation Pathways Compatible with 15degC in the Context of Sustainable Developmentrdquo
73 IEA (2020b) Energy Efficiency 2020 httpswwwieaorgreportsenergy-efficiency-2020
74 Based on data received directly from Enerdata (2021)75 IEA (2020c) Heating httpswwwieaorgreportsheating76 Rogelj J et al (2018) ldquoMitigation Pathways Compatible with
15degC in the Context of Sustainable Developmentrdquo77 WWF (2021) Australia Remains the Only Developed Nation on
the List of Global Deforestation Fronts httpswwwwwforgau78 Global Forest Resources Assessment (2020) Annual Forest
Expansion Deforestation and Net Change Indicator Food and Agriculture Organisation httpsfra-datafaoorgWOfra2020forestAreaChange
79 Rogelj J et al (2018) ldquoMitigation Pathways Compatible with 15degC in the Context of Sustainable Developmentrdquo
80 Food and Agriculture Organisation (FAO) (2021) Emissions Totals Agriculture httpwwwfaoorgfaostatendataGT
81 Ibid 82 Based on data received directly from Enerdata (2021)
83 IEA (2021b) Net Zero by 2050 A Roadmap for the Global Energy Sector httpswwwieaorgreportsnet-zero-by-2050
84 UN (2015) Paris Agreement85 European Think Tanks Group (2021) G20 Ministerial Meetings
High Time for Development and Finance Ministers to Work Hand in Hand For a Sustainable Global Recovery httpsettgeu
86 Financial Stability Board (2021) FSB Roadmap for Addressing Climate-related Financial Risks httpswwwfsborg202107fsb-roadmap-for-addressing-climate-related-financial-risks
87 UK Government (2021) Governance and Reporting of Climate Change Risk Guidance For Trustees of Occupational Schemes httpswwwgovuk
88 Parliament of Canada (2021) BILL C-12 An Act Respecting Transparency and Accountability in Canadarsquos Efforts to Achieve Net-Zero Greenhouse Gas Emissions by the Year 2050 httpslaws-loisjusticegccaengactsC-193FullTexthtml
89 US House Committee on Financial Services (2021) To Amend the Securities Exchange Act of 1934 to Require Certain Disclosures Relating to Climate Change and For Other Purposes httpsfinancialserviceshousegovuploadedfiles0225_bills-1173ihpdf
90 The White House (2021) Executive Order on Climate-Related Financial Risk httpswwwwhitehousegov
91 Banque de France (2021) Responsible Investment Policy Reinforcing Exclusions With Regard to Fossil Fuels httpswwwbanque-francefr
92 Financial Services Commission (2021) Financial Authorities and Relevant Institutions Declare Support for TCFD and Its Recommendations httpswwwfscgokr
93 Financial Services Agency (2021) Basic Guidelines on Climate Transition Finance httpswwwfsagojpnewsr2singi20210507_204pdf
94 European Central Bank (2021b) ECB Presents Action Plan to Include Climate Change Considerations in Its Monetary Policy Strategy httpswwwecbeuropaeupressprdate2021htmlecbpr210708_1~f104919225enhtml
95 Australian Prudential Regulation Authority (2021) APRA Releases Guidance on Managing The Financial Risks of Climate Change httpswwwapragovau
96 Peoplersquos Bank of China (2020) ldquoSupporting Low-Carbon Development With Green Financerdquo Video speech at the Singapore FinTech Festival (SFF) 2020 httpwwwpbcgovcnen3688110368817240482694141587indexhtml
97 Green Finance Platform (2019) The Sustainable Finance Committee of the Federal Government httpswwwgreenfinanceplatformorg
98 Reserve Bank of India (2021) Financial Stability Report httpswwwrbiorginScriptsPublicationReportDetailsaspxUrlPage=ampID=1174
99 The Biodiversity Finance Initiative (2021) Mexico Starts Dialogue with Central Bank About Greening the Finance Sector httpswwwbiofinorgnews-and-mediamexico-starts-dialogue-central-bank-about-greening-finance-sector
100 Bank of Russia (2020) Information Letter on Recommendations for the Implementation of the Principles of Responsible Investment httpswwwcbrrucontentdocumentfile112325in-06-28_111_epdf
101 Reuters (2021) Saudi Sovereign Wealth Fund Scopes Banks for ESG framework httpswwwreuterscom
102 Turkey Investment Office (2021) New Economic Reform Package Heralded by President Erdoğan httpswwwinvestgovtr
103 G20 (2009) G20 Leadersrsquo Statement The Pittsburgh Summit 104 IEA (2020d) Energy Subsidies Database httpswwwiea
orgtopicsenergy-subsidies For more information on the data see the Methodology note at wwwclimate-transparencyorgg20-climate-performanceg20report2021
105 OECD-IEA (2020) Fossil Fuel Support Database 2020 update httpswwwoecdorgfossil-fuelscountrydata and httpswwwieaorgdata-and-statisticschartsvalue-of-fossil-fuel-consumption-subsidies-2010-2020 For more information on the data see the Methodology note at at wwwclimate-transparencyorgg20-climate-performanceg20report2021
106 Note the interpretation of some of the five-year trends requires some caution For example in the case of Argentina the observed trend can be partly explained by a substantial increase in the national budget due to the countryrsquos currency devaluation For more information see Fundacioacuten Ambiente y Recursos Naturales (FARN) (2020) Fossil Fuel Subsidies Is Every Little Thing ldquoGonna Be Alrightrdquo httpsfarnorgarwp-contentuploads202008DOC_SUBSIDIOS_2019-2020_FINAL_INGLES_linkspdf
107 OECD (2021 15 July) Update on Recent Progress in Reform of Inefficient Fossil-Fuel Subsidies That Encourage Wasteful Consumption 2021 httpswwwoecdorg
108 Ibid109 Energy Policy Tracker (2021) Track Public Money for Energy in
Recovery Packages httpswwwenergypolicytrackerorg110 Reuters (2021) Chinarsquos Carbon Trading Scheme Makes Debut
with 41 Million Tonnes in Turnover httpswwwreuterscom111 Schulz F translated by S Lawton (2020) ldquoGerman Cabinet
Agrees CO2 Price of euro25 from January 2021rdquo Euractiv httpswwweuractivde
112 UK Government (2021) Participating in the UK Emissions Trading Scheme (UK ETS) httpswwwgovuk
15CLIMATE TRANSPARENCY REPORT | 2021
This Highlights Report is part of the Climate Transparency Report 2021 Find the G20 country profiles at wwwclimate-transparencyorg
Climate Transparency is a global partnership with a shared mission to stimulate a ldquorace to the toprdquo in climate action in G20 countries through enhanced transparency
ACKNOWLEDGMENTS
PARTNERS DATA PARTNERS
FUNDERS
ClimateActionTracker
Supported by
based on a decision of the German Bundestag
113 OECD-IEA (2020) Fossil Fuel Support Database 2020 update For more information on the data see the Methodology note at wwwclimate-transparencyorgg20-climate-performanceg20report2021
114 BNEF (2021) Climate Policy Factbook httpswwwunorg115 Institute for Climate Economics (I4CE) (2021) Global Carbon
Accounts 2021 Paris France httpswwwi4ceorgdownloadglobal-carbon-account-in-2021 For more information see the Methodology Note at wwwclimate-transparencyorgg20-climate-performanceg20report2021
116 G20 (2021) Italian G20 Presidency Third Finance Ministers and Central Bank Governors Meeting Communique 9-10 July 2021 httpswwwg20orgwp-contentuploads202107Communique-Third-G20-FMCBG-meeting-9-10-July-2021pdf
117 Oil Change International (2020) Still Digging G20 Governments Continue to Finance the Climate Crisis httppriceofoilorg20200527g20-still-digging
118 Climate Home News (2021) G7 Commits to End Unabated Coal Finance in 2021 To lsquoKeep 15C Within Reachrsquo httpswwwclimatechangenewscom20210521g7-commits-end-unabated-coal-finance-2021-keep-1-5c-within-reach
119 Reuters (2021) South Korearsquos Moon Vows to End New Funding for Overseas Coal Projects httpswwwreuterscomarticleglobal-climate-summit-southkorea-idUSL4N2MF3R2
120 US Treasury (2021) Treasury Announces Fossil Fuel Energy Guidance for Multilateral Development Banks httpshometreasurygovnewspress-releasesjy0323
121 Ministry of Foreign Affairs of the Peoplersquos Republic of China (2021) Xi Jinping Attends the General Debate of the 76th UN General Assembly and Delivers an Important Speech httpswwwfmprcgovcnmfa_engzxxx_662805t1909172shtml
122 UK Government (2020) PM Announces the UK Will End Support for Fossil Fuel Sector Overseas httpswwwgovuk
123 European Investment Bank (EIB) (2019) EU Bank Launches Ambitious New Climate Strategy and Energy Lending Policy httpswwweiborgenpressall2019-313-eu-bank-launches-ambitious-new-climate-strategy-and-energy-lending-policy
124 European Bank for Reconstruction and Development (EBRD) (2021) EBRD Announces Full Paris Alignment by End-2022 httpswwwebrdcomnews2021ebrd-announces-full-paris-alignment-by-end2022-html
125 Oil Change International (2020) Still Digging G20 Governments Continue to Finance the Climate Crisis For more information see the Methodology note at wwwclimate-transparencyorgg20-climate-performanceg20report2021
126 The public support reported through membersrsquo biennial reports to the UNFCCC include bilateral and regional climate finance finance channelled through the multilateral climate change funds and support to multilateral and bilateral institutions that parties cannot specify as climate-specific (eg MDBs UN bodies) UNFCCC (2020) Country Biennial Report Submissions to the UNFCCC Fourth Biennial Reports httpsunfcccintBRs The USA did not provide a BR4 therefore the
provisional data provided to the UNFCCC in 2018 (thus for the 2015-16 period) is used as an estimate
127 OECD (2021) Climate Finance Provided and Mobilised by Developed Countries Aggregate Trends Updated with 2019 Data httpswwwoecdorgenvironmentclimate-finance-provided-and-mobilised-by-developed-countries-aggregate-trends-updated-with-2019-data-03590fb7-enhtm
128 G7 (2021) Carbis Bay G7 Summit Communique httpswwwg7ukorgwp-contentuploads202106Carbis-Bay-G7-Summit-Communique-PDF-430KB-25-pages-5pdf
129 Farnad C (2021) ldquoEU Commits euro4 Billion More to Climate Vulnerables Calls on the US to Step Uprdquo Climate Change News httpswwwclimatechangenewscom20210915eu-commits-e4-billion-climate-vulnerables-calls-us-step
130 Oxfam (2020) Climate Finance Shadow Report 2020 Assessing Progress Towards the $100 Billion Commitment 2020 httpswwwoxfamorgenresearchclimate-finance-shadow-report-2020
131 Bhattacharya A Calland R Averchenkova A Gonzalez L Martinez-diaz L and J Van Rooij (2020) Delivering on the $100 Billion Climate Finance Commitment and Transforming Climate Finance httpswwwunorgsitesun2unorgfiles100_billion_climate_finance_reportpdf
132 OECD-IEA (2020) Fossil Fuel Support Database 2020 update 133 Colenbrander S Cao Y Pettinotti L and A Quevedo (2021)
A Fair Share of Climate Finance Apportioning Responsibility for the $100 Billion Climate Finance Goal httpsodiorg
Highlights Report Leads Gahee Han amp Justine Holmes (Solutions For Our Climate (SFOC))
Country Profiles Lead Kim Coetzee (Climate Analytics)
Finance Lead Ipek Genccedilsuuml (ODI)
Contributing authors expert comments and inputs Aleksandra Kotur Florian Mersmann Gerd Leipold Pia Gleich (Humboldt-Viadrina Governance Platform) Andrezj Ancygier Anna Chapman Carley Reynolds Chelsea Jones Claire Fyson Claire Stockwell Deborah Ramalope Jae Kim Marie-Camille Attard Nandani Das Ryan Wilson Sharna Nolan Victor Maxwell Yann Robiou du Pont Data Team Andreas Geiges (Lead) Himalaya Bir Shrestha Sylvia Schmidt (Climate Analytics) Angela Picciariello Charlene Watson Nandini Sharma (ODI) Abhishek Kaushik Sachi Vohra (The Energy and Resources Institute) Analuz Presbiacutetero Mariana Gutieacuterrez Grados Jorge Villarreal (Iniciativa Climatica de Mexico) Andrew Marquard Bryce McCall (Energy Systems Research Group University of Cape Town) Ayse Sari (SHURA) Bert Metz (European Climate Foundation) Benoicirct Prunel Jeacutereacutemy Bonnefous Pascal Charriau (Enerdata) Caroline Lee (Canadian Institute for Climate Choices) Dorka Bauer (GSCC) David Eckstein Jan Burck (Germanwatch) Enrique Maurtua Konstantinidis Jazmiacuten Rocco Predassi (Fundacion Ambiente y Recursos Naturales) Fabby Tumiwa Lisa Wijayani (Institute for Essential Service Reform) Jiang Kejun (Beijing University of Technology) Georgia McDonnell Joojin Kim Jeehye Park Jessica Yun Kyungrak Kwon Sejong Youn Soojin Kim Sunwoo Lee (Solutions For Our Climate (SFOC)) Keisuke Iyadomi Rachel Chi Kiu Mok Sandhya Srinivasan (World Bank) Kentaro Tamura (Institute for Global Environmental Strategies) Lola Vallejo (Institute for Sustainable Development and International Relations) Simon Maxwell Surabi Menon (ClimateWorks Foundation) William Wills (Centro Clima Federal University of Rio de Janeiro)
Design Design for development (wwwd4dcoza) Editor Chapel Lane Editing Services Tanya Goodman
16CLIMATE TRANSPARENCY REPORT | 2021

Hold the increase in the global average temperature to well below 2degC above pre-industrial levels and pursue efforts to limit to 15degC recognising that this would significantly reduce the risks and impacts of climate change
PARISAGREEMENT
CLIMATE AMBITION
RAISED AMBITION BUT THE G20 IS NOT ON TRACK FOR A 15degC WORLD
G20 members need to urgently strengthen climate action
-125
-100
-75
-50
-25
0
25
50
75
100
125
150
175
UKUSAZAFJPNITAGERFRAEUKORMEXIDNIND CHNCANBRAAUSARGSAURUSTUR
Almost sucient
Critically insucient
Not available Highly insucient InsucientCAT overall
rating
NDC target (excl LULUCF) National target Current policy projection Ambition gap15degC modelled domestic pathway
GHG
emiss
ions
in 2
030
com
pare
d to
201
0 (
)
ROADMAP TO A 15degC WORLDThe Intergovernmental Panel on Climate Change (IPCC) recently issued a lsquocode redrsquo for the world to take urgent action to avoid the worst impacts of the escalating climate crisis and provided an updated estimate of the remaining global carbon budget The data show that for a 67 chance of limiting warming to 15degC the world has a remaining carbon budget of 400 GtCO2 ndash or 10 years of emissions at 2020 levels2
Collectively the G20 is responsible for around 75 of global greenhouse gases (GHGs) including land use change and forestry3 To limit the global temperature rise to 15degC the G20 therefore has an important leadership role to play by committing to emissions reduction targets and implementing policies that align with
15degC pathways For developed countries this includes providing climate finance to assist developing countriesrsquo mitigation and adaptation actions4
The combined mitigation effect of Nationally Determined Contribution (NDC) targets assessed by April 2021 is not sufficient and will lead to warming of 24degC by the end of the century5 This underlines the urgent need for G20 members to strengthen current climate policies and action and submit more ambitious 2030 targets that align with mid-century net zero targets
RAISED AMBITION REDUCING THE GAPNet zero targetsBy August 2021 14 G20 members had announced net zero targets by mid-century covering 61 of global GHG emissions If fully implemented these targets would go a long way to limiting global temperature rise to 15degC Canada the EU France Germany
Japan South Korea and the UK ndash together accounting for 14 of global GHGs ndash have also enshrined their target in law (see Figure 2)6 However more ambitious near-term targets that halve global CO2 emissions by 2030 are critical to achieving these long-term targets
NDCsBy September 2021 G20 members had officially submitted 13 NDC updates to the United Nations Framework Convention on Climate Change (UNFCCC) with six ndash Argentina Canada the EU (including France Germany and Italy) South Africa the UK and the USA ndash containing more ambitious 2030 targets than their last ones (see Figure 3) Three members ndash China Japan and South Korea ndash have also proposed higher ambition but have not yet officially submitted enhanced NDCs The greatest decreases were in submitted NDCs from the USA and the EU and in the NDC announced by China This is promising as these are among the highest emitting members of the G207
Figure 1 G20 NDC targets current policy projections and 15degC modelled domestic pathways
The Ambition gap is the gap between the NDC and the 15degC compatible range as modelled by the 15degC National Pathways Explorer and derived from 11 global models of the IPCC special report on 15degC More detail at http1p5ndc-pathwaysclimateanalyticsorgabout The CAT rating here is a new overall rating that combines several separately rated elements of policies and actions domestic and internationally supported targets lsquofair-sharersquo target and contribution to climate finance Detailed assessments and explanation of methodology at httpwwwclimateactiontrackerorgcountries
The national targets of France Germany and Italy are represented here As Turkey has yet to ratify the Paris Agreement its submission remains an Intended Nationally Determined Contribution (INDC)
Only Germanyrsquos national target has been assessed and rated by CAT Any rating associated with France and Italy is a rating of the EUrsquos NDC
In 2030 global CO2 emissions need to be 45 below 2010
levels reaching net zero by around 20501
Source CAT 2021 8 Climate Analytics 2021 9
2CLIMATE TRANSPARENCY REPORT | 2021
KEY ACTIONS FOR G20 MEMBERS
G20 members that have not yet done so need to adopt mid-century net zero targets that are embedded in law
G20 members that do not have 15degC aligned targets need to submit stronger ones before COP26 and all G20 members need to strengthen climate policies and actions to meet 15degC pathways
Developed countries need to ramp up climate finance contributions to assist developing countriesrsquo climate action
2 Provide a precise description of the target
Explain how the reference indicators are defined the assumptions behind the business-as-usual (BAU) projections the coverage of the target and the implementation period
3 Make a link to Paris Agreement goals
Describe when emissions are projected to peak (or have peaked) and refer to national policyies commitment to net zero emissions
4 Share the planning process
Provide information on institutional arrangements for developing and implementing the NDC including consultation processes that allow for public participation and engagement with local communities and indigenous peoples in a gender-responsive manner
5 Describe implementation plans
Provide information on which policies and measures will be implemented to achieve target(s)
1 Describe ambition and fairness
Provide detailed information sustained by emissions reduction analysis on how the current or updated NDC a) comprises a fair and ambitious contribution to global efforts to mitigate climate change and precisely how it is a progression on the last NDC mitigation target or action and b) will reflect the ldquohighest possible ambitionrdquo taking into account common but differentiated responsibilities and respective capabilities
In comparison Australia Brazil Indonesia Mexico and Russia have submitted NDCs with no change to their ambition with Brazil and Mexico altering their baselines which weakens their NDCs as it will result in higher emissions in 2030
BUT THE G20 IS NOT YET ALIGNED WITH A 15degC PATHWAYAll NDC updates submitted and announced up to April 2021 leave a significant emissions gap of about 23 GtCO2e from a 15degC pathway with the G20 collectively making up around two-thirds of this gap
If all G20 members strengthened their 2030 NDCs along a 15degC compatible domestic emissions pathway (see Figure 1) and reached net zero targets by 2050 with a faster timeline for developed countries than
Law Policy DocumentNet zero target covers all GHGs
Canada EU France Japan UK
USA China (2060)
No detail in net zero target on which GHGs are covered
Germany (2045) South Korea
Argentina Brazil Italy South Africa Indonesia (2060)
Figure 2 Timing status GHG coverage and use of offsets in current G20 net zero targets
Submitted a more ambitious NDC target
Proposed a more ambitious NDC target
Did not increase ambition in NDC target
Not yet submitted or proposed an updated NDC
Argentina (2nd
NDC) Canada EU (incl France Germany and Italy) South Africa UK (1st NDC) USA
China Japan South Korea
Australia Brazil Indonesia Mexico Russia
India Saudi Arabia
Figure 3 Status of updated NDCs
Turkeyrsquos submission remains an Intended Nationally Determined Contribution (INDC) until it ratifies the Paris Agreement
contributions to support action in developing countries Russia and Saudi Arabia are rated overall as ldquoCritically insufficientrdquo which means that if all governments took this approach global warming would exceed 4degC
The UK is the only G20 member with a domestic target that aligns with a 15degC modelled domestic pathway in 2030 however the overall rating is ldquoAlmost sufficientrdquo as its policies and action are not yet 15degC aligned nor is it meeting its lsquofair-sharersquo target or climate finance contribution Following closely are the EU Germany Japan South Africa and the USA which are rated overall as ldquoInsufficientrdquo From this group the EU and Germany are the only ones rated as ldquoAlmost sufficientrdquo for both their targets and their policies and action However none are meeting their lsquofair-sharersquo targets or climate finance contributions14
NDC Transparency Check recommendations15
The NDC Transparency Check assesses the quality of NDCs relating to whether a partyrsquos communication is clear transparent and understandable in terms of the requirements set out in the Paris Agreement its accompanying decision (1CP21) and Annex I to decision 4CMA1
for developing countries the current gap of 23 GtCO2e could be narrowed by 64 This would also result in a lower temperature of 17degC by 2100 This effort could get us about three-quarters of the way to limiting global warming to 15degC compared with the estimated 24degC of warming under current targets13
In CATrsquos new rating system most G20 membersrsquo are rated overall as ldquoHighly insufficientrdquo or ldquoCritically insufficientrdquo Argentina Australia Brazil Canada China India Indonesia Mexico and South Korea are rated overall as ldquoHighly Insufficientrdquo with Canadarsquos domestic target and Indiarsquos policies and action being the only elements within this group rated as ldquoAlmost sufficientrdquo These G20 members need to introduce much more ambitious domestic and internationally supported targets policies and action and for developed countries ramp up climate finance
Reductions or removals outside of own borders Note 11 of the G20 members have a net zero target year of 2050 excl China Germany and Indonesia
International offsets included No international offsets Unclear or undecided
Sources Climate Watch nd10 Energy amp Climate Intelligence Unit nd11
Source Climate Action Tracker 2021b 12
No targetAustralia India Mexico Russia Saudi Arabia Turkey
CLIMATE TRANSPARENCY REPORT | 2021 3
COVID RECOVERY
FOSSIL FUELS SUBSIDISED THROUGHOUT THE RECOVERY
The G20 missed the opportunity to shift away from fossil fuels through recovery investments
CLIMATE TRANSPARENCY REPORT | 2021
G20 total spending14244bn
1839bn
300bn
G20 Recovery spending
Green recovery spending
132
Liquidity support for large businesses
Liquidity support for subnational public entities
Targeted welfare cash transfers
Healthcare services support
Job continuation support
Liquidity support for SMEs
Current leaders80
70
60
50
40
30
20
10
001 005 01 05 1 5 10 500
BRA
TUR
CAN
MEXIND
Gree
n re
cove
ry s
pend
ing
( o
f tot
al re
cove
ry sp
endi
ng)
Recovery spending ( GDP logarithmic scale)
Developing countries Developed countries
(100)
Potential to act
IDN RUSARG
ITA
SAU
ZAF
Missing opportunities
GER
FRA
JPN KOR
UK
AUS
CHNUSA
$
FROM CRISES TO OPPORTUNITIESThe COVID-19 pandemic continues to devastate families and communities ndash around 47 million people worldwide had died by September 202116 While lockdowns and social restrictions have made life difficult for billions of people these responses also caused fewer car journeys flights and entire industries shutting down17 As a result energy-related CO2 emissions declined steeply by 6 in 2020 but are already projected to rebound strongly by 4 in 202118 Nonetheless the convergence of global health economic and climate crises has led to an opportunity for governments to ldquorecover betterrdquo by aligning medium-term recovery objectives with longer-term social and environmental objectives to achieve a clean green and resilient recovery
MISSED OPPORTUNITIES FOR A GREEN RECOVERYSince the beginning of the COVID-19 pandemic the G20 has mobilised USD 142tn in total stimulus spending to keep health services households and businesses afloat (see Figure 4) When implementing recovery packages governments missed the opportunity to transition to low carbon economies Only USD 300bn of the USD 18tn total recovery spending was directed to the much-heralded ldquogreenrdquo recovery
Canada France and Germany are identified as lsquocurrent leadersrsquo of the green recovery and based on recent announcements the EU would also fall into this group (see Figure 5) The majority of G20 members are however categorised as lsquomissing opportunitiesrsquo or having lsquopotential to actrsquo Non-OECD G20 members face greater
To avoid double counting the EU is not included when adding up total spending
Figure 5 G20 green recovery spending (January 2020-August 2021)
challenges to rebuild after multiple crises having to grapple with chronic problems and inequalities such as access to funds debt constraints and extreme poverty19 These members except China are mainly identified as having lsquopotential to actrsquo as they allocated less than 2 of their respective GDP to recovery spending of which less than 5 is for green investments In contrast OECD G20 members plus China who were mainly identified as lsquomissing opportunitiesrsquo allocated a higher proportion (of between 2-14) of their respective GDP to recovery but less than 30 was for green investments
Figure 4 G20rsquos total COVID-19 rescue and recovery spending (January 2020-August 2021)
Source Own analysis based on Global Recovery Observatory August 202120
The European Commission recently endorsed a budget of more than USD 1tn for 2021-2027 recovery spending including 37 allocated to a green transition This means that the EU would fall into the lsquocurrent leadersrsquo group in the graph To avoid double counting the EU is not included
Green recovery spending is based on potential impact on long- and short-term emissions air pollution natural capital quality of life and inequality Recovery spending includes incentive and investment measures such as worker retraining and job creation or transport and energy infrastructure investment Current leader means countries that allocated above 1 GDP to recovery spending and above 30 of recovery spending was for a green recovery Missing opportunities means countries allocated above 1 GDP to recovery spending but less than 30 of recovery spending was for a green recovery Potential to act means countries spent less than 1 GDP on recovery spending Bubble sizes represent total value of recovery spending
Source Own analysis based on Global Recovery Observatory August 2021 21
4
Figure 6 Conditional and unconditional fossil fuel subsidies in the G20 (January 2020-August 2021)
Total green recovery spending
300bn
G20 total spending
Green market creation25 UK
JPN
GER
Green energy24
CHI
KOR CAN
Green transport
Green building Green RampD
Natural capital1915
89
UK
GERKOR
CHI
KORUSA
FRA KORUK
KORFRA
Valu
e in
USD
bill
ion
Unconditional fossil fuel subsidies Conditional fossil fuel subsidies
0
10
20
30
40
50
60
70
80
BRAZAFAUSARGJPNMEXITAKORRUSSAUIDNTURCHNFRAGERINDCANUKUSA
KEY ACTIONS FOR G20 MEMBERS
MEANWHILE FOSSIL FUEL SUBSIDIES CONTINUED The G20 has continued to pour money into the fossil fuel industry with a total of USD 298bn committed in subsidies from January 2020 to August 2021 which is almost equal to the G20rsquos total green recovery allocation of USD 300bn (see Figure 6) These subsidies also ignore previous G20 promises to remove inefficient fossil fuel subsidies22 The majority or USD 248bn has gone towards unconditional fossil fuel subsidies with no lsquogreen stringsrsquo attached and the rest to conditional ones Oil and gas have benefited from the highest proportion of subsidies at USD 219bn whilst coal and fossil-fuel-based hydrogen have received USD 47bn and USD 11mn respectively China and India each announced subsidies of approximately USD 15bn aimed at expanding coal mining domestically whilst Canada France Germany the UK and the USA provided subsidies of more than USD 200bn to support oil and gas However more transparency about these figures is needed as Brazil Japan Saudi Arabia South Africa South Korea Turkey and the UK have been categorised as lsquoopaquersquo in terms of the full extent of fossil fuel funding and ldquohiddenrdquo subsidies23
GREEN SPENDING IN FOCUSGreen market creation green energy green transport natural capital green buildings and green research and development were among the sectors that benefited with G20 members including Canada China Germany France Japan South Korea the UK and the USA accounting for the majority of spending (see Figure 7) However to reach net zero emissions by mid-century and prevent emissions surging to a new record investments of USD 1tn per year from 2021-23 are needed across the power industry transport and building sectors where only 35 of these investment needs are currently being met25
G20 members need to introduce conditionality or ldquogreen stringsrdquo for recovery spending and reinforce policy regulations and incentives that align with near-term climate targets
G20 members that are still supporting fossil fuel industries need to redirect subsidies towards sector transformation and investments in renewable energy and other green sectors
Developing countries need support from developed G20 members to mobilise additional finance to encourage investment in green sectors
Figure 7 Total vs green spending and proportion of G20 member (excl EU) spending in various green sectors (January 2020-August 2021)
To avoid double counting the EU is not included when adding up total spending
Green market creation Investments promote the creation of green markets through a) increased clean energy market participation b) modernisation and transition investments and c) capacity investment For instance investments that prompt the integration of more renewable energy generation into electricity markets or investments which catalyse new green transitional industries
Source Own analysis based on Global Recovery Observatory August 2021 26
Policies are classified as unconditional if they support production and consumption of fossil fuels without any climate targets or additional pollution reduction requirements while policies with climate targets or additional pollution reduction requirements are categorised as conditional
Source Energy Policy Tracker 2021 24
CLIMATE TRANSPARENCY REPORT | 2021 5
Increase the ability to adapt to the adverse effects of climate change and foster climate resilience and low-GHG development PARISAGREEMENT
ADAPTATION ADDRESSING AND REDUCING VULNERABILITY TO CLIMATE CHANGE
CLIMATE TRANSPARENCY REPORT | 2021
Urgent implementation of plans and strategies is needed to reduce climate risk
VULNERABILITY OF G20 MEMBERS HIGHLIGHTS THE NEED TO ADAPT NOW
Figure 8 G20 membersrsquo readiness to adapt
03
04
05
06
07
08
09
028 032 036 040 044 048 052
Have great challenges but are adopting solutionsWell-positioned with fewer challenges
Fewer present challenges have time to get ready Greatest challenges and urgency to act
Adap
tatio
n re
adin
ess
Vulnerability
SAU
BRA
AUS
CAN
GER
FRA
UK
IDNIND
MEX
ITA
ARG
CHN
USA
KOR
RUS
TURZAF
G20
JPN
EU
KEY ACTIONS FOR G20 MEMBERS
LIVING IN A CLIMATE EMERGENCYGlobal warming will reach or exceed 15degC in the early 2030s in nearly all emissions scenarios considered by IPCC AR6 Under the very low emissions scenario however it will drop slightly to 15degC by the end of this century27 In 2021 G20 members are already experiencing first-hand the lsquolocked-inrsquo climate impacts of a warming world with record-breaking fires floods droughts extreme cold and heatwaves28 2020 was recorded as one of the hottest years on record and the last decade as the hottest ever29 Urgently allocating resources and planning to reduce vulnerability and strengthen resilience is of importance for all G20 members but especially for the most vulnerable ones30 From 2020-2030 it is estimated that an investment of USD 18tn in just five areas ndash early warning systems climate-resilient infrastructure dryland agriculture mangrove protection and water generation ndash would result in net benefits of USD 71tn31
HIGHER TEMPERATURES INCREASE CLIMATE RISK Chronic impacts and extreme weather events result in high human and economic costs which can be compounded by underlying inequalities poorly funded infrastructure and the effect of multiple crises including COVID-1932 Between 1999 and 2018 there have been nearly 500000 fatalities and close to USD 35tn of economic costs due to climate impacts worldwide with China India Japan Germany and the USA being hit particularly hard in 2018 Even if we meet 15degC and certainly if we exceed it the G20 will be exposed to even greater-than-average weather- and climate-related impacts Australia Brazil France Italy Mexico and Turkey will likely be exposed to severe water scarcity or droughts and it is expected that Australia India Mexico Saudi Arabia and South Africa will have many more days with extreme high temperatures Most G20 members could experience agricultural impacts such as reduced crop duration decreased rainfall and an increase in damaging hot spells for key crops all of which could lead to intensified local and global food insecurity33
DEVELOPING COUNTRIES FACE GREATEST CHALLENGES TO ADAPTAcross the G20 developing countries have the highest level of vulnerability to climate change but the lowest level of readiness and therefore face the greatest challenges (see Figure 8) Argentina Brazil China India Indonesia Mexico Saudi Arabia and South Africa are exposed to higher levels of vulnerability in the water and food sectors including projected change of cereal yields
low agricultural adaptive capacity and change of annual runoff These countries plus Turkey are also not ready to take on adaptation actions by leveraging public and private sector investments mainly due to issues of corruption regulatory quality rule of law or lower levels of innovation34 However recent extreme weather events have shown that developed countries must also improve their adaptation readiness and their ability to handle the worsening impacts of a fast-changing climate
G20 members urgently need adaptation plans and strategies in place across key systems ndash including food water health ecosystems habitat and infrastructure ndash and should strengthen their social economic and governance readiness to accelerate implementation of these plans
G20 members need to balance funding for adaptation not only with loss and damage for locked-in impacts but also with resources allocated to mitigation
Developed countries need to increase climate finance contributions to assist developing countries through bilateral and multilateral channels and with regular reviews
This graph shows the 2018 observed Readiness Index and 2050 projected Readiness Index describing a countryrsquos ability to improve climate resilience The readiness component of the Index created by the Notre Dame Global Adaptation Initiative (ND-GAIN) encompasses social economic and governance indicators to assess a countryrsquos readiness to deploy private and public investments in aid of adaptation The overlaid 2050 projections are qualitative and quantitative representations of a range of possible futures The range of scenarios shown here in lines are qualitatively described as a sustainable development compatible sce-nario (SSP1) a middle-of-the-road (SSP2) and a lsquoRegional Rivalryrsquo (SSP3) scenarioObserved (2018)
2050 ProjectionSSP1
SSP2
SSP3
Key
Source Own analysis based on Andrijevic et al 2020 35 ND-GAIN database (nd) 36
6
MITIGATION REDUCING EMISSIONS TO LIMIT GLOBAL TEMPERATURE INCREASE
Figure 9 Energy-related CO2 emissions and GDP variation (2019-2021)
REBOUNDING EMISSIONS SIGNAL A RETURN TO BUSINESS AS USUAL
Drastic cuts in CO2 emissions from the energy sector can be achieved by rapidly phasing out fossil fuels and stimulating growth in renewable energy
PARISAGREEMENT
Hold the increase in the global average temperature to well below 2degC above pre-industrial levels and pursue efforts to limit to 15degC recognising that this would significantly reduce the risks and impacts of climate change
-20
-15
-10
-5
0
5
10
ZAFUKMEXBRAAUSITASAUJPNEUFRARUSGERARGG20KORCANCHNUSAINDIDNTUR
Year
-on-
year
chan
ge in
ene
rgy-
rela
te C
O 2 em
issio
ns (
)
2019 GDP variation
share of G20 (2020)
1 2 9 17 38 22 1 2 6 1 4 29 1 1 2 1 1 2
Trend (2020-2021) -03 -04 -04 -08 -08 -12+72 +64 +62 +52 +49 +47 +41 +33 +31 +29 +24 +2 +18 +13+5
2019 CO2 emissions (from fuel combustion) 2020 GDP variation2020 CO2 emissions
(from fuel combustion) 2021 GDP variation2021 CO2 emissions projections(from fuel combustion)
CO2
In 2030 global CO2 emissions need to be around 45
below 2010 levels and reach net zero by around 2050 Global energy-related CO2 emissions must be cut by 40 below 2010 levels by 2030 and reach net zero by 2060 The share of fossil fuels globally needs to fall to 67 of global total primary energy by 2030 and to 33 by 2050 and to substantially lower levels without carbon capture and storage37
TRANSFORMING THE ENERGY SECTOR IS KEY TO A LOW-CARBON ECONOMYCO2 emissions from the energy sector make up 78 of all GHG emissions (including land use change and forestry) with the highest proportion coming from the power sector followed by industry and transport38 Increased energy efficiency reduced demand (including lifestyle and consumption shifts) fuel switching and electrification ndash in tandem
with decarbonisation of the power sector ndash will be necessary in all major sectors for the energy sector to be 15degC compatible
BUT CO2 EMISSIONS ARE REBOUNDING TO PEAK LEVELSDue to the COVID-19 pandemic in 2020 energy-related CO2 emissions dipped across the G20 by 6 compared to 2019 levels which was stronger than the 5 decrease in GDP In 2021 CO2 emissions are projected to rebound by 4 across the G20 however this is less than the projected GDP increase of 7 (see Figure 9) Nearly half of this rebound is being driven by the power sector and a quarter by the transport sector In OECD G20 members the projected rebound in 2021 will not fully offset the decline in 2020 despite the USArsquos significant rebound of 5 For non-OECD G20 members 2019 emissions levels however are likely to be exceeded Argentina China India and Indonesia are projected to exceed their 2019 emissions levels which is significant given that their combined energy-related CO2 emissions accounted for almost half of G20 CO2 emissions in 202039
Source Enerdata 2021
RENEWABLES ACCELERATEThe G20 has however increased its average share of renewables (excluding large hydro) in its total primary energy supply (TPES) mix by 32 from 2015-2020 to the current value of 7 in 2020 (see Figure 10) From 2019-20 the G20rsquos share of renewables (including large hydro) increased from 9 to 10 and this trend is projected to continue rising to 12 in 202140 Despite the pandemic there has been significant growth among G20 members in solar and wind power with new records being set in terms of overall installed capacities For example in 2020 newly installed capacity of 108 GW of wind power almost doubled compared to 2019 installations of 56 GW This has been driven mainly by Australia Brazil China the EU and the USA Solar photovoltaics (PV) have also shown strong growth in 2020 with new installations in Brazil China the EU and the USA totalling 85 GW41 The outlook for renewables is also good with both solar PV and wind power projected to continue growing during 2021 as projects restart As a result between 2015 -2020 the carbon intensity of the energy sector has decreased overall by 4 across the G2042
Due to rounding some graphs may sum to slightly above or below 100
7CLIMATE TRANSPARENCY REPORT | 2021
KEY ACTION FOR G20 MEMBERS
Figure 10 Total Primary Energy Supply (TPES) mix (level 2020 percentage change 2015-2020)
This graph shows the fuel mix for total primary energy supply including energy used not only for electricity generation heating and cooking but also for industrial and transport fuels
Renewables include wind solar hydro geothermal and biomass (excl residential biomass use)
BUT COAL IS GOING UP AGAIN The average share of fossil fuels in the G20rsquos TPES was 808 in 2020 but is projected to increase slightly to 812 in 2021 as demand for coal oil and gas returns to ldquonormalrdquo From 2015-2020 the share of fossil fuels in TPES decreased from 829 to 808 driven by a reduction in the G20rsquos total coal consumption of 8 due to reduced energy demand and the implementation of coal phase-out policies in the UK (-78 ) Italy (-63 ) Germany (-45 ) the EU (-42 ) and Canada (-28) However coal consumption is projected to
Just Transitions recent developmentsA Just Transition48 is an important part of the transition to a low-carbon economy
Canada The Canadian Coal Transition Initiative helps communities and workers affected by Canadarsquos move to a low-carbon economy in Alberta Saskatchewan and Atlantic Canada In 2021 Canada also launched discussions on proposed just transition legislation49
EU As part of the European Green Deal a Just Transition Mechanism (JTM) has been proposed to ensure that the transition to a climate-neutral economy takes place in a fair way It provides targeted support to help mobilise at least EUR 65-75bn over the period 2021-2027 in the most affected regions to alleviate the socio-economic impact of the transition50
South Korea The 2050 Carbon Neutral Strategy lays the framework for both a phase-out of coal-fired power plants and a just transition for persons who are economically dependent on the countryrsquos fossil fuel industries This includes retraining workers from these industries to prepare them for opportunities in new low-carbon industries Furthermore the Strategy calls for mobilising financial resources for climate-vulnerable communities52
South Africa A Presidential Commission has committed funds and resources to diversifying coal-dependent economies and introducing a range of reskilling social protection and job creation incentives across new green sectors Part of this initiative is to enable social dialogue and build support to establish more tangible measures around a just transition51
G20 members need to prioritise investment in renewable energy ndash also to avoid stranded fossil fuel assets ndash and accelerate coal phase-outs across the G20
rise by almost 5 in 2021 with much of this growth concentrated in China (61) the USA (18) and India (17)43 Globally China remains the highest producer and consumer of coal responsible for half of all coal44
AND GAS IS A BRIDGE TO NOWHEREBetween 2015-2020 the G20rsquos average natural gas consumption increased by 12 and is projected to remain at similar levels in 2021 OECD and non-OECD G20 members have both played a role in this increase at
19 and 8 respectively China (+69) South Korea (+19) India (+17) Canada (+16) Germany (+14) the USA (+12) and the EU (+11) are driving the increase as countries that are pursuing coal phase-out policies simply switch from coal to natural gas45 This is a risky move though with a high likelihood of stranded gas assets as the transition to a low-carbon economy accelerates46 The USA is currently the highest producer and consumer of global gas and oil being responsible for more than 2047
Source Enerdata 2021
Ener
gy m
ix (
)
Coal and Lignite Oil Natural gas Nuclear Renewables Other
Chan
ge in
shar
e of
rene
wab
le e
nerg
y in
TPES
(201
5-20
20)
OECD
Non-
OECD
0
20
40
60
80
100
FRABRAEUINDIDNCANUKKORGERITAUSAG20TURMEXJPNARGCHIRUSZAFAUSSAU-50
0
50
100
150
200
(546) 177
114
6157
34 322921 19
13
83
5242
3631 2821 18
10-09
8CLIMATE TRANSPARENCY REPORT | 2021
TRANSFORMATIVE POLICIES URGENTLY NEEDED IN KEY SECTORS TO CURB RISING EMISSIONS
Transformative and innovative policies and action in all sectors can accelerate the transition to a low-carbon future
Figure 12 Current coal power capacities of G20 members (as of July 2021)
OperatingIn construction Cancelled 2010-2021Retired 2000-2021Announced + Pre-permit + Permitted
Coal
pow
er p
lant
capa
citie
s (M
W)
CHN IND USAARGAUS BRACAN FRAGERIDN ITAJPN KOR MEXRUS TUR UKZAF-1500
-1000
-500
0
500
1000
1500
-100
-60
-20
20
60
100
Annual growth rate
in 2020
in 2019
2009-2018
G20 energy-related CO2 emissions ndash power sector (2020)
-53-19+13
power
381
DEEP AND FAST EMISSIONS CUTS REQUIRED ACROSS ALL SECTORSThe power generation industry and transport sectors produce the majority of GHG emissions in the G20 (see Figure 11)53 The transformation of all sectors is pivotal to achieving net zero CO2 emissions by around 2050 as well as decreases in all GHG emissions rapidly thereafter including actions to maintain and expand critical global carbon sinks such as forests
773 Waste
10 Agriculture
10 Industry2018
37944MtCO2e
29 Power
18 Industry
16 Transport
7 Building
6 Other energy-related
1 Agriculture
Energy
Figure 11 G20 GHG emissions by sector (2018)
Source Enerdata 2021
(38) natural gas (20) and oil (2) whilst the rest is from renewables including large hydro (28) and nuclear (11) In 2020 CO2 emissions in the power sector decreased by 5 due to reduced electricity demand during the COVID-19 pandemic However in 2021 emissions from the power sector are projected to rebound by 5 compared to 2020 due to increased demand56
Reducing the emissions intensity of electricity generation is a key mitigation strategy especially as global power demand is expected to at least double by 2050 compared to 201857 G20 emissions intensity has been decreasing from 2015-2020 However Australia China India Indonesia Saudi Arabia and South Africa registered above G20 average emissions intensity levels in 202058
POWER Coal phase-out urgent whilst renewables grow through the pandemic
Between 2030 and 2040 all the regions of the world need to phase
out coal-fired power generation By 2040 the share of renewable energy in electricity generation needs to be increased to at least 75 and the share of unabated coal reduced to zero54 55
Source Enerdata 2021
The power sector currently accounts for the highest share (at 38) of G20 energy-related CO2 emissions including heat from electricity production Fossil fuels are used for 60 of electricity needs including coal
Note Some G20 members have a very low to no coal power capacity (see Figure 10)
Source Global Energy Monitor 2021 59
China currently accounts for over half of the G20rsquos total coal capacity followed by India and the USA (see Figure 12) China also has the highest planned coal capacity (163 GW) followed by India (21 GW) Indonesia (18 GW) and Turkey (12 GW) G20 members have however started to take steps to phase out coal with France Italy and the UK all rated as
lsquofrontrunnersrsquo for coal phase-out policies with phase-out dates for coal by 2030 Despite these steps forward all G20 members will need to commit to phase out coal between 2030 and 2040 to meet the long-term temperature goal in the Paris Agreement60
From 2015-2020 the share of renewables in the G20rsquos power mix increased by 20 (see Figure 13) In 2020 renewables reached 286 of the G20rsquos power mix and this is projected to grow to 295 in 2021 This growth was partly due to decreased electricity demand in 202061 but also due to ongoing implementation of renewable energy policies and incentives as well as the falling cost of renewables62 Even though progress is being made this growth rate will need to accelerate significantly to reach 75 of the global power mix by 2040 Large and small hydro accounts for the highest proportion of the G20rsquos renewables (54) followed by wind (23) and solar (12)63 The EU Germany and the UK had the highest share of solar and wind power in 2020 but the UK alone is rated a lsquofrontrunnerrsquo as it has both short-term policies and long-term strategies for 100 renewables in place
9CLIMATE TRANSPARENCY REPORT | 2021
Figure 13 Share of renewables in power generation in 2020 and change in share of renewables incl large hydro (2015-2020)
Annual growth rate
in 2020
in 2019
2009-2018
G20 energy-related CO2 emissions ndashindustry sector (2020)
-12+00+12
sh
are
RE in
pow
er g
ener
atio
n
ch
ange
201
5-20
20
WindSolar GeothermalHydroBiomass amp waste
0
20
40
60
80
100
SAUKORZAFIDNUSARUSMEXINDARGAUSJPNFRAG20CHNEU27TURITAUKGERCANBRA0
40
80
120
160
200
163
117
7573 70
49 464340 39373130
24 2116
11 95 1
(523)
Industry
241
173Direct emissions
Indirect emissions
Note Saudi Arabia (523) South Korea (163) and South Africa (117) have had the highest increases over the last five years but renewables in their overall energy mix remain at 02 72 and 76 respectively
Annual growth rate
in 2020
in 2019
2009-2018
G20 energy-related CO2 emissions ndash transport sector (2020)
-146+10+17
transport
19Direct emissions
TRANSPORT More electric vehicles and modal shifting needed
The share of low-carbon fuels in the transport fuel mix globally
must increase to between 40 and 60 by 2040 and between 70 to 95 by 205064
Source Enerdata 2021
The transport sector is responsible for close to a fifth of the G20rsquos energy-related CO2 emissions ndash driven mainly by consumption of oil ndash with road travel accounting for two-thirds of these emissions mainly from passenger vehicles65 From 2009-2018 emissions increased by 17 per year and by 1 in 2019 In 2020 there was a significant decline due to the pandemic but in 2021 emissions are projected to rebound to near pre-pandemic levels66 To decarbonise the transport sector G20 members will need to engage in mass electrification switching to low-carbon fuels and modal shifting Across the G20 the cur-rent average market share of electric vehicles (EVs) in new car sales remains low at 32 (excluding the EU) with Germany France and the UK having the highest shares of EVs
INDUSTRY Steel and cement key to reducing emissions
Source Enerdata 2021
Source Enerdata 2021
Industrial emissions need to be reduced by 65-90 from 2010
levels by 205068
CO2 emissions in the industrial sector result from direct emissions (conversion of energy) indirect emissions (electricity and co-generated heat) and process emissions (mainly from iron steel or cement) From 2009-2018 in the G20 CO2 emissions from industry have grown by 12 per year In Argentina Brazil Mexico Russia and Saudi Arabia from 2012-2017 there has been an increase in emissions intensity of industry in part due to a shift in heavy industry moving to emerging and developing countries along with differences in technological standards and regulations69 Although challenging to decarbonise the production of steel and cement accounts for nearly half (44) of global CO2 emissions from industry worldwide and is therefore pivotal to transforming the industrial sector70
BUILDINGS Energy efficiency and electrification using low-carbon electricity needed
By 2040 global emissions from buildings need to be reduced by
90 from 2015 levels and reach 95-100 below 2015 levels by 205071 72
The building sector is responsible for close to a quarter of G20 energy-related CO2 emissions Building emissions occur directly (for heating and cooking) and indirectly (for air conditioning and appliances) From 2005-2018 energy-related emissions from the building sector increased by 05 per year Emissions intensity of existing residential and commercial buildings has however been gradually falling across major emitting economies partly due to improved energy efficiency and higher levels of electrification using low-carbon electricity73
Annual growth rate
in 2020
in 2019
2005-2018
G20 energy-related CO2 emissions ndash building sector (2020)
-28+06+05
Buildings
79
155Direct emissions
Indirect emissions
Source Enerdata 2021
Figure 14 Summary of policy ratings across sectors Low HighMedium FrontrunnerPolicy rating
Renewa-ble Energy in the power sector
Coal phase-out in the power sector
Phase-out of fossil fuel cars
Phase-out of fossil fuel heavy duty vehicles
Modal shift in ground transport
Near zero energy new buildings
Renova-tion of existing buildings
Energy efficiency in Industry
Target for net zero deforesta-tion
ARGAUSBRACANCHNEUFRAGERINDIDNITAJPNMEXRUSSAUZAFKORTURUKUSA
na
Source Climate Analytics 2021 67
10CLIMATE TRANSPARENCY REPORT | 2021
KEY ACTIONS FOR G20 MEMBERS
Forests can be a source of emissions when cut down or a carbon sink when more trees that take into account local ecosystems are either added to the landscape or protected The G20 has lost a total of 37 Mha per year of forest area between 2015-2020 (excluding Australia France Japan Saudi Arabia the UK and the USA for which data is unavailable) Afforestation activities have also increased between 2015 and 2020 leading to a net gain of +01 Mha per year to the G20rsquos total forest area Nonetheless from 2015-2020 Argentina Brazil Canada Indonesia Mexico and South Africa all registered net losses of forest area with Brazil and Indonesia driving global deforestation with massive losses of 15 Mha and 06 Mha per year respectively diminishing critical global carbon sinks In Brazil and Indonesia not only demand for land for food production but also the removal of environmental protections and regulations has contributed to increased deforestation Of note Australia is the only advanced G20 economy on a list of 24 global deforestation hotspots77 with an average forest loss of 04 Mha per year between 2010-201578
AGRICULTURELivestock driving increase in agricultural emissions
Methane emissions (mainly enteric fermentation) need to decline by
10 by 2030 and by 35 by 2050 (from 2010 levels) Nitrous oxide emissions (mainly from fertilisers and manure) need to be reduced by 10 by 2030 and by 20 by 2050 (from 2010 levels)79
Power Further stimulate and scale up growth in renewables whilst committing to a rapid phase-out of fossil fuels
Transport Introduce policies and measures aimed at fuel switching to low-carbon fuels mass electrification and modal shifting Sales of internal combustion engine (ICEs) vehicles should be banned by 2035 to limit temperatures to 15degC83
Industry Increase energy and material efficiency (fuel switching to low-carbon sources such as electrification green hydrogen) increase material recycling reduce demand and decarbonise production
Buildings Encourage retrofitting and electrifying existing buildings to reduce energy demand Require all new buildings to meet high energy-efficiency standards and be equipped with heating and cooling technologies that either are or can be zero emissions
Land use Implement net zero deforestation targets and policies protected area networks deforestation-free supply chains and forest-friendly infrastructure
Agriculture Improve productivity to feed a growing population shift high-meat diets towards plants slow the growth of food and agricultural land demand by reducing food loss and waste 28
Manure
43Entericfermentation (digestive processes of cattle)
20Syntheticfertilisers
7Burning of savanna2
Crop residues
2907MtCO2e
Figure 15 G20 GHG emissions from agriculture excl energy (2018)
Global deforestation needs to be halted and changed to net
zero CO2 removals by around 203076
On average building emissions per capita across the G20 are 14 tCO2capita a decrease of 29 between 2015-2020 but this is not a fast enough decrease74 In particular the USA (49 tCO2capita) and Australia (41 tCO2capita) have the highest building emissions per capita in the G20 reflecting the high share of fossil fuels especially natural gas and oil used for heat generation75
LAND USELoss of forest areas adding to the climate crisis
Emissions from agriculture accounted for 10 of the G20rsquos total GHG emissions in 2018 and 18 of the G20rsquos energy-related CO2 emissions The bulk of agricultural emissions
arise from methane and nitrous oxide with the main drivers being enteric fermentation (43) livestock manure (28) and synthetic fertilisers (20) (see Figure 15)81
Very high High Medium Low Very lowCurrent decarbonisation rating
Figure 16 Summary of 5-year trends and current decarbornisation ratings
Aviation emissions per capita 2013-2018 (tCO2capita change)
Building sector emissions per capita 2015-2020 (tCO2capita change)
Emissions intensity of industry 2012-2017 (kgCO2eUS$2015 GVA change)
Transport emissions per capita (exl aviation) 2015-2020 (tCO2capita change)
Growth in share of renewables in power generation (incl large hydro) 2015-2020 ( change)
1 5 9 11 16 21 24 26 31 37 39 40 43 46 49 70 73 75 117 163 523
ARG CAN ITA BRA CHN RUS G20 EU MEX TUR USA FRA JPN IND GER AUS UK IDN ZAF KOR SAU
Emissions intensity of the power sector 2015-2020 (gCP2kWh change)
-45 -42 -39 -31 -27 -23 -22 -22 -19 -15 -13 -13 -13 -13 -11 -11 -9 -8 -6 -3 -1
UK GER BRA CAN EU SAU USA ITA ARG FRA TUR KOR JPN AUS G20 CHN IND MEX RUS ZAF IDN
-18 -18 -15 -13 -12 -11 -11 -9 -8 -7 -5 -4 -3 -3 -2 0 0 1 25 23 22
UK ARG ITA SAU BRA ZAF JPN USA CAN MEX AUS G20 FRA EU TUR KOR RUS GER IND CHN IDN
-11 -8 4 7 8 11 13 16 17 17 21 23 24 25 29 32 35 45 45 54 102
BRA RUS FRA UK JPN AUS ARG CAN USA GER G20 EU ITA ZAF KOR IDN MEX SAU IND CHN TUR
-40 -27 -25 -24 -23 -23 -17 -17 -16 -15 -12 -12 -10 -4 -3 -1 0 3 19 29 38
SAU GER UK BRA EU ARG USA FRA AUS ITA MEX JPN CAN KOR G20 ZAF TUR IND RUS CHN IDN
-41 -30 -24 -19 -18 -17 -16 -16 -15 -13 -13 -12 -11 -11 -8 -8 0 0 1 8 24
UK CHN JPN USA IND AUS ITA G20 GER ZAF EU KOR TUR CAN IDN FRA MEX BRA RUS SAU ARG
Source Enerdata 2021 82
Current year is 2020 except for Aviation emissions per capita (2018) and Emissions intensity of industry (2017)
Source FAO 2021 80
11CLIMATE TRANSPARENCY REPORT | 2021
FINANCE MAKING FINANCE FLOWS CONSISTENT WITH CLIMATE GOALS
FINANCIAL REGULATIONS IMPROVING BUT PUBLIC FOSSIL FUEL FINANCE CONTINUES Financial actors from central banks to export credit agencies are finally integrating climate into their operations But continued public support for coal oil and gas must end immediately to have a chance of reaching climate targets
PARISAGREEMENT
Make finance flows consistent with a pathway towards low-GHG emissions and climate-resilient development
International public finance for coal must end immediately in all
G20 members to halt the development of coal power Investment in green energy and infrastructure needs to outweigh fossil fuel investments by 2025
Making all finance flows align with a low-carbon climate-compatible pathway is one of the key objectives of the Paris Agreement84 Due to the relative size of their economies and emissions G20 governments have a key role to play in showing leadership on this agenda by putting in place the right price signals and channelling all public finance away from high-carbon activities and assets towards clean climate-compatible ones and incentivising private finance flows to follow suit
FINANCIAL POLICIES AND REGULATIONSProgress on financial policies and regulations is moving at different speeds across the G2085 Some G20 members have continued taking steps to align their financial systems with sustainable development and address financial risks related to climate change There has been momentum on greening the financial sector at the international level
for example through the G20 sustainable finance working group and the Financial Stability Boardrsquos (FSB) climate risk roadmap86 However more concerted efforts are needed such as the standardisation of green finance practices promotion of disclosure standards for carbon and environmental risks and implementation of national sustainable finance roadmaps to transform the financial sector into a sustainable one
Significant regulatory and policy developments were seen in France Canada Japan the USA South Korea the UK and the EU (see Figure 17)
Some encouraging progress has also been seen in Australia China Germany India and Mexico where the central banks and financial regulatory authorities have stepped up to manage climate-related risks and opportunities within their financial sector through issuing relevant guidance and strategies or joining international networks that coordinate action in this area95 96 97 98 99
While most other G20 members have acknowledged the effects of climate change on their financial sector progress has been slow on green finance initiatives No major policy or regulatory level green finance commitments were identified in Russia Saudi Arabia or Turkey (aside from limited evidence
Figure 17 Regulatory and policy developments in G20 members to align financial systems with climate action
Note This figure illustrates examples of some key actions in G20 members but is not exhaustive of all recent developments in this areaSource Authorsrsquo own based on various sources
on efforts to stimulate green bonds or establish an ESG framework)100 101 102
FISCAL POLICIESAppropriate taxation and pricing instruments constitute incentives to align finance flows and investment with a climate-compatible future Removing budgetary support and tax exemptions for fossil fuels and putting in place effective carbon pricing schemes are key steps to this end alongside complementary fiscal policies supporting adaptation and a just transition
Fossil fuel subsidies remain very highThe continued provision of subsidies for the production and consumption of fossil fuels by G20 governments hinder the low-carbon transition by creating perverse incentives for their extraction and use thereby prolonging the life of fossil fuel assets
In 2009 G20 members committed to ldquorationalise and phase out over the medium-term inefficient fossil fuel subsidies that encourage wasteful consumptionrdquo103 However progress has been limited In 2019 alone G20 members excluding Saudi Arabia104 provided at least USD 152bn in subsidies for the production and consumption of coal oil and gas (see Figure 18)105
France
Responsible Investments Policy91 (Central Bank of France) 2021
Definitive exit from coal by 2024
South Korea
Official support for TCFD guidelines 202192
USA
Bill on climate risk disclosure 2021
Executive order to incorporate physical and transition climate risk in financial regulations 202189 90
UK
Task Force on Climate-related Financial Disclosures (TCFD) recommended report regulations 202187
Canada
Canadian Net-Zero Emissions Accountability Act 2021
Ministry of Finance to annually report on measures to address financial risks and climate change opportunities88
European Union
Climate change considerations in European Central Bank (ECB) monetary policy framework 2021
ECB climate change centre launched 202194
Japan
Regulatory guidelines on climate transition finance 202193
Bank of Japan to provide no-interest loans to financial institutions undertaking disclosure initiatives
12CLIMATE TRANSPARENCY REPORT | 2021
Five-year trends (2015-2019) for fossil fuel subsidies as a share of each countryrsquos GDP (which helps correct against currency and oil price fluctuations) show various extents of decrease in most G20 members most notably for Argentina106 China and Saudi Arabia (of between 57 and 70) but an increase in several others especially in Mexico Russia and France (in the order of 29-68) while remaining fairly stable in Canada and Turkey
Almost 40 of the total subsidies over the past years have been directed to petroleum
According to preliminary aggregate estimates107 government support for the production and consumption of fossil fuels in G20 economies excluding Saudi Arabia for which comparable data is not available decreased by 9 from 2019 This reduction was mostly due to COVID-19 impacts such as the fall in consumption of transport fuels brought about by mobility restrictions and a 10 decrease in support to the fossil fuel production sector driven by the drop in oil demand and the ensuing OPEC quotas of production in response108 However this decrease may well be offset by several examples of large sums of government support devoted to fossil fuel production in the form of sizeable bailouts to state oil and electricity companies once these are officially reported During 2020 G20 members pledged at least USD 252bn to fossil fuel energy as part of their energy-related funding commitments and COVID-19 economic response109
Most countries now have carbon pricing Pricing carbon effectively can encourage emitters across the entire economy to put in place efficiency measures and low-carbon transition plans Currently a total of 13 G20 members (as opposed to only 10 five years ago) have in place some form of explicit national carbon pricing scheme such as carbon taxes and emissions trading schemes (ETS) Brazil Indonesia Russia and Turkey are currently considering introducing such a scheme and some are currently trialling pilot schemes In 2020 explicit carbon pricing schemes generated total revenue of USD 47bn in the G20 with France and Japan recording the highest amounts of USD 93bn and USD 62bn respectively
Among the latest updates China launched its long-awaited national carbon ETS for the power sector (July 2021) the German government officially launched (January 2021) a national ldquocap-and-traderdquo system for the heating and road transport sectors (which are currently not covered by the EU ETS) and a UK ETS (as of January 2021) replaced the UKrsquos participation in the EU ETS following Brexit110 111 112
Figure 18 2019 G20 members fossil fuel subsidies (absolute values and per-unit of GDP shares) and 2015-2019 subsidy trends
Foss
il fue
l sub
sidie
s in
2019
(USD
bn)
Increased Decreased Remained steady
Five-year trends
Foss
il fue
l sub
sidie
s
of G
DP 2
019
(USD
bn)
0
5
10
15
20
USAJPNKORCHNGERCANINDTURIDNBRARUSFRAITAUKARGAUSZAFMEX00
02
04
06
08
climate aims (see Figure 19) France is the only G20 member whose carbon price is above the USD 40tCO2e threshold by 2020 recommended by the High-Level Commission on Carbon Prices A few G20 members (Canada Germany Italy South Korea the UK and the EU) have a carbon price that is defined as ldquolowrdquo (USD 11-39tCO2e)
Figure 19 Coverage and average price of explicit carbon pricing schemes in G20 members
Country Coverage Price (USD)
Argentina 20 95
Australia 0 na
Brazil 0 na
Canada 31 328
China 0 na
France 74 540
Germany 39 325
India 0 na
Indonesia 0 na
Italy 39 325
Japan 68 27
Mexico 46 33
Russia 0 na
Saudi Arabia 0 na
South Africa 80 95
South Korea 74 194
Turkey 0 na
UK 62 325
USA 0 na
EU 39 325
Coverage criteria based on that which was used in the BNEF Climate Policy Factbook
High gt66
Medium 33-66
Sufficient gtUSD 40
Low USD 11-39 Very low USD 1-10
Low lt33
None 0
Coverage
Price
while carbon prices in the rest of the G20 remain below the USD 10tCO2e threshold When emissions coverage is considered for national-level explicit carbon pricing schemes only schemes in France Japan South Africa and South Korea currently cover more than 66 of domestic emissions
Trends were assumed to have remained steady for increases or decreases within a +- 10 rangeNote Saudi Arabia is not included as comparable data is unavailable
Source OECD inventory of fossil fuel 2020113 For more information on the data see the Methodology note
Notes This table only includes national-level schemes and their prices It does not include sub-national schemes the inclusion of which would increase the overall level of coverage and pricing of carbon in a country For example according to the BNEF report Climate Policy Factbook in countries with significant sub-national schemes the overall coverage and prices can vary the levels and are as follows Canada 78 USD 31tCO2 China 43 USD 6tCO2 USA 8 USD 6tCO2114 For EU countries the table includes the EU ETS as well as any national scheme prices and it assumes that the EU ETS coverage is uniform across EU members and equal to the EU average coverage of 39 When a country has both its own national carbon pricing scheme and the EU ETS the one with the highest nominal price was chosen to determine the price in the table
Source Analysis based on data provided by I4CE 2021115 For more information see the Methodology note
However emissions coverage greatly varies and the price of carbon remains generally too low across the G20 to be in line with
13CLIMATE TRANSPARENCY REPORT | 2021
KEY ACTIONS FOR G20 MEMBERS
Finally the EU recently released a proposal for a new Carbon Border Adjustment Mechanism (CBAM) a climate measure that should prevent the risk of ldquocarbon leakagerdquo (the practice of moving carbon-intensive production abroad to avoid paying the price of carbon) In their July 2021 communiqueacute G20 Finance Ministers also mentioned the need for closer collaboration on carbon pricing mechanisms116
PUBLIC FINANCE FOR FOSSIL FUELSGovernments channel financing through public finance institutions including national and multi-lateral development banks and export credit agencies by providing direct funding and encouraging private investments by lowering the cost of and risk for capital Steering this financing away from high-carbon assets and towards appropriate adaptation and mitigation activities is crucial to aligning with the Paris Agreementrsquos goals
International public finance for fossil fuels continuesDuring 2018-19 G20 members provided USD 507bn per year of public finance for fossil fuels117 Over three-quarters of this financing was for oil and gas The highest providers of public finance were Japan (USD 103bnyr) China ( just over USD 8bnyr) and South Korea ( just under USD 8bnyr) (see Figure 20)
There has however been encouraging progress in terms of G20 members restricting public spending on fossil fuels through public finance institutions (PFIs) Multilateral development banks (MDBs) and nationally-owned development banks have made commitments in recent years to mainstream climate considerations in their operations and lending Most recently in May 2021 G7 nations made a commitment to end the use of public finance for new unabated international coal power plants118 South Korea also made a similar commitment119 In addition the US Treasury has announced a significant step away from international coal and gas projects through MDBs120 In September 2021 China also committed to end coal financing overseas121
However to support the phase-out of these fuels in line with climate goals such restrictions must be rapidly expanded to include oil and gas The UK government has shown leadership by announcing in December 2020 that it would no longer provide any fossil fuel finance internationally though with lack of clarity on natural gas projects122 This follows similar commitments by the EUrsquos PFIs The European Investment Bank (EIB) banned financing for all fossil fuels in 2019 but with exemptions for certain types of natural gas projects123 In July 2021 the European Bank for Reconstruction and Development (EBRD) committed to stop investing in upstream oil and gas projects by the end of 2022 to align its activities with the Paris Agreement124
International climate finance is still lackingAustralia Canada the EU France Germany Italy Japan the UK the USA are considered Annex II under the UNFCCC and are therefore obliged to provide climate finance to non-Annex II countries They reported an annual average international public support amount of USD 43bn between 2017-18 which only increased by 2 between 2018-19126 127
Japan is the largest contributor of climate finance among G20 members at over USD 12bn in 2017-18 which includes so-called lsquocleanrsquo coal as climate finance Flows are delivered predominantly through the Japanese Bank for International Cooperation (JICA) Germany and France follow at USD 84bn and USD 66bn respectively making use of KfW and the French Development Agency (AFD)
A number of non-Annex II countries of the G20 are voluntarily contributing climate finance (Brazil China India Indonesia Mexico Russia South Africa and South Korea) Russia has provided data on climate finance provision while other countries have pledged multilateral climate change funds
COP26 in 2021 marks the official start of negotiations towards the new climate finance goal The new goal will need to
exceed the target of USD 100bn a year from 2020 that developed countries committed to mobilise for developing countries from public and private sources At the G7 Summit in July 2021 Canada France Germany Italy Japan the UK and the USA reaffirmed their commitment to the USD 100bn through 2025128 And in September 2021 the European Commission committed an additional EUR 4bn (USD 5bn) by 2027 to support low-income and climate vulnerable countries129 Yet many estimates suggest they are still falling short of the target130 131 132 and countries are not doing their lsquofair-sharersquo133
With climate finance needs estimated to be far beyond USD 100bn a year it will be critical to develop trust between Global South and G7G20 members for this goal to be met Many Annex II G20 countries will need to show clear commitments to greater climate finance ambition than the current target and must use robust transparency and accountability mechanisms to ensure resources are effectively spent on quality projects In this respect the G7 commitment to end overseas development aid (ODA) for new coal is a key step in ensuring all finance flows are aligned with the Paris Agreement goal
Figure 20 G20 public finance for fossil fuels (USD millions per year 2018-19 average)
0
2000
4000
6000
8000
10000
12000
ZAFAUSARGTURFRAIDNMEXRUSBRAIND GERSAUUKITAUSACANKORCHNJPN
3OtherCoal
82
15
Oil and gas
Total50779
Initiatives integrating climate risk and reporting into their financial systems must move from voluntary to compulsory reporting and price and coverage of carbon pricing schemes must be increased
G20 members must eliminate continued subsidies as well as domestic and international public finance for fossil fuels
The nine G20 members who are required to provide climate finance to developing countries need to deliver the delayed USD 100bn and reaffirm their commitment for sufficient and high-quality financing that meets the needs of recipients
Coal coal extraction or coal-fired power generation Oil and gas oil and gas extraction processing or gas-fired electricity Other where support is provided for fossil fuels but the allocation between the types of fuel is unknown or it is provided to coal oil and gas activities (combined)
Source Oil Change International 2020125
14CLIMATE TRANSPARENCY REPORT | 2021
ENDNOTES1 Rogelj J et al (2018) ldquoMitigation Pathways Compatible
with 15degC in the Context of Sustainable Developmentrdquo in Masson-Delmotte V et al (eds) Global Warming of 15degC An IPCC Special Report on the Impacts of Global Warming of 15degC httpswwwipccchsiteassetsuploadssites2201905SR15_Chapter2_Low_Respdf
2 IPCC (2021) Climate Change 2021 The Physical Science Basis Contribution of Working Group I to the Sixth Assessment Report of the Intergovernmental Panel on Climate Change Eds Masson-Delmotte V et al httpswwwipccchreportar6wg1SPM
3 Climate Watch (nd) Historical GHG Emissions httpswwwclimatewatchdataorgghg-emissionsend_year=2018ampregions=G20ampsectors=total-including-lucfampstart_year=1990
4 UN (2015) Paris Agreement httpsunfcccintsitesdefaultfilesenglish_paris_agreementpdf
5 CAT (2021a) Global Update httpsclimateactiontrackerorgpublicationsglobal-update-september-2021
6 Climate Watch (nd) Historical GHG Emissions httpswwwclimatewatchdataorgghg-emissionsend_year=2018ampregions=G20ampsectors=total-including-lucfampstart_year=1990
7 CAT (2021a) Global Update8 Ibid9 Climate Analytics (2021) 15degC National Pathways Explorer
http1p5ndcpathwaysclimateanalyticsorg10 Climate Watch (nd) Net-Zero Tracker httpswww
climatewatchdataorgnet-zero-tracker11 Energy and Climate Intelligence Unit (nd) Net Zero Tracker
httpseciunetnetzerotracker12 CAT (2021b) CAT Climate Target Update Tracker13 Climate Analytics (2021) Closing the Gap https
climateanalyticsorglatestnew-report-finds-ambitious-action-by-g20-countries-alone-can-limit-warming-to-17c-keeping-15c-goal-within-reach
14 CAT (2021a) Global Update15 Climate Transparency (nd) NDC Transparency Check https
wwwclimate-transparencyorgndc-transparency-check16 World Health Organisation (2021) WHO Coronavirus (COVID-19)
Dashboard httpscovid19whoint [At the time of writing there were 4654548 deaths figure updated 30 September 2021]
17 OECD (2020) COVID-19 and the Aviation Industry Impact and Policy Responses httpswwwoecdorg
18 Based on data received directly from Enerdata (2021)19 UNEP (2021) Are We Building Back Better Evidence from 2020
and Pathways for Inclusive Green Recovery Spending httpswwwuneporg
20 Global Recovery Observatory (August 2021) How Are Countries Investing in Recovery UNDP httpsdataundporgcontentglobal-recovery-observatory
21 Ibid22 G20 (2009) G20 Leaders Statement The Pittsburgh
Summit G20 Research Group httpwwwg20utorontoca20092009communique0925html
23 IISD et al (2020) Doubling Back and Doubling Down G20 Scorecard on Fossil Fuel Funding httpswwwiisdorgsystemfiles2020-11g20-scorecard-reportpdf
24 Energy Policy Tracker (2021) G20 Countries httpswwwenergypolicytrackerorgregiong20
25 IEA (2021a) Sustainable Recovery Tracker httpswwwieaorgreportssustainable-recovery-tracker
26 Global Recovery Observatory (August 2021) How Are Countries Investing in Recovery
27 IPCC (2021) Climate Change 2021 The Physical Science Basis 28 World Weather Attribution (2021) Western North American
Extreme Heat Virtually Impossible Without Human-Caused Climate Change httpswwwworldweatherattributionorg
29 World Meteorological Organisation (2021) 2020 Was One of the Three Warmest Years On Record httpspublicwmoint
30 ND-GAIN (nd) Methodology httpsgainndeduour-workcountry-indexmethodology
31 Global Centre on Adaptation (2020) State and Trends Report 2020 httpsgcaorgwp-contentuploads202103GCA-State-and-Trends-Report-2020-Online-3pdf
32 Germanwatch (2020) Global Climate Risk Index 2020 httpsgermanwatchorgen17307
33 Arnell N W et al (2019) ldquoGlobal and Regional Impacts of Climate Change at Different Levels of Global Temperature Increaserdquo Climatic Change httpslinkspringercomarticle1010072Fs10584-019-02464-z
34 ND-GAIN (nd) Country Index httpsgainndeduour-workcountry-index
35 Andrijevic M et al (2020) ldquoGovernance in Socioeconomic Pathways and its Role for Future Adaptive Capacityrdquo Nature Sustainability httpsdoiorg101038s41893-019-0405-0
36 ND-GAIN (nd) Country Index37 Rogelj J et al (2018) ldquoMitigation Pathways Compatible with
15degC in the Context of Sustainable Developmentrdquo38 Based on data received directly from Enerdata (2021)39 Ibid40 Ibid
41 Enerdata (2021) Global Energy and CO2 Data httpswwwenerdatanetresearchenergy-market-data-co2-emissions-databasehtml
42 Based on data received directly from Enerdata (2021)43 Ibid44 US Energy Information Administration (nd) Data https
wwweiagovinternationaldataworld45 Based on data received directly from Enerdata (2021)46 IEEFA (2021) Stranded Asset Risks For Gas Investments
Climbing Quickly httpsieefaorgstranded-asset-risks-for-gas-investments-climbing-quickly
47 US Energy Information Administration (nd) Data httpswwweiagovinternationaldataworld
48 International Labour Organisation (2015) Guidelines For a Just Transition Towards Environmentally Sustainable Economies and Societies For All httpswwwiloorg
49 Government of Canada (2021) People-Centred Just Transition Discussion Paper httpswwwrncanengagenrcanca
50 European Commission (nd) The Just Transition Mechanism Making Sure No One is Left Behind httpseceuropaeu
51 Department of Forestry Fisheries and the Environment (2020) Cabinet Approves Climate Change Emissions Reduction and Waste Management Plans httpswwwenvironmentgovza
52 The Government of the Republic of Korea (2020) 2050 Carbon Neutral Strategy of the Republic of Korea UNFCCC httpsunfcccintsitesdefaultfilesresourceLTS1_RKoreapdf
53 Based on data received directly from Enerdata (2021)54 CAT (2020) Paris Agreement Compatible Sectoral Benchmarks
Study httpsclimateactiontrackerorgpublicationsparis-agreement-benchmarks
55 Rogelj J et al (2018) ldquoMitigation Pathways Compatible with 15degC in the Context of Sustainable Developmentrdquo
56 Based on data received directly from Enerdata (2021)57 IRENA (2018) Global Energy Transformation A Roadmap to
2050 httpswwwirenaorg-mediaFilesIRENAAgencyPublication2018AprIRENA_Report_GET_2018pdf
58 Based on data received directly from Enerdata (2021)59 Global Energy Monitor (2021) Global Coal Plant Tracker ndash
Dashboard httpsglobalenergymonitororgprojectsglobal-coal-plant-trackerdashboard
60 It should be noted that some countries have a very low to no coal power capacity For example please see the energy mix graph (energy chapter) for details on fossil fuels in Argentina Saudi Arabia has never used coal and is also not planning to build any coal plants but is 100 dependent on oil and gas plants
61 Enerdata (2021) Global Energy and CO2 Data62 IEA (2020a) Global Energy Review 2020 httpsieablobcore
windowsnetassets7e802f6a-0b30-4714-abb1-46f21a7a9530Global_Energy_Review_2020pdf
63 Based on data received directly from Enerdata (2021)64 Rogelj J et al (2018) ldquoMitigation Pathways Compatible with
15degC in the Context of Sustainable Developmentrdquo 65 Ritchie H (2019) Who Has Contributed Most to Global CO2
Emissions Our World In Data httpsourworldindataorgcontributed-most-global-co2 Note aviation accounts for 116 and shipping accounts for 106 of transport emissions Long-distance road freight (large trucks) aviation and shipping are particularly difficult to eliminate
66 Based on data received directly from Enerdata (2021)67 Climate Transparency (2021) Country Profiles httpswww
climate-transparencyorg68 Rogelj J et al (2018) ldquoMitigation Pathways Compatible with
15degC in the Context of Sustainable Developmentrdquo69 Baumert KA (2005) Navigating the Numbers Greenhouse
Gas Data and International Climate Policy World Resources Institute httpswwwwriorgresearchnavigating-numbers
70 IPCC (2014) ldquoIndustryrdquo in Climate Change 2014 Mitigation of Climate Change Contribution of Working Group III to the Fifth Assessment Report of the Intergovernmental Panel on Climate Change Eds Edenhofer O et al httpswwwipccch
71 CAT (2020) Paris Agreement Compatible Sectoral Benchmarks Study
72 Rogelj J et al (2018) ldquoMitigation Pathways Compatible with 15degC in the Context of Sustainable Developmentrdquo
73 IEA (2020b) Energy Efficiency 2020 httpswwwieaorgreportsenergy-efficiency-2020
74 Based on data received directly from Enerdata (2021)75 IEA (2020c) Heating httpswwwieaorgreportsheating76 Rogelj J et al (2018) ldquoMitigation Pathways Compatible with
15degC in the Context of Sustainable Developmentrdquo77 WWF (2021) Australia Remains the Only Developed Nation on
the List of Global Deforestation Fronts httpswwwwwforgau78 Global Forest Resources Assessment (2020) Annual Forest
Expansion Deforestation and Net Change Indicator Food and Agriculture Organisation httpsfra-datafaoorgWOfra2020forestAreaChange
79 Rogelj J et al (2018) ldquoMitigation Pathways Compatible with 15degC in the Context of Sustainable Developmentrdquo
80 Food and Agriculture Organisation (FAO) (2021) Emissions Totals Agriculture httpwwwfaoorgfaostatendataGT
81 Ibid 82 Based on data received directly from Enerdata (2021)
83 IEA (2021b) Net Zero by 2050 A Roadmap for the Global Energy Sector httpswwwieaorgreportsnet-zero-by-2050
84 UN (2015) Paris Agreement85 European Think Tanks Group (2021) G20 Ministerial Meetings
High Time for Development and Finance Ministers to Work Hand in Hand For a Sustainable Global Recovery httpsettgeu
86 Financial Stability Board (2021) FSB Roadmap for Addressing Climate-related Financial Risks httpswwwfsborg202107fsb-roadmap-for-addressing-climate-related-financial-risks
87 UK Government (2021) Governance and Reporting of Climate Change Risk Guidance For Trustees of Occupational Schemes httpswwwgovuk
88 Parliament of Canada (2021) BILL C-12 An Act Respecting Transparency and Accountability in Canadarsquos Efforts to Achieve Net-Zero Greenhouse Gas Emissions by the Year 2050 httpslaws-loisjusticegccaengactsC-193FullTexthtml
89 US House Committee on Financial Services (2021) To Amend the Securities Exchange Act of 1934 to Require Certain Disclosures Relating to Climate Change and For Other Purposes httpsfinancialserviceshousegovuploadedfiles0225_bills-1173ihpdf
90 The White House (2021) Executive Order on Climate-Related Financial Risk httpswwwwhitehousegov
91 Banque de France (2021) Responsible Investment Policy Reinforcing Exclusions With Regard to Fossil Fuels httpswwwbanque-francefr
92 Financial Services Commission (2021) Financial Authorities and Relevant Institutions Declare Support for TCFD and Its Recommendations httpswwwfscgokr
93 Financial Services Agency (2021) Basic Guidelines on Climate Transition Finance httpswwwfsagojpnewsr2singi20210507_204pdf
94 European Central Bank (2021b) ECB Presents Action Plan to Include Climate Change Considerations in Its Monetary Policy Strategy httpswwwecbeuropaeupressprdate2021htmlecbpr210708_1~f104919225enhtml
95 Australian Prudential Regulation Authority (2021) APRA Releases Guidance on Managing The Financial Risks of Climate Change httpswwwapragovau
96 Peoplersquos Bank of China (2020) ldquoSupporting Low-Carbon Development With Green Financerdquo Video speech at the Singapore FinTech Festival (SFF) 2020 httpwwwpbcgovcnen3688110368817240482694141587indexhtml
97 Green Finance Platform (2019) The Sustainable Finance Committee of the Federal Government httpswwwgreenfinanceplatformorg
98 Reserve Bank of India (2021) Financial Stability Report httpswwwrbiorginScriptsPublicationReportDetailsaspxUrlPage=ampID=1174
99 The Biodiversity Finance Initiative (2021) Mexico Starts Dialogue with Central Bank About Greening the Finance Sector httpswwwbiofinorgnews-and-mediamexico-starts-dialogue-central-bank-about-greening-finance-sector
100 Bank of Russia (2020) Information Letter on Recommendations for the Implementation of the Principles of Responsible Investment httpswwwcbrrucontentdocumentfile112325in-06-28_111_epdf
101 Reuters (2021) Saudi Sovereign Wealth Fund Scopes Banks for ESG framework httpswwwreuterscom
102 Turkey Investment Office (2021) New Economic Reform Package Heralded by President Erdoğan httpswwwinvestgovtr
103 G20 (2009) G20 Leadersrsquo Statement The Pittsburgh Summit 104 IEA (2020d) Energy Subsidies Database httpswwwiea
orgtopicsenergy-subsidies For more information on the data see the Methodology note at wwwclimate-transparencyorgg20-climate-performanceg20report2021
105 OECD-IEA (2020) Fossil Fuel Support Database 2020 update httpswwwoecdorgfossil-fuelscountrydata and httpswwwieaorgdata-and-statisticschartsvalue-of-fossil-fuel-consumption-subsidies-2010-2020 For more information on the data see the Methodology note at at wwwclimate-transparencyorgg20-climate-performanceg20report2021
106 Note the interpretation of some of the five-year trends requires some caution For example in the case of Argentina the observed trend can be partly explained by a substantial increase in the national budget due to the countryrsquos currency devaluation For more information see Fundacioacuten Ambiente y Recursos Naturales (FARN) (2020) Fossil Fuel Subsidies Is Every Little Thing ldquoGonna Be Alrightrdquo httpsfarnorgarwp-contentuploads202008DOC_SUBSIDIOS_2019-2020_FINAL_INGLES_linkspdf
107 OECD (2021 15 July) Update on Recent Progress in Reform of Inefficient Fossil-Fuel Subsidies That Encourage Wasteful Consumption 2021 httpswwwoecdorg
108 Ibid109 Energy Policy Tracker (2021) Track Public Money for Energy in
Recovery Packages httpswwwenergypolicytrackerorg110 Reuters (2021) Chinarsquos Carbon Trading Scheme Makes Debut
with 41 Million Tonnes in Turnover httpswwwreuterscom111 Schulz F translated by S Lawton (2020) ldquoGerman Cabinet
Agrees CO2 Price of euro25 from January 2021rdquo Euractiv httpswwweuractivde
112 UK Government (2021) Participating in the UK Emissions Trading Scheme (UK ETS) httpswwwgovuk
15CLIMATE TRANSPARENCY REPORT | 2021
This Highlights Report is part of the Climate Transparency Report 2021 Find the G20 country profiles at wwwclimate-transparencyorg
Climate Transparency is a global partnership with a shared mission to stimulate a ldquorace to the toprdquo in climate action in G20 countries through enhanced transparency
ACKNOWLEDGMENTS
PARTNERS DATA PARTNERS
FUNDERS
ClimateActionTracker
Supported by
based on a decision of the German Bundestag
113 OECD-IEA (2020) Fossil Fuel Support Database 2020 update For more information on the data see the Methodology note at wwwclimate-transparencyorgg20-climate-performanceg20report2021
114 BNEF (2021) Climate Policy Factbook httpswwwunorg115 Institute for Climate Economics (I4CE) (2021) Global Carbon
Accounts 2021 Paris France httpswwwi4ceorgdownloadglobal-carbon-account-in-2021 For more information see the Methodology Note at wwwclimate-transparencyorgg20-climate-performanceg20report2021
116 G20 (2021) Italian G20 Presidency Third Finance Ministers and Central Bank Governors Meeting Communique 9-10 July 2021 httpswwwg20orgwp-contentuploads202107Communique-Third-G20-FMCBG-meeting-9-10-July-2021pdf
117 Oil Change International (2020) Still Digging G20 Governments Continue to Finance the Climate Crisis httppriceofoilorg20200527g20-still-digging
118 Climate Home News (2021) G7 Commits to End Unabated Coal Finance in 2021 To lsquoKeep 15C Within Reachrsquo httpswwwclimatechangenewscom20210521g7-commits-end-unabated-coal-finance-2021-keep-1-5c-within-reach
119 Reuters (2021) South Korearsquos Moon Vows to End New Funding for Overseas Coal Projects httpswwwreuterscomarticleglobal-climate-summit-southkorea-idUSL4N2MF3R2
120 US Treasury (2021) Treasury Announces Fossil Fuel Energy Guidance for Multilateral Development Banks httpshometreasurygovnewspress-releasesjy0323
121 Ministry of Foreign Affairs of the Peoplersquos Republic of China (2021) Xi Jinping Attends the General Debate of the 76th UN General Assembly and Delivers an Important Speech httpswwwfmprcgovcnmfa_engzxxx_662805t1909172shtml
122 UK Government (2020) PM Announces the UK Will End Support for Fossil Fuel Sector Overseas httpswwwgovuk
123 European Investment Bank (EIB) (2019) EU Bank Launches Ambitious New Climate Strategy and Energy Lending Policy httpswwweiborgenpressall2019-313-eu-bank-launches-ambitious-new-climate-strategy-and-energy-lending-policy
124 European Bank for Reconstruction and Development (EBRD) (2021) EBRD Announces Full Paris Alignment by End-2022 httpswwwebrdcomnews2021ebrd-announces-full-paris-alignment-by-end2022-html
125 Oil Change International (2020) Still Digging G20 Governments Continue to Finance the Climate Crisis For more information see the Methodology note at wwwclimate-transparencyorgg20-climate-performanceg20report2021
126 The public support reported through membersrsquo biennial reports to the UNFCCC include bilateral and regional climate finance finance channelled through the multilateral climate change funds and support to multilateral and bilateral institutions that parties cannot specify as climate-specific (eg MDBs UN bodies) UNFCCC (2020) Country Biennial Report Submissions to the UNFCCC Fourth Biennial Reports httpsunfcccintBRs The USA did not provide a BR4 therefore the
provisional data provided to the UNFCCC in 2018 (thus for the 2015-16 period) is used as an estimate
127 OECD (2021) Climate Finance Provided and Mobilised by Developed Countries Aggregate Trends Updated with 2019 Data httpswwwoecdorgenvironmentclimate-finance-provided-and-mobilised-by-developed-countries-aggregate-trends-updated-with-2019-data-03590fb7-enhtm
128 G7 (2021) Carbis Bay G7 Summit Communique httpswwwg7ukorgwp-contentuploads202106Carbis-Bay-G7-Summit-Communique-PDF-430KB-25-pages-5pdf
129 Farnad C (2021) ldquoEU Commits euro4 Billion More to Climate Vulnerables Calls on the US to Step Uprdquo Climate Change News httpswwwclimatechangenewscom20210915eu-commits-e4-billion-climate-vulnerables-calls-us-step
130 Oxfam (2020) Climate Finance Shadow Report 2020 Assessing Progress Towards the $100 Billion Commitment 2020 httpswwwoxfamorgenresearchclimate-finance-shadow-report-2020
131 Bhattacharya A Calland R Averchenkova A Gonzalez L Martinez-diaz L and J Van Rooij (2020) Delivering on the $100 Billion Climate Finance Commitment and Transforming Climate Finance httpswwwunorgsitesun2unorgfiles100_billion_climate_finance_reportpdf
132 OECD-IEA (2020) Fossil Fuel Support Database 2020 update 133 Colenbrander S Cao Y Pettinotti L and A Quevedo (2021)
A Fair Share of Climate Finance Apportioning Responsibility for the $100 Billion Climate Finance Goal httpsodiorg
Highlights Report Leads Gahee Han amp Justine Holmes (Solutions For Our Climate (SFOC))
Country Profiles Lead Kim Coetzee (Climate Analytics)
Finance Lead Ipek Genccedilsuuml (ODI)
Contributing authors expert comments and inputs Aleksandra Kotur Florian Mersmann Gerd Leipold Pia Gleich (Humboldt-Viadrina Governance Platform) Andrezj Ancygier Anna Chapman Carley Reynolds Chelsea Jones Claire Fyson Claire Stockwell Deborah Ramalope Jae Kim Marie-Camille Attard Nandani Das Ryan Wilson Sharna Nolan Victor Maxwell Yann Robiou du Pont Data Team Andreas Geiges (Lead) Himalaya Bir Shrestha Sylvia Schmidt (Climate Analytics) Angela Picciariello Charlene Watson Nandini Sharma (ODI) Abhishek Kaushik Sachi Vohra (The Energy and Resources Institute) Analuz Presbiacutetero Mariana Gutieacuterrez Grados Jorge Villarreal (Iniciativa Climatica de Mexico) Andrew Marquard Bryce McCall (Energy Systems Research Group University of Cape Town) Ayse Sari (SHURA) Bert Metz (European Climate Foundation) Benoicirct Prunel Jeacutereacutemy Bonnefous Pascal Charriau (Enerdata) Caroline Lee (Canadian Institute for Climate Choices) Dorka Bauer (GSCC) David Eckstein Jan Burck (Germanwatch) Enrique Maurtua Konstantinidis Jazmiacuten Rocco Predassi (Fundacion Ambiente y Recursos Naturales) Fabby Tumiwa Lisa Wijayani (Institute for Essential Service Reform) Jiang Kejun (Beijing University of Technology) Georgia McDonnell Joojin Kim Jeehye Park Jessica Yun Kyungrak Kwon Sejong Youn Soojin Kim Sunwoo Lee (Solutions For Our Climate (SFOC)) Keisuke Iyadomi Rachel Chi Kiu Mok Sandhya Srinivasan (World Bank) Kentaro Tamura (Institute for Global Environmental Strategies) Lola Vallejo (Institute for Sustainable Development and International Relations) Simon Maxwell Surabi Menon (ClimateWorks Foundation) William Wills (Centro Clima Federal University of Rio de Janeiro)
Design Design for development (wwwd4dcoza) Editor Chapel Lane Editing Services Tanya Goodman
16CLIMATE TRANSPARENCY REPORT | 2021

KEY ACTIONS FOR G20 MEMBERS
G20 members that have not yet done so need to adopt mid-century net zero targets that are embedded in law
G20 members that do not have 15degC aligned targets need to submit stronger ones before COP26 and all G20 members need to strengthen climate policies and actions to meet 15degC pathways
Developed countries need to ramp up climate finance contributions to assist developing countriesrsquo climate action
2 Provide a precise description of the target
Explain how the reference indicators are defined the assumptions behind the business-as-usual (BAU) projections the coverage of the target and the implementation period
3 Make a link to Paris Agreement goals
Describe when emissions are projected to peak (or have peaked) and refer to national policyies commitment to net zero emissions
4 Share the planning process
Provide information on institutional arrangements for developing and implementing the NDC including consultation processes that allow for public participation and engagement with local communities and indigenous peoples in a gender-responsive manner
5 Describe implementation plans
Provide information on which policies and measures will be implemented to achieve target(s)
1 Describe ambition and fairness
Provide detailed information sustained by emissions reduction analysis on how the current or updated NDC a) comprises a fair and ambitious contribution to global efforts to mitigate climate change and precisely how it is a progression on the last NDC mitigation target or action and b) will reflect the ldquohighest possible ambitionrdquo taking into account common but differentiated responsibilities and respective capabilities
In comparison Australia Brazil Indonesia Mexico and Russia have submitted NDCs with no change to their ambition with Brazil and Mexico altering their baselines which weakens their NDCs as it will result in higher emissions in 2030
BUT THE G20 IS NOT YET ALIGNED WITH A 15degC PATHWAYAll NDC updates submitted and announced up to April 2021 leave a significant emissions gap of about 23 GtCO2e from a 15degC pathway with the G20 collectively making up around two-thirds of this gap
If all G20 members strengthened their 2030 NDCs along a 15degC compatible domestic emissions pathway (see Figure 1) and reached net zero targets by 2050 with a faster timeline for developed countries than
Law Policy DocumentNet zero target covers all GHGs
Canada EU France Japan UK
USA China (2060)
No detail in net zero target on which GHGs are covered
Germany (2045) South Korea
Argentina Brazil Italy South Africa Indonesia (2060)
Figure 2 Timing status GHG coverage and use of offsets in current G20 net zero targets
Submitted a more ambitious NDC target
Proposed a more ambitious NDC target
Did not increase ambition in NDC target
Not yet submitted or proposed an updated NDC
Argentina (2nd
NDC) Canada EU (incl France Germany and Italy) South Africa UK (1st NDC) USA
China Japan South Korea
Australia Brazil Indonesia Mexico Russia
India Saudi Arabia
Figure 3 Status of updated NDCs
Turkeyrsquos submission remains an Intended Nationally Determined Contribution (INDC) until it ratifies the Paris Agreement
contributions to support action in developing countries Russia and Saudi Arabia are rated overall as ldquoCritically insufficientrdquo which means that if all governments took this approach global warming would exceed 4degC
The UK is the only G20 member with a domestic target that aligns with a 15degC modelled domestic pathway in 2030 however the overall rating is ldquoAlmost sufficientrdquo as its policies and action are not yet 15degC aligned nor is it meeting its lsquofair-sharersquo target or climate finance contribution Following closely are the EU Germany Japan South Africa and the USA which are rated overall as ldquoInsufficientrdquo From this group the EU and Germany are the only ones rated as ldquoAlmost sufficientrdquo for both their targets and their policies and action However none are meeting their lsquofair-sharersquo targets or climate finance contributions14
NDC Transparency Check recommendations15
The NDC Transparency Check assesses the quality of NDCs relating to whether a partyrsquos communication is clear transparent and understandable in terms of the requirements set out in the Paris Agreement its accompanying decision (1CP21) and Annex I to decision 4CMA1
for developing countries the current gap of 23 GtCO2e could be narrowed by 64 This would also result in a lower temperature of 17degC by 2100 This effort could get us about three-quarters of the way to limiting global warming to 15degC compared with the estimated 24degC of warming under current targets13
In CATrsquos new rating system most G20 membersrsquo are rated overall as ldquoHighly insufficientrdquo or ldquoCritically insufficientrdquo Argentina Australia Brazil Canada China India Indonesia Mexico and South Korea are rated overall as ldquoHighly Insufficientrdquo with Canadarsquos domestic target and Indiarsquos policies and action being the only elements within this group rated as ldquoAlmost sufficientrdquo These G20 members need to introduce much more ambitious domestic and internationally supported targets policies and action and for developed countries ramp up climate finance
Reductions or removals outside of own borders Note 11 of the G20 members have a net zero target year of 2050 excl China Germany and Indonesia
International offsets included No international offsets Unclear or undecided
Sources Climate Watch nd10 Energy amp Climate Intelligence Unit nd11
Source Climate Action Tracker 2021b 12
No targetAustralia India Mexico Russia Saudi Arabia Turkey
CLIMATE TRANSPARENCY REPORT | 2021 3
COVID RECOVERY
FOSSIL FUELS SUBSIDISED THROUGHOUT THE RECOVERY
The G20 missed the opportunity to shift away from fossil fuels through recovery investments
CLIMATE TRANSPARENCY REPORT | 2021
G20 total spending14244bn
1839bn
300bn
G20 Recovery spending
Green recovery spending
132
Liquidity support for large businesses
Liquidity support for subnational public entities
Targeted welfare cash transfers
Healthcare services support
Job continuation support
Liquidity support for SMEs
Current leaders80
70
60
50
40
30
20
10
001 005 01 05 1 5 10 500
BRA
TUR
CAN
MEXIND
Gree
n re
cove
ry s
pend
ing
( o
f tot
al re
cove
ry sp
endi
ng)
Recovery spending ( GDP logarithmic scale)
Developing countries Developed countries
(100)
Potential to act
IDN RUSARG
ITA
SAU
ZAF
Missing opportunities
GER
FRA
JPN KOR
UK
AUS
CHNUSA
$
FROM CRISES TO OPPORTUNITIESThe COVID-19 pandemic continues to devastate families and communities ndash around 47 million people worldwide had died by September 202116 While lockdowns and social restrictions have made life difficult for billions of people these responses also caused fewer car journeys flights and entire industries shutting down17 As a result energy-related CO2 emissions declined steeply by 6 in 2020 but are already projected to rebound strongly by 4 in 202118 Nonetheless the convergence of global health economic and climate crises has led to an opportunity for governments to ldquorecover betterrdquo by aligning medium-term recovery objectives with longer-term social and environmental objectives to achieve a clean green and resilient recovery
MISSED OPPORTUNITIES FOR A GREEN RECOVERYSince the beginning of the COVID-19 pandemic the G20 has mobilised USD 142tn in total stimulus spending to keep health services households and businesses afloat (see Figure 4) When implementing recovery packages governments missed the opportunity to transition to low carbon economies Only USD 300bn of the USD 18tn total recovery spending was directed to the much-heralded ldquogreenrdquo recovery
Canada France and Germany are identified as lsquocurrent leadersrsquo of the green recovery and based on recent announcements the EU would also fall into this group (see Figure 5) The majority of G20 members are however categorised as lsquomissing opportunitiesrsquo or having lsquopotential to actrsquo Non-OECD G20 members face greater
To avoid double counting the EU is not included when adding up total spending
Figure 5 G20 green recovery spending (January 2020-August 2021)
challenges to rebuild after multiple crises having to grapple with chronic problems and inequalities such as access to funds debt constraints and extreme poverty19 These members except China are mainly identified as having lsquopotential to actrsquo as they allocated less than 2 of their respective GDP to recovery spending of which less than 5 is for green investments In contrast OECD G20 members plus China who were mainly identified as lsquomissing opportunitiesrsquo allocated a higher proportion (of between 2-14) of their respective GDP to recovery but less than 30 was for green investments
Figure 4 G20rsquos total COVID-19 rescue and recovery spending (January 2020-August 2021)
Source Own analysis based on Global Recovery Observatory August 202120
The European Commission recently endorsed a budget of more than USD 1tn for 2021-2027 recovery spending including 37 allocated to a green transition This means that the EU would fall into the lsquocurrent leadersrsquo group in the graph To avoid double counting the EU is not included
Green recovery spending is based on potential impact on long- and short-term emissions air pollution natural capital quality of life and inequality Recovery spending includes incentive and investment measures such as worker retraining and job creation or transport and energy infrastructure investment Current leader means countries that allocated above 1 GDP to recovery spending and above 30 of recovery spending was for a green recovery Missing opportunities means countries allocated above 1 GDP to recovery spending but less than 30 of recovery spending was for a green recovery Potential to act means countries spent less than 1 GDP on recovery spending Bubble sizes represent total value of recovery spending
Source Own analysis based on Global Recovery Observatory August 2021 21
4
Figure 6 Conditional and unconditional fossil fuel subsidies in the G20 (January 2020-August 2021)
Total green recovery spending
300bn
G20 total spending
Green market creation25 UK
JPN
GER
Green energy24
CHI
KOR CAN
Green transport
Green building Green RampD
Natural capital1915
89
UK
GERKOR
CHI
KORUSA
FRA KORUK
KORFRA
Valu
e in
USD
bill
ion
Unconditional fossil fuel subsidies Conditional fossil fuel subsidies
0
10
20
30
40
50
60
70
80
BRAZAFAUSARGJPNMEXITAKORRUSSAUIDNTURCHNFRAGERINDCANUKUSA
KEY ACTIONS FOR G20 MEMBERS
MEANWHILE FOSSIL FUEL SUBSIDIES CONTINUED The G20 has continued to pour money into the fossil fuel industry with a total of USD 298bn committed in subsidies from January 2020 to August 2021 which is almost equal to the G20rsquos total green recovery allocation of USD 300bn (see Figure 6) These subsidies also ignore previous G20 promises to remove inefficient fossil fuel subsidies22 The majority or USD 248bn has gone towards unconditional fossil fuel subsidies with no lsquogreen stringsrsquo attached and the rest to conditional ones Oil and gas have benefited from the highest proportion of subsidies at USD 219bn whilst coal and fossil-fuel-based hydrogen have received USD 47bn and USD 11mn respectively China and India each announced subsidies of approximately USD 15bn aimed at expanding coal mining domestically whilst Canada France Germany the UK and the USA provided subsidies of more than USD 200bn to support oil and gas However more transparency about these figures is needed as Brazil Japan Saudi Arabia South Africa South Korea Turkey and the UK have been categorised as lsquoopaquersquo in terms of the full extent of fossil fuel funding and ldquohiddenrdquo subsidies23
GREEN SPENDING IN FOCUSGreen market creation green energy green transport natural capital green buildings and green research and development were among the sectors that benefited with G20 members including Canada China Germany France Japan South Korea the UK and the USA accounting for the majority of spending (see Figure 7) However to reach net zero emissions by mid-century and prevent emissions surging to a new record investments of USD 1tn per year from 2021-23 are needed across the power industry transport and building sectors where only 35 of these investment needs are currently being met25
G20 members need to introduce conditionality or ldquogreen stringsrdquo for recovery spending and reinforce policy regulations and incentives that align with near-term climate targets
G20 members that are still supporting fossil fuel industries need to redirect subsidies towards sector transformation and investments in renewable energy and other green sectors
Developing countries need support from developed G20 members to mobilise additional finance to encourage investment in green sectors
Figure 7 Total vs green spending and proportion of G20 member (excl EU) spending in various green sectors (January 2020-August 2021)
To avoid double counting the EU is not included when adding up total spending
Green market creation Investments promote the creation of green markets through a) increased clean energy market participation b) modernisation and transition investments and c) capacity investment For instance investments that prompt the integration of more renewable energy generation into electricity markets or investments which catalyse new green transitional industries
Source Own analysis based on Global Recovery Observatory August 2021 26
Policies are classified as unconditional if they support production and consumption of fossil fuels without any climate targets or additional pollution reduction requirements while policies with climate targets or additional pollution reduction requirements are categorised as conditional
Source Energy Policy Tracker 2021 24
CLIMATE TRANSPARENCY REPORT | 2021 5
Increase the ability to adapt to the adverse effects of climate change and foster climate resilience and low-GHG development PARISAGREEMENT
ADAPTATION ADDRESSING AND REDUCING VULNERABILITY TO CLIMATE CHANGE
CLIMATE TRANSPARENCY REPORT | 2021
Urgent implementation of plans and strategies is needed to reduce climate risk
VULNERABILITY OF G20 MEMBERS HIGHLIGHTS THE NEED TO ADAPT NOW
Figure 8 G20 membersrsquo readiness to adapt
03
04
05
06
07
08
09
028 032 036 040 044 048 052
Have great challenges but are adopting solutionsWell-positioned with fewer challenges
Fewer present challenges have time to get ready Greatest challenges and urgency to act
Adap
tatio
n re
adin
ess
Vulnerability
SAU
BRA
AUS
CAN
GER
FRA
UK
IDNIND
MEX
ITA
ARG
CHN
USA
KOR
RUS
TURZAF
G20
JPN
EU
KEY ACTIONS FOR G20 MEMBERS
LIVING IN A CLIMATE EMERGENCYGlobal warming will reach or exceed 15degC in the early 2030s in nearly all emissions scenarios considered by IPCC AR6 Under the very low emissions scenario however it will drop slightly to 15degC by the end of this century27 In 2021 G20 members are already experiencing first-hand the lsquolocked-inrsquo climate impacts of a warming world with record-breaking fires floods droughts extreme cold and heatwaves28 2020 was recorded as one of the hottest years on record and the last decade as the hottest ever29 Urgently allocating resources and planning to reduce vulnerability and strengthen resilience is of importance for all G20 members but especially for the most vulnerable ones30 From 2020-2030 it is estimated that an investment of USD 18tn in just five areas ndash early warning systems climate-resilient infrastructure dryland agriculture mangrove protection and water generation ndash would result in net benefits of USD 71tn31
HIGHER TEMPERATURES INCREASE CLIMATE RISK Chronic impacts and extreme weather events result in high human and economic costs which can be compounded by underlying inequalities poorly funded infrastructure and the effect of multiple crises including COVID-1932 Between 1999 and 2018 there have been nearly 500000 fatalities and close to USD 35tn of economic costs due to climate impacts worldwide with China India Japan Germany and the USA being hit particularly hard in 2018 Even if we meet 15degC and certainly if we exceed it the G20 will be exposed to even greater-than-average weather- and climate-related impacts Australia Brazil France Italy Mexico and Turkey will likely be exposed to severe water scarcity or droughts and it is expected that Australia India Mexico Saudi Arabia and South Africa will have many more days with extreme high temperatures Most G20 members could experience agricultural impacts such as reduced crop duration decreased rainfall and an increase in damaging hot spells for key crops all of which could lead to intensified local and global food insecurity33
DEVELOPING COUNTRIES FACE GREATEST CHALLENGES TO ADAPTAcross the G20 developing countries have the highest level of vulnerability to climate change but the lowest level of readiness and therefore face the greatest challenges (see Figure 8) Argentina Brazil China India Indonesia Mexico Saudi Arabia and South Africa are exposed to higher levels of vulnerability in the water and food sectors including projected change of cereal yields
low agricultural adaptive capacity and change of annual runoff These countries plus Turkey are also not ready to take on adaptation actions by leveraging public and private sector investments mainly due to issues of corruption regulatory quality rule of law or lower levels of innovation34 However recent extreme weather events have shown that developed countries must also improve their adaptation readiness and their ability to handle the worsening impacts of a fast-changing climate
G20 members urgently need adaptation plans and strategies in place across key systems ndash including food water health ecosystems habitat and infrastructure ndash and should strengthen their social economic and governance readiness to accelerate implementation of these plans
G20 members need to balance funding for adaptation not only with loss and damage for locked-in impacts but also with resources allocated to mitigation
Developed countries need to increase climate finance contributions to assist developing countries through bilateral and multilateral channels and with regular reviews
This graph shows the 2018 observed Readiness Index and 2050 projected Readiness Index describing a countryrsquos ability to improve climate resilience The readiness component of the Index created by the Notre Dame Global Adaptation Initiative (ND-GAIN) encompasses social economic and governance indicators to assess a countryrsquos readiness to deploy private and public investments in aid of adaptation The overlaid 2050 projections are qualitative and quantitative representations of a range of possible futures The range of scenarios shown here in lines are qualitatively described as a sustainable development compatible sce-nario (SSP1) a middle-of-the-road (SSP2) and a lsquoRegional Rivalryrsquo (SSP3) scenarioObserved (2018)
2050 ProjectionSSP1
SSP2
SSP3
Key
Source Own analysis based on Andrijevic et al 2020 35 ND-GAIN database (nd) 36
6
MITIGATION REDUCING EMISSIONS TO LIMIT GLOBAL TEMPERATURE INCREASE
Figure 9 Energy-related CO2 emissions and GDP variation (2019-2021)
REBOUNDING EMISSIONS SIGNAL A RETURN TO BUSINESS AS USUAL
Drastic cuts in CO2 emissions from the energy sector can be achieved by rapidly phasing out fossil fuels and stimulating growth in renewable energy
PARISAGREEMENT
Hold the increase in the global average temperature to well below 2degC above pre-industrial levels and pursue efforts to limit to 15degC recognising that this would significantly reduce the risks and impacts of climate change
-20
-15
-10
-5
0
5
10
ZAFUKMEXBRAAUSITASAUJPNEUFRARUSGERARGG20KORCANCHNUSAINDIDNTUR
Year
-on-
year
chan
ge in
ene
rgy-
rela
te C
O 2 em
issio
ns (
)
2019 GDP variation
share of G20 (2020)
1 2 9 17 38 22 1 2 6 1 4 29 1 1 2 1 1 2
Trend (2020-2021) -03 -04 -04 -08 -08 -12+72 +64 +62 +52 +49 +47 +41 +33 +31 +29 +24 +2 +18 +13+5
2019 CO2 emissions (from fuel combustion) 2020 GDP variation2020 CO2 emissions
(from fuel combustion) 2021 GDP variation2021 CO2 emissions projections(from fuel combustion)
CO2
In 2030 global CO2 emissions need to be around 45
below 2010 levels and reach net zero by around 2050 Global energy-related CO2 emissions must be cut by 40 below 2010 levels by 2030 and reach net zero by 2060 The share of fossil fuels globally needs to fall to 67 of global total primary energy by 2030 and to 33 by 2050 and to substantially lower levels without carbon capture and storage37
TRANSFORMING THE ENERGY SECTOR IS KEY TO A LOW-CARBON ECONOMYCO2 emissions from the energy sector make up 78 of all GHG emissions (including land use change and forestry) with the highest proportion coming from the power sector followed by industry and transport38 Increased energy efficiency reduced demand (including lifestyle and consumption shifts) fuel switching and electrification ndash in tandem
with decarbonisation of the power sector ndash will be necessary in all major sectors for the energy sector to be 15degC compatible
BUT CO2 EMISSIONS ARE REBOUNDING TO PEAK LEVELSDue to the COVID-19 pandemic in 2020 energy-related CO2 emissions dipped across the G20 by 6 compared to 2019 levels which was stronger than the 5 decrease in GDP In 2021 CO2 emissions are projected to rebound by 4 across the G20 however this is less than the projected GDP increase of 7 (see Figure 9) Nearly half of this rebound is being driven by the power sector and a quarter by the transport sector In OECD G20 members the projected rebound in 2021 will not fully offset the decline in 2020 despite the USArsquos significant rebound of 5 For non-OECD G20 members 2019 emissions levels however are likely to be exceeded Argentina China India and Indonesia are projected to exceed their 2019 emissions levels which is significant given that their combined energy-related CO2 emissions accounted for almost half of G20 CO2 emissions in 202039
Source Enerdata 2021
RENEWABLES ACCELERATEThe G20 has however increased its average share of renewables (excluding large hydro) in its total primary energy supply (TPES) mix by 32 from 2015-2020 to the current value of 7 in 2020 (see Figure 10) From 2019-20 the G20rsquos share of renewables (including large hydro) increased from 9 to 10 and this trend is projected to continue rising to 12 in 202140 Despite the pandemic there has been significant growth among G20 members in solar and wind power with new records being set in terms of overall installed capacities For example in 2020 newly installed capacity of 108 GW of wind power almost doubled compared to 2019 installations of 56 GW This has been driven mainly by Australia Brazil China the EU and the USA Solar photovoltaics (PV) have also shown strong growth in 2020 with new installations in Brazil China the EU and the USA totalling 85 GW41 The outlook for renewables is also good with both solar PV and wind power projected to continue growing during 2021 as projects restart As a result between 2015 -2020 the carbon intensity of the energy sector has decreased overall by 4 across the G2042
Due to rounding some graphs may sum to slightly above or below 100
7CLIMATE TRANSPARENCY REPORT | 2021
KEY ACTION FOR G20 MEMBERS
Figure 10 Total Primary Energy Supply (TPES) mix (level 2020 percentage change 2015-2020)
This graph shows the fuel mix for total primary energy supply including energy used not only for electricity generation heating and cooking but also for industrial and transport fuels
Renewables include wind solar hydro geothermal and biomass (excl residential biomass use)
BUT COAL IS GOING UP AGAIN The average share of fossil fuels in the G20rsquos TPES was 808 in 2020 but is projected to increase slightly to 812 in 2021 as demand for coal oil and gas returns to ldquonormalrdquo From 2015-2020 the share of fossil fuels in TPES decreased from 829 to 808 driven by a reduction in the G20rsquos total coal consumption of 8 due to reduced energy demand and the implementation of coal phase-out policies in the UK (-78 ) Italy (-63 ) Germany (-45 ) the EU (-42 ) and Canada (-28) However coal consumption is projected to
Just Transitions recent developmentsA Just Transition48 is an important part of the transition to a low-carbon economy
Canada The Canadian Coal Transition Initiative helps communities and workers affected by Canadarsquos move to a low-carbon economy in Alberta Saskatchewan and Atlantic Canada In 2021 Canada also launched discussions on proposed just transition legislation49
EU As part of the European Green Deal a Just Transition Mechanism (JTM) has been proposed to ensure that the transition to a climate-neutral economy takes place in a fair way It provides targeted support to help mobilise at least EUR 65-75bn over the period 2021-2027 in the most affected regions to alleviate the socio-economic impact of the transition50
South Korea The 2050 Carbon Neutral Strategy lays the framework for both a phase-out of coal-fired power plants and a just transition for persons who are economically dependent on the countryrsquos fossil fuel industries This includes retraining workers from these industries to prepare them for opportunities in new low-carbon industries Furthermore the Strategy calls for mobilising financial resources for climate-vulnerable communities52
South Africa A Presidential Commission has committed funds and resources to diversifying coal-dependent economies and introducing a range of reskilling social protection and job creation incentives across new green sectors Part of this initiative is to enable social dialogue and build support to establish more tangible measures around a just transition51
G20 members need to prioritise investment in renewable energy ndash also to avoid stranded fossil fuel assets ndash and accelerate coal phase-outs across the G20
rise by almost 5 in 2021 with much of this growth concentrated in China (61) the USA (18) and India (17)43 Globally China remains the highest producer and consumer of coal responsible for half of all coal44
AND GAS IS A BRIDGE TO NOWHEREBetween 2015-2020 the G20rsquos average natural gas consumption increased by 12 and is projected to remain at similar levels in 2021 OECD and non-OECD G20 members have both played a role in this increase at
19 and 8 respectively China (+69) South Korea (+19) India (+17) Canada (+16) Germany (+14) the USA (+12) and the EU (+11) are driving the increase as countries that are pursuing coal phase-out policies simply switch from coal to natural gas45 This is a risky move though with a high likelihood of stranded gas assets as the transition to a low-carbon economy accelerates46 The USA is currently the highest producer and consumer of global gas and oil being responsible for more than 2047
Source Enerdata 2021
Ener
gy m
ix (
)
Coal and Lignite Oil Natural gas Nuclear Renewables Other
Chan
ge in
shar
e of
rene
wab
le e
nerg
y in
TPES
(201
5-20
20)
OECD
Non-
OECD
0
20
40
60
80
100
FRABRAEUINDIDNCANUKKORGERITAUSAG20TURMEXJPNARGCHIRUSZAFAUSSAU-50
0
50
100
150
200
(546) 177
114
6157
34 322921 19
13
83
5242
3631 2821 18
10-09
8CLIMATE TRANSPARENCY REPORT | 2021
TRANSFORMATIVE POLICIES URGENTLY NEEDED IN KEY SECTORS TO CURB RISING EMISSIONS
Transformative and innovative policies and action in all sectors can accelerate the transition to a low-carbon future
Figure 12 Current coal power capacities of G20 members (as of July 2021)
OperatingIn construction Cancelled 2010-2021Retired 2000-2021Announced + Pre-permit + Permitted
Coal
pow
er p
lant
capa
citie
s (M
W)
CHN IND USAARGAUS BRACAN FRAGERIDN ITAJPN KOR MEXRUS TUR UKZAF-1500
-1000
-500
0
500
1000
1500
-100
-60
-20
20
60
100
Annual growth rate
in 2020
in 2019
2009-2018
G20 energy-related CO2 emissions ndash power sector (2020)
-53-19+13
power
381
DEEP AND FAST EMISSIONS CUTS REQUIRED ACROSS ALL SECTORSThe power generation industry and transport sectors produce the majority of GHG emissions in the G20 (see Figure 11)53 The transformation of all sectors is pivotal to achieving net zero CO2 emissions by around 2050 as well as decreases in all GHG emissions rapidly thereafter including actions to maintain and expand critical global carbon sinks such as forests
773 Waste
10 Agriculture
10 Industry2018
37944MtCO2e
29 Power
18 Industry
16 Transport
7 Building
6 Other energy-related
1 Agriculture
Energy
Figure 11 G20 GHG emissions by sector (2018)
Source Enerdata 2021
(38) natural gas (20) and oil (2) whilst the rest is from renewables including large hydro (28) and nuclear (11) In 2020 CO2 emissions in the power sector decreased by 5 due to reduced electricity demand during the COVID-19 pandemic However in 2021 emissions from the power sector are projected to rebound by 5 compared to 2020 due to increased demand56
Reducing the emissions intensity of electricity generation is a key mitigation strategy especially as global power demand is expected to at least double by 2050 compared to 201857 G20 emissions intensity has been decreasing from 2015-2020 However Australia China India Indonesia Saudi Arabia and South Africa registered above G20 average emissions intensity levels in 202058
POWER Coal phase-out urgent whilst renewables grow through the pandemic
Between 2030 and 2040 all the regions of the world need to phase
out coal-fired power generation By 2040 the share of renewable energy in electricity generation needs to be increased to at least 75 and the share of unabated coal reduced to zero54 55
Source Enerdata 2021
The power sector currently accounts for the highest share (at 38) of G20 energy-related CO2 emissions including heat from electricity production Fossil fuels are used for 60 of electricity needs including coal
Note Some G20 members have a very low to no coal power capacity (see Figure 10)
Source Global Energy Monitor 2021 59
China currently accounts for over half of the G20rsquos total coal capacity followed by India and the USA (see Figure 12) China also has the highest planned coal capacity (163 GW) followed by India (21 GW) Indonesia (18 GW) and Turkey (12 GW) G20 members have however started to take steps to phase out coal with France Italy and the UK all rated as
lsquofrontrunnersrsquo for coal phase-out policies with phase-out dates for coal by 2030 Despite these steps forward all G20 members will need to commit to phase out coal between 2030 and 2040 to meet the long-term temperature goal in the Paris Agreement60
From 2015-2020 the share of renewables in the G20rsquos power mix increased by 20 (see Figure 13) In 2020 renewables reached 286 of the G20rsquos power mix and this is projected to grow to 295 in 2021 This growth was partly due to decreased electricity demand in 202061 but also due to ongoing implementation of renewable energy policies and incentives as well as the falling cost of renewables62 Even though progress is being made this growth rate will need to accelerate significantly to reach 75 of the global power mix by 2040 Large and small hydro accounts for the highest proportion of the G20rsquos renewables (54) followed by wind (23) and solar (12)63 The EU Germany and the UK had the highest share of solar and wind power in 2020 but the UK alone is rated a lsquofrontrunnerrsquo as it has both short-term policies and long-term strategies for 100 renewables in place
9CLIMATE TRANSPARENCY REPORT | 2021
Figure 13 Share of renewables in power generation in 2020 and change in share of renewables incl large hydro (2015-2020)
Annual growth rate
in 2020
in 2019
2009-2018
G20 energy-related CO2 emissions ndashindustry sector (2020)
-12+00+12
sh
are
RE in
pow
er g
ener
atio
n
ch
ange
201
5-20
20
WindSolar GeothermalHydroBiomass amp waste
0
20
40
60
80
100
SAUKORZAFIDNUSARUSMEXINDARGAUSJPNFRAG20CHNEU27TURITAUKGERCANBRA0
40
80
120
160
200
163
117
7573 70
49 464340 39373130
24 2116
11 95 1
(523)
Industry
241
173Direct emissions
Indirect emissions
Note Saudi Arabia (523) South Korea (163) and South Africa (117) have had the highest increases over the last five years but renewables in their overall energy mix remain at 02 72 and 76 respectively
Annual growth rate
in 2020
in 2019
2009-2018
G20 energy-related CO2 emissions ndash transport sector (2020)
-146+10+17
transport
19Direct emissions
TRANSPORT More electric vehicles and modal shifting needed
The share of low-carbon fuels in the transport fuel mix globally
must increase to between 40 and 60 by 2040 and between 70 to 95 by 205064
Source Enerdata 2021
The transport sector is responsible for close to a fifth of the G20rsquos energy-related CO2 emissions ndash driven mainly by consumption of oil ndash with road travel accounting for two-thirds of these emissions mainly from passenger vehicles65 From 2009-2018 emissions increased by 17 per year and by 1 in 2019 In 2020 there was a significant decline due to the pandemic but in 2021 emissions are projected to rebound to near pre-pandemic levels66 To decarbonise the transport sector G20 members will need to engage in mass electrification switching to low-carbon fuels and modal shifting Across the G20 the cur-rent average market share of electric vehicles (EVs) in new car sales remains low at 32 (excluding the EU) with Germany France and the UK having the highest shares of EVs
INDUSTRY Steel and cement key to reducing emissions
Source Enerdata 2021
Source Enerdata 2021
Industrial emissions need to be reduced by 65-90 from 2010
levels by 205068
CO2 emissions in the industrial sector result from direct emissions (conversion of energy) indirect emissions (electricity and co-generated heat) and process emissions (mainly from iron steel or cement) From 2009-2018 in the G20 CO2 emissions from industry have grown by 12 per year In Argentina Brazil Mexico Russia and Saudi Arabia from 2012-2017 there has been an increase in emissions intensity of industry in part due to a shift in heavy industry moving to emerging and developing countries along with differences in technological standards and regulations69 Although challenging to decarbonise the production of steel and cement accounts for nearly half (44) of global CO2 emissions from industry worldwide and is therefore pivotal to transforming the industrial sector70
BUILDINGS Energy efficiency and electrification using low-carbon electricity needed
By 2040 global emissions from buildings need to be reduced by
90 from 2015 levels and reach 95-100 below 2015 levels by 205071 72
The building sector is responsible for close to a quarter of G20 energy-related CO2 emissions Building emissions occur directly (for heating and cooking) and indirectly (for air conditioning and appliances) From 2005-2018 energy-related emissions from the building sector increased by 05 per year Emissions intensity of existing residential and commercial buildings has however been gradually falling across major emitting economies partly due to improved energy efficiency and higher levels of electrification using low-carbon electricity73
Annual growth rate
in 2020
in 2019
2005-2018
G20 energy-related CO2 emissions ndash building sector (2020)
-28+06+05
Buildings
79
155Direct emissions
Indirect emissions
Source Enerdata 2021
Figure 14 Summary of policy ratings across sectors Low HighMedium FrontrunnerPolicy rating
Renewa-ble Energy in the power sector
Coal phase-out in the power sector
Phase-out of fossil fuel cars
Phase-out of fossil fuel heavy duty vehicles
Modal shift in ground transport
Near zero energy new buildings
Renova-tion of existing buildings
Energy efficiency in Industry
Target for net zero deforesta-tion
ARGAUSBRACANCHNEUFRAGERINDIDNITAJPNMEXRUSSAUZAFKORTURUKUSA
na
Source Climate Analytics 2021 67
10CLIMATE TRANSPARENCY REPORT | 2021
KEY ACTIONS FOR G20 MEMBERS
Forests can be a source of emissions when cut down or a carbon sink when more trees that take into account local ecosystems are either added to the landscape or protected The G20 has lost a total of 37 Mha per year of forest area between 2015-2020 (excluding Australia France Japan Saudi Arabia the UK and the USA for which data is unavailable) Afforestation activities have also increased between 2015 and 2020 leading to a net gain of +01 Mha per year to the G20rsquos total forest area Nonetheless from 2015-2020 Argentina Brazil Canada Indonesia Mexico and South Africa all registered net losses of forest area with Brazil and Indonesia driving global deforestation with massive losses of 15 Mha and 06 Mha per year respectively diminishing critical global carbon sinks In Brazil and Indonesia not only demand for land for food production but also the removal of environmental protections and regulations has contributed to increased deforestation Of note Australia is the only advanced G20 economy on a list of 24 global deforestation hotspots77 with an average forest loss of 04 Mha per year between 2010-201578
AGRICULTURELivestock driving increase in agricultural emissions
Methane emissions (mainly enteric fermentation) need to decline by
10 by 2030 and by 35 by 2050 (from 2010 levels) Nitrous oxide emissions (mainly from fertilisers and manure) need to be reduced by 10 by 2030 and by 20 by 2050 (from 2010 levels)79
Power Further stimulate and scale up growth in renewables whilst committing to a rapid phase-out of fossil fuels
Transport Introduce policies and measures aimed at fuel switching to low-carbon fuels mass electrification and modal shifting Sales of internal combustion engine (ICEs) vehicles should be banned by 2035 to limit temperatures to 15degC83
Industry Increase energy and material efficiency (fuel switching to low-carbon sources such as electrification green hydrogen) increase material recycling reduce demand and decarbonise production
Buildings Encourage retrofitting and electrifying existing buildings to reduce energy demand Require all new buildings to meet high energy-efficiency standards and be equipped with heating and cooling technologies that either are or can be zero emissions
Land use Implement net zero deforestation targets and policies protected area networks deforestation-free supply chains and forest-friendly infrastructure
Agriculture Improve productivity to feed a growing population shift high-meat diets towards plants slow the growth of food and agricultural land demand by reducing food loss and waste 28
Manure
43Entericfermentation (digestive processes of cattle)
20Syntheticfertilisers
7Burning of savanna2
Crop residues
2907MtCO2e
Figure 15 G20 GHG emissions from agriculture excl energy (2018)
Global deforestation needs to be halted and changed to net
zero CO2 removals by around 203076
On average building emissions per capita across the G20 are 14 tCO2capita a decrease of 29 between 2015-2020 but this is not a fast enough decrease74 In particular the USA (49 tCO2capita) and Australia (41 tCO2capita) have the highest building emissions per capita in the G20 reflecting the high share of fossil fuels especially natural gas and oil used for heat generation75
LAND USELoss of forest areas adding to the climate crisis
Emissions from agriculture accounted for 10 of the G20rsquos total GHG emissions in 2018 and 18 of the G20rsquos energy-related CO2 emissions The bulk of agricultural emissions
arise from methane and nitrous oxide with the main drivers being enteric fermentation (43) livestock manure (28) and synthetic fertilisers (20) (see Figure 15)81
Very high High Medium Low Very lowCurrent decarbonisation rating
Figure 16 Summary of 5-year trends and current decarbornisation ratings
Aviation emissions per capita 2013-2018 (tCO2capita change)
Building sector emissions per capita 2015-2020 (tCO2capita change)
Emissions intensity of industry 2012-2017 (kgCO2eUS$2015 GVA change)
Transport emissions per capita (exl aviation) 2015-2020 (tCO2capita change)
Growth in share of renewables in power generation (incl large hydro) 2015-2020 ( change)
1 5 9 11 16 21 24 26 31 37 39 40 43 46 49 70 73 75 117 163 523
ARG CAN ITA BRA CHN RUS G20 EU MEX TUR USA FRA JPN IND GER AUS UK IDN ZAF KOR SAU
Emissions intensity of the power sector 2015-2020 (gCP2kWh change)
-45 -42 -39 -31 -27 -23 -22 -22 -19 -15 -13 -13 -13 -13 -11 -11 -9 -8 -6 -3 -1
UK GER BRA CAN EU SAU USA ITA ARG FRA TUR KOR JPN AUS G20 CHN IND MEX RUS ZAF IDN
-18 -18 -15 -13 -12 -11 -11 -9 -8 -7 -5 -4 -3 -3 -2 0 0 1 25 23 22
UK ARG ITA SAU BRA ZAF JPN USA CAN MEX AUS G20 FRA EU TUR KOR RUS GER IND CHN IDN
-11 -8 4 7 8 11 13 16 17 17 21 23 24 25 29 32 35 45 45 54 102
BRA RUS FRA UK JPN AUS ARG CAN USA GER G20 EU ITA ZAF KOR IDN MEX SAU IND CHN TUR
-40 -27 -25 -24 -23 -23 -17 -17 -16 -15 -12 -12 -10 -4 -3 -1 0 3 19 29 38
SAU GER UK BRA EU ARG USA FRA AUS ITA MEX JPN CAN KOR G20 ZAF TUR IND RUS CHN IDN
-41 -30 -24 -19 -18 -17 -16 -16 -15 -13 -13 -12 -11 -11 -8 -8 0 0 1 8 24
UK CHN JPN USA IND AUS ITA G20 GER ZAF EU KOR TUR CAN IDN FRA MEX BRA RUS SAU ARG
Source Enerdata 2021 82
Current year is 2020 except for Aviation emissions per capita (2018) and Emissions intensity of industry (2017)
Source FAO 2021 80
11CLIMATE TRANSPARENCY REPORT | 2021
FINANCE MAKING FINANCE FLOWS CONSISTENT WITH CLIMATE GOALS
FINANCIAL REGULATIONS IMPROVING BUT PUBLIC FOSSIL FUEL FINANCE CONTINUES Financial actors from central banks to export credit agencies are finally integrating climate into their operations But continued public support for coal oil and gas must end immediately to have a chance of reaching climate targets
PARISAGREEMENT
Make finance flows consistent with a pathway towards low-GHG emissions and climate-resilient development
International public finance for coal must end immediately in all
G20 members to halt the development of coal power Investment in green energy and infrastructure needs to outweigh fossil fuel investments by 2025
Making all finance flows align with a low-carbon climate-compatible pathway is one of the key objectives of the Paris Agreement84 Due to the relative size of their economies and emissions G20 governments have a key role to play in showing leadership on this agenda by putting in place the right price signals and channelling all public finance away from high-carbon activities and assets towards clean climate-compatible ones and incentivising private finance flows to follow suit
FINANCIAL POLICIES AND REGULATIONSProgress on financial policies and regulations is moving at different speeds across the G2085 Some G20 members have continued taking steps to align their financial systems with sustainable development and address financial risks related to climate change There has been momentum on greening the financial sector at the international level
for example through the G20 sustainable finance working group and the Financial Stability Boardrsquos (FSB) climate risk roadmap86 However more concerted efforts are needed such as the standardisation of green finance practices promotion of disclosure standards for carbon and environmental risks and implementation of national sustainable finance roadmaps to transform the financial sector into a sustainable one
Significant regulatory and policy developments were seen in France Canada Japan the USA South Korea the UK and the EU (see Figure 17)
Some encouraging progress has also been seen in Australia China Germany India and Mexico where the central banks and financial regulatory authorities have stepped up to manage climate-related risks and opportunities within their financial sector through issuing relevant guidance and strategies or joining international networks that coordinate action in this area95 96 97 98 99
While most other G20 members have acknowledged the effects of climate change on their financial sector progress has been slow on green finance initiatives No major policy or regulatory level green finance commitments were identified in Russia Saudi Arabia or Turkey (aside from limited evidence
Figure 17 Regulatory and policy developments in G20 members to align financial systems with climate action
Note This figure illustrates examples of some key actions in G20 members but is not exhaustive of all recent developments in this areaSource Authorsrsquo own based on various sources
on efforts to stimulate green bonds or establish an ESG framework)100 101 102
FISCAL POLICIESAppropriate taxation and pricing instruments constitute incentives to align finance flows and investment with a climate-compatible future Removing budgetary support and tax exemptions for fossil fuels and putting in place effective carbon pricing schemes are key steps to this end alongside complementary fiscal policies supporting adaptation and a just transition
Fossil fuel subsidies remain very highThe continued provision of subsidies for the production and consumption of fossil fuels by G20 governments hinder the low-carbon transition by creating perverse incentives for their extraction and use thereby prolonging the life of fossil fuel assets
In 2009 G20 members committed to ldquorationalise and phase out over the medium-term inefficient fossil fuel subsidies that encourage wasteful consumptionrdquo103 However progress has been limited In 2019 alone G20 members excluding Saudi Arabia104 provided at least USD 152bn in subsidies for the production and consumption of coal oil and gas (see Figure 18)105
France
Responsible Investments Policy91 (Central Bank of France) 2021
Definitive exit from coal by 2024
South Korea
Official support for TCFD guidelines 202192
USA
Bill on climate risk disclosure 2021
Executive order to incorporate physical and transition climate risk in financial regulations 202189 90
UK
Task Force on Climate-related Financial Disclosures (TCFD) recommended report regulations 202187
Canada
Canadian Net-Zero Emissions Accountability Act 2021
Ministry of Finance to annually report on measures to address financial risks and climate change opportunities88
European Union
Climate change considerations in European Central Bank (ECB) monetary policy framework 2021
ECB climate change centre launched 202194
Japan
Regulatory guidelines on climate transition finance 202193
Bank of Japan to provide no-interest loans to financial institutions undertaking disclosure initiatives
12CLIMATE TRANSPARENCY REPORT | 2021
Five-year trends (2015-2019) for fossil fuel subsidies as a share of each countryrsquos GDP (which helps correct against currency and oil price fluctuations) show various extents of decrease in most G20 members most notably for Argentina106 China and Saudi Arabia (of between 57 and 70) but an increase in several others especially in Mexico Russia and France (in the order of 29-68) while remaining fairly stable in Canada and Turkey
Almost 40 of the total subsidies over the past years have been directed to petroleum
According to preliminary aggregate estimates107 government support for the production and consumption of fossil fuels in G20 economies excluding Saudi Arabia for which comparable data is not available decreased by 9 from 2019 This reduction was mostly due to COVID-19 impacts such as the fall in consumption of transport fuels brought about by mobility restrictions and a 10 decrease in support to the fossil fuel production sector driven by the drop in oil demand and the ensuing OPEC quotas of production in response108 However this decrease may well be offset by several examples of large sums of government support devoted to fossil fuel production in the form of sizeable bailouts to state oil and electricity companies once these are officially reported During 2020 G20 members pledged at least USD 252bn to fossil fuel energy as part of their energy-related funding commitments and COVID-19 economic response109
Most countries now have carbon pricing Pricing carbon effectively can encourage emitters across the entire economy to put in place efficiency measures and low-carbon transition plans Currently a total of 13 G20 members (as opposed to only 10 five years ago) have in place some form of explicit national carbon pricing scheme such as carbon taxes and emissions trading schemes (ETS) Brazil Indonesia Russia and Turkey are currently considering introducing such a scheme and some are currently trialling pilot schemes In 2020 explicit carbon pricing schemes generated total revenue of USD 47bn in the G20 with France and Japan recording the highest amounts of USD 93bn and USD 62bn respectively
Among the latest updates China launched its long-awaited national carbon ETS for the power sector (July 2021) the German government officially launched (January 2021) a national ldquocap-and-traderdquo system for the heating and road transport sectors (which are currently not covered by the EU ETS) and a UK ETS (as of January 2021) replaced the UKrsquos participation in the EU ETS following Brexit110 111 112
Figure 18 2019 G20 members fossil fuel subsidies (absolute values and per-unit of GDP shares) and 2015-2019 subsidy trends
Foss
il fue
l sub
sidie
s in
2019
(USD
bn)
Increased Decreased Remained steady
Five-year trends
Foss
il fue
l sub
sidie
s
of G
DP 2
019
(USD
bn)
0
5
10
15
20
USAJPNKORCHNGERCANINDTURIDNBRARUSFRAITAUKARGAUSZAFMEX00
02
04
06
08
climate aims (see Figure 19) France is the only G20 member whose carbon price is above the USD 40tCO2e threshold by 2020 recommended by the High-Level Commission on Carbon Prices A few G20 members (Canada Germany Italy South Korea the UK and the EU) have a carbon price that is defined as ldquolowrdquo (USD 11-39tCO2e)
Figure 19 Coverage and average price of explicit carbon pricing schemes in G20 members
Country Coverage Price (USD)
Argentina 20 95
Australia 0 na
Brazil 0 na
Canada 31 328
China 0 na
France 74 540
Germany 39 325
India 0 na
Indonesia 0 na
Italy 39 325
Japan 68 27
Mexico 46 33
Russia 0 na
Saudi Arabia 0 na
South Africa 80 95
South Korea 74 194
Turkey 0 na
UK 62 325
USA 0 na
EU 39 325
Coverage criteria based on that which was used in the BNEF Climate Policy Factbook
High gt66
Medium 33-66
Sufficient gtUSD 40
Low USD 11-39 Very low USD 1-10
Low lt33
None 0
Coverage
Price
while carbon prices in the rest of the G20 remain below the USD 10tCO2e threshold When emissions coverage is considered for national-level explicit carbon pricing schemes only schemes in France Japan South Africa and South Korea currently cover more than 66 of domestic emissions
Trends were assumed to have remained steady for increases or decreases within a +- 10 rangeNote Saudi Arabia is not included as comparable data is unavailable
Source OECD inventory of fossil fuel 2020113 For more information on the data see the Methodology note
Notes This table only includes national-level schemes and their prices It does not include sub-national schemes the inclusion of which would increase the overall level of coverage and pricing of carbon in a country For example according to the BNEF report Climate Policy Factbook in countries with significant sub-national schemes the overall coverage and prices can vary the levels and are as follows Canada 78 USD 31tCO2 China 43 USD 6tCO2 USA 8 USD 6tCO2114 For EU countries the table includes the EU ETS as well as any national scheme prices and it assumes that the EU ETS coverage is uniform across EU members and equal to the EU average coverage of 39 When a country has both its own national carbon pricing scheme and the EU ETS the one with the highest nominal price was chosen to determine the price in the table
Source Analysis based on data provided by I4CE 2021115 For more information see the Methodology note
However emissions coverage greatly varies and the price of carbon remains generally too low across the G20 to be in line with
13CLIMATE TRANSPARENCY REPORT | 2021
KEY ACTIONS FOR G20 MEMBERS
Finally the EU recently released a proposal for a new Carbon Border Adjustment Mechanism (CBAM) a climate measure that should prevent the risk of ldquocarbon leakagerdquo (the practice of moving carbon-intensive production abroad to avoid paying the price of carbon) In their July 2021 communiqueacute G20 Finance Ministers also mentioned the need for closer collaboration on carbon pricing mechanisms116
PUBLIC FINANCE FOR FOSSIL FUELSGovernments channel financing through public finance institutions including national and multi-lateral development banks and export credit agencies by providing direct funding and encouraging private investments by lowering the cost of and risk for capital Steering this financing away from high-carbon assets and towards appropriate adaptation and mitigation activities is crucial to aligning with the Paris Agreementrsquos goals
International public finance for fossil fuels continuesDuring 2018-19 G20 members provided USD 507bn per year of public finance for fossil fuels117 Over three-quarters of this financing was for oil and gas The highest providers of public finance were Japan (USD 103bnyr) China ( just over USD 8bnyr) and South Korea ( just under USD 8bnyr) (see Figure 20)
There has however been encouraging progress in terms of G20 members restricting public spending on fossil fuels through public finance institutions (PFIs) Multilateral development banks (MDBs) and nationally-owned development banks have made commitments in recent years to mainstream climate considerations in their operations and lending Most recently in May 2021 G7 nations made a commitment to end the use of public finance for new unabated international coal power plants118 South Korea also made a similar commitment119 In addition the US Treasury has announced a significant step away from international coal and gas projects through MDBs120 In September 2021 China also committed to end coal financing overseas121
However to support the phase-out of these fuels in line with climate goals such restrictions must be rapidly expanded to include oil and gas The UK government has shown leadership by announcing in December 2020 that it would no longer provide any fossil fuel finance internationally though with lack of clarity on natural gas projects122 This follows similar commitments by the EUrsquos PFIs The European Investment Bank (EIB) banned financing for all fossil fuels in 2019 but with exemptions for certain types of natural gas projects123 In July 2021 the European Bank for Reconstruction and Development (EBRD) committed to stop investing in upstream oil and gas projects by the end of 2022 to align its activities with the Paris Agreement124
International climate finance is still lackingAustralia Canada the EU France Germany Italy Japan the UK the USA are considered Annex II under the UNFCCC and are therefore obliged to provide climate finance to non-Annex II countries They reported an annual average international public support amount of USD 43bn between 2017-18 which only increased by 2 between 2018-19126 127
Japan is the largest contributor of climate finance among G20 members at over USD 12bn in 2017-18 which includes so-called lsquocleanrsquo coal as climate finance Flows are delivered predominantly through the Japanese Bank for International Cooperation (JICA) Germany and France follow at USD 84bn and USD 66bn respectively making use of KfW and the French Development Agency (AFD)
A number of non-Annex II countries of the G20 are voluntarily contributing climate finance (Brazil China India Indonesia Mexico Russia South Africa and South Korea) Russia has provided data on climate finance provision while other countries have pledged multilateral climate change funds
COP26 in 2021 marks the official start of negotiations towards the new climate finance goal The new goal will need to
exceed the target of USD 100bn a year from 2020 that developed countries committed to mobilise for developing countries from public and private sources At the G7 Summit in July 2021 Canada France Germany Italy Japan the UK and the USA reaffirmed their commitment to the USD 100bn through 2025128 And in September 2021 the European Commission committed an additional EUR 4bn (USD 5bn) by 2027 to support low-income and climate vulnerable countries129 Yet many estimates suggest they are still falling short of the target130 131 132 and countries are not doing their lsquofair-sharersquo133
With climate finance needs estimated to be far beyond USD 100bn a year it will be critical to develop trust between Global South and G7G20 members for this goal to be met Many Annex II G20 countries will need to show clear commitments to greater climate finance ambition than the current target and must use robust transparency and accountability mechanisms to ensure resources are effectively spent on quality projects In this respect the G7 commitment to end overseas development aid (ODA) for new coal is a key step in ensuring all finance flows are aligned with the Paris Agreement goal
Figure 20 G20 public finance for fossil fuels (USD millions per year 2018-19 average)
0
2000
4000
6000
8000
10000
12000
ZAFAUSARGTURFRAIDNMEXRUSBRAIND GERSAUUKITAUSACANKORCHNJPN
3OtherCoal
82
15
Oil and gas
Total50779
Initiatives integrating climate risk and reporting into their financial systems must move from voluntary to compulsory reporting and price and coverage of carbon pricing schemes must be increased
G20 members must eliminate continued subsidies as well as domestic and international public finance for fossil fuels
The nine G20 members who are required to provide climate finance to developing countries need to deliver the delayed USD 100bn and reaffirm their commitment for sufficient and high-quality financing that meets the needs of recipients
Coal coal extraction or coal-fired power generation Oil and gas oil and gas extraction processing or gas-fired electricity Other where support is provided for fossil fuels but the allocation between the types of fuel is unknown or it is provided to coal oil and gas activities (combined)
Source Oil Change International 2020125
14CLIMATE TRANSPARENCY REPORT | 2021
ENDNOTES1 Rogelj J et al (2018) ldquoMitigation Pathways Compatible
with 15degC in the Context of Sustainable Developmentrdquo in Masson-Delmotte V et al (eds) Global Warming of 15degC An IPCC Special Report on the Impacts of Global Warming of 15degC httpswwwipccchsiteassetsuploadssites2201905SR15_Chapter2_Low_Respdf
2 IPCC (2021) Climate Change 2021 The Physical Science Basis Contribution of Working Group I to the Sixth Assessment Report of the Intergovernmental Panel on Climate Change Eds Masson-Delmotte V et al httpswwwipccchreportar6wg1SPM
3 Climate Watch (nd) Historical GHG Emissions httpswwwclimatewatchdataorgghg-emissionsend_year=2018ampregions=G20ampsectors=total-including-lucfampstart_year=1990
4 UN (2015) Paris Agreement httpsunfcccintsitesdefaultfilesenglish_paris_agreementpdf
5 CAT (2021a) Global Update httpsclimateactiontrackerorgpublicationsglobal-update-september-2021
6 Climate Watch (nd) Historical GHG Emissions httpswwwclimatewatchdataorgghg-emissionsend_year=2018ampregions=G20ampsectors=total-including-lucfampstart_year=1990
7 CAT (2021a) Global Update8 Ibid9 Climate Analytics (2021) 15degC National Pathways Explorer
http1p5ndcpathwaysclimateanalyticsorg10 Climate Watch (nd) Net-Zero Tracker httpswww
climatewatchdataorgnet-zero-tracker11 Energy and Climate Intelligence Unit (nd) Net Zero Tracker
httpseciunetnetzerotracker12 CAT (2021b) CAT Climate Target Update Tracker13 Climate Analytics (2021) Closing the Gap https
climateanalyticsorglatestnew-report-finds-ambitious-action-by-g20-countries-alone-can-limit-warming-to-17c-keeping-15c-goal-within-reach
14 CAT (2021a) Global Update15 Climate Transparency (nd) NDC Transparency Check https
wwwclimate-transparencyorgndc-transparency-check16 World Health Organisation (2021) WHO Coronavirus (COVID-19)
Dashboard httpscovid19whoint [At the time of writing there were 4654548 deaths figure updated 30 September 2021]
17 OECD (2020) COVID-19 and the Aviation Industry Impact and Policy Responses httpswwwoecdorg
18 Based on data received directly from Enerdata (2021)19 UNEP (2021) Are We Building Back Better Evidence from 2020
and Pathways for Inclusive Green Recovery Spending httpswwwuneporg
20 Global Recovery Observatory (August 2021) How Are Countries Investing in Recovery UNDP httpsdataundporgcontentglobal-recovery-observatory
21 Ibid22 G20 (2009) G20 Leaders Statement The Pittsburgh
Summit G20 Research Group httpwwwg20utorontoca20092009communique0925html
23 IISD et al (2020) Doubling Back and Doubling Down G20 Scorecard on Fossil Fuel Funding httpswwwiisdorgsystemfiles2020-11g20-scorecard-reportpdf
24 Energy Policy Tracker (2021) G20 Countries httpswwwenergypolicytrackerorgregiong20
25 IEA (2021a) Sustainable Recovery Tracker httpswwwieaorgreportssustainable-recovery-tracker
26 Global Recovery Observatory (August 2021) How Are Countries Investing in Recovery
27 IPCC (2021) Climate Change 2021 The Physical Science Basis 28 World Weather Attribution (2021) Western North American
Extreme Heat Virtually Impossible Without Human-Caused Climate Change httpswwwworldweatherattributionorg
29 World Meteorological Organisation (2021) 2020 Was One of the Three Warmest Years On Record httpspublicwmoint
30 ND-GAIN (nd) Methodology httpsgainndeduour-workcountry-indexmethodology
31 Global Centre on Adaptation (2020) State and Trends Report 2020 httpsgcaorgwp-contentuploads202103GCA-State-and-Trends-Report-2020-Online-3pdf
32 Germanwatch (2020) Global Climate Risk Index 2020 httpsgermanwatchorgen17307
33 Arnell N W et al (2019) ldquoGlobal and Regional Impacts of Climate Change at Different Levels of Global Temperature Increaserdquo Climatic Change httpslinkspringercomarticle1010072Fs10584-019-02464-z
34 ND-GAIN (nd) Country Index httpsgainndeduour-workcountry-index
35 Andrijevic M et al (2020) ldquoGovernance in Socioeconomic Pathways and its Role for Future Adaptive Capacityrdquo Nature Sustainability httpsdoiorg101038s41893-019-0405-0
36 ND-GAIN (nd) Country Index37 Rogelj J et al (2018) ldquoMitigation Pathways Compatible with
15degC in the Context of Sustainable Developmentrdquo38 Based on data received directly from Enerdata (2021)39 Ibid40 Ibid
41 Enerdata (2021) Global Energy and CO2 Data httpswwwenerdatanetresearchenergy-market-data-co2-emissions-databasehtml
42 Based on data received directly from Enerdata (2021)43 Ibid44 US Energy Information Administration (nd) Data https
wwweiagovinternationaldataworld45 Based on data received directly from Enerdata (2021)46 IEEFA (2021) Stranded Asset Risks For Gas Investments
Climbing Quickly httpsieefaorgstranded-asset-risks-for-gas-investments-climbing-quickly
47 US Energy Information Administration (nd) Data httpswwweiagovinternationaldataworld
48 International Labour Organisation (2015) Guidelines For a Just Transition Towards Environmentally Sustainable Economies and Societies For All httpswwwiloorg
49 Government of Canada (2021) People-Centred Just Transition Discussion Paper httpswwwrncanengagenrcanca
50 European Commission (nd) The Just Transition Mechanism Making Sure No One is Left Behind httpseceuropaeu
51 Department of Forestry Fisheries and the Environment (2020) Cabinet Approves Climate Change Emissions Reduction and Waste Management Plans httpswwwenvironmentgovza
52 The Government of the Republic of Korea (2020) 2050 Carbon Neutral Strategy of the Republic of Korea UNFCCC httpsunfcccintsitesdefaultfilesresourceLTS1_RKoreapdf
53 Based on data received directly from Enerdata (2021)54 CAT (2020) Paris Agreement Compatible Sectoral Benchmarks
Study httpsclimateactiontrackerorgpublicationsparis-agreement-benchmarks
55 Rogelj J et al (2018) ldquoMitigation Pathways Compatible with 15degC in the Context of Sustainable Developmentrdquo
56 Based on data received directly from Enerdata (2021)57 IRENA (2018) Global Energy Transformation A Roadmap to
2050 httpswwwirenaorg-mediaFilesIRENAAgencyPublication2018AprIRENA_Report_GET_2018pdf
58 Based on data received directly from Enerdata (2021)59 Global Energy Monitor (2021) Global Coal Plant Tracker ndash
Dashboard httpsglobalenergymonitororgprojectsglobal-coal-plant-trackerdashboard
60 It should be noted that some countries have a very low to no coal power capacity For example please see the energy mix graph (energy chapter) for details on fossil fuels in Argentina Saudi Arabia has never used coal and is also not planning to build any coal plants but is 100 dependent on oil and gas plants
61 Enerdata (2021) Global Energy and CO2 Data62 IEA (2020a) Global Energy Review 2020 httpsieablobcore
windowsnetassets7e802f6a-0b30-4714-abb1-46f21a7a9530Global_Energy_Review_2020pdf
63 Based on data received directly from Enerdata (2021)64 Rogelj J et al (2018) ldquoMitigation Pathways Compatible with
15degC in the Context of Sustainable Developmentrdquo 65 Ritchie H (2019) Who Has Contributed Most to Global CO2
Emissions Our World In Data httpsourworldindataorgcontributed-most-global-co2 Note aviation accounts for 116 and shipping accounts for 106 of transport emissions Long-distance road freight (large trucks) aviation and shipping are particularly difficult to eliminate
66 Based on data received directly from Enerdata (2021)67 Climate Transparency (2021) Country Profiles httpswww
climate-transparencyorg68 Rogelj J et al (2018) ldquoMitigation Pathways Compatible with
15degC in the Context of Sustainable Developmentrdquo69 Baumert KA (2005) Navigating the Numbers Greenhouse
Gas Data and International Climate Policy World Resources Institute httpswwwwriorgresearchnavigating-numbers
70 IPCC (2014) ldquoIndustryrdquo in Climate Change 2014 Mitigation of Climate Change Contribution of Working Group III to the Fifth Assessment Report of the Intergovernmental Panel on Climate Change Eds Edenhofer O et al httpswwwipccch
71 CAT (2020) Paris Agreement Compatible Sectoral Benchmarks Study
72 Rogelj J et al (2018) ldquoMitigation Pathways Compatible with 15degC in the Context of Sustainable Developmentrdquo
73 IEA (2020b) Energy Efficiency 2020 httpswwwieaorgreportsenergy-efficiency-2020
74 Based on data received directly from Enerdata (2021)75 IEA (2020c) Heating httpswwwieaorgreportsheating76 Rogelj J et al (2018) ldquoMitigation Pathways Compatible with
15degC in the Context of Sustainable Developmentrdquo77 WWF (2021) Australia Remains the Only Developed Nation on
the List of Global Deforestation Fronts httpswwwwwforgau78 Global Forest Resources Assessment (2020) Annual Forest
Expansion Deforestation and Net Change Indicator Food and Agriculture Organisation httpsfra-datafaoorgWOfra2020forestAreaChange
79 Rogelj J et al (2018) ldquoMitigation Pathways Compatible with 15degC in the Context of Sustainable Developmentrdquo
80 Food and Agriculture Organisation (FAO) (2021) Emissions Totals Agriculture httpwwwfaoorgfaostatendataGT
81 Ibid 82 Based on data received directly from Enerdata (2021)
83 IEA (2021b) Net Zero by 2050 A Roadmap for the Global Energy Sector httpswwwieaorgreportsnet-zero-by-2050
84 UN (2015) Paris Agreement85 European Think Tanks Group (2021) G20 Ministerial Meetings
High Time for Development and Finance Ministers to Work Hand in Hand For a Sustainable Global Recovery httpsettgeu
86 Financial Stability Board (2021) FSB Roadmap for Addressing Climate-related Financial Risks httpswwwfsborg202107fsb-roadmap-for-addressing-climate-related-financial-risks
87 UK Government (2021) Governance and Reporting of Climate Change Risk Guidance For Trustees of Occupational Schemes httpswwwgovuk
88 Parliament of Canada (2021) BILL C-12 An Act Respecting Transparency and Accountability in Canadarsquos Efforts to Achieve Net-Zero Greenhouse Gas Emissions by the Year 2050 httpslaws-loisjusticegccaengactsC-193FullTexthtml
89 US House Committee on Financial Services (2021) To Amend the Securities Exchange Act of 1934 to Require Certain Disclosures Relating to Climate Change and For Other Purposes httpsfinancialserviceshousegovuploadedfiles0225_bills-1173ihpdf
90 The White House (2021) Executive Order on Climate-Related Financial Risk httpswwwwhitehousegov
91 Banque de France (2021) Responsible Investment Policy Reinforcing Exclusions With Regard to Fossil Fuels httpswwwbanque-francefr
92 Financial Services Commission (2021) Financial Authorities and Relevant Institutions Declare Support for TCFD and Its Recommendations httpswwwfscgokr
93 Financial Services Agency (2021) Basic Guidelines on Climate Transition Finance httpswwwfsagojpnewsr2singi20210507_204pdf
94 European Central Bank (2021b) ECB Presents Action Plan to Include Climate Change Considerations in Its Monetary Policy Strategy httpswwwecbeuropaeupressprdate2021htmlecbpr210708_1~f104919225enhtml
95 Australian Prudential Regulation Authority (2021) APRA Releases Guidance on Managing The Financial Risks of Climate Change httpswwwapragovau
96 Peoplersquos Bank of China (2020) ldquoSupporting Low-Carbon Development With Green Financerdquo Video speech at the Singapore FinTech Festival (SFF) 2020 httpwwwpbcgovcnen3688110368817240482694141587indexhtml
97 Green Finance Platform (2019) The Sustainable Finance Committee of the Federal Government httpswwwgreenfinanceplatformorg
98 Reserve Bank of India (2021) Financial Stability Report httpswwwrbiorginScriptsPublicationReportDetailsaspxUrlPage=ampID=1174
99 The Biodiversity Finance Initiative (2021) Mexico Starts Dialogue with Central Bank About Greening the Finance Sector httpswwwbiofinorgnews-and-mediamexico-starts-dialogue-central-bank-about-greening-finance-sector
100 Bank of Russia (2020) Information Letter on Recommendations for the Implementation of the Principles of Responsible Investment httpswwwcbrrucontentdocumentfile112325in-06-28_111_epdf
101 Reuters (2021) Saudi Sovereign Wealth Fund Scopes Banks for ESG framework httpswwwreuterscom
102 Turkey Investment Office (2021) New Economic Reform Package Heralded by President Erdoğan httpswwwinvestgovtr
103 G20 (2009) G20 Leadersrsquo Statement The Pittsburgh Summit 104 IEA (2020d) Energy Subsidies Database httpswwwiea
orgtopicsenergy-subsidies For more information on the data see the Methodology note at wwwclimate-transparencyorgg20-climate-performanceg20report2021
105 OECD-IEA (2020) Fossil Fuel Support Database 2020 update httpswwwoecdorgfossil-fuelscountrydata and httpswwwieaorgdata-and-statisticschartsvalue-of-fossil-fuel-consumption-subsidies-2010-2020 For more information on the data see the Methodology note at at wwwclimate-transparencyorgg20-climate-performanceg20report2021
106 Note the interpretation of some of the five-year trends requires some caution For example in the case of Argentina the observed trend can be partly explained by a substantial increase in the national budget due to the countryrsquos currency devaluation For more information see Fundacioacuten Ambiente y Recursos Naturales (FARN) (2020) Fossil Fuel Subsidies Is Every Little Thing ldquoGonna Be Alrightrdquo httpsfarnorgarwp-contentuploads202008DOC_SUBSIDIOS_2019-2020_FINAL_INGLES_linkspdf
107 OECD (2021 15 July) Update on Recent Progress in Reform of Inefficient Fossil-Fuel Subsidies That Encourage Wasteful Consumption 2021 httpswwwoecdorg
108 Ibid109 Energy Policy Tracker (2021) Track Public Money for Energy in
Recovery Packages httpswwwenergypolicytrackerorg110 Reuters (2021) Chinarsquos Carbon Trading Scheme Makes Debut
with 41 Million Tonnes in Turnover httpswwwreuterscom111 Schulz F translated by S Lawton (2020) ldquoGerman Cabinet
Agrees CO2 Price of euro25 from January 2021rdquo Euractiv httpswwweuractivde
112 UK Government (2021) Participating in the UK Emissions Trading Scheme (UK ETS) httpswwwgovuk
15CLIMATE TRANSPARENCY REPORT | 2021
This Highlights Report is part of the Climate Transparency Report 2021 Find the G20 country profiles at wwwclimate-transparencyorg
Climate Transparency is a global partnership with a shared mission to stimulate a ldquorace to the toprdquo in climate action in G20 countries through enhanced transparency
ACKNOWLEDGMENTS
PARTNERS DATA PARTNERS
FUNDERS
ClimateActionTracker
Supported by
based on a decision of the German Bundestag
113 OECD-IEA (2020) Fossil Fuel Support Database 2020 update For more information on the data see the Methodology note at wwwclimate-transparencyorgg20-climate-performanceg20report2021
114 BNEF (2021) Climate Policy Factbook httpswwwunorg115 Institute for Climate Economics (I4CE) (2021) Global Carbon
Accounts 2021 Paris France httpswwwi4ceorgdownloadglobal-carbon-account-in-2021 For more information see the Methodology Note at wwwclimate-transparencyorgg20-climate-performanceg20report2021
116 G20 (2021) Italian G20 Presidency Third Finance Ministers and Central Bank Governors Meeting Communique 9-10 July 2021 httpswwwg20orgwp-contentuploads202107Communique-Third-G20-FMCBG-meeting-9-10-July-2021pdf
117 Oil Change International (2020) Still Digging G20 Governments Continue to Finance the Climate Crisis httppriceofoilorg20200527g20-still-digging
118 Climate Home News (2021) G7 Commits to End Unabated Coal Finance in 2021 To lsquoKeep 15C Within Reachrsquo httpswwwclimatechangenewscom20210521g7-commits-end-unabated-coal-finance-2021-keep-1-5c-within-reach
119 Reuters (2021) South Korearsquos Moon Vows to End New Funding for Overseas Coal Projects httpswwwreuterscomarticleglobal-climate-summit-southkorea-idUSL4N2MF3R2
120 US Treasury (2021) Treasury Announces Fossil Fuel Energy Guidance for Multilateral Development Banks httpshometreasurygovnewspress-releasesjy0323
121 Ministry of Foreign Affairs of the Peoplersquos Republic of China (2021) Xi Jinping Attends the General Debate of the 76th UN General Assembly and Delivers an Important Speech httpswwwfmprcgovcnmfa_engzxxx_662805t1909172shtml
122 UK Government (2020) PM Announces the UK Will End Support for Fossil Fuel Sector Overseas httpswwwgovuk
123 European Investment Bank (EIB) (2019) EU Bank Launches Ambitious New Climate Strategy and Energy Lending Policy httpswwweiborgenpressall2019-313-eu-bank-launches-ambitious-new-climate-strategy-and-energy-lending-policy
124 European Bank for Reconstruction and Development (EBRD) (2021) EBRD Announces Full Paris Alignment by End-2022 httpswwwebrdcomnews2021ebrd-announces-full-paris-alignment-by-end2022-html
125 Oil Change International (2020) Still Digging G20 Governments Continue to Finance the Climate Crisis For more information see the Methodology note at wwwclimate-transparencyorgg20-climate-performanceg20report2021
126 The public support reported through membersrsquo biennial reports to the UNFCCC include bilateral and regional climate finance finance channelled through the multilateral climate change funds and support to multilateral and bilateral institutions that parties cannot specify as climate-specific (eg MDBs UN bodies) UNFCCC (2020) Country Biennial Report Submissions to the UNFCCC Fourth Biennial Reports httpsunfcccintBRs The USA did not provide a BR4 therefore the
provisional data provided to the UNFCCC in 2018 (thus for the 2015-16 period) is used as an estimate
127 OECD (2021) Climate Finance Provided and Mobilised by Developed Countries Aggregate Trends Updated with 2019 Data httpswwwoecdorgenvironmentclimate-finance-provided-and-mobilised-by-developed-countries-aggregate-trends-updated-with-2019-data-03590fb7-enhtm
128 G7 (2021) Carbis Bay G7 Summit Communique httpswwwg7ukorgwp-contentuploads202106Carbis-Bay-G7-Summit-Communique-PDF-430KB-25-pages-5pdf
129 Farnad C (2021) ldquoEU Commits euro4 Billion More to Climate Vulnerables Calls on the US to Step Uprdquo Climate Change News httpswwwclimatechangenewscom20210915eu-commits-e4-billion-climate-vulnerables-calls-us-step
130 Oxfam (2020) Climate Finance Shadow Report 2020 Assessing Progress Towards the $100 Billion Commitment 2020 httpswwwoxfamorgenresearchclimate-finance-shadow-report-2020
131 Bhattacharya A Calland R Averchenkova A Gonzalez L Martinez-diaz L and J Van Rooij (2020) Delivering on the $100 Billion Climate Finance Commitment and Transforming Climate Finance httpswwwunorgsitesun2unorgfiles100_billion_climate_finance_reportpdf
132 OECD-IEA (2020) Fossil Fuel Support Database 2020 update 133 Colenbrander S Cao Y Pettinotti L and A Quevedo (2021)
A Fair Share of Climate Finance Apportioning Responsibility for the $100 Billion Climate Finance Goal httpsodiorg
Highlights Report Leads Gahee Han amp Justine Holmes (Solutions For Our Climate (SFOC))
Country Profiles Lead Kim Coetzee (Climate Analytics)
Finance Lead Ipek Genccedilsuuml (ODI)
Contributing authors expert comments and inputs Aleksandra Kotur Florian Mersmann Gerd Leipold Pia Gleich (Humboldt-Viadrina Governance Platform) Andrezj Ancygier Anna Chapman Carley Reynolds Chelsea Jones Claire Fyson Claire Stockwell Deborah Ramalope Jae Kim Marie-Camille Attard Nandani Das Ryan Wilson Sharna Nolan Victor Maxwell Yann Robiou du Pont Data Team Andreas Geiges (Lead) Himalaya Bir Shrestha Sylvia Schmidt (Climate Analytics) Angela Picciariello Charlene Watson Nandini Sharma (ODI) Abhishek Kaushik Sachi Vohra (The Energy and Resources Institute) Analuz Presbiacutetero Mariana Gutieacuterrez Grados Jorge Villarreal (Iniciativa Climatica de Mexico) Andrew Marquard Bryce McCall (Energy Systems Research Group University of Cape Town) Ayse Sari (SHURA) Bert Metz (European Climate Foundation) Benoicirct Prunel Jeacutereacutemy Bonnefous Pascal Charriau (Enerdata) Caroline Lee (Canadian Institute for Climate Choices) Dorka Bauer (GSCC) David Eckstein Jan Burck (Germanwatch) Enrique Maurtua Konstantinidis Jazmiacuten Rocco Predassi (Fundacion Ambiente y Recursos Naturales) Fabby Tumiwa Lisa Wijayani (Institute for Essential Service Reform) Jiang Kejun (Beijing University of Technology) Georgia McDonnell Joojin Kim Jeehye Park Jessica Yun Kyungrak Kwon Sejong Youn Soojin Kim Sunwoo Lee (Solutions For Our Climate (SFOC)) Keisuke Iyadomi Rachel Chi Kiu Mok Sandhya Srinivasan (World Bank) Kentaro Tamura (Institute for Global Environmental Strategies) Lola Vallejo (Institute for Sustainable Development and International Relations) Simon Maxwell Surabi Menon (ClimateWorks Foundation) William Wills (Centro Clima Federal University of Rio de Janeiro)
Design Design for development (wwwd4dcoza) Editor Chapel Lane Editing Services Tanya Goodman
16CLIMATE TRANSPARENCY REPORT | 2021
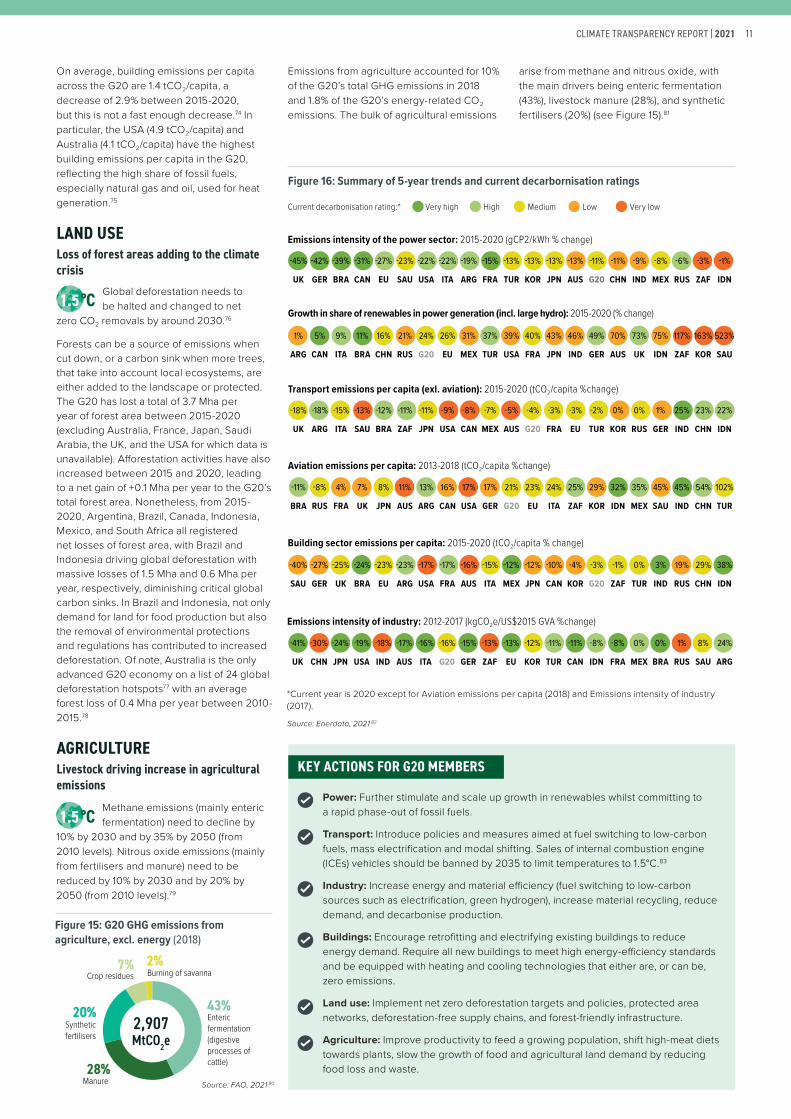
KEY ACTIONS FOR G20 MEMBERS
Forests can be a source of emissions when cut down or a carbon sink when more trees that take into account local ecosystems are either added to the landscape or protected The G20 has lost a total of 37 Mha per year of forest area between 2015-2020 (excluding Australia France Japan Saudi Arabia the UK and the USA for which data is unavailable) Afforestation activities have also increased between 2015 and 2020 leading to a net gain of +01 Mha per year to the G20rsquos total forest area Nonetheless from 2015-2020 Argentina Brazil Canada Indonesia Mexico and South Africa all registered net losses of forest area with Brazil and Indonesia driving global deforestation with massive losses of 15 Mha and 06 Mha per year respectively diminishing critical global carbon sinks In Brazil and Indonesia not only demand for land for food production but also the removal of environmental protections and regulations has contributed to increased deforestation Of note Australia is the only advanced G20 economy on a list of 24 global deforestation hotspots77 with an average forest loss of 04 Mha per year between 2010-201578
AGRICULTURELivestock driving increase in agricultural emissions
Methane emissions (mainly enteric fermentation) need to decline by
10 by 2030 and by 35 by 2050 (from 2010 levels) Nitrous oxide emissions (mainly from fertilisers and manure) need to be reduced by 10 by 2030 and by 20 by 2050 (from 2010 levels)79
Power Further stimulate and scale up growth in renewables whilst committing to a rapid phase-out of fossil fuels
Transport Introduce policies and measures aimed at fuel switching to low-carbon fuels mass electrification and modal shifting Sales of internal combustion engine (ICEs) vehicles should be banned by 2035 to limit temperatures to 15degC83
Industry Increase energy and material efficiency (fuel switching to low-carbon sources such as electrification green hydrogen) increase material recycling reduce demand and decarbonise production
Buildings Encourage retrofitting and electrifying existing buildings to reduce energy demand Require all new buildings to meet high energy-efficiency standards and be equipped with heating and cooling technologies that either are or can be zero emissions
Land use Implement net zero deforestation targets and policies protected area networks deforestation-free supply chains and forest-friendly infrastructure
Agriculture Improve productivity to feed a growing population shift high-meat diets towards plants slow the growth of food and agricultural land demand by reducing food loss and waste 28
Manure
43Entericfermentation (digestive processes of cattle)
20Syntheticfertilisers
7Burning of savanna2
Crop residues
2907MtCO2e
Figure 15 G20 GHG emissions from agriculture excl energy (2018)
Global deforestation needs to be halted and changed to net
zero CO2 removals by around 203076
On average building emissions per capita across the G20 are 14 tCO2capita a decrease of 29 between 2015-2020 but this is not a fast enough decrease74 In particular the USA (49 tCO2capita) and Australia (41 tCO2capita) have the highest building emissions per capita in the G20 reflecting the high share of fossil fuels especially natural gas and oil used for heat generation75
LAND USELoss of forest areas adding to the climate crisis
Emissions from agriculture accounted for 10 of the G20rsquos total GHG emissions in 2018 and 18 of the G20rsquos energy-related CO2 emissions The bulk of agricultural emissions
arise from methane and nitrous oxide with the main drivers being enteric fermentation (43) livestock manure (28) and synthetic fertilisers (20) (see Figure 15)81
Very high High Medium Low Very lowCurrent decarbonisation rating
Figure 16 Summary of 5-year trends and current decarbornisation ratings
Aviation emissions per capita 2013-2018 (tCO2capita change)
Building sector emissions per capita 2015-2020 (tCO2capita change)
Emissions intensity of industry 2012-2017 (kgCO2eUS$2015 GVA change)
Transport emissions per capita (exl aviation) 2015-2020 (tCO2capita change)
Growth in share of renewables in power generation (incl large hydro) 2015-2020 ( change)
1 5 9 11 16 21 24 26 31 37 39 40 43 46 49 70 73 75 117 163 523
ARG CAN ITA BRA CHN RUS G20 EU MEX TUR USA FRA JPN IND GER AUS UK IDN ZAF KOR SAU
Emissions intensity of the power sector 2015-2020 (gCP2kWh change)
-45 -42 -39 -31 -27 -23 -22 -22 -19 -15 -13 -13 -13 -13 -11 -11 -9 -8 -6 -3 -1
UK GER BRA CAN EU SAU USA ITA ARG FRA TUR KOR JPN AUS G20 CHN IND MEX RUS ZAF IDN
-18 -18 -15 -13 -12 -11 -11 -9 -8 -7 -5 -4 -3 -3 -2 0 0 1 25 23 22
UK ARG ITA SAU BRA ZAF JPN USA CAN MEX AUS G20 FRA EU TUR KOR RUS GER IND CHN IDN
-11 -8 4 7 8 11 13 16 17 17 21 23 24 25 29 32 35 45 45 54 102
BRA RUS FRA UK JPN AUS ARG CAN USA GER G20 EU ITA ZAF KOR IDN MEX SAU IND CHN TUR
-40 -27 -25 -24 -23 -23 -17 -17 -16 -15 -12 -12 -10 -4 -3 -1 0 3 19 29 38
SAU GER UK BRA EU ARG USA FRA AUS ITA MEX JPN CAN KOR G20 ZAF TUR IND RUS CHN IDN
-41 -30 -24 -19 -18 -17 -16 -16 -15 -13 -13 -12 -11 -11 -8 -8 0 0 1 8 24
UK CHN JPN USA IND AUS ITA G20 GER ZAF EU KOR TUR CAN IDN FRA MEX BRA RUS SAU ARG
Source Enerdata 2021 82
Current year is 2020 except for Aviation emissions per capita (2018) and Emissions intensity of industry (2017)
Source FAO 2021 80
11CLIMATE TRANSPARENCY REPORT | 2021
FINANCE MAKING FINANCE FLOWS CONSISTENT WITH CLIMATE GOALS
FINANCIAL REGULATIONS IMPROVING BUT PUBLIC FOSSIL FUEL FINANCE CONTINUES Financial actors from central banks to export credit agencies are finally integrating climate into their operations But continued public support for coal oil and gas must end immediately to have a chance of reaching climate targets
PARISAGREEMENT
Make finance flows consistent with a pathway towards low-GHG emissions and climate-resilient development
International public finance for coal must end immediately in all
G20 members to halt the development of coal power Investment in green energy and infrastructure needs to outweigh fossil fuel investments by 2025
Making all finance flows align with a low-carbon climate-compatible pathway is one of the key objectives of the Paris Agreement84 Due to the relative size of their economies and emissions G20 governments have a key role to play in showing leadership on this agenda by putting in place the right price signals and channelling all public finance away from high-carbon activities and assets towards clean climate-compatible ones and incentivising private finance flows to follow suit
FINANCIAL POLICIES AND REGULATIONSProgress on financial policies and regulations is moving at different speeds across the G2085 Some G20 members have continued taking steps to align their financial systems with sustainable development and address financial risks related to climate change There has been momentum on greening the financial sector at the international level
for example through the G20 sustainable finance working group and the Financial Stability Boardrsquos (FSB) climate risk roadmap86 However more concerted efforts are needed such as the standardisation of green finance practices promotion of disclosure standards for carbon and environmental risks and implementation of national sustainable finance roadmaps to transform the financial sector into a sustainable one
Significant regulatory and policy developments were seen in France Canada Japan the USA South Korea the UK and the EU (see Figure 17)
Some encouraging progress has also been seen in Australia China Germany India and Mexico where the central banks and financial regulatory authorities have stepped up to manage climate-related risks and opportunities within their financial sector through issuing relevant guidance and strategies or joining international networks that coordinate action in this area95 96 97 98 99
While most other G20 members have acknowledged the effects of climate change on their financial sector progress has been slow on green finance initiatives No major policy or regulatory level green finance commitments were identified in Russia Saudi Arabia or Turkey (aside from limited evidence
Figure 17 Regulatory and policy developments in G20 members to align financial systems with climate action
Note This figure illustrates examples of some key actions in G20 members but is not exhaustive of all recent developments in this areaSource Authorsrsquo own based on various sources
on efforts to stimulate green bonds or establish an ESG framework)100 101 102
FISCAL POLICIESAppropriate taxation and pricing instruments constitute incentives to align finance flows and investment with a climate-compatible future Removing budgetary support and tax exemptions for fossil fuels and putting in place effective carbon pricing schemes are key steps to this end alongside complementary fiscal policies supporting adaptation and a just transition
Fossil fuel subsidies remain very highThe continued provision of subsidies for the production and consumption of fossil fuels by G20 governments hinder the low-carbon transition by creating perverse incentives for their extraction and use thereby prolonging the life of fossil fuel assets
In 2009 G20 members committed to ldquorationalise and phase out over the medium-term inefficient fossil fuel subsidies that encourage wasteful consumptionrdquo103 However progress has been limited In 2019 alone G20 members excluding Saudi Arabia104 provided at least USD 152bn in subsidies for the production and consumption of coal oil and gas (see Figure 18)105
France
Responsible Investments Policy91 (Central Bank of France) 2021
Definitive exit from coal by 2024
South Korea
Official support for TCFD guidelines 202192
USA
Bill on climate risk disclosure 2021
Executive order to incorporate physical and transition climate risk in financial regulations 202189 90
UK
Task Force on Climate-related Financial Disclosures (TCFD) recommended report regulations 202187
Canada
Canadian Net-Zero Emissions Accountability Act 2021
Ministry of Finance to annually report on measures to address financial risks and climate change opportunities88
European Union
Climate change considerations in European Central Bank (ECB) monetary policy framework 2021
ECB climate change centre launched 202194
Japan
Regulatory guidelines on climate transition finance 202193
Bank of Japan to provide no-interest loans to financial institutions undertaking disclosure initiatives
12CLIMATE TRANSPARENCY REPORT | 2021
Five-year trends (2015-2019) for fossil fuel subsidies as a share of each countryrsquos GDP (which helps correct against currency and oil price fluctuations) show various extents of decrease in most G20 members most notably for Argentina106 China and Saudi Arabia (of between 57 and 70) but an increase in several others especially in Mexico Russia and France (in the order of 29-68) while remaining fairly stable in Canada and Turkey
Almost 40 of the total subsidies over the past years have been directed to petroleum
According to preliminary aggregate estimates107 government support for the production and consumption of fossil fuels in G20 economies excluding Saudi Arabia for which comparable data is not available decreased by 9 from 2019 This reduction was mostly due to COVID-19 impacts such as the fall in consumption of transport fuels brought about by mobility restrictions and a 10 decrease in support to the fossil fuel production sector driven by the drop in oil demand and the ensuing OPEC quotas of production in response108 However this decrease may well be offset by several examples of large sums of government support devoted to fossil fuel production in the form of sizeable bailouts to state oil and electricity companies once these are officially reported During 2020 G20 members pledged at least USD 252bn to fossil fuel energy as part of their energy-related funding commitments and COVID-19 economic response109
Most countries now have carbon pricing Pricing carbon effectively can encourage emitters across the entire economy to put in place efficiency measures and low-carbon transition plans Currently a total of 13 G20 members (as opposed to only 10 five years ago) have in place some form of explicit national carbon pricing scheme such as carbon taxes and emissions trading schemes (ETS) Brazil Indonesia Russia and Turkey are currently considering introducing such a scheme and some are currently trialling pilot schemes In 2020 explicit carbon pricing schemes generated total revenue of USD 47bn in the G20 with France and Japan recording the highest amounts of USD 93bn and USD 62bn respectively
Among the latest updates China launched its long-awaited national carbon ETS for the power sector (July 2021) the German government officially launched (January 2021) a national ldquocap-and-traderdquo system for the heating and road transport sectors (which are currently not covered by the EU ETS) and a UK ETS (as of January 2021) replaced the UKrsquos participation in the EU ETS following Brexit110 111 112
Figure 18 2019 G20 members fossil fuel subsidies (absolute values and per-unit of GDP shares) and 2015-2019 subsidy trends
Foss
il fue
l sub
sidie
s in
2019
(USD
bn)
Increased Decreased Remained steady
Five-year trends
Foss
il fue
l sub
sidie
s
of G
DP 2
019
(USD
bn)
0
5
10
15
20
USAJPNKORCHNGERCANINDTURIDNBRARUSFRAITAUKARGAUSZAFMEX00
02
04
06
08
climate aims (see Figure 19) France is the only G20 member whose carbon price is above the USD 40tCO2e threshold by 2020 recommended by the High-Level Commission on Carbon Prices A few G20 members (Canada Germany Italy South Korea the UK and the EU) have a carbon price that is defined as ldquolowrdquo (USD 11-39tCO2e)
Figure 19 Coverage and average price of explicit carbon pricing schemes in G20 members
Country Coverage Price (USD)
Argentina 20 95
Australia 0 na
Brazil 0 na
Canada 31 328
China 0 na
France 74 540
Germany 39 325
India 0 na
Indonesia 0 na
Italy 39 325
Japan 68 27
Mexico 46 33
Russia 0 na
Saudi Arabia 0 na
South Africa 80 95
South Korea 74 194
Turkey 0 na
UK 62 325
USA 0 na
EU 39 325
Coverage criteria based on that which was used in the BNEF Climate Policy Factbook
High gt66
Medium 33-66
Sufficient gtUSD 40
Low USD 11-39 Very low USD 1-10
Low lt33
None 0
Coverage
Price
while carbon prices in the rest of the G20 remain below the USD 10tCO2e threshold When emissions coverage is considered for national-level explicit carbon pricing schemes only schemes in France Japan South Africa and South Korea currently cover more than 66 of domestic emissions
Trends were assumed to have remained steady for increases or decreases within a +- 10 rangeNote Saudi Arabia is not included as comparable data is unavailable
Source OECD inventory of fossil fuel 2020113 For more information on the data see the Methodology note
Notes This table only includes national-level schemes and their prices It does not include sub-national schemes the inclusion of which would increase the overall level of coverage and pricing of carbon in a country For example according to the BNEF report Climate Policy Factbook in countries with significant sub-national schemes the overall coverage and prices can vary the levels and are as follows Canada 78 USD 31tCO2 China 43 USD 6tCO2 USA 8 USD 6tCO2114 For EU countries the table includes the EU ETS as well as any national scheme prices and it assumes that the EU ETS coverage is uniform across EU members and equal to the EU average coverage of 39 When a country has both its own national carbon pricing scheme and the EU ETS the one with the highest nominal price was chosen to determine the price in the table
Source Analysis based on data provided by I4CE 2021115 For more information see the Methodology note
However emissions coverage greatly varies and the price of carbon remains generally too low across the G20 to be in line with
13CLIMATE TRANSPARENCY REPORT | 2021
KEY ACTIONS FOR G20 MEMBERS
Finally the EU recently released a proposal for a new Carbon Border Adjustment Mechanism (CBAM) a climate measure that should prevent the risk of ldquocarbon leakagerdquo (the practice of moving carbon-intensive production abroad to avoid paying the price of carbon) In their July 2021 communiqueacute G20 Finance Ministers also mentioned the need for closer collaboration on carbon pricing mechanisms116
PUBLIC FINANCE FOR FOSSIL FUELSGovernments channel financing through public finance institutions including national and multi-lateral development banks and export credit agencies by providing direct funding and encouraging private investments by lowering the cost of and risk for capital Steering this financing away from high-carbon assets and towards appropriate adaptation and mitigation activities is crucial to aligning with the Paris Agreementrsquos goals
International public finance for fossil fuels continuesDuring 2018-19 G20 members provided USD 507bn per year of public finance for fossil fuels117 Over three-quarters of this financing was for oil and gas The highest providers of public finance were Japan (USD 103bnyr) China ( just over USD 8bnyr) and South Korea ( just under USD 8bnyr) (see Figure 20)
There has however been encouraging progress in terms of G20 members restricting public spending on fossil fuels through public finance institutions (PFIs) Multilateral development banks (MDBs) and nationally-owned development banks have made commitments in recent years to mainstream climate considerations in their operations and lending Most recently in May 2021 G7 nations made a commitment to end the use of public finance for new unabated international coal power plants118 South Korea also made a similar commitment119 In addition the US Treasury has announced a significant step away from international coal and gas projects through MDBs120 In September 2021 China also committed to end coal financing overseas121
However to support the phase-out of these fuels in line with climate goals such restrictions must be rapidly expanded to include oil and gas The UK government has shown leadership by announcing in December 2020 that it would no longer provide any fossil fuel finance internationally though with lack of clarity on natural gas projects122 This follows similar commitments by the EUrsquos PFIs The European Investment Bank (EIB) banned financing for all fossil fuels in 2019 but with exemptions for certain types of natural gas projects123 In July 2021 the European Bank for Reconstruction and Development (EBRD) committed to stop investing in upstream oil and gas projects by the end of 2022 to align its activities with the Paris Agreement124
International climate finance is still lackingAustralia Canada the EU France Germany Italy Japan the UK the USA are considered Annex II under the UNFCCC and are therefore obliged to provide climate finance to non-Annex II countries They reported an annual average international public support amount of USD 43bn between 2017-18 which only increased by 2 between 2018-19126 127
Japan is the largest contributor of climate finance among G20 members at over USD 12bn in 2017-18 which includes so-called lsquocleanrsquo coal as climate finance Flows are delivered predominantly through the Japanese Bank for International Cooperation (JICA) Germany and France follow at USD 84bn and USD 66bn respectively making use of KfW and the French Development Agency (AFD)
A number of non-Annex II countries of the G20 are voluntarily contributing climate finance (Brazil China India Indonesia Mexico Russia South Africa and South Korea) Russia has provided data on climate finance provision while other countries have pledged multilateral climate change funds
COP26 in 2021 marks the official start of negotiations towards the new climate finance goal The new goal will need to
exceed the target of USD 100bn a year from 2020 that developed countries committed to mobilise for developing countries from public and private sources At the G7 Summit in July 2021 Canada France Germany Italy Japan the UK and the USA reaffirmed their commitment to the USD 100bn through 2025128 And in September 2021 the European Commission committed an additional EUR 4bn (USD 5bn) by 2027 to support low-income and climate vulnerable countries129 Yet many estimates suggest they are still falling short of the target130 131 132 and countries are not doing their lsquofair-sharersquo133
With climate finance needs estimated to be far beyond USD 100bn a year it will be critical to develop trust between Global South and G7G20 members for this goal to be met Many Annex II G20 countries will need to show clear commitments to greater climate finance ambition than the current target and must use robust transparency and accountability mechanisms to ensure resources are effectively spent on quality projects In this respect the G7 commitment to end overseas development aid (ODA) for new coal is a key step in ensuring all finance flows are aligned with the Paris Agreement goal
Figure 20 G20 public finance for fossil fuels (USD millions per year 2018-19 average)
0
2000
4000
6000
8000
10000
12000
ZAFAUSARGTURFRAIDNMEXRUSBRAIND GERSAUUKITAUSACANKORCHNJPN
3OtherCoal
82
15
Oil and gas
Total50779
Initiatives integrating climate risk and reporting into their financial systems must move from voluntary to compulsory reporting and price and coverage of carbon pricing schemes must be increased
G20 members must eliminate continued subsidies as well as domestic and international public finance for fossil fuels
The nine G20 members who are required to provide climate finance to developing countries need to deliver the delayed USD 100bn and reaffirm their commitment for sufficient and high-quality financing that meets the needs of recipients
Coal coal extraction or coal-fired power generation Oil and gas oil and gas extraction processing or gas-fired electricity Other where support is provided for fossil fuels but the allocation between the types of fuel is unknown or it is provided to coal oil and gas activities (combined)
Source Oil Change International 2020125
14CLIMATE TRANSPARENCY REPORT | 2021
ENDNOTES1 Rogelj J et al (2018) ldquoMitigation Pathways Compatible
with 15degC in the Context of Sustainable Developmentrdquo in Masson-Delmotte V et al (eds) Global Warming of 15degC An IPCC Special Report on the Impacts of Global Warming of 15degC httpswwwipccchsiteassetsuploadssites2201905SR15_Chapter2_Low_Respdf
2 IPCC (2021) Climate Change 2021 The Physical Science Basis Contribution of Working Group I to the Sixth Assessment Report of the Intergovernmental Panel on Climate Change Eds Masson-Delmotte V et al httpswwwipccchreportar6wg1SPM
3 Climate Watch (nd) Historical GHG Emissions httpswwwclimatewatchdataorgghg-emissionsend_year=2018ampregions=G20ampsectors=total-including-lucfampstart_year=1990
4 UN (2015) Paris Agreement httpsunfcccintsitesdefaultfilesenglish_paris_agreementpdf
5 CAT (2021a) Global Update httpsclimateactiontrackerorgpublicationsglobal-update-september-2021
6 Climate Watch (nd) Historical GHG Emissions httpswwwclimatewatchdataorgghg-emissionsend_year=2018ampregions=G20ampsectors=total-including-lucfampstart_year=1990
7 CAT (2021a) Global Update8 Ibid9 Climate Analytics (2021) 15degC National Pathways Explorer
http1p5ndcpathwaysclimateanalyticsorg10 Climate Watch (nd) Net-Zero Tracker httpswww
climatewatchdataorgnet-zero-tracker11 Energy and Climate Intelligence Unit (nd) Net Zero Tracker
httpseciunetnetzerotracker12 CAT (2021b) CAT Climate Target Update Tracker13 Climate Analytics (2021) Closing the Gap https
climateanalyticsorglatestnew-report-finds-ambitious-action-by-g20-countries-alone-can-limit-warming-to-17c-keeping-15c-goal-within-reach
14 CAT (2021a) Global Update15 Climate Transparency (nd) NDC Transparency Check https
wwwclimate-transparencyorgndc-transparency-check16 World Health Organisation (2021) WHO Coronavirus (COVID-19)
Dashboard httpscovid19whoint [At the time of writing there were 4654548 deaths figure updated 30 September 2021]
17 OECD (2020) COVID-19 and the Aviation Industry Impact and Policy Responses httpswwwoecdorg
18 Based on data received directly from Enerdata (2021)19 UNEP (2021) Are We Building Back Better Evidence from 2020
and Pathways for Inclusive Green Recovery Spending httpswwwuneporg
20 Global Recovery Observatory (August 2021) How Are Countries Investing in Recovery UNDP httpsdataundporgcontentglobal-recovery-observatory
21 Ibid22 G20 (2009) G20 Leaders Statement The Pittsburgh
Summit G20 Research Group httpwwwg20utorontoca20092009communique0925html
23 IISD et al (2020) Doubling Back and Doubling Down G20 Scorecard on Fossil Fuel Funding httpswwwiisdorgsystemfiles2020-11g20-scorecard-reportpdf
24 Energy Policy Tracker (2021) G20 Countries httpswwwenergypolicytrackerorgregiong20
25 IEA (2021a) Sustainable Recovery Tracker httpswwwieaorgreportssustainable-recovery-tracker
26 Global Recovery Observatory (August 2021) How Are Countries Investing in Recovery
27 IPCC (2021) Climate Change 2021 The Physical Science Basis 28 World Weather Attribution (2021) Western North American
Extreme Heat Virtually Impossible Without Human-Caused Climate Change httpswwwworldweatherattributionorg
29 World Meteorological Organisation (2021) 2020 Was One of the Three Warmest Years On Record httpspublicwmoint
30 ND-GAIN (nd) Methodology httpsgainndeduour-workcountry-indexmethodology
31 Global Centre on Adaptation (2020) State and Trends Report 2020 httpsgcaorgwp-contentuploads202103GCA-State-and-Trends-Report-2020-Online-3pdf
32 Germanwatch (2020) Global Climate Risk Index 2020 httpsgermanwatchorgen17307
33 Arnell N W et al (2019) ldquoGlobal and Regional Impacts of Climate Change at Different Levels of Global Temperature Increaserdquo Climatic Change httpslinkspringercomarticle1010072Fs10584-019-02464-z
34 ND-GAIN (nd) Country Index httpsgainndeduour-workcountry-index
35 Andrijevic M et al (2020) ldquoGovernance in Socioeconomic Pathways and its Role for Future Adaptive Capacityrdquo Nature Sustainability httpsdoiorg101038s41893-019-0405-0
36 ND-GAIN (nd) Country Index37 Rogelj J et al (2018) ldquoMitigation Pathways Compatible with
15degC in the Context of Sustainable Developmentrdquo38 Based on data received directly from Enerdata (2021)39 Ibid40 Ibid
41 Enerdata (2021) Global Energy and CO2 Data httpswwwenerdatanetresearchenergy-market-data-co2-emissions-databasehtml
42 Based on data received directly from Enerdata (2021)43 Ibid44 US Energy Information Administration (nd) Data https
wwweiagovinternationaldataworld45 Based on data received directly from Enerdata (2021)46 IEEFA (2021) Stranded Asset Risks For Gas Investments
Climbing Quickly httpsieefaorgstranded-asset-risks-for-gas-investments-climbing-quickly
47 US Energy Information Administration (nd) Data httpswwweiagovinternationaldataworld
48 International Labour Organisation (2015) Guidelines For a Just Transition Towards Environmentally Sustainable Economies and Societies For All httpswwwiloorg
49 Government of Canada (2021) People-Centred Just Transition Discussion Paper httpswwwrncanengagenrcanca
50 European Commission (nd) The Just Transition Mechanism Making Sure No One is Left Behind httpseceuropaeu
51 Department of Forestry Fisheries and the Environment (2020) Cabinet Approves Climate Change Emissions Reduction and Waste Management Plans httpswwwenvironmentgovza
52 The Government of the Republic of Korea (2020) 2050 Carbon Neutral Strategy of the Republic of Korea UNFCCC httpsunfcccintsitesdefaultfilesresourceLTS1_RKoreapdf
53 Based on data received directly from Enerdata (2021)54 CAT (2020) Paris Agreement Compatible Sectoral Benchmarks
Study httpsclimateactiontrackerorgpublicationsparis-agreement-benchmarks
55 Rogelj J et al (2018) ldquoMitigation Pathways Compatible with 15degC in the Context of Sustainable Developmentrdquo
56 Based on data received directly from Enerdata (2021)57 IRENA (2018) Global Energy Transformation A Roadmap to
2050 httpswwwirenaorg-mediaFilesIRENAAgencyPublication2018AprIRENA_Report_GET_2018pdf
58 Based on data received directly from Enerdata (2021)59 Global Energy Monitor (2021) Global Coal Plant Tracker ndash
Dashboard httpsglobalenergymonitororgprojectsglobal-coal-plant-trackerdashboard
60 It should be noted that some countries have a very low to no coal power capacity For example please see the energy mix graph (energy chapter) for details on fossil fuels in Argentina Saudi Arabia has never used coal and is also not planning to build any coal plants but is 100 dependent on oil and gas plants
61 Enerdata (2021) Global Energy and CO2 Data62 IEA (2020a) Global Energy Review 2020 httpsieablobcore
windowsnetassets7e802f6a-0b30-4714-abb1-46f21a7a9530Global_Energy_Review_2020pdf
63 Based on data received directly from Enerdata (2021)64 Rogelj J et al (2018) ldquoMitigation Pathways Compatible with
15degC in the Context of Sustainable Developmentrdquo 65 Ritchie H (2019) Who Has Contributed Most to Global CO2
Emissions Our World In Data httpsourworldindataorgcontributed-most-global-co2 Note aviation accounts for 116 and shipping accounts for 106 of transport emissions Long-distance road freight (large trucks) aviation and shipping are particularly difficult to eliminate
66 Based on data received directly from Enerdata (2021)67 Climate Transparency (2021) Country Profiles httpswww
climate-transparencyorg68 Rogelj J et al (2018) ldquoMitigation Pathways Compatible with
15degC in the Context of Sustainable Developmentrdquo69 Baumert KA (2005) Navigating the Numbers Greenhouse
Gas Data and International Climate Policy World Resources Institute httpswwwwriorgresearchnavigating-numbers
70 IPCC (2014) ldquoIndustryrdquo in Climate Change 2014 Mitigation of Climate Change Contribution of Working Group III to the Fifth Assessment Report of the Intergovernmental Panel on Climate Change Eds Edenhofer O et al httpswwwipccch
71 CAT (2020) Paris Agreement Compatible Sectoral Benchmarks Study
72 Rogelj J et al (2018) ldquoMitigation Pathways Compatible with 15degC in the Context of Sustainable Developmentrdquo
73 IEA (2020b) Energy Efficiency 2020 httpswwwieaorgreportsenergy-efficiency-2020
74 Based on data received directly from Enerdata (2021)75 IEA (2020c) Heating httpswwwieaorgreportsheating76 Rogelj J et al (2018) ldquoMitigation Pathways Compatible with
15degC in the Context of Sustainable Developmentrdquo77 WWF (2021) Australia Remains the Only Developed Nation on
the List of Global Deforestation Fronts httpswwwwwforgau78 Global Forest Resources Assessment (2020) Annual Forest
Expansion Deforestation and Net Change Indicator Food and Agriculture Organisation httpsfra-datafaoorgWOfra2020forestAreaChange
79 Rogelj J et al (2018) ldquoMitigation Pathways Compatible with 15degC in the Context of Sustainable Developmentrdquo
80 Food and Agriculture Organisation (FAO) (2021) Emissions Totals Agriculture httpwwwfaoorgfaostatendataGT
81 Ibid 82 Based on data received directly from Enerdata (2021)
83 IEA (2021b) Net Zero by 2050 A Roadmap for the Global Energy Sector httpswwwieaorgreportsnet-zero-by-2050
84 UN (2015) Paris Agreement85 European Think Tanks Group (2021) G20 Ministerial Meetings
High Time for Development and Finance Ministers to Work Hand in Hand For a Sustainable Global Recovery httpsettgeu
86 Financial Stability Board (2021) FSB Roadmap for Addressing Climate-related Financial Risks httpswwwfsborg202107fsb-roadmap-for-addressing-climate-related-financial-risks
87 UK Government (2021) Governance and Reporting of Climate Change Risk Guidance For Trustees of Occupational Schemes httpswwwgovuk
88 Parliament of Canada (2021) BILL C-12 An Act Respecting Transparency and Accountability in Canadarsquos Efforts to Achieve Net-Zero Greenhouse Gas Emissions by the Year 2050 httpslaws-loisjusticegccaengactsC-193FullTexthtml
89 US House Committee on Financial Services (2021) To Amend the Securities Exchange Act of 1934 to Require Certain Disclosures Relating to Climate Change and For Other Purposes httpsfinancialserviceshousegovuploadedfiles0225_bills-1173ihpdf
90 The White House (2021) Executive Order on Climate-Related Financial Risk httpswwwwhitehousegov
91 Banque de France (2021) Responsible Investment Policy Reinforcing Exclusions With Regard to Fossil Fuels httpswwwbanque-francefr
92 Financial Services Commission (2021) Financial Authorities and Relevant Institutions Declare Support for TCFD and Its Recommendations httpswwwfscgokr
93 Financial Services Agency (2021) Basic Guidelines on Climate Transition Finance httpswwwfsagojpnewsr2singi20210507_204pdf
94 European Central Bank (2021b) ECB Presents Action Plan to Include Climate Change Considerations in Its Monetary Policy Strategy httpswwwecbeuropaeupressprdate2021htmlecbpr210708_1~f104919225enhtml
95 Australian Prudential Regulation Authority (2021) APRA Releases Guidance on Managing The Financial Risks of Climate Change httpswwwapragovau
96 Peoplersquos Bank of China (2020) ldquoSupporting Low-Carbon Development With Green Financerdquo Video speech at the Singapore FinTech Festival (SFF) 2020 httpwwwpbcgovcnen3688110368817240482694141587indexhtml
97 Green Finance Platform (2019) The Sustainable Finance Committee of the Federal Government httpswwwgreenfinanceplatformorg
98 Reserve Bank of India (2021) Financial Stability Report httpswwwrbiorginScriptsPublicationReportDetailsaspxUrlPage=ampID=1174
99 The Biodiversity Finance Initiative (2021) Mexico Starts Dialogue with Central Bank About Greening the Finance Sector httpswwwbiofinorgnews-and-mediamexico-starts-dialogue-central-bank-about-greening-finance-sector
100 Bank of Russia (2020) Information Letter on Recommendations for the Implementation of the Principles of Responsible Investment httpswwwcbrrucontentdocumentfile112325in-06-28_111_epdf
101 Reuters (2021) Saudi Sovereign Wealth Fund Scopes Banks for ESG framework httpswwwreuterscom
102 Turkey Investment Office (2021) New Economic Reform Package Heralded by President Erdoğan httpswwwinvestgovtr
103 G20 (2009) G20 Leadersrsquo Statement The Pittsburgh Summit 104 IEA (2020d) Energy Subsidies Database httpswwwiea
orgtopicsenergy-subsidies For more information on the data see the Methodology note at wwwclimate-transparencyorgg20-climate-performanceg20report2021
105 OECD-IEA (2020) Fossil Fuel Support Database 2020 update httpswwwoecdorgfossil-fuelscountrydata and httpswwwieaorgdata-and-statisticschartsvalue-of-fossil-fuel-consumption-subsidies-2010-2020 For more information on the data see the Methodology note at at wwwclimate-transparencyorgg20-climate-performanceg20report2021
106 Note the interpretation of some of the five-year trends requires some caution For example in the case of Argentina the observed trend can be partly explained by a substantial increase in the national budget due to the countryrsquos currency devaluation For more information see Fundacioacuten Ambiente y Recursos Naturales (FARN) (2020) Fossil Fuel Subsidies Is Every Little Thing ldquoGonna Be Alrightrdquo httpsfarnorgarwp-contentuploads202008DOC_SUBSIDIOS_2019-2020_FINAL_INGLES_linkspdf
107 OECD (2021 15 July) Update on Recent Progress in Reform of Inefficient Fossil-Fuel Subsidies That Encourage Wasteful Consumption 2021 httpswwwoecdorg
108 Ibid109 Energy Policy Tracker (2021) Track Public Money for Energy in
Recovery Packages httpswwwenergypolicytrackerorg110 Reuters (2021) Chinarsquos Carbon Trading Scheme Makes Debut
with 41 Million Tonnes in Turnover httpswwwreuterscom111 Schulz F translated by S Lawton (2020) ldquoGerman Cabinet
Agrees CO2 Price of euro25 from January 2021rdquo Euractiv httpswwweuractivde
112 UK Government (2021) Participating in the UK Emissions Trading Scheme (UK ETS) httpswwwgovuk
15CLIMATE TRANSPARENCY REPORT | 2021
This Highlights Report is part of the Climate Transparency Report 2021 Find the G20 country profiles at wwwclimate-transparencyorg
Climate Transparency is a global partnership with a shared mission to stimulate a ldquorace to the toprdquo in climate action in G20 countries through enhanced transparency
ACKNOWLEDGMENTS
PARTNERS DATA PARTNERS
FUNDERS
ClimateActionTracker
Supported by
based on a decision of the German Bundestag
113 OECD-IEA (2020) Fossil Fuel Support Database 2020 update For more information on the data see the Methodology note at wwwclimate-transparencyorgg20-climate-performanceg20report2021
114 BNEF (2021) Climate Policy Factbook httpswwwunorg115 Institute for Climate Economics (I4CE) (2021) Global Carbon
Accounts 2021 Paris France httpswwwi4ceorgdownloadglobal-carbon-account-in-2021 For more information see the Methodology Note at wwwclimate-transparencyorgg20-climate-performanceg20report2021
116 G20 (2021) Italian G20 Presidency Third Finance Ministers and Central Bank Governors Meeting Communique 9-10 July 2021 httpswwwg20orgwp-contentuploads202107Communique-Third-G20-FMCBG-meeting-9-10-July-2021pdf
117 Oil Change International (2020) Still Digging G20 Governments Continue to Finance the Climate Crisis httppriceofoilorg20200527g20-still-digging
118 Climate Home News (2021) G7 Commits to End Unabated Coal Finance in 2021 To lsquoKeep 15C Within Reachrsquo httpswwwclimatechangenewscom20210521g7-commits-end-unabated-coal-finance-2021-keep-1-5c-within-reach
119 Reuters (2021) South Korearsquos Moon Vows to End New Funding for Overseas Coal Projects httpswwwreuterscomarticleglobal-climate-summit-southkorea-idUSL4N2MF3R2
120 US Treasury (2021) Treasury Announces Fossil Fuel Energy Guidance for Multilateral Development Banks httpshometreasurygovnewspress-releasesjy0323
121 Ministry of Foreign Affairs of the Peoplersquos Republic of China (2021) Xi Jinping Attends the General Debate of the 76th UN General Assembly and Delivers an Important Speech httpswwwfmprcgovcnmfa_engzxxx_662805t1909172shtml
122 UK Government (2020) PM Announces the UK Will End Support for Fossil Fuel Sector Overseas httpswwwgovuk
123 European Investment Bank (EIB) (2019) EU Bank Launches Ambitious New Climate Strategy and Energy Lending Policy httpswwweiborgenpressall2019-313-eu-bank-launches-ambitious-new-climate-strategy-and-energy-lending-policy
124 European Bank for Reconstruction and Development (EBRD) (2021) EBRD Announces Full Paris Alignment by End-2022 httpswwwebrdcomnews2021ebrd-announces-full-paris-alignment-by-end2022-html
125 Oil Change International (2020) Still Digging G20 Governments Continue to Finance the Climate Crisis For more information see the Methodology note at wwwclimate-transparencyorgg20-climate-performanceg20report2021
126 The public support reported through membersrsquo biennial reports to the UNFCCC include bilateral and regional climate finance finance channelled through the multilateral climate change funds and support to multilateral and bilateral institutions that parties cannot specify as climate-specific (eg MDBs UN bodies) UNFCCC (2020) Country Biennial Report Submissions to the UNFCCC Fourth Biennial Reports httpsunfcccintBRs The USA did not provide a BR4 therefore the
provisional data provided to the UNFCCC in 2018 (thus for the 2015-16 period) is used as an estimate
127 OECD (2021) Climate Finance Provided and Mobilised by Developed Countries Aggregate Trends Updated with 2019 Data httpswwwoecdorgenvironmentclimate-finance-provided-and-mobilised-by-developed-countries-aggregate-trends-updated-with-2019-data-03590fb7-enhtm
128 G7 (2021) Carbis Bay G7 Summit Communique httpswwwg7ukorgwp-contentuploads202106Carbis-Bay-G7-Summit-Communique-PDF-430KB-25-pages-5pdf
129 Farnad C (2021) ldquoEU Commits euro4 Billion More to Climate Vulnerables Calls on the US to Step Uprdquo Climate Change News httpswwwclimatechangenewscom20210915eu-commits-e4-billion-climate-vulnerables-calls-us-step
130 Oxfam (2020) Climate Finance Shadow Report 2020 Assessing Progress Towards the $100 Billion Commitment 2020 httpswwwoxfamorgenresearchclimate-finance-shadow-report-2020
131 Bhattacharya A Calland R Averchenkova A Gonzalez L Martinez-diaz L and J Van Rooij (2020) Delivering on the $100 Billion Climate Finance Commitment and Transforming Climate Finance httpswwwunorgsitesun2unorgfiles100_billion_climate_finance_reportpdf
132 OECD-IEA (2020) Fossil Fuel Support Database 2020 update 133 Colenbrander S Cao Y Pettinotti L and A Quevedo (2021)
A Fair Share of Climate Finance Apportioning Responsibility for the $100 Billion Climate Finance Goal httpsodiorg
Highlights Report Leads Gahee Han amp Justine Holmes (Solutions For Our Climate (SFOC))
Country Profiles Lead Kim Coetzee (Climate Analytics)
Finance Lead Ipek Genccedilsuuml (ODI)
Contributing authors expert comments and inputs Aleksandra Kotur Florian Mersmann Gerd Leipold Pia Gleich (Humboldt-Viadrina Governance Platform) Andrezj Ancygier Anna Chapman Carley Reynolds Chelsea Jones Claire Fyson Claire Stockwell Deborah Ramalope Jae Kim Marie-Camille Attard Nandani Das Ryan Wilson Sharna Nolan Victor Maxwell Yann Robiou du Pont Data Team Andreas Geiges (Lead) Himalaya Bir Shrestha Sylvia Schmidt (Climate Analytics) Angela Picciariello Charlene Watson Nandini Sharma (ODI) Abhishek Kaushik Sachi Vohra (The Energy and Resources Institute) Analuz Presbiacutetero Mariana Gutieacuterrez Grados Jorge Villarreal (Iniciativa Climatica de Mexico) Andrew Marquard Bryce McCall (Energy Systems Research Group University of Cape Town) Ayse Sari (SHURA) Bert Metz (European Climate Foundation) Benoicirct Prunel Jeacutereacutemy Bonnefous Pascal Charriau (Enerdata) Caroline Lee (Canadian Institute for Climate Choices) Dorka Bauer (GSCC) David Eckstein Jan Burck (Germanwatch) Enrique Maurtua Konstantinidis Jazmiacuten Rocco Predassi (Fundacion Ambiente y Recursos Naturales) Fabby Tumiwa Lisa Wijayani (Institute for Essential Service Reform) Jiang Kejun (Beijing University of Technology) Georgia McDonnell Joojin Kim Jeehye Park Jessica Yun Kyungrak Kwon Sejong Youn Soojin Kim Sunwoo Lee (Solutions For Our Climate (SFOC)) Keisuke Iyadomi Rachel Chi Kiu Mok Sandhya Srinivasan (World Bank) Kentaro Tamura (Institute for Global Environmental Strategies) Lola Vallejo (Institute for Sustainable Development and International Relations) Simon Maxwell Surabi Menon (ClimateWorks Foundation) William Wills (Centro Clima Federal University of Rio de Janeiro)
Design Design for development (wwwd4dcoza) Editor Chapel Lane Editing Services Tanya Goodman
16CLIMATE TRANSPARENCY REPORT | 2021