Embed Size (px)
Citation preview
Wor
kingP
aper
Climate risk assessment and agricultural value chain prioritisation for Malawi and Zambia
Working Paper No. 228 CGIAR Research Program on Climate Change, Agriculture and Food Security (CCAFS)
Fabian Verhage Laura CramerPhilip ThorntonBruce Campbell
1
Climate risk assessment and agricultural value chain prioritisation for Malawi and Zambia
Working Paper No. 228
CGIAR Research Program on Climate Change,
Agriculture and Food Security (CCAFS)
Fabian Verhage, Laura Cramer, Philip Thornton, and
Bruce Campbell

2
Correct citation:
Verhage F, Cramer L, Thornton P, Campbell B. 2018. Climate risk assessment and agricultural value
chain prioritisation for Malawi and Zambia. CCAFS Working Paper no. 228. Wageningen, the
Netherlands: CGIAR Research Program on Climate Change, Agriculture and Food Security (CCAFS).
Available online at: www.ccafs.cgiar.org
Titles in this Working Paper series aim to disseminate interim climate change, agriculture and food
security research and practices and stimulate feedback from the scientific community.
The CGIAR Research Program on Climate Change, Agriculture and Food Security (CCAFS) is a
strategic partnership of CGIAR and Future Earth, led by the International Center for Tropical
Agriculture (CIAT). The Program is carried out with funding by CGIAR Fund Donors, Australia
(ACIAR), Ireland (Irish Aid), Netherlands (Ministry of Foreign Affairs), New Zealand Ministry of
Foreign Affairs & Trade; Switzerland (SDC); Thailand; The UK Government (UK Aid); USA
(USAID); The European Union (EU); and with technical support from The International Fund for
Agricultural Development (IFAD). For more information, please visit https://ccafs.cgiar.org/donors.
Contact:
CCAFS Program Management Unit, Wageningen University & Research, Lumen building,
Droevendaalsesteeg 3a, 6708 PB Wageningen, the Netherlands. Email: [email protected]
Creative Commons License
This Working Paper is licensed under a Creative Commons Attribution – NonCommercial–NoDerivs
3.0 Unported License.
Articles appearing in this publication may be freely quoted and reproduced provided the source is
acknowledged. No use of this publication may be made for resale or other commercial purposes.
© 2018 CGIAR Research Program on Climate Change, Agriculture and Food Security (CCAFS). CCAFS Working Paper no. 228
DISCLAIMER:
This Working Paper has been prepared as an output for the Policies and Priorities for CSA Flagship
under the CCAFS program and has not been peer reviewed. Any opinions stated herein are those of the
author(s) and do not necessarily reflect the policies or opinions of CCAFS, donor agencies, or partners.
All images remain the sole property of their source and may not be used for any purpose without
written permission of the source.
3
Abstract
Climate change is projected to have serious impacts on the agriculture of southern Africa, affecting
food availability, creating local production shortfalls and resulting in rising commodity prices. This
report highlights the risks to agriculture and food systems that may occur in two counties of the region,
Malawi and Zambia. The analysis uses the conceptual framework of climate-related risk from the Fifth
Assessment Report of the Intergovernmental Panel on Climate Change to examine the impacts that
climate change is likely to have on agriculture and food security. Country-specific trends in
temperature and rainfall and projected impacts are summarised from the literature. The vulnerability of
the agricultural sector in each country is discussed in relation to its sensitivity to change and coping and
adaptive capacity, and the risks of climate change on agriculture and small-scale farmers in the two
focus countries assessed. A prioritisation process is then carried out to rank different commodities in
each country, with respect to four dimensions: the importance of the commodity to the economy of the
country, the national yield gap compared with the regional average, the importance of the commodity
in people’s diet, and the projected impact of climate change on yield. The results of the analysis
highlight three commodities that could be prioritized for agricultural development interventions: maize,
potatoes and beans in Malawi, and maize, pulses and sorghum in Zambia.
Keywords
Climate change; climate risk; Malawi; Zambia; agriculture

4
About the authors
Fabian Verhage is a research assistant with the CGIAR Research Program on Climate Change,
Agriculture and Food Security (CCAFS) and is based at Wageningen University and Research in the
Netherlands. Contact: [email protected].
Laura Cramer is a CCAFS Science Officer for the Flagship on Policies and Priorities for Climate Smart
Agriculture and is based in Kenya. Contact: [email protected].
Philip Thornton is CCAFS Flagship Leader for Policies and Priorities for Climate Smart Agriculture
and is based in the UK. Contact: [email protected].
Bruce Campbell is the Program Director of CCAFS and is based in the Netherlands. Contact:

5
Acknowledgements
The authors extend thanks to Jim Hansen of CCAFS/IRI and Till Below, Wiebke Foerch and Sarah
Beerhalter from Deutsche Gesellschaft für Internationale Zusammenarbeit (GIZ) GmbH for comments
on an earlier draft.
The CGIAR Research Program on Climate Change, Agriculture and Food Security (CCAFS) is a
strategic partnership of CGIAR and Future Earth, led by the International Center for Tropical
Agriculture (CIAT). The Program is carried out with funding by CGIAR Fund Donors, Australia
(ACIAR), Ireland (Irish Aid), Netherlands (Ministry of Foreign Affairs), New Zealand Ministry of
Foreign Affairs & Trade; Switzerland (SDC); Thailand; The UK Government (UK Aid); USA
(USAID); The European Union (EU); and with technical support from The International Fund for
Agricultural Development (IFAD).

6
Contents
Introduction .................................................................................................................... 7
Conceptual framework ............................................................................................... 7
Structure of the paper ................................................................................................. 9
Hazards ........................................................................................................................ 10
General climate ........................................................................................................ 10
Climate signals in southern Africa ........................................................................... 11
Country-specific trends: Temperature ..................................................................... 12
Country-specific trends: Precipitation ..................................................................... 15
Exposure ...................................................................................................................... 18
Projected effects of climate change on agriculture .................................................. 18
Small scale farmers in Malawi and Zambia ............................................................. 20
Vulnerability ................................................................................................................ 23
Sensitivity in Malawi ............................................................................................... 23
Sensitivity in Zambia ............................................................................................... 24
Coping and adaptive capacity in Malawi ................................................................. 25
Coping and adaptive capacity in Zambia ................................................................. 25
Risk analysis ................................................................................................................ 27
Crop and livestock prioritisation .................................................................................. 30
Malawi ..................................................................................................................... 33
Zambia ..................................................................................................................... 35
Conclusion ................................................................................................................... 39
Appendix 1: Methodology for climate projections ...................................................... 40
Appendix 2: Areas of high future climatic risk ........................................................... 41
References .................................................................................................................... 43
7
Introduction
Climate variability and climate extremes already make agriculture in southern Africa difficult, and
climate change will exacerbate these challenges (Niang et al. 2014). Projected temperature increases,
more extreme weather, and uncertain rainfall changes are likely to have impacts on agriculture such as
increased crop losses, crop failures and increased and new pressures from pests, weeds and pathogens
(USAID 2016). These impacts on agriculture will in turn impact the food systems of the region by
affecting food availability, creating local production shortfalls and resulting in rising commodity prices
(Thornton et al. 2011).
This report highlights the risks to agriculture and food systems in Malawi and Zambia that are likely to
occur under climate change. Identifying these risks can help target those areas of each country that are
likely to be most affected by climate change. Reviewing the key agricultural value chains in both
countries can help identify priority crop value chains of importance for adaptation programs and
national prioritisation.
Conceptual framework
We use the conceptual framework of climate-related risk from the Fifth Assessment Report (AR5) of
the Intergovernmental Panel on Climate Change (IPCC) Working Group II (WGII) to examine the
impacts that climate change is likely to have on agriculture and food security (Fig. 1). These results can
help inform decision makers in selecting adaptation activities relevant to small scale farmers in these
countries.
In AR5, the concept of vulnerability has been expanded to a broader concept of risk of climate change
impacts. This risk concept has been adopted from the approach and practices of risk assessment in the
disaster risk reduction community. The AR5 risk concept focuses on assessing the risk of specific
consequences or impacts that may harm a system. The vulnerability of the system is now one of three
components of the risk, with exposure and hazard being the other two components. Consequently, this
assessment is called a ‘climate risk assessment’ instead of ‘climate change vulnerability assessment’ as
it takes into account the hazards and exposure of agriculture (GIZ and EURAC 2017).

8
Figure 1: Illustration of the core concepts of the IPCC WGII AR5.
The risk of climate-related impacts results from the interaction of climate-related hazards (including hazardous events and
trends) with the vulnerability and exposure of human and natural systems.
Source: IPCC 2014, p. 1046 (in GIZ and EURAC 2017)
The IPCC (2014) defines risk as the “potential for consequences where something of value is at stake
and where the outcome is uncertain” (p. 1772). The risk is determined by the interactions between
hazards, vulnerability and exposure, so we briefly define these concepts.
In this context, a hazard can be defined as the “potential occurrence of a [...] physical event or trend or
physical impact that may cause loss of life, injury, or other health impacts, as well as damage and loss
to property, infrastructure, livelihoods, service provision, ecosystems, and environmental resources”
(IPCC 2014, page 1766). It is important to note that hazards encompass both extreme weather events
(e.g. a one-day tropical storm) and slow climate trends (e.g. the annual average temperature increasing
over decades). In this study, the focus will be on hazards affecting agricultural production and food
security of people.
Exposure is defined by the IPCC (2014) as the “presence of people, livelihoods, species or ecosystems,
environmental functions, services, and resources, infrastructure, or economic, social, or cultural assets
9
in places and settings that could be adversely affected” (p. 1765). An example of exposure in the
context of this study would be the number of smallholder farmers and the area they farm.
The use of the concept vulnerability has changed with the publication of AR5 and is now defined as
the “propensity or predisposition to be adversely affected” (IPCC 2014, p. 1775). The concept now
encompasses both the sensitivity of people to climate impacts and their capacity to prepare for and
respond to them. Capacity is composed of both coping and adaptive capacity. The coping capacity is
the “ability of people, institutions, organizations, and systems, using available skills, values, beliefs,
resources, and opportunities, to address, manage, and overcome adverse conditions in the short to
medium term” (IPCC 2014, p. 1762). An example of this would be the establishment and use of early
warning systems. Adaptive capacity is the “ability of systems, institutions, humans and other
organisms to adjust to potential damage, to take advantage of opportunities, or to respond to
consequences” (IPCC 2014, p. 1758). This entails for example, the ability of farmers to react aptly to
an early warning.
Structure of the paper
This analysis follows the conceptual framework outlined in Figure 1. We first identify the hazards
(Section 2), exposure (Section 3) and vulnerability (Section 4) in Malawi and Zambia in relation to
agriculture and food security under climate change. We then summarize the risk in Section 5. Building
on this information, we present in Section 6 an analysis of crops and livestock in each country that
takes into account the value of production at the national level, the production amount, the extent to
which the national yield differs from the regional average yield, the contribution to the average per
capita day in terms of kilocalories and protein, and the estimated impact of climate change on expected
yield. The analysis builds on that used in the CSA country profiles (CIAT and World Bank 2017,
2018). These variables are combined and the products ranked to determine the top three that should be
prioritized by agricultural development interventions. We also offer additional information related to
the prioritized value chains and the advantages and disadvantages posed by each. Conclusions are
presented in Section 7.

10
Hazards
General climate
Malawi is located in eastern southern Africa, with Zambia bordering the country in the west, finding
itself in central southern Africa. Both Malawi and Zambia have tropical climates, but with relatively
cool temperatures due to their high elevation. Malawi’s topography is highly varied, with the Great Rift
Valley running from north to south, peaks reaching 3,000 m and Lake Malawi laying in the east at
approximately 470 m above sea level. Zambia’s topography is set by the East African Plateau on which
most of the country lays (McSweeney, New and Lizcano 2012a; 2012b).
Two main seasons can be distinguished in Malawi: a rainy season from November to April and a dry
season from May to October. Average daily temperatures vary with seasons and elevation, with the
coldest temperatures (12–15°C) found in the highlands in July and the hottest (25–26°C) experienced in
the Lower Shire Valley in October. Annual rainfall varies from 500 mm in low-lying areas to more
than 3,000 mm in the northern highlands. The Inter‐Tropical Conversion Zone controls the wet season
rainfall and brings approximately 150–300 mm of rain per month between November and February.
Overall rainfall is highly influenced by the El Niño Southern Oscillation and exhibits high interannual
variability. In large parts of Malawi, the coefficient of variation of annual rainfall is greater than 25%,
as can be seen in Fig. 2.
In Zambia, the temperature highs are reached in the hot, dry season running from September to
November (22–27 ˚C), and lows are experienced in the winter months from June to August (15–20 ˚C).
The average amount of annual precipitation varies from about 1250 mm in the northern parts of the
country to just 500–750 mm in the southern parts of the country; almost no rainfall is received during
the hot summer months. As with Malawi, the wet season rainfall is mainly determined by the Inter‐
Tropical Conversion Zone, and this moves between the northern and southern tropics on an annual
basis, bringing rain between October and April of approximately 150–300 mm per month. In addition
to the variations brought about by the Inter‐Tropical Conversion Zone, the El Niño Southern
Oscillation causes further inter-annual variability of rainfall (McSweeney, New and Lizcano 2012b).
This variability causes large parts of the eastern and southern regions of Zambia to have a coefficient of
variation of annual rainfall greater than 25%, as can be seen in Fig. 2.

11
Figure 2. Annual rainfall Coefficient of Variation in Zambia and Malawi.
Source: Authors. Data and methods as in Jones & Thornton (2015)
Climate signals in southern Africa
This section is based on the Africa chapter (Ch. 22) of the Fifth Assessment Report (AR5) from
Working Group II of the Intergovernmental Panel on Climate Change (IPCC) (Niang et al. 2014).
Already, average temperatures over most of southern Africa have increased in the second half of the
20th century and especially in the last two decades. Maximum and minimum temperatures have also
risen, with minimum temperatures increasing more rapidly in relation to maximum temperatures
throughout inland southern Africa.
The projected rise in the mean annual temperature in Africa, compared to the late 20th century mean
annual temperature, is dependent on the global emissions pathway of greenhouse gases (GHGs). For
higher-emission scenarios, the projected rise is likely to exceed 2 °C by the end of this century. In
addition, it is “likely that land temperatures over Africa will rise faster than the global land average,
particularly in the more arid regions, and that the rate of increase in minimum temperatures will exceed
that of maximum temperatures” (Niang et al. 2014, p. 1202).
The projections for changes in rainfall are less certain, but in general there are projections for drier
winters in southern Africa. The southern spring months may also experience decreases in rainfall,
causing later onset of the rainy season. For southern Africa, there is medium confidence that “droughts

12
will intensify in the 21st century in some seasons, due to reduced precipitation and/or increased
evapotranspiration. There is low confidence in projected increases of heavy precipitation” (Niang et al.
2014, p. 1206).
Fig. 3 illustrates projections in temperature and precipitation for an optimistic (RCP2.6) and pessimistic
(RCP8.5) scenario of GHG emissions. The temperature changes vary greatly under different emissions
scenarios, particularly in the latter half of the century. There is no clear trend in increase or decrease of
precipitation, but a larger uncertainty under the higher emissions scenario.
Figure 3. Observed and simulated variations in past and projected future
annual average temperature.
Black lines show various estimates from observational measurements. Shading denotes the 5th to 95th percentile range of
climate model simulations driven with “historical” changes in anthropogenic and natural drivers, historical changes in “natural”
drivers only, the RCP2.6 emissions scenario, and RCP8.5. Data are anomalies from the 1986–2005 average of the individual
observational data or of the corresponding historical all-forcing simulations.
Source: Adapted from Niang et al. 2014, p. 1208.
Country-specific trends: Temperature
Some of the information in this section comes from the same source, allowing direct country
comparisons of temperature and rainfall changes to be made: McSweeney, New and Lizcano 2012a
(Malawi) and 2012b (Zambia). These authors analysed climate observations of multiple sources and the
multi-model projections made available in phase 3 of the Coupled Model Intercomparison Project
(CMIP3), utilising low (B1), medium (A1B) and high (A2) GHG emissions scenarios. More recent
regional and country projections from different sources are included below, which essentially confirm
the earlier projections (without allowing a direct-to-country comparison to be made). The differences
between CMIP3 and CMIP5 projections are actually fairly muted for large areas of the globe (for
So
uth
ern A
fric
an
Dev
elo
pm
ent

13
example, see Sun et al., 2015a for the USA and Sun et al., 2015b for China). Most of the differences
have been attributed to the fact that the CMIP5 scenarios cover a larger range of possible future GHG
concentrations, resulting in a wider range of climate outcomes in the CMIP5 simulations, rather than to
substantial changes in climate model specification and performance (Sun et al., 2015a).
Recent temperature trends in Malawi
Between 1960 and 2006 the mean annual temperature in Malawi has increased by 0.9 °C, as can be
observed in Fig. 4. The temperature increase has been most rapid in the summer months of December
to February and slowest in the months of September until November. In line with this increase, the
frequency of hot days and nights has also increased significantly. ‘Hot’ days or nights are those with a
temperature higher than that exceeded on 10% of days or nights in current climate of that region and
season. Between 1960 and 2003, the number of hot days has increased 8%, while the number of hot
nights has increased 11%. In both cases the highest increase has been observed in summer. At the same
time, the number of ‘cold’ days and nights, during which the temperature drops below the temperature
of the coldest 10% of days or nights of the current climate, has decreased significantly.
Temperature projections for Malawi
In line with the recent trends, the mean annual temperature in Malawi is projected to increase by 1.1 to
3.0 °C by the 2060s, and 1.5 to 5.0 °C by the 2090s, as can be observed in Fig. 5. All scenarios indicate
substantial increases in the frequency of hot days and nights. By the 2060s, 14–32% of the days and
27–53% of the nights will have a temperature considered hot in relation to the current climate. The
number of days and nights that are considered cold in the current climate will become exceedingly rare,
and not occur at all by the 2090s under the highest emissions scenario (A2).
14
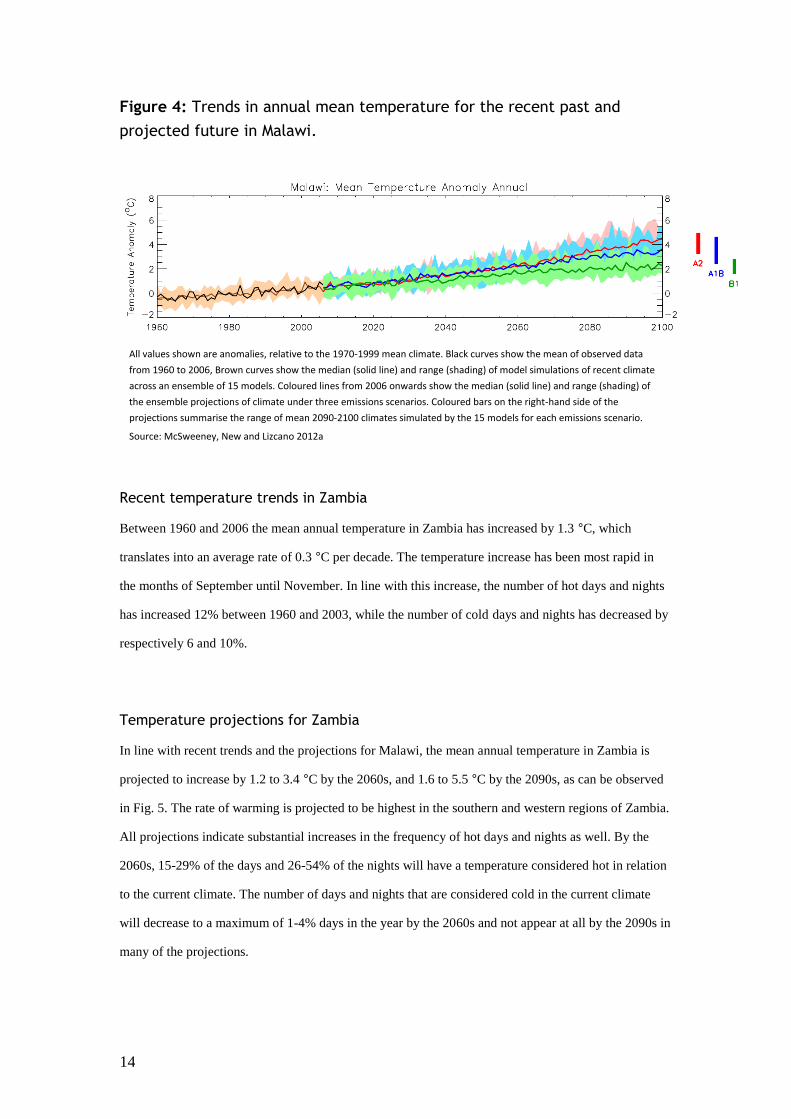
Figure 4: Trends in annual mean temperature for the recent past and
projected future in Malawi.
All values shown are anomalies, relative to the 1970-1999 mean climate. Black curves show the mean of observed data
from 1960 to 2006, Brown curves show the median (solid line) and range (shading) of model simulations of recent climate
across an ensemble of 15 models. Coloured lines from 2006 onwards show the median (solid line) and range (shading) of
the ensemble projections of climate under three emissions scenarios. Coloured bars on the right-hand side of the
projections summarise the range of mean 2090-2100 climates simulated by the 15 models for each emissions scenario.
Source: McSweeney, New and Lizcano 2012a
Recent temperature trends in Zambia
Between 1960 and 2006 the mean annual temperature in Zambia has increased by 1.3 °C, which
translates into an average rate of 0.3 °C per decade. The temperature increase has been most rapid in
the months of September until November. In line with this increase, the number of hot days and nights
has increased 12% between 1960 and 2003, while the number of cold days and nights has decreased by
respectively 6 and 10%.
Temperature projections for Zambia
In line with recent trends and the projections for Malawi, the mean annual temperature in Zambia is
projected to increase by 1.2 to 3.4 °C by the 2060s, and 1.6 to 5.5 °C by the 2090s, as can be observed
in Fig. 5. The rate of warming is projected to be highest in the southern and western regions of Zambia.
All projections indicate substantial increases in the frequency of hot days and nights as well. By the
2060s, 15-29% of the days and 26-54% of the nights will have a temperature considered hot in relation
to the current climate. The number of days and nights that are considered cold in the current climate
will decrease to a maximum of 1-4% days in the year by the 2060s and not appear at all by the 2090s in
many of the projections.

15
Figure 5: Trends in annual mean temperature for the recent past and
projected future in Zambia. See Figure 4 for details.
Source: McSweeney, New and Lizcano 2012b
Country-specific trends: Precipitation
Recent precipitation trends in Malawi
The year-to-year variability of rainfall in Malawi is so great that observations do not indicate
statistically significant trends. The wet-season from December 2005 to February 2006 showed
particularly little rainfall, causing an apparent decreasing trend in that season, but there is no evidence
of consistent decreases. Similar to seasonal and annual trends, no statistically significant statements can
be made about the indices of extremes calculated on the basis of daily precipitation observations.
Precipitation projections for Malawi
Projections for the mean annual rainfall in Malawi are so diverse that no clear trends can be noted.
Different models project changes in rainfall ranging from a 13% decrease to a 32% increase. With
regard to seasonal changes, the projections tend towards decreases in dry season rainfall (January-
August and September-November) and increases in wet season rainfall (December-February and
March-May). Projections are also consistent with regard to the proportion of rainfall that falls in heavy
events, which is projected to reach up to 19% under emissions scenarios A2, as can be seen in Fig. 6.
16
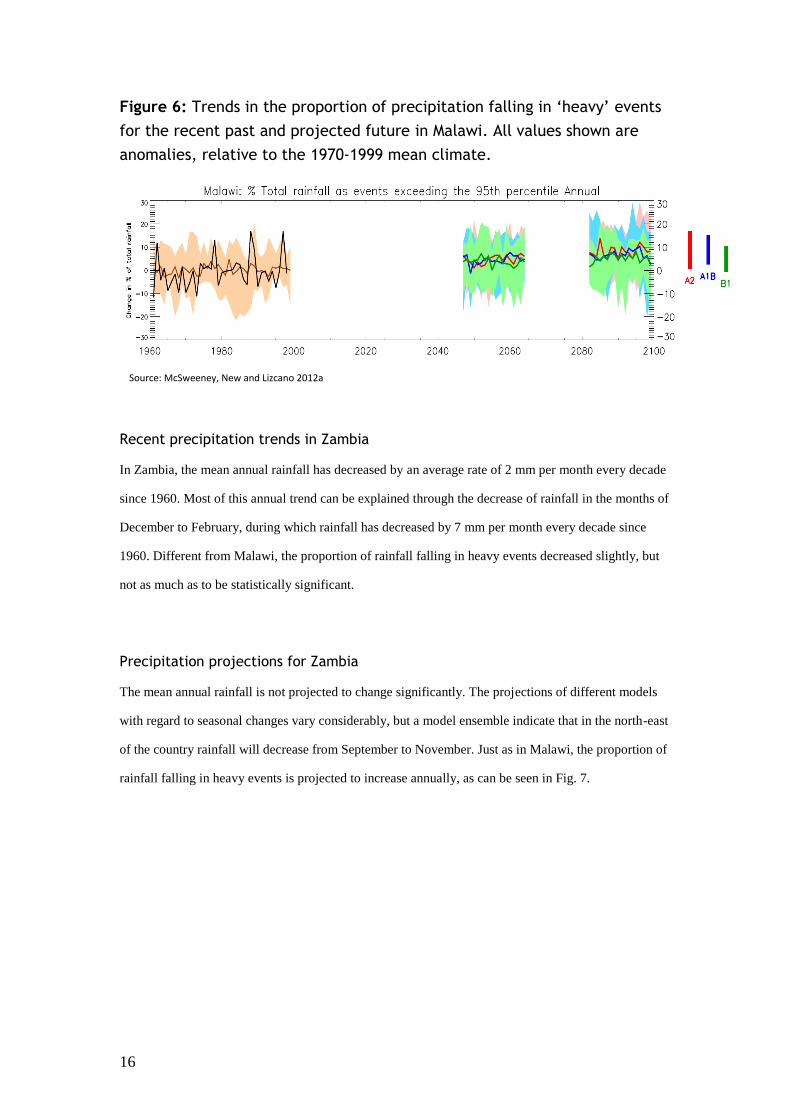
Figure 6: Trends in the proportion of precipitation falling in ‘heavy’ events
for the recent past and projected future in Malawi. All values shown are
anomalies, relative to the 1970-1999 mean climate.
Source: McSweeney, New and Lizcano 2012a
Recent precipitation trends in Zambia
In Zambia, the mean annual rainfall has decreased by an average rate of 2 mm per month every decade
since 1960. Most of this annual trend can be explained through the decrease of rainfall in the months of
December to February, during which rainfall has decreased by 7 mm per month every decade since
1960. Different from Malawi, the proportion of rainfall falling in heavy events decreased slightly, but
not as much as to be statistically significant.
Precipitation projections for Zambia
The mean annual rainfall is not projected to change significantly. The projections of different models
with regard to seasonal changes vary considerably, but a model ensemble indicate that in the north-east
of the country rainfall will decrease from September to November. Just as in Malawi, the proportion of
rainfall falling in heavy events is projected to increase annually, as can be seen in Fig. 7.

17
Figure 7: Trends in the proportion of precipitation falling in ’heavy’ events
for the recent past and projected future in Zambia. All values shown are
anomalies, relative to the 1970-1999 mean climate.
Source: McSweeney, New and Lizcano 2012b
Climate extremes
The results from recent regional climate modelling research confirm the projections outlined above. For
global warming of 2.0 °C, southern Africa is projected to experience a robust increase in temperature
compared to the control period (1971–2000) ranging from 1.5 °C–2.5 °C, with higher values
particularly from September to November. Rainfall projections remain uncertain and regionally
differentiated (Maúre et al., 2018), with some areas projected to undergo significant reductions and
others small increases. Importantly, in the areas projected to undergo significant reductions in rainfall,
this will be accompanied by increases in the number of consecutive dry days and decreases in
consecutive wet days. Rainfall events will tend to become less frequent, while more intense rainfall
events, separated by a large number of dry days, will tend to become more frequent. Overall, the
proportion of total rainfall coming from extreme precipitation events is expected to increase (FCFA,
2016). In both countries, stronger inter-annual variability in rainfall is likely, along with more likely
flooding and drought events. Projections further suggest increases in the mean number of days with
temperatures greater than 30°C, consistent across the majority of the climate models. For Malawi,
models are in agreement concerning decreases in the mean number of rain days and increases in the
amount of rainfall on each rainy day. Malawi experienced serious flood events in 2015, resulting in
several hundred fatalities and substantial displacement of people, highlighting the need for real-time
flood prediction (Kruczkiewicz et al., 2015). All in all, in the coming decades, rainfall is expected to be
more variable, with increased likelihood of both dry spells and intense rainfall events (often associated
with flooding), as well as increased likelihood of very hot days (FCFA, 2016; 2017).

18
Exposure
Projected effects of climate change on agriculture
Implications for the growing season
The changes in temperatures and in rainfall amounts and patterns in both Malawi and Zambia will
affect the length of the growing season. Throughout both countries, and in particular in the central and
southern regions, the length of the growing period (LGP) is projected to decrease by more than 20% by
the end of the 21st century, as can be seen in Fig. 8. The LGP is the average number of growing days
per year, whereby growing days are those with an average air temperature over 6.8 °C and the ratio of
actual to potential evapotranspiration greater than 0.35. The decrease of LGP will not only affect
cropping systems, but also livestock keeping, as growing days can be seen as a proxy for forage
availability in water-limited systems (Thornton et al. 2011).
Figure 8. Change in length of growing period in Malawi and Zambia in a +4 C
world.
Source: Authors. Data and methods as in Jones & Thornton (2008, 2015)
At the same time, the probability of season failure is likely to increase. Using the definition in Jones &
Thornton (2008), a season is considered to fail when it consists of fewer than 50 growing days or if

19
more than 30% of the days with the season are non-growing days. By the 2050s, it is projected that in
parts of southern Malawi and southern Zambia, one in every two or three years will have a failed
season, as can be seen in Fig. 9. Taken together, the shortening of the growing season and increased
crop failure may have serious implications for farmers’ ability to adapt; the varieties and crops
currently grown may not be suitable under future climates. This highlights the importance of crops and
crop varieties that are drought- and heat-tolerant and can adapt to shorter, more erratic growing
seasons.
Figure 9. Probability of main season failure in Malawi and Zambia.
Source: Authors. Data and methods as in Jones & Thornton (2008, 2015)
Implications on pests and diseases
In general, it is projected that climate change, particularly higher temperatures, will cause increased
risks of pests and diseases within Africa’s agricultural systems (Hachigonta et al. 2013). The effects
will likely be felt in crop, livestock and fishery subsectors (Dinesh et al. 2015). It is anticipated that
rising temperatures will increase pests and diseases (USAID 2013). Climate change is also likely to
cause greater frequency of new pests and major pest outbreaks (Dinesh et al. 2015). Specific impacts
for Malawi and Zambia are not possible to determine at this time.
Implications for water resources
The impacts of climate change on water availability in Malawi are already being felt. In a country that
once had an abundance of water, there is now water scarcity due to erratic rainfall, extended dry
Current conditions Ensemble mean values, 17 climate models, RCP 8.5,
2050s

20
periods, and increased evaporation (USAID 2013). The lakes and rivers in the country are very
sensitive to changes in climate, and the reduced rainfall has led to lower lake levels and less water in
the river systems (USAID 2013). Lower rainfall also affects farmers who mostly rely on rainfed
agriculture.
In Zambia, water resources are also under threat from climate change. Due to increased temperatures,
there is likely to be lower recharge rates of groundwater, leading to lower water tables and the drying
up of boreholes. Increased dry spells may also cause water shortages. There is a projected increase in
the proportion of rain falling during intense events, which may lead to flooding and/or greater siltation
and sedimentation of rivers (USAID 2016).
Implications for livestock and fisheries
Climate change is likely to affect livestock production in southern Africa through a reduction in forage
availability and quality and therefore lower productivity (Dhanush et al. 2015). Also, most livestock
species perform poorly at higher temperatures because they reduce their feed intake at temperatures of
about 30 °C (Dhanush et al. 2015). Climate change is expected to reduce the quantities of fish caught
because of higher water temperatures (Allison et al. 2009). According to a vulnerability analysis by
Allison et al. (2009), the national economies of Malawi and Zambia are both ‘highly vulnerable’ to
climate change-driven impacts on fisheries.
Small scale farmers in Malawi and Zambia
The effects of climate change on agriculture will be compounded by the magnitude of importance that
agriculture plays in the economy of Malawi and Zambia. The population of Malawi was estimated at 18
million in 2016, with 84% residing in rural areas (World Bank 2018a). By 2050, Malawi’s population
is projected to reach 43 million inhabitants, with 67% of the population living in rural areas (UN DESA
2015). The economy of Malawi is highly dependent on agriculture, with the sector being responsible
for 65% of employment and 80% of exports, the main crops by export value being tobacco, sugar and
tea (FAO 2018). The agriculture sector contributes 40% of the country’s GDP (USAID 2017). Farming
is the livelihood for an estimated 80% of the population, making the sector crucial to the well-being of
the country as a whole (FAO 2018).
21
The agricultural sector in Malawi is overwhelmingly made up of small farms: of the 2.6 million
holdings in the country (Lowder et al., 2016), more than 94% are less than 2 ha in size, and 60% are
less than 0.8 ha (Julien et al., 2018). Even so, farms of < 2 ha produce 36% of the cereal protein
nationally and nearly 40% of the protein from roots and tubers (Herrero et al., 2017).
In addition to the cash crops in Malawi cultivated for export, the main staple crops grown are maize
and groundnuts. Maize is grown by 97% of farmers (USAID 2013). The land under agriculture has
been increasing in recent years, and 61% of total land area in the country is now under crops or pasture
(FAO 2018). Most of the agriculture in Malawi is rain-fed subsistence agriculture (USAID 2013), and
the average farming household owns just 0.5 hectares of land. Less than 5% of agricultural land is
under irrigation (Saka et al., 2013). Livestock production is also mainly subsistence level and is lower
than other regional levels. Approximately 4% of Malawi’s GDP comes from its fisheries, and animal
protein in the local diet is 60-70% from fish (USAID 2013). Malawi has a relatively large share of
farming households that are headed by women at almost one third of households (FAO 2018). Given
the documented disadvantages that women have in agriculture (Huyer 2016), this increases the
exposure of the small-scale farming community to the impacts of climate change.
The situation is slightly different in Zambia, where approximately 60% of the population of 16.2
million lives in rural areas (CIAT and World Bank 2017). Just as in Malawi, Zambia’s population is
also projected to reach 43 million in 2050. With high urbanization rates, only 37% of all Zambians are
still expected to live in rural areas in 2050 (UN DESA 2018). However, agriculture will remain an
important source of livelihoods for many people. Currently there are about 1.6 million small scale
farmers in Zambia, and the average land holding is 1.5 ha (CIAT and World Bank 2017). Most of these
farmers rely on rainfed agriculture, leading to a high susceptibility to climate change impacts (USAID
2016; Kanyanga et al. 2013). The agriculture sector contributes approximately 8% of Zambia’s GDP
(CIAT and World Bank 2017), which is less than in Malawi but still a significant proportion. It is
estimated that women provide 70% of agricultural labour (CIAT and World Bank 2017).
Like Malawi, the agricultural sector in Zambia is made up of a considerable proportion of small farms.
Of the 1.6 million holdings in the country, 82% are less than 5 ha in size, and 52% are less than 2 ha
(Sitko and Chamberlin, 2015). Farms of < 2 ha produce 22% of the cereal protein nationally and 38%
of the protein from roots and tubers (Herrero et al., 2017). Unlike Malawi, Zambia has a significant
number of farms (>19,000) from 20-100 ha in size, located mostly in the centre and south of the
country (Sitko and Chamberlin, 2015; Herrero et al., 2017).

22
The main staple food crops in Zambia are maize, cassava, millet, sorghum and beans (CIAT and World
Bank 2017). Of these, maize, millet and sorghum are particularly sensitive to changes in climate
(USAID 2016). Maize is especially vulnerable to fluctuations in climate due to its physical
characteristics that result in sensitivity to changes in moisture and temperature (Kanyanga et al. 2013).
The high dependence on maize in the diet of Zambians and the lack of diversification in production
systems means that food security in the country is very vulnerable to climate change (CIAT and World
Bank 2017). Livestock is also at risk from increased pests and diseases and reduced forage and feed
availability predicted as a result of increased droughts (CIAT and World Bank 2017).

23
Vulnerability
Sensitivity in Malawi
Malawi ranks 170 out of 188 countries in the Human Development Index (HDR 2016) and is classified
as a low-income country. The population is largely rural (84%) and faces high poverty rates (70%);
poverty rates are on the increase in rural areas (FAO 2018). High poverty levels are a result of the
limited base of livelihoods in the country (CIAT and World Bank 2018). Its vulnerability to climate
change is influenced by its dependence on rainfed agriculture, high levels of malnutrition and
HIV/AIDS, and rapid population growth (USAID 2017).
The agricultural sector is extremely sensitive to climate change because of its reliance on rainfed crops.
Other constraining factors are small land sizes, degraded soils, and low usages of agrochemical inputs
(USAID 2017). Maize is the key staple crop (FAO 2018) but is highly sensitive to changes in
temperature and rainfall (Ramirez-Cabral et al. 2017; see box 1
on recent droughts). Another key contributor to the diet and to
agricultural exports is groundnuts (CIAT and World Bank 2018).
Climate change may affect the export potential and the food
safety for this crop through increased growth of aflatoxins
following more frequent heavy rains (USAID 2017). Fish from
the lakes of Malawi provide a significant portion of the protein
in the diet (28% of animal protein intake) and form an important
part of the livelihood for 10% of the population; the inland
fisheries of Malawi are under threat from climate change
(USAID 2017).
The country’s sensitivity is also compounded by the high levels
of malnutrition and HIV/AIDS. According to the 2015-16 Malawi Demographic and Health Survey
(DHS), 37% of under 5 are stunted, and 63% are anaemic (NSO 2017). HIV prevalence is higher in
urban areas (14.6%) than rural areas (7.4%) and higher among women (10.8%) than men (6.4%) (NSO
2017). In terms of population, the growth rate in 2016 was 2.9% (World Bank 2018a).
Box 1. Humanitarian crisis
in 2016
Erratic weather in the last three years
has demonstrated how vulnerable
Malawi and Zambia are to changes in
the climate. Malawi was hit by floods in
the season 2014-2015, and both Malawi
and Zambia were plagued by dry spells
in the consecutive season, with rainfall
at 40% of the required volume in the
hardest hit areas. As a result, 6.5 million
Malawians were left in need of
humanitarian aid in 2016 (CSIS 2016),
while Zambia imposed a ban on the
export of maize and the price for this
staple food doubled in some regions
(Reuters 2016).

24
Sensitivity in Zambia
Zambia has undergone considerable development since 2000, and the World Bank graduated Zambia to
low middle-income status in 2011 (Guardian 2011). Most of this economic growth was due to a surge
in the price of copper of which Zambia is a major exporter. However, the economic growth and
massive Chinese investments have failed to improve the lives of most Zambians, with almost 57.5% of
the population still living under the international poverty line of US$1.90/day (World Bank 2018b).
The poverty rate in rural areas has increased from 2010 to 2015, rising from 73.6% to 76.7%; 82% of
those in poverty live in rural areas (World Bank 2018b). Reasons for this are the rapid population
growth, high prevalence of HIV (with 14% of the Zambians aged between 15 and 49 infected), and
most Zambians rely on subsistence farming for their livelihood (UNICEF 2018).
The sensitivity of Zambia’s population to climate change impacts on agriculture is further exacerbated
by the dominant role of maize and cassava. These two crops provide over 50% of the population’s
intake of energy and protein intake (FAOSTAT 2018). However, agriculture in Zambia is
predominantly rainfed, making the yields of these crops directly dependent on the timeliness of the
rainy season and stability of temperatures (USAID 2016). Also, the productivity of livestock is directly
affected by the climate, as poor pasture and land management, disease prevalence and inadequate
veterinary services, make the animals highly sensitive to drops in quality and quantity of feed. Fisheries
are often subject to changes in fish stocks caused by rain and temperature.
Independently of climate change, Zambian farmers face other challenges to keep their yields up. In the
northern regions of Zambia, farmers typically cultivate cassava using slash-and-burn techniques and
face problems related to humidity and waterlogging. The central part of Zambia, running as a strip from
the city of Mongu in the west to the border of Malawi in the east, is dominated by maize and livestock.
The productivity of these are hampered by recurring droughts. The southern part of Zambia, bordering
Namibia and Zimbabwe, is agriculturally more diverse and is also affected by water availability issues.
Here reduced water availability also impacts the provision of hydro-power, on which the country is
largely dependent (USAID 2016).
Another aspect, enlarging the sensitivity of agricultural production to climate change, are post-harvest
losses. Losses of grains have been as high as 35% at national grain storage facilities. In general, losses
occur due to high humidity, pest attacks and pilfering. In the central and northern parts of Zambia,
sporadic rain showers sometimes lead to losses of grains in storage sheds and open storage platforms.

25
For vegetables, post-harvest losses are estimated at up to 50%, due to a lack of processing and storage
facilities after harvest and a lack of market incentives for small farmers (CIAT and World Bank 2017).
Coping and adaptive capacity in Malawi
The coping capacity of agriculture in Malawi is determined to a large extent by the access to
agricultural technology, such as irrigation. Only 1.5% of the farmland of smallholders is irrigated,
resulting in a high vulnerability to weather variability and extremes. However, motorized equipment is
even rarer, with only 0.4% of the smallholders using this. The access and use of other inputs, however,
is relatively high in Malawi, compared to other African countries. This is mostly due to the
governmental Farm Input Subsidy Program (FISP), which provides input vouchers and extension
services. As a result, 76% of the smallholders has access to fertilizers, 57% to improved seeds and 39%
to extension services or other knowledge sources. This program has improved food self-sufficiency of
farmers considerably, while the average value of crop production is still relatively low, with USD 321
per year (FAO 2018).
Malawian smallholder farmers have a slim adaptive capacity, due to several reasons. The first is that
they only sell a minor part of their produce on the market. This is partly caused by infrastructural
limitation, with the average distance of smallholders to a road amounting to 23 km. A second reason is
because, trade happens mainly through informal, local marketing channels, which offer low prices. A
third reason is because ownership of lands is greatly fragmented, which hampers investments and
intensification. This last aspect is worsened by the fact that only 6% of small family farmers have
access to credit (FAO 2018).
Coping and adaptive capacity in Zambia
Compared to its surrounding countries, Zambia is fairly stable in terms of national food security. On a
national scale, the country experienced good yields in the last five years, being a net exporter of maize
to neighbouring countries. Zambia also sells part of this surplus of maize to organizations that purchase
it to support their food aid emergency programmes in sub-Saharan Africa, such as the World Food
Programme. However, food insecurity remains particularly high in southern parts of the country, which
have been affected by prolonged droughts and poor agricultural production in 2016. Other factors
contributing to food insecurity are price volatility (driven by inflation) and input and output markets.
26
As a result, 49% of the population is still malnourished, while 15% and 6% of children under five are
underweight and stunted respectively (CIAT and World Bank 2017).
There is ample room to increase production however, as only 15% of the land that is suitable for
agriculture is being cultivated. In addition, only 29% of the land that can be irrigated is equipped for
irrigation. Currently, sprinkler irrigation is mostly used by commercial farmers for arable crops, such as
sugar cane. Most family farmers however, rely on a combination of buckets, watering cans, traction
pumps and motorised pumps to water their crops (CIAT and World Bank 2017).
The adaptive capacity of the Zambian population is slim, with almost 60% living below the poverty
line and most of them in rural areas. Despite its importance for the livelihood and food security of the
population, the agricultural sector plays a secondary role in the country's economic development
agenda, after mining. In order to ensure equitable growth and address current poverty and food and
nutrition security challenges, it is essential that small farmers stimulate agriculture through policies and
programmes (CIAT and World Bank 2017).
Although much research is available on conservation agriculture, more evidence on the implementation
and impact of other CSA practices and technologies is needed to ensure the applicability of practices in
the different agricultural and socioeconomic contexts of the country. The high dependence on maize as
a food security crop discourages farmers to a large extent from diversifying their production system. As
a result, even where intercropping and crop rotation are promoted, the farmers' focus and priority are
largely on maize. There is a need to develop input and output market systems for a range of agricultural
products within diverse and climate-smart production systems (CIAT and World Bank 2017).
The adaptive capacity is also affected by the low access to long-term credit. As only 2% of small
farmers have a formal title for their business, many farmers do not qualify for ordinary loans. If credit
is available, interest rates are high because of the perceived risk associated with small-scale rainfed
agriculture. Nevertheless, agricultural credit will be essential for farmers to take adaptation measures.
Although different stakeholders are involved in the provision of agricultural extension, efforts are
embedded in a project-based, rather than a programmatic approach, leading to fragmented and
uncoordinated results. Cooperation between development partners on adaptation and mitigation
initiatives for agricultural climate has improved in recent years, but there is scope for further
information and sharing of experience and joint programming (CIAT and World Bank 2017).
27
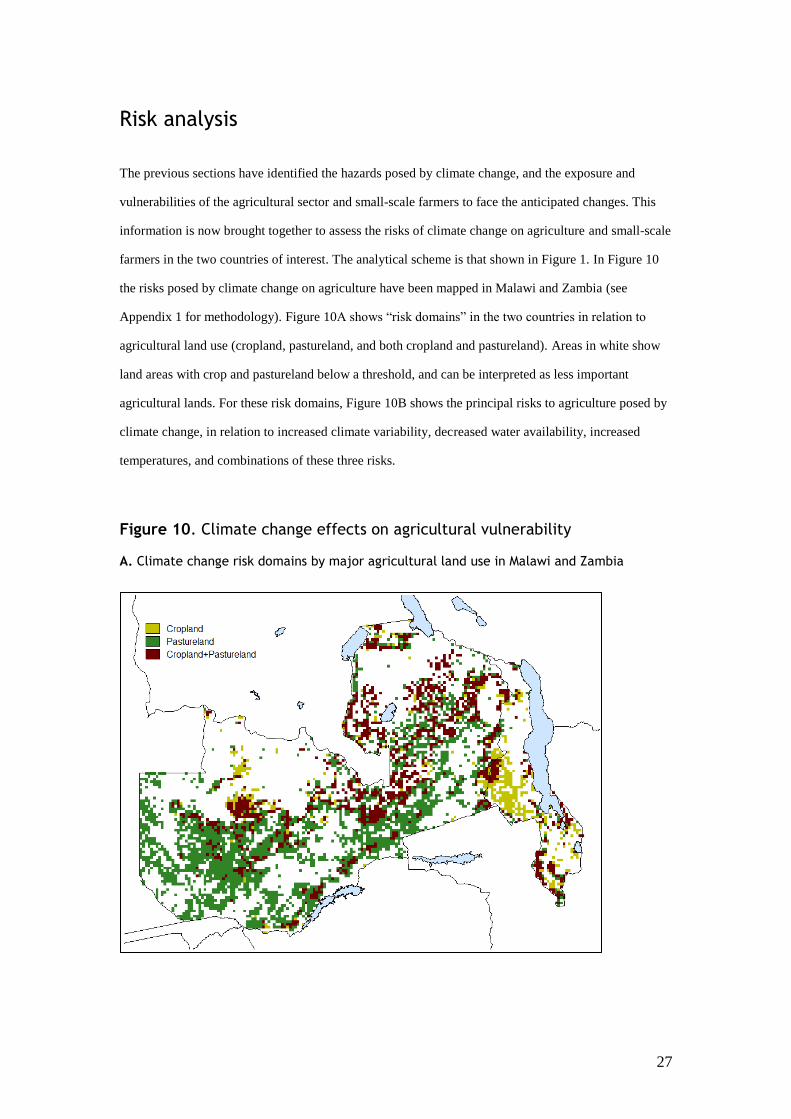
Risk analysis
The previous sections have identified the hazards posed by climate change, and the exposure and
vulnerabilities of the agricultural sector and small-scale farmers to face the anticipated changes. This
information is now brought together to assess the risks of climate change on agriculture and small-scale
farmers in the two countries of interest. The analytical scheme is that shown in Figure 1. In Figure 10
the risks posed by climate change on agriculture have been mapped in Malawi and Zambia (see
Appendix 1 for methodology). Figure 10A shows “risk domains” in the two countries in relation to
agricultural land use (cropland, pastureland, and both cropland and pastureland). Areas in white show
land areas with crop and pastureland below a threshold, and can be interpreted as less important
agricultural lands. For these risk domains, Figure 10B shows the principal risks to agriculture posed by
climate change, in relation to increased climate variability, decreased water availability, increased
temperatures, and combinations of these three risks.
Figure 10. Climate change effects on agricultural vulnerability
A. Climate change risk domains by major agricultural land use in Malawi and Zambia

28
B. Climate change risk domains and the major types of weather-related agricultural risks
faced in Malawi and Zambia
Source: Authors
Based on the risk mapping results in Figure 10 A and B, it is evident that Malawi and Zambia both face
immense challenges in adapting their agricultural sectors to climate change. Malawi will face
challenges in the croplands arising from temperature-water-variability interactions as a result of climate
change. Zambia will face challenges on both pasturelands and mixed-use lands. Eastern Zambia will
face challenges mainly associated with increased rainfall variability, while the western part of the
country will contend with higher temperatures and combinations of variability, water and temperature
challenges that will affect agricultural production.
These stresses will be felt most intensely by small-scale farmers who rely on rainfed agriculture for
their livelihoods. Farmers in the southern half of Malawi and the southern and eastern parts of Zambia
are most at risk of climate-related impacts on their cropping systems. See Appendix 2 for a tabulation
of risks by province in each country. Regardless of crop, the appropriate interventions to address these
risks will vary according to the key risk. Water- and variability-related risks may be addressed via
improved water use efficiency and water management (for example); temperature-related risks may
better be addressed through switching varieties (heat tolerance) or using more heat-tolerant crops
29
altogether. Other interventions that may help farmers cope include improved climate and agricultural
advisory services, agricultural risk insurance, and better access to credit. These types of activities can
help build the adaptive and coping capacity of small-scale farmers so they are better able to address the
challenges posed by climate change.
30
Crop and livestock prioritisation
Although broad-based interventions like climate-informed advisories can help deal with stresses that
cut across farming systems, there are specific crops and livestock as well as specific farming systems
that will be more affected than others by climate change. It is important to analyse which commodities
and types of livestock will be hit the hardest so that national development and investment plans can
take these into account. In this section, we carry out a prioritisation process to rank different
commodities in each country, with respect to several dimensions.
The method employed builds on that used in the CSA Country Profiles for Malawi and Zambia (CIAT
2018; CIAT and World Bank 2017). We began by selecting crops or livestock commodities within
Malawi and Zambia that play a significant role in the food and nutrition security of the population. This
was done through a review of the food balance sheet data from FAOSTAT and selecting food crops
that contributed at least 5 kcal/capita/day. Oils, sugar and alcohol were not included in the list.
After establishing the list of most relevant crops and livestock products, we gathered data for each
commodity based on selected variables. These variables are intended to help select the key crops or
livestock to be prioritized for agricultural value chain interventions within each country. The
dimensions used are the following:
▪ Value of production: this reflects the importance of the commodity to the economy of the country.
In the case of food staples, this also links to food security, if the commodity accounts for a
substantial proportion of the consumption of calories or protein. This is also a key dimension in
relation to actual and potential involvement of the private sector, who are unlikely to be willing to
invest in commodity value chains of only limited potential.
▪ Quantity of production: this is another indicator of the national importance of the commodity,
specifically to farmers, in relation to its total harvested area multiplied by the average yield. For
livestock commodities, this is the total number of animals multiplied by the production (of meat,
milk or eggs) per animal.
▪ Regional yield gap: this dimension reflects the potential for increasing production of the
commodity, by comparing the national yield with the average yield obtained in the eastern Africa

31
region1. A commodity with a large regional yield gap indicates that there may be high potential to
increase yields nationally, utilising regional technology and know-how from neighbouring
countries where yields are much greater.
▪ Importance of the commodity in the diet: this dimension addresses the importance of the
commodity in national diets, in relation to the supply of energy and protein. While there may be
considerable potential to introduce new crop and livestock products into national diets, these
changes may take a great deal of time, education and input to bring about. In the short term, a
concentration on commodities that are already contributing to national diets is more justifiable.
▪ Impact of climate change on yields: this dimension reflects the likely future impacts of climate
change on production of the commodity, on the basis that the future adaptation investment needs of
key commodities may be very substantial.
The data for the first four categories were gathered from FAOSTAT and the past five years of available
data were averaged and then normalized. The values for the impact of climate change on yields were
assigned based on a review of the climate change impact modelling literature (see Table 1 below). If
modelled impacts could not be found in the literature, the value was estimated based on expert
knowledge of agronomics and climate change. All five indicators were scored from 0 to 1, with the
higher values indicating higher value of production, greater importance to farmers, larger growth
potential, larger contribution to food and nutrition security, and more negative impacts of climate
change. Final ranks were calculated using a set of weight: all were set to unity, except for contribution
to food and nutrition security (a weight of 2) and climate change impact (a weight of 3).
Table 1. Climate change impacts on major commodities in Malawi and
Zambia
Commodity Impact range % yield
change
Sources, scenarios, region Impact
index
Banana -10 to +2 TR (2050s, A1B, southern Africa); L+ (2030s, southern Africa);
TC (2020s, A2, E Africa)
1
Beans -68 to -9 WC (2050s, A1B, Zambia); T+ (2090s, +4°C, southern Africa) 3
Beef Assumed slight negative 1
Cassava 0 to +7 WC (2050s, A1B, Zambia); L+ (2030s, southern Africa); RVC
(2050s, southern Africa)
0
Cow peas -15 LU (2050s, A2, Kenya) 2
1 In the FAOSTAT database, both Malawi and Zambia are included in the group of countries of eastern Africa.

32
Commodity Impact range % yield
change
Sources, scenarios, region Impact
index
Eggs Assumed slight negative - 1
Fish Assumed slight negative - 1
Groundnuts -17 to +2 A+ (2090s, A2, Malawi); WC (2050s, A1B, Zambia); TR (2050s,
A1B, southern Africa); L+ (2030s, southern Africa); RVC
(2050s, southern Africa)
2
Maize -28 to -5 A+ (2090s, A2, Malawi and Zambia); WC (2050s, A1B,
Zambia); L+ (2030s, southern Africa); TR (2050s, A1B,
southern Africa); RVC (2050s, southern Africa); T+ (2090s,
+4 °C, southern Africa); S+ (+2°C, southern Africa)
3
Poultry meat Assumed slight negative - 1
Milk Assumed slight negative - 1
Millet -22 WC (2050s, A1B, Zambia) 3
Pig meat Assumed slight negative - 1
Pigeon pea -20 to -10 B+ (2065s, India) 2
Plantains -6 L+ (2030s, southern Africa) 1
Potatoes -37 HI (2050s, southern Africa) 3
Rice -18 to +5 A+ (2090s, A2, Malawi and Zambia); WC (2050s, A1B,
Zambia); L+ (2030s, southern Africa); TR (2050s, A1B,
southern Africa); RVC (2050s, southern Africa); S+ (+2°C,
southern Africa)
2
Sheep/goat meat Assumed slight negative - 1
Sorghum -35 to -1 A+ (2090s, A2, Malawi and Zambia); L+ (2030s, southern
Africa); TR (2050s, A1B, southern Africa); RVC (2050s,
southern Africa)
3
Soybeans -14 to -8 A+ (2090s, A2, Malawi and Zambia); L+ (2030s, southern
Africa); TR (2050s, A1B, southern Africa); RVC (2050s,
southern Africa); S+ (+2°C, southern Africa)
2
Sweet potato -7 WC (2050s, A1B, Zambia) 2
Wheat -25 to -8 A+ (2090s, A2, Zambia); TR (2050s, A1B, southern Africa);
RVC (2050s, southern Africa); S+ (+2°C, southern Africa)
2
Impact index, representing the median of multiple projection estimates (where these exist): 0 little or somewhat positive
(>-3%); 1 some impact (-10% to -3%); 2 moderate impact (-20% to -10%); 3 severe impact (<-20%)
Where available, projection data are in the absence of the CO2 fertilisation effect, given the prevalence of low-input
cropping systems in the target countries and uncertainty as to whether crops would be able to express any CO2-related
yield benefit in such systems.
Reference code:
A+ Adhikariet al. (2015)
B+ Birthal et al. (2014)
HI Hijmans (2003)
L+ Lobell et al. (2008)
LU Luedeling (2011)
RVC Ramirez-Villegas and Challinor (2018)
TG Thomas and Rosegrant (2015)
T+ Thornton et al. (2011)
TC Thornton and Cramer (2012)
WC Wineman and Crawford (2017)
S+ Schleussner et al. (2016)
33
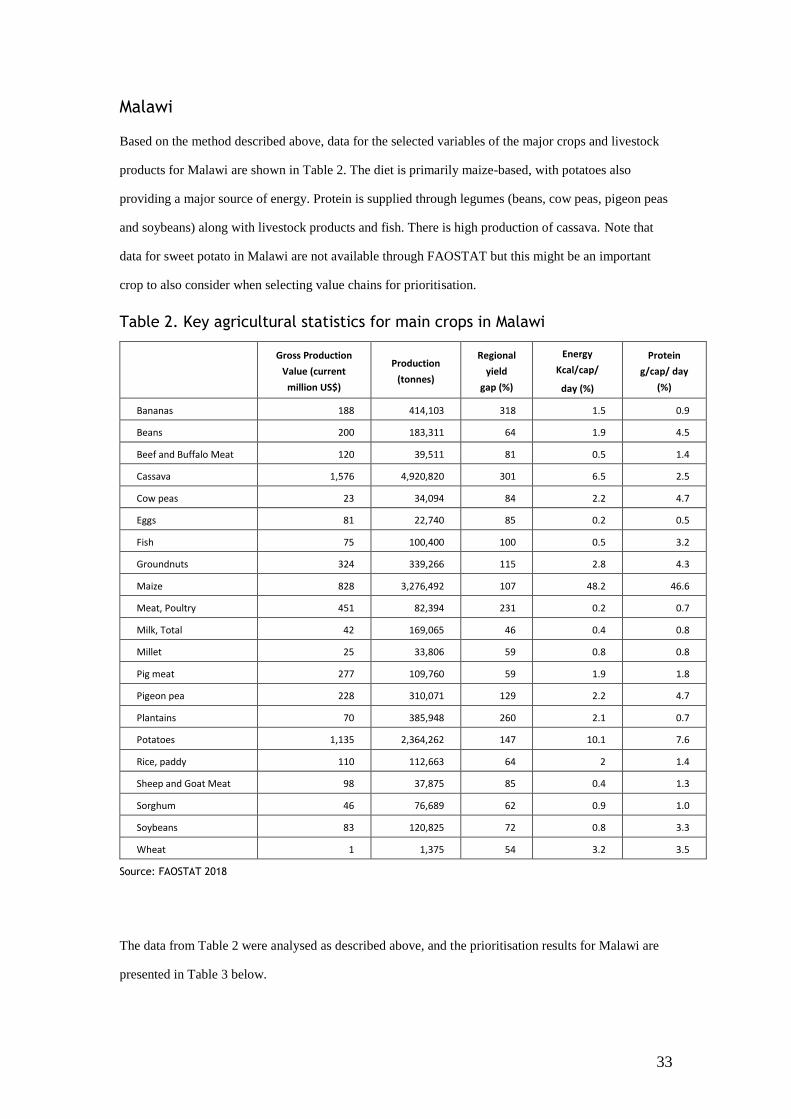
Malawi
Based on the method described above, data for the selected variables of the major crops and livestock
products for Malawi are shown in Table 2. The diet is primarily maize-based, with potatoes also
providing a major source of energy. Protein is supplied through legumes (beans, cow peas, pigeon peas
and soybeans) along with livestock products and fish. There is high production of cassava. Note that
data for sweet potato in Malawi are not available through FAOSTAT but this might be an important
crop to also consider when selecting value chains for prioritisation.
Table 2. Key agricultural statistics for main crops in Malawi
Gross Production
Value (current
million US$)
Production
(tonnes)
Regional
yield
gap (%)
Energy
Kcal/cap/
day (%)
Protein
g/cap/ day
(%)
Bananas 188 414,103 318 1.5 0.9
Beans 200 183,311 64 1.9 4.5
Beef and Buffalo Meat 120 39,511 81 0.5 1.4
Cassava 1,576 4,920,820 301 6.5 2.5
Cow peas 23 34,094 84 2.2 4.7
Eggs 81 22,740 85 0.2 0.5
Fish 75 100,400 100 0.5 3.2
Groundnuts 324 339,266 115 2.8 4.3
Maize 828 3,276,492 107 48.2 46.6
Meat, Poultry 451 82,394 231 0.2 0.7
Milk, Total 42 169,065 46 0.4 0.8
Millet 25 33,806 59 0.8 0.8
Pig meat 277 109,760 59 1.9 1.8
Pigeon pea 228 310,071 129 2.2 4.7
Plantains 70 385,948 260 2.1 0.7
Potatoes 1,135 2,364,262 147 10.1 7.6
Rice, paddy 110 112,663 64 2 1.4
Sheep and Goat Meat 98 37,875 85 0.4 1.3
Sorghum 46 76,689 62 0.9 1.0
Soybeans 83 120,825 72 0.8 3.3
Wheat 1 1,375 54 3.2 3.5
Source: FAOSTAT 2018
The data from Table 2 were analysed as described above, and the prioritisation results for Malawi are
presented in Table 3 below.

34
Table 3. Crop and livestock prioritisation results for Malawi
Prod.
Value
Prod.
tonnage
Reg. yield
gap
Food
security
Impact
of CC Total Rank
Bananas 0.12 0.08 0.00 0.02 0.30 1.14 21
Beans 0.13 0.04 0.80 0.06 1.00 4.08 3
Beef and Buffalo Meat 0.08 0.01 0.74 0.01 0.30 1.75 16
Cassava 1.00 1.00 0.05 0.09 0.00 2.23 12
Cow peas 0.01 0.01 0.74 0.07 0.70 2.99 11
Eggs 0.05 0.00 0.73 0.00 0.30 1.69 18
Fish 0.05 0.02 1.00 0.03 0.30 2.03 13
Groundnuts 0.21 0.07 0.64 0.07 0.70 3.15 6
Maize 0.53 0.67 0.66 1.00 1.00 6.85 1
Meat, Poultry 0.29 0.02 0.27 0.00 0.30 1.48 19
Milk,Total 0.03 0.03 0.86 0.01 0.30 1.83 15
Millet 0.02 0.01 0.81 0.01 1.00 3.86 5
Pig meat 0.18 0.02 0.81 0.03 0.30 1.98 14
Pigeon pea 0.14 0.06 0.59 0.07 0.70 3.03 9
Plantains 0.04 0.08 0.18 0.02 0.30 1.25 20
Potatoes 0.72 0.48 0.54 0.18 1.00 5.10 2
Rice, paddy 0.07 0.02 0.80 0.03 0.70 3.05 8
Sheep and Goat Meat 0.06 0.01 0.73 0.01 0.30 1.72 17
Sorghum 0.03 0.02 0.80 0.01 1.00 3.87 4
Soybeans 0.05 0.02 0.77 0.04 0.70 3.02 10
Wheat 0.00 0.00 0.83 0.06 0.70 3.06 7
Using the described ranking scheme, the crops that should be prioritized in Malawi for helping small-
scale farmers adapt to climate change are maize, potatoes and beans. Maize comes out at the top
because it is crucial for calorie and protein intake, it is grown by many farmers on large amounts of
land, and the impact of climate change on its growth will be negative. Potato is also important for
calorie and protein intake, its high value of production in the country, and the anticipated negative
impact of climate change. Beans are also important for protein in the diet, offer a potential to raise
yields in comparison to the regional average yield, and are likely to be negatively affected by climate
change.
Interventions aimed at helping small-scale farmers adapt to climate change may wish to take a value
chain approach to their development efforts because research has shown that farmers who are involved
in value chains can increase their productivity and benefit from greater access to inputs such as seeds,
fertilizers, and extension services (Dihel et al., 2018). Although maize is the top-ranked commodity in

35
the priority list, it may be more advantageous to prioritize a value chain other than maize. There are
many development projects that already target maize production. Also, the Government of Malawi has
issued several policies that call for diversification away from the high dependence on maize. The
Malawi National Nutrition Policy (2013) states that agricultural practices which encourage crop
diversification should be encouraged, and the Malawi National Agriculture Policy (2016)
acknowledges that “most policy instruments for agriculture have focused on these two crops [maize
and tobacco], resulting in an undiversified crop, livestock and fisheries production mix” (p. 3). The
Malawi Growth and Development Strategy III (2017) of Malawi cites lack of agriculture diversification
as a challenge to the sector’s productive capacity. Increased agricultural diversification is set forth as a
desired outcome. The Nationally Determined Contribution (NDC) of Malawi, its submission to the
UNFCCC on targets for mitigation of and adaptation to climate change, mentions the need to increase
the level of irrigation farming to deal with the challenges faced by rainfed agriculture. It also refers to
the need for small-scale farmers to adopt new practices such as conservation agriculture, drought
tolerant crops, and agro-forestry to deal with climate change. While there are drought-tolerant varieties
of maize available, it may be more feasible to focus on the bean value chain as a way to diversify crops
and introduce drought tolerant varieties of beans.
Given that the Government of Malawi has identified crop diversification in several policies and
strategies, it could be strategic to focus on potatoes, beans, or even sorghum (ranked 4th) for value chain
development to address climate change adaptation. The costs and benefits of selecting a particular
value chain would need to be assessed in additional research along with the potential numbers of
beneficiaries.
Zambia
The statistics for the main crops grown in Zambia are shown in Table 4 below. As with Malawi, the
diet is largely maize-based. Cassava is also an important source of calories and protein. Protein also
comes from groundnuts, livestock and fish products and soybeans. Livestock products (beef, eggs,
poultry meat, milk and pig meat) are high in production value along with cassava. In addition to being
used as a food crop, use of cassava in other industries such as brewing, metal extraction and starch
making has increased as the value chain has developed in Zambia (Dihel et al., 2018). It should be
noted that FAOSTAT data for Zambia do not separate out pulses (beans, cow peas, etc) except for
soybeans, limiting the ability to disaggregate among those legumes.
36
Table 4. Selected agricultural statistics for main crops in Zambia
Gross
Production
Value (current
million US$)
Production
(tonnes)
Regional
yield gap
(%)
Kcal/cap/day
(%)
Protein g/
cap/day (%)
Beef and Buffalo Meat 779 193,294 118 1.3 3.6
Cassava 680 1,021,020 79 11.4 3.3
Eggs 122 52,153 90 0.6 1.8
Fish 63 84,000 100 0.5 3
Groundnuts 58 136,151 80 3.8 5.7
Maize 448 2,845,486 148 51.3 47.7
Meat, Poultry 127 46,204 82 0.6 2
Milk, Total 344 436,054 601 0.7 1.5
Millet 15 28,966 70 0.3 0.3
Pig meat 173 39,739 91 0.8 1
Potatoes 24 32,112 140 0.2 0.2
Pulses 25 31,455 52 0.9 2
Rice, paddy 56 38,379 50 1.5 1
Sheep and Goat Meat 32 10,361 108 0.1 0.5
Sorghum 9 12,827 56 0.4 0.4
Soybeans 32 186,270 126 3 12.2
Sweet potatoes 65 170,442 56 1.4 0.7
Wheat 88 220,475 280 5 5.3
Source: FAOSTAT 2018
The data from Table 4 were analysed as described above, and the prioritisation results for Zambia are
presented in Table 5 below.

37
Table 5. Crop and livestock prioritisation results for Zambia
Prod.
Value
Prod.
tonnage
Reg. yield
gap
Food
security
Impact
of CC Total Rank
Beef and Buffalo Meat 1.00 0.06 0.88 0.05 0.30 2.89 11
Cassava 0.87 0.36 0.95 0.14 0.00 2.32 12
Eggs 0.15 0.01 0.93 0.02 0.30 2.01 15
Fish 0.07 0.03 0.91 0.03 0.30 1.94 16
Groundnuts 0.06 0.04 0.95 0.09 0.70 3.25 6
Maize 0.57 1.00 0.82 1.00 1.00 6.39 1
Meat, Poultry 0.15 0.01 0.94 0.02 0.30 2.03 14
Milk, Total 0.44 0.15 0.00 0.02 0.30 1.51 18
Millet 0.01 0.01 0.96 0.00 1.00 3.98 4
Pig meat 0.21 0.01 0.89 0.02 0.30 2.03 13
Potatoes 0.02 0.01 0.84 0.00 1.00 3.87 5
Pulses 0.02 0.01 1.00 0.03 1.00 4.05 2
Rice, paddy 0.06 0.01 1.00 0.02 0.70 3.19 9
Sheep and Goat Meat 0.03 0.00 0.89 0.00 0.30 1.83 17
Sorghum 0.00 0.00 0.99 0.01 1.00 4.00 3
Soybeans 0.03 0.06 0.86 0.15 0.70 3.21 8
Sweet potatoes 0.07 0.06 0.99 0.02 0.70 3.24 7
Wheat 0.10 0.07 0.58 0.10 0.70 2.96 10
The most important value chains according to the analysis scheme are maize, pulses and sorghum.
Maize is crucial for calorie and protein intake and is grown by many farmers on large amounts of land.
The impact of climate change on maize production will be negative. Pulses are important source of
protein and can also help improve soil fertility because of their nitrogen fixing ability. Crop rotation
(maize and beans) has been promoted in Zambia as part of conservation agriculture. The climate
change impact on pulses is anticipated to result in reduced production due to increased temperatures
and rainfall variability. Sorghum offers the potential for small scale producers to enter the value chain
through entering into contracts with buyers such as feed manufacturers or breweries. It is likely to be
highly affected under climate change.
As in Malawi, maize ranks number one in the priority list. However, it could be more strategic to
prioritize a value chain other than maize for similar reasons to Malawi. Zambia’s National Agriculture
Investment Plan (NAIP; 2014-2018) shows that one of the objectives of the crops component is “to
increase sustainable crop production, productivity and value addition for a diversified range of
competitive crops apart from maize” (p. 12). The NAIP also acknowledges that great need for
improved dietary diversification among Zambians. Sorghum offers a potential for value chain

38
development by involving small scale farmers in contract farming arrangements with processors.
Although cassava ranks lower in the prioritisation scheme, there are also efforts underway in Zambia to
increase the cassava value chain (Dihel et al., 2018). Zambia’s NDC makes specific mention of
promoting climate-smart agriculture practices and promoting crop land races of cassava, maize,
sorghum, finger millet, beans and cowpea. CSA practices in the livestock sector are also mentioned.
Development of an agricultural insurance market against climate change-induced risks is also written
into the country’s NDC.

39
Conclusion
This study assembled existing information on the hazards, exposure and vulnerability of agriculture in
Malawi and Zambia. A prioritisation process was designed, building on methods used in the CSA
Country Profiles for Malawi and Zambia (CIAT 2018; CIAT and World Bank 2017), to rank different
commodities in each country, with respect to four dimensions: the importance of the commodity to the
economy of the country, the national yield gap compared with the regional average, the importance of
the commodity in people’s diet, and the projected impact of climate change on yield. The results of the
analysis highlighted three commodities that could be prioritized for agricultural development
interventions: maize, potatoes and beans in Malawi, and maize, pulses and sorghum in Zambia.
Several caveats are in order. First, the results of the ranking exercise are somewhat dependent on the
weights used. These could be modified for different stakeholders, if deemed appropriate. Second, there
is some uncertainty associated with the climate risk analysis. For southern Africa, there is reasonable
consensus between the different climate models as to projections of future temperatures, but rather less
consensus with respect to changes in rainfall amounts and patterns. This is particularly the case with the
future of the El Niño Southern Oscillation, which is one of the key drivers of climate variability in the
region. Third, projected impacts of climate change on growing seasons and agricultural yields also have
significant uncertainty attached, not only because of uncertainties arising from the climate modelling
but also from the crop models used (which do not take account of possible changes in pest, weeds and
diseases in the future, for example).
Nevertheless, the analysis has highlighted commodities in both countries that could be prioritized for
agricultural development interventions, particularly if these are approached from a value chain
perspective, as this can allow small-scale farmers to increase their productivity and benefit from greater
access to inputs such as seeds, fertilizers, and extension services. While maize tops the list in both
countries, there are calls for moves towards a more diversified crop, livestock and fisheries production
mix. This could reduce the countries’ high dependence on maize, potentially increase the agricultural
sectors’ productive capacity, and increase smallholders’ ability to adapt to climate change. The costs
and benefits of selecting specific value chains still need to be assessed, particularly in relation to
intervention sites and the potential numbers of beneficiaries.

40
Appendix 1: Methodology for climate projections
The risk analyses presented in Figure 10 used different generations of climate models. For one set of
projections, Jones and Thornton (2013; 2015) utilized a generalised downscaling and data generation
method that takes the outputs of a General Circulation Model and allows the stochastic generation of
daily weather data that are to some extent characteristic of future climatologies. These data can be used
to drive any agricultural model that requires daily (or otherwise aggregated) weather data. The methods
used combine unintelligent empirical downscaling, climate typing and weather generation (Jones and
Thornton 2013, page 1). These methods were applied in Jones and Thornton (2015) to utilise data from
17 climate models from the Coupled-Model Intercomparison Project 5 (CMIP5) that were used in the
Fifth Assessment Report in 2014 (IPCC, 2013). Yearly GCM data for the twenty-first century at very
coarse scale were interpolated by bilinear interpolation from the original pixel sizes to 1-degree pixels.
Monthly means were calculated for rainfall and maximum and minimum air temperature, all expressed
as anomalies from the historical mean, and then bias corrected to WorldClim v1.3 (Hijmans et al.,
2005). The GCM data thus provide annual deviations for the years 2006 to 2099. To facilitate
application of the climate data, fourth-order polynomials for each variable were fitted to every pixel
through time.

41
Appendix 2: Areas of high future climatic risk
The three regions of Malawi are shown in the top figure, and the ten provinces of Zambia are shown in
the bottom figure.

42
The regions of Malawi and provinces of Zambia are tabulated below with respect to the major climatic
risks they face in the future, as discussed above.
Rainfall
variability
(current)
Loss of growing
season to the 2050s
Increased probability of
season failure by the
2050s
Major
agricultural
risks
MALAWI
Northern H H H V
Central H H H C
Southern H H H C F
ZAMBIA
Central H H C
Copperbelt T V
Eastern H H H C
Luapula H H C
Lusaka H H H C F
Muchinga H H H C
Northern T V
North-Western T F
Southern H H C
Western H H C
H: Areas with prevalence of high rainfall variability, >20% loss of growing season, substantial increase
in the probability of season failure between now and the 2050s.
Major agricultural risks: V, climate variability. T, high temperatures. C, combinations of high climate
variability, high temperatures, and water stress. F, flooding.
43
References
Adhikari U, Nejadhashemi AP & Woznicki SA. 2015. Climate change and eastern Africa: a
review of impact on major crops. https://onlinelibrary.wiley.com/doi/full/10.1002/fes3.61
Allison EH, Perry AL, Badjeck MC, Adger WN, Brown K, Conway D, Halls AS, Pilling GM,
Reynolds JD, Andrew NL, Dulvy NK. 2009. Vulnerability of national economies to the
impacts of climate change on fisheries. Fish and fisheries 10: 173–196.
Birthal PS, Khan MT, Negi DS, Agarwal S, 2014. Impact of climate change on yields of
major food crops in India: Implications for food security. Agricultural Economics
Research Review 27(2), 145-155.
CIAT and World Bank. 2017. Climate-Smart Agriculture in Zambia. CSA Country Profiles
for Africa Series. International Center for Tropical Agriculture (CIAT), Washington, D.C.
CIAT and World Bank. 2018. Climate-Smart Agriculture in Malawi. CSA Country Profiles
for Africa Series. International Center for Tropical Agriculture (CIAT), Washington, D.C.
Collins M; Knutti R; Arblaster J; Dufresne JL; Fichefet T; Friedlingstein P; Gao X; Gutowski
WJ; Johns T; Krinner G; Shongwe M; Tebaldi C; Weaver AJ; Wehner M. 2013. Longterm
climate change: Projections, commitments and irreversibility. In: Climate change. The
physical science basis. Contribution of Working Group I to the Fifth Assessment Report of
the Intergovernmental Panel on Climate Change. [Stocker TF; Qin D; Plattner GK; Tignor
M; Allen SK; Boschung J; Nauels A; Xia Y; Bex V; Midgley PM. (eds.)]. Cambridge
University Press, Cambridge, United Kingdom and New York, NY, USA. pp. 1029–1036.
DOI: 10.1017/CBO9781107415324.024.
CSIS. 2016. Drought-Ravaged Malawi Faces Largest Humanitarian Emergency in its History.
Washington DC, United States: Center for Strategic and International Studies. Available
online at: https://www.csis.org/analysis/drought-ravaged-malawi-faces-largest-
humanitarian-emergency-its-history
Dihel N, Goswami AG, Hollweg CH, Slany A. 2018. How does participation in value chains
matter to African farmers? World Bank Policy Research Working Paper 8506.
Washington, DC: World Bank.
Dinesh D, Bett B, Boone R, Grace D, Kinyangi J, Lindahl J, Mohan CV, Ramirez-Villegas J,
Robinson T, Rosenstock T, Smith J, Thornton P. 2015. Impact of climate change on Africa
agriculture: focus on pests and diseases. Copenhagen, Denmark: CGIAR Research
Program on Climate Change, Agriculture and Food Security (CCAFS). Available online
at: www.ccafs.cgiar.org

44
FAO. 2018. Small family farms country factsheet: Malawi. Rome, Italy: Food and Agriculture
Organization of the United Nations. Available online at: http://www.fao.org/family-
farming/detail/en/c/1115202/
FAOSTAT. 2018. FAOSTAT. Rome, Italy: Food and Agriculture Organization of the United
Nations (FAO). Available online at: http://www.fao.org/faostat/en/#data
Future Climate For Africa (FCFA), 2016. Near-term climate change in Zambia: What the
research tells us. http://www.futureclimateafrica.org/
Future Climate For Africa (FCFA), 2017. Future climate projections for Malawi. Country
Climate Brief, http://www.futureclimateafrica.org/
GIZ, EURAC. 2017. Risk Supplement to the Vulnerability Sourcebook. Guidance on how to
apply the Vulnerability Sourcebook’s approach with the new IPCC AR5 concept of
climate risk. nn, Germany: Deutsche Gesellschaft für Internationale Zusammenarbeit
GmbH (GIZ). Available online at: https://www.adaptationcommunity.net/vulnerability-
assessment/vulnerability-sourcebook/
GIZ. 2014. The Vulnerability Sourcebook. Concept and guidelines for standardised
vulnerability assessments. Bonn, Germany: Deutsche Gesellschaft für Internationale
Zusammenarbeit GmbH (GIZ). Available online at:
https://www.adaptationcommunity.net/vulnerability-assessment/vulnerability-sourcebook/
Government of the Republic of Zambia. 2013. Zambia National Agriculture Investment Plan
(NAIP) 2014-2018. Lusaka: Ministry of Agriculture and Livestock.
Government of Zambia. 2016. Zambia’s Intended National Determined Contribution (NDC)
to the 2015 Agreement on Climate change. Available from
http://www4.unfccc.int/ndcregistry/Pages/All.aspx
Hachigonta, Sepo, ed.; Nelson, Gerald C., ed.; Thomas, Timothy S., ed.; Sibanda, Lindiwe
M., ed. 2013. Southern african agriculture and climate change: A comprehensive analysis.
Washington, D.C.: International Food Policy Research Institute (IFPRI). Available online
at: http://dx.doi.org/10.2499/9780896292086
HDR. 2016a. Human Development for Everyone: Malawi. New York, United States: United
Nations Development Programme (UNDP)
http://hdr.undp.org/sites/all/themes/hdr_theme/country-notes/MWI.pdf
HDR. 2016b. Human Development for Everyone: Zambia. New York, United States: United
Nations Development Programme (UNDP)
http://hdr.undp.org/sites/all/themes/hdr_theme/country-notes/ZMB.pdf
Herrero M, Thornton PK, Power B, Bogard J, Remans R, Fritz S, Gerber J, Nelson GC, See
L, Waha K, Watson RA, West P, Samberg L, van de Steeg J, Stephenson E, van Wijk M,

45
Havlik P (2017). Farming and the geography of nutrient production for human
consumption. The Lancet Planetary Health 1, 33-42.
Hijmans R. 2003. The effect of climate change on global potato production. American journal
of potato research 80(4), 271-279.
Hijmans, RJ, Cameron, SE, Parra, JL, Jones, PG, Jarvis A. 2005. Very high resolution
interpolated climate surfaces for global land areas. International Journal of Climatology
25, 1965–1978. https://doi.org/10.1002/joc.1276
Huyer S. 2016. Closing the gender gap in agriculture. Gender, Technology and Development
20(2): 105 – 116.
IPCC. 2014. Climate Change 2014: Impacts, Adaptation, and Vulnerability. Part A: Global
and Sectoral Aspects. Contribution of Working Group II to the Fifth Assessment Report of
the Intergovernmental Panel on Climate Change. Cambridge and New York: Cambridge
University Press. Retrieved 03.05.2017 from http://www.ipcc.ch/report/ar5/wg2/
Jones PG, Thornton PK. 2008. Croppers to livestock keepers: livelihood transitions to 2050 in
Africa due to climate change. Environmental Science and Policy 12 pp. 427-437.
https://doi.org/10.1016/j.envsci.2008.08.006
Jones PG, Thornton PK. 2013. Generating downscaled weather data from a suite of climate
models for agricultural modelling applications. Agricultural Systems 114 pp. 1-5.
http://dx.doi.org/10.1016/j.agsy.2012.08.002
Jones PG, Thornton PK. 2015. Representative soil profiles for the Harmonized World Soil
Database at different spatial resolutions for agricultural modelling applications.
Agricultural Systems 139 pp. 93-99. http://dx.doi.org/10.1016/j.agsy.2015.07.003
Julien, J.C., Bravo-Ureta, B.E. and Rada, N.E., 2018. Assessing farm performance by size in
Malawi, Tanzania, and Uganda. Food Policy,
https://doi.org/10.1016/j.foodpol.2018.03.016
Kanyanga J, Thomas TS, Hachigonta S, Sibanda LM. 2013. Chapter 9: Zambia. In:
Hachigonta S, Nelson GC, Thomas TS, Sibanda LM, eds. Southern African agriculture
and climate change. Washington DC: IFPRI. p 255–287.
Kruczkiewicz A, Cen H, Moneymaker B, 2015. Applications of Flood Definitions and NASA
Earth Observations to Create a Flood Forecasting Methodology. Technical Report,
International Research Institute for Climate and Society (IRI), Palisades, NY
Lobell DB, Burke MB, Tebaldi C, Mastrandrea MD, Falcon WP, Naylor RL. 2008.
Prioritizing climate change adaptation needs for food security in 2030. Science 319 (5863)
pp. 607-610. https://doi.org/10.1126/science.1152339
Lowder, S.K., Skoet, J. and Raney, T., 2016. The number, size, and distribution of farms,
smallholder farms, and family farms worldwide. World Development, 87, pp.16-29

46
Luedeling E, 2011. Climate change impacts on crop production in Busia and Homa Bay
Counties, Kenya. Nairobi, Kenya: World Agroforestry Centre.
Malawi Government. 2016. National Agriculture Policy. Lilongwe: Ministry of Agriculture,
Irrigation and Water Development.
Malawi Government. 2017. The Malawi Growth and Development Strategy (MGDS) III:
Building a productive, competitive and resilient nation.
Maúre, G., Pinto, I., Ndebele-Murisa, M., Muthige, M., Lennard, C., Nikulin, G., Dosio, A.
and Meque, A., 2018. The southern African climate under 1.5° C and 2° C of global
warming as simulated by CORDEX regional climate models. Environmental Research
Letters, 13(6), p.065002.
McSweeney C, New M, Lizcano G. 2012a. Malawi. UNDP Climate Change Country Profiles.
New York, United States: United Nations Development Programme (UNDP) Available
online at: http://www.geog.ox.ac.uk/research/climate/projects/undp-cp/
McSweeney C, New M, Lizcano G. 2012b. Zambia. UNDP Climate Change Country Profiles.
New York, United States: United Nations Development Programme (UNDP) Available
online at: http://www.geog.ox.ac.uk/research/climate/projects/undp-cp/
McSweeney, New, Lizcano and Lu. 2010. Improving the Accessibility of Observed and
Projected Climate Information for Studies of Climate Change in Developing Countries
https://journals.ametsoc.org/doi/10.1175/2009BAMS2826.1
Niang, I., O.C. Ruppel, M.A. Abdrabo, A. Essel, C. Lennard, J. Padgham, and P. Urquhart,
2014: Africa. In: Climate Change 2014: Impacts, Adaptation, and Vulnerability. Part B:
Regional Aspects. Contribution of Working Group II to the Fifth Assessment Report of the
Intergovernmental Panel on Climate Change [Barros, V.R., C.B. Field, D.J. Dokken, M.D.
Mastrandrea, K.J. Mach, T.E. Bilir, M. Chatterjee, K.L. Ebi, Y.O. Estrada, R.C. Genova,
B. Girma, E.S. Kissel, A.N. Levy, S. MacCracken, P.R. Mastrandrea, and L.L. White
(eds.)]. Cambridge University Press, Cambridge, United Kingdom and New York, NY,
USA, pp. 1199-1265.
[NSO] National Statistical Office [Malawi] and ICF. 2017. 2015-16 Malawi Demographic
and Health Survey Key Findings. Zomba, Malawi, and Rockville, Maryland, USA. NSO
and ICF.
Ramírez J; Jarvis A. 2008. High-resolution statistically downscaled future climate surfaces.
International Center for Tropical Agriculture (CIAT); CGIAR Research Program on
Climate Change, Agriculture and Food Security (CCAFS). Cali, Colombia.
Ramirez-Cabral NYZ, Kumar L, Shabani F. 2017. Global alterations in areas of suitability for
maize production from climate change and using a mechanistic species distribution model

47
(CLIMEX). Scientific Reports (7) Article number: 5910. https://doi.org/10.1038/s41598-
017-05804-0
Ramírez-Villegas J; Thornton PK. 2015. Climate change impacts on African crop production.
Working Paper No. 119. CGIAR Research Program on Climate Change, Agriculture and
Food Security (CCAFS), Copenhagen, Denmark. Available at:
http://hdl.handle.net/10568/66560
Republic of Malawi. 2013. National Nutrition Policy. Office of the President and Cabinet.
Lilongwe: Department of Nutrition, HIV and AIDS.
Republic of Malawi. 2017. Intended Nationally Determined Contribution. Available from
http://www4.unfccc.int/ndcregistry/Pages/All.aspx
Reuters. 2016. https://www.reuters.com/article/us-zambia-drought-food/as-drought-hits-
zambian-harvests-food-prices-are-on-the-rise-idUSKCN11E0SC
Saka JDK, Sibale P, Thomas TS, Hachigonta S, Sibanda LM. 2013. Chapter 5: Malawi. In:
Hachigonta S, Nelson GC, Thomas TS, Sibanda LM, eds. Southern African agriculture
and climate change. Washington DC: IFPRI. p 111–146.
Schleussner, C.F., Lissner, T.K., Fischer, E.M., Wohland, J., Perrette, M., Golly, A., Rogelj,
J., Childers, K., Schewe, J., Frieler, K. and Mengel, M., 2016. Differential climate impacts
for policy-relevant limits to global warming: the case of 1.5 C and 2 C. Earth system
dynamics 7, 327-351.
Sitko N, Chamberlin J, 2015. The Anatomy of Medium-Scale Farm Growth in Zambia: What
are the Implications for the Future of Smallholder Agriculture? Land 4(3), 869-887.
doi:10.3390/land4030869
Sun, L., K.E. Kunkel, L.E. Stevens, A. Buddenberg, J.G. Dobson, and D.R. Easterling, 2015a.
Regional Surface Climate Conditions in CMIP3 and CMIP5 for the United States:
Differences, Similarities, and Implications for the U.S. National Climate Assessment.
NOAA Technical Report, NESDIS 144. 111 pp. DOI: 10.7289/V5RB72KG
Sun, Q., Miao, C. and Duan, Q., 2015b. Comparative analysis of CMIP3 and CMIP5 global
climate models for simulating the daily mean, maximum, and minimum temperatures and
daily precipitation over China. Journal of Geophysical Research: Atmospheres, 120(10),
pp.4806-4824.
Thomas, T. and M. Rosegrant. 2015. Climate change impact on key crops in Africa: Using
crop models and general equilibrium models to bound the prediction, In: Climate change
and food systems: global assessments and implications for food security and trade, Aziz
Elbehri (editor). Food Agriculture Organization of the United Nations (FAO), Rome,
2015. http://www.fao.org/3/a-i4332e.pdf

48
Thornton PK, Boone RB, J Ramirez-Villegas 2015. Climate change impacts on livestock.
CCAFS Working Paper no. 120. CGIAR Research Program on Climate Change,
Agriculture and Food Security (CCAFS). Copenhagen, Denmark. Available online at:
https://cgspace.cgiar.org/rest/bitstreams/54910/retrieve
Thornton PK, Cramer L, (editors) 2012. Impacts of climate change on the agricultural and
aquatic systems and natural resources within the CGIAR’s mandate. CCAFS Working
Paper 23. CGIAR Research Program on Climate Change, Agriculture and Food Security
(CCAFS). Copenhagen, Denmark. Available online at: www.ccafs.cgiar.org
Thornton PK, Jones PG, Ericksen PJ, Challinor AJ. 2011. Agriculture and food systems in
sub-Sharan Africa in a 4°C+ world. Philosophical Transactions of the Royal Society A
369: 117-136.
UN DESA. 2015. World Population Prospects: The 2015 Revision. New York, United
Nations Department of Economic and Social Affairs (UN DESA)
http://www.un.org/en/development/desa/news/population/2015-report.html
UNICEF. 2018. HIV and AIDS. New York, United States: United Nations Children’s Fund
(UNICEF) https://www.unicef.org/zambia/5109_8459.html
USAID. 2013. Malawi climate change vulnerability assessment. Washington DC, United
States: United States Agency for International Development (USAID). 102 pp.
USAID. 2016. Climate Change Risk Profile: Southern Africa. Regional Fact Sheet.
Washington DC, United States: United States Agency for International Development
(USAID) Available from
https://www.climatelinks.org/sites/default/files/asset/document/2016%20CRM%20Fact%2
0Sheet%20-%20Southern%20Africa.pdf. Accessed 4 June 2018.
USAID. 2017. Climate change risk profile: Malawi. Washington DC, United States: United
States Agency for International Development (USAID) Available online:
https://www.climatelinks.org/sites/default/files/asset/document/2017_USAID_Climate%2
0Change%20Risk%20profile%20-%20Malawi.pdf. Accessed 13 June 2018.
Wineman & Crawford. 2017. Climate change and crop choice in Zambia: A mathematical
programming approach. NJAS-Wageningen Journal of Life Sciences 81. Pp 19-31
World Bank. 2018a. Indicators. Washington DC, United States: World Bank Group.
https://data.worldbank.org/indicator
World Bank. 2018b. Poverty and equity brief: Zambia. April 2018. Washington DC: World
Bank Group.

The CGIAR Research Program on Climate Change, Agriculture and Food
Security (CCAFS) is a strategic initiative of CGIAR and Future Earth, led by the
International Center for Tropical Agriculture (CIAT). CCAFS is the world’s most
comprehensive global research program to examine and address the critical
interactions between climate change, agriculture and food security.
For more information, visit www.ccafs.cgiar.org
Titles in this Working Paper series aim to disseminate interim climate change,
agriculture and food security research and practices and stimulate feedback
from the scientific community.
Research supported by:
CCAFS is led by: Strategic partner: