Embed Size (px)
DESCRIPTION
Climate Change in Canada : The policy and politics. Matt Horne Director, Climate Change Program February 8, 2012. Overview. Background The federal government response The provincial government response Where does Canada go from here. Federal / Provincial Jurisdiction. - PowerPoint PPT Presentation
Citation preview

Climate Change in Canada: The policy and politics
Matt HorneDirector, Climate Change ProgramFebruary 8, 2012


Overview• Background
• The federal government response
• The provincial government response
• Where does Canada go from here

Federal / Provincial Jurisdiction

The economics of climate change• The costs of solving the problem are
real, but manageable (2 to 3% of GDP)
• The costs of inaction are steeper (5 to 25% of GDP without accounting for social/env costs)

Canada’s Greenhouse gas emissions (millions of
tonnes CO2e)
1990 1992 1994 1996 1998 2000 2002 2004 2006 2008 2010 -
100
200
300
400
500
600
700
800

Greenhouse gas emissions (millions tonnes CO2e in 2009)
Yukon, NWT & Nunavut
Prince Edward Island
Newfoundland
New Brunswick
Manitoba
Nova Scotia
British Columbia
Saskatchewan
Quebec
Ontario
Alberta
Canada
- 100 200 300 400 500 600 700 800

Greenhouse gas emissions
(change 1990 to 2009 in millions of tonnes)
Yukon, NWT & Nunavut
Prince Edward Island
Newfoundland
New Brunswick
Manitoba
Nova Scotia
British Columbia
Saskatchewan
Quebec
Ontario
Alberta
Canada
-20 - 20 40 60 80 100 120

The federal government response: inaction
Source: Nic Rivers, University of Ottawa
Some reasons/excuses for the inaction• Disconnect between problem and
solutions
• Lack of willingness to pay
• Lack of interest/belief in the problem
• The need to harmonize with the U.S.
• Opposition from provinces and industry

Provincial leadership filling the void
1990 1995 2000 2005 2010 2015 2020 -
50,000
100,000
150,000
200,000
250,000
Quebec
Ontario
B.C.

Targets starting to be backed by
policies• B.C.’s carbon tax and ban on coal-fired
generation
• Ontario’s feed-in-tariff and coal phase-out
• Quebec cap-and-trade
Different interpretations of provincial leadership• “A race to the top will help the
country”
• “The patchwork approach is inefficient”
• “Canadians can live with strong policies”
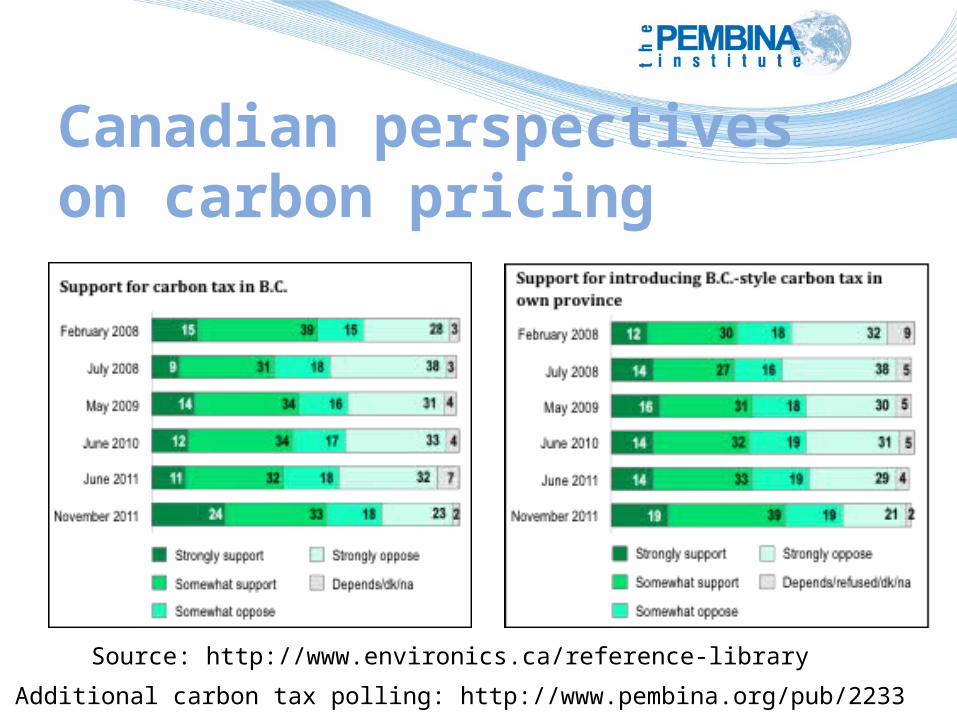
Canadian perspectives on carbon pricing
Source: http://www.environics.ca/reference-library
Additional carbon tax polling: http://www.pembina.org/pub/2233

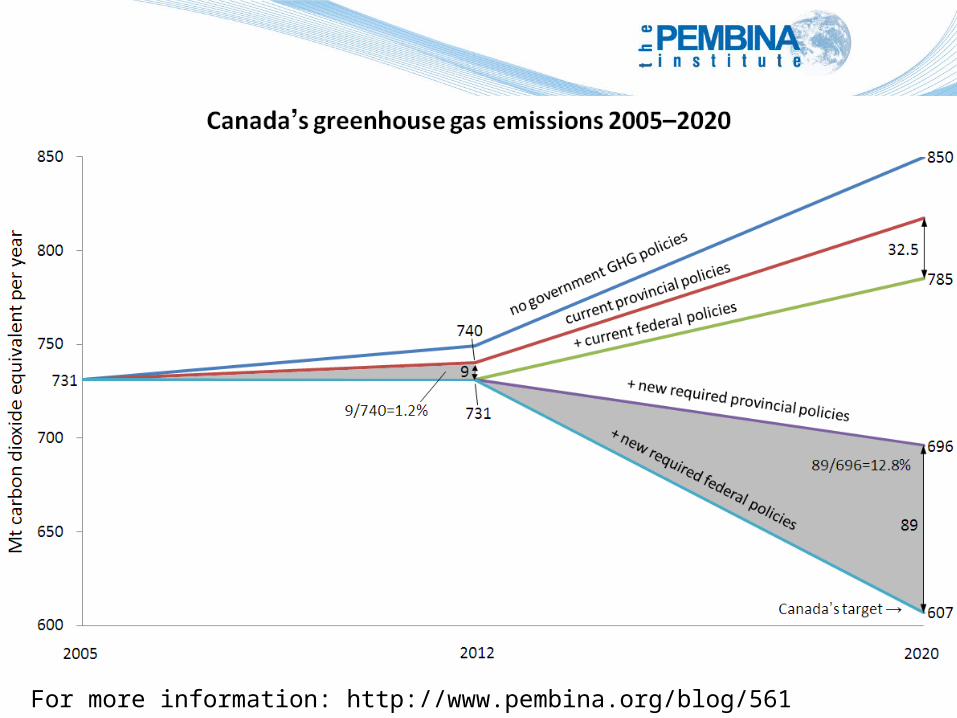
Where is Canada in 2012?• The positive steps we’ve seen shouldn’t
mask the scale of challenge still facing the country
• The level of national ambition is still inadequate
• The collective policy response still falls short of stated ambition
• Serious federal/provincial fault lines still exist

Details: http://www.unep.org/publications/contents/pub_details_search.asp?ID=6227
• The level of national ambition is still inadequate
• The collective policy response still falls short of stated ambition
• Serious federal/provincial fault lines still exist
For more information: http://www.pembina.org/blog/561

AB29%
ON30%
QC14%
SK7%
BC8%
NS3%
MB3%
NB3%
NL2%
AB34%
ON24%
QC12%
SK11%
BC9%
NS3%
MB3%
NB3%
NL1%
AB40%
ON24%
QC11%
SK9%
BC7%
NS3%
MB3%
NB2%
NL1%
Al-berta
Rest of Canada
1990 2009 2020 2050
An illustration of tension: Alberta’s projected emissions
Evidenced in debates about: pipeline proposals, low carbon fuel standards, a national energy strategy, a national climate policy

Where does Canada go from here?
• Will the province’s continue to advance policies?
• Will the federal government start taking serious action?
• Will tensions around oil exports increase?
• Will international pressure increase?
• Will Canadians make climate change an issue politicians can’t ignore?


Carbon pricing 101• Why price carbon:
• Our decisions about energy have not historically considered the resulting contribution to climate change
• The sources of the problem are widespread and not easily matched with command and control regulations
• Economic efficiency is maximized because emitters undertake the least expensive emission reductions
• Two main approaches to pricing carbon:• Carbon taxes• Cap-and-trade systems

Carbon pricing 101• Some questions to enable an apples-to-
apples comparison between approaches: • What is the price and how does it get set?
The higher the price, the stronger the incentive to reduce emissions.
• How broadly is the price applied?The broader the coverage, the more opportunities to
encourage reductions.
• What are the potential problems/loopholes?Loopholes undermine effectiveness and public support.
• How much revenue is raised and how is it used?No magic formula, but revenue is an important tool for
dealing with equity concerns and making investments in projects that reduce emissions.

Carbon pricing 101Carbon tax Cap-and-trade
Setting the price Set by government Combination of number of allowances, offsets, price floors and ceilings
Setting the coverage Up to about 80% of Canadian emissions
Direct coverage up to about 80% with remaining 20% potentially through offsets
Potential problems Gaps in coverage and different rates
Gaps in coverage, low-quality offsets, over allocation, free allocation
Determining revenue raised by government
Tax rate multiplied by emissions covered by tax
Depends on how allowances are distributed and how many offsets are allowed
Revenue uses Determined by government Determined by government
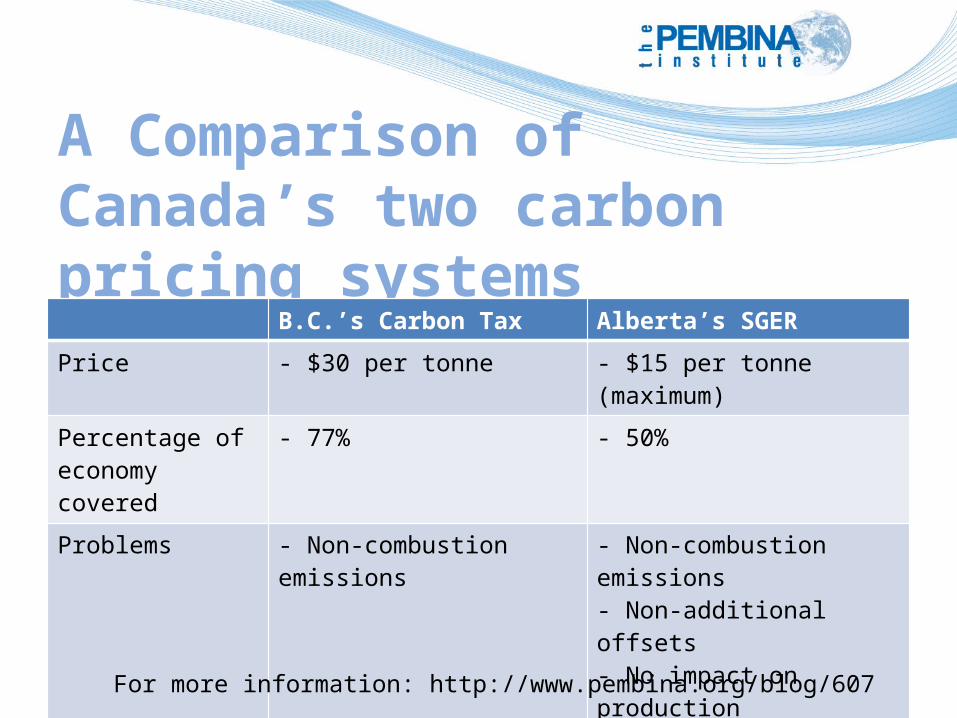
A Comparison of Canada’s two carbon pricing systems
B.C.’s Carbon Tax Alberta’s SGER
Price - $30 per tonne - $15 per tonne (maximum)
Percentage of economy covered
- 77% - 50%
Problems - Non-combustion emissions - Non-combustion emissions- Non-additional offsets- No impact on production
Revenue - $1.2 billion per year for tax cuts and low-income tax credits
- $74 million per year for GHG reduction projects
For more information: http://www.pembina.org/blog/607